Article

The Development of a Transdisciplinary Framework to Overcome Energy Efficiency Barriers in Shipbuilding: A Case Study for an Iranian Shipyard

by
Seyed Vahid Vakili
*,
Aykut I. Ölçer
and
Alessandro Schönborn
Maritime Energy Management (MEM), World Maritime University (WMU), 211 18 Malmö, Sweden
*
Author to whom correspondence should be addressed.
J. Mar. Sci. Eng. 2021, 9(10), 1113; https://doi.org/10.3390/jmse9101113
Submission received: 22 September 2021 / Revised: 29 September 2021 / Accepted: 11 October 2021 / Published: 13 October 2021
(This article belongs to the Special Issue Subsea System Design)

Abstract

:
Through a systematic literature review and a holistic perspective, the study proposes a conceptual transdisciplinary framework to overcome energy efficiency barriers during the shipbuilding phase. The process of the proposed transdisciplinary framework consists of five steps of “goal formation”, “system analyzing”, “scenario construction”, “multi-criteria decision making assessment” and “strategy building” to identify and rank the energy efficiency barriers during ship construction based on decision makers’ priorities. The framework categorizes the barriers into five disciplines—operations, policies and regulations, technology and innovation, the human elements, and economics—and the framework is applied to an Iranian shipyard. The results show that the economic barriers have the greatest impact, while the human barriers have the least impact on the shipyard’s energy performance. Due to the generalized structure of the framework, it categorizes not only energy efficiency barriers according to the importance and priorities of stakeholders in the shipbuilding industry, but can also be applied to other phases of the ship life cycle and even to other industries. By applying the framework, decision-makers can make rational and optimal decisions to be able to invest in energy efficiency measures based on their priorities.

1. Introduction

Industry contributes to 24% of global greenhouse gas emissions (GHG) and is responsible for approximately one third of the world’s energy consumption [1]. To meet the UN Sustainable Development Goals (SDGs), industrial emissions must be reduced by 1.2% per year, from 8.5 gigatons (Gt) in 2018 to 7.4 Gt of CO2 in 2030 [1]. To achieve this goal, improving energy efficiency is crucial. Energy efficiency plays a key role in energy security and climate change, and is at the heart of solutions to reduce CO2 emissions, tackle climate change [2,3], and increase energy productivity and business competitiveness [4,5].
The transport sector as a whole contributes to 36% of energy consumption in 2017 [6] and the maritime sector, which transports 80% of the world’s freight volume [7], contributes to 2.89% of global emissions [8]. It is predicted that the related emissions from shipping will increase by 50% compared to 2018 levels by 2050 [8]. The IMO, which regulates international shipping, has proposed multidisciplinary measures to improve energy efficiency and thereby reduce GHG emissions. The Energy Efficiency Design Index (EEDI) and the Energy Efficiency Existing Ship Index (EEXI) are technical measures, while the Enhanced Ship Energy Efficiency Management Plan (ESEEMP)1 is an operational measure. In addition, with the introduction of the European Emissions Trading Scheme (ETS) in the maritime cluster, the IMO has been pressed to adopt market-based measures.
Studies and research about improving energy efficiency and related barriers in ships have been conducted in other sectors. However, the associated regulations, actions and studies are focused on the operation cycle of the ships, and less attention is paid to improving energy efficiency in the other cycles of ships’ life-cycles, which are construction, maintenance and dismantling. Shipbuilding, as one of the vital global industries, is a significant energy-consuming and polluting industry that produces a substantial CO2 emissions (4% of ships’ life cycle emission), as well as air pollutants such as CO (29% of ships’ life-cycle emission) [9]. This means that the total amount of the ships’ life cycle CO2 emissions that occur in the building, maintenance and dismantling stages is higher than the ports’ contribution, being responsible for approximately 2% [10] of operational CO2 emissions. Due to motivation in using zero-carbon fuels, electricity and sail and solar power, the fraction of shipyard operations in a ship’s life cycle might become larger than their operational phase, e.g., if a car ferry is being propelled by batteries and using electricity from the Norwegian electricity grid, its construction will have a more significant life-cycle climate impact than its operation cycle [11].
Currently, the problem is that energy efficiency measures are not always implemented, as there are a number of barriers that prevent implementation. Most commonly, economic researchers consider market failures (imperfections), such as incomplete information, client-contractor relationships, adverse selection and split incentives [12,13,14], to be barriers to improving energy efficiency. However, non-economic researchers strive to identify other types of barriers by considering different perspectives. Based on these perspectives, different solutions have been proposed. To improve energy efficiency in the shipping cluster, more attention is paid to technology [15] and operational measures [16]. Therefore, safety and reliability, technical uncertainty, behavior, market constraints, financial and economic constraints and complexity [17] are identified as types of barriers in the ship operation cycle. However, to the authors’ knowledge, there are no studies that identify the barriers to energy efficiency in shipping in the context of the ship construction and maintenance phases of the life cycle.
In addition to the lack of studies that consider energy efficiency during the operational and manufacturing cycles of the vessel, barriers are treated as solitary and, if they are part of a group, their relationship and interaction is ignored. In order to support sustainable shipping and sustainable energy efficiency improvement in the shipping cluster, a holistic, systematic and transdisciplinary approach from a life cycle perspective must be considered. This approach identifies the relationship and interaction of barriers with each other, different stakeholders and policy measures [18,19].
This contributes to the development of a holistic, systematic and interdisciplinary conceptual framework to address barriers to energy efficiency in shipping clusters and within manufacturing cycles. To design and develop such a framework, it is important to review related papers on energy efficiency barriers in different industries and maritime operations. In the absence of attention to the relationship and interplay between barriers to energy efficiency and the life cycle perspective within the shipping cluster, this study has paid particular attention to how barriers interact across disciplines in the manufacturing life cycle.
In light of the above, this study aims to provide a framework for identifying barriers to energy efficiency in the shipbuilding industry and overcoming them from a life-cycle perspective within the maritime cluster. The framework is holistic, systematic and transdisciplinary and takes into account the interrelationship and interaction between different types of barriers. Developing such a framework and implementing it during the construction phase has the potential to improve energy efficiency and reduce the carbon footprint of the shipbuilding industry, and also has the same effect on reducing emissions in the life cycle perspective of offshore and subsea projects. Offshore and subsea projects play a key role in countries’ blue economic growth. However, deepwater projects are a challenging activity and such projects require appropriate logistical support from onshore facilities [20]. Specialized vessel types, such as diving vessels, DP vessels, jack-up barges, cable and pipe-laying vessels and PSVs, improve the efficiency and effectiveness of offshore operations, and these specialized vessels, as well as offshore platforms and infrastructure, are built at shipyards, which have an important role in supporting the projects [21].
By implementing the framework within the organization, decision makers (DMs) will be able to have a transparent view of the energy barriers in their organization. In this way, managers and DMs can adopt appropriate energy strategies and policies to overcome these barriers. The flexibility of the framework means that it is generic and can be applied to all other sectors and organizations. To validate the proposed framework, a case study was conducted at an Iranian shipyard which is active in ship repair and conversion and offshore infrastructure construction.
In light of the above, Section 2 discusses, through a systematic literature review, various barriers to energy efficiency with different categorizations in both different industries and the ship construction cycle. Section 3 explains the methods and methodology, i.e., a systematic literature review and systematic and transdisciplinary approaches. Section 4 presents the results of the case studies and the related discussion. Finally, Section 5 draws the conclusion.

2. Literature Review

Since the oil crisis, energy efficiency and the related gap between potential energy efficiency and actual energy efficiency has become an important topic for both policy makers and end-users. Although industry considers energy as a vital resource, the demand for energy efficiency measures and technologies depends on the marginal cost of both energy and energy efficiency measures due to its inelasticity [22,23]. Removing these barriers will reduce the discount rate and the risk of energy efficiency [24,25] and increase the enthusiasm for energy efficiency investments.
The gap in energy efficiency is due to the existence of barriers, and one of the most important factors is the cost-effectiveness of the technology [26,27,28]. Barriers are mechanisms that prevent investment in technologies that are both energy and economically efficient [12,29]. Barriers prevent cost-effective energy measures from always being used, and the inconsistency between optimal implementation and real-time implementation is called the “energy efficiency gap” [30,31].
Blumstein et al. [32] conducted one of the first studies to systematically classify barriers to energy efficiency into six categories: misplaced incentives, lack of information, regulation, market structure, financing and adaptation. According to Hirst and Brown [33], barriers are divided into structural barriers (beyond the control of the individual) and behavioral barriers (dependent on end-user decision-making). Fuel price distortion, fuel price uncertainty, limited access to capital, government fiscal and regulatory policies, codes and standards, and infrastructure provision are classified as structural barriers, and attitudes towards energy efficiency, perceived risk of energy efficiency in investment, information gaps and misplaced incentives are classified as behavioral barriers [33]. Howarth and Andersson [34] examined the theory of the energy-using equipment market to show that incomplete information and transaction costs can affect rational consumers and they noted a lack of information, principal-agent problems, consumer uncertainty, and lack of access to credit to be barriers in the energy-using equipment market. Eyre [35] conducted psychological, social and institutional analyses and classified barriers as information barriers, cost-benefit separation problems, barriers to accessing capital, tariff barriers, externalities and limited rationality.
In addition, in the Third Assessment Report (2001), the Intergovernmental Panel on Climate Change (IPCC) classified the sectors and technological barriers to reducing greenhouse gas emissions into eight categories, namely technological innovation, prices, finance, trade and environment, market structure, institutional framework, information provision, and social, cultural and behavioral norms and standards. While Weber [36] categorized the barriers into institutional, market, organizational and behavioral barriers, Fleiter et al. [37] introduced twelve different characteristics of energy efficiency measures from the areas of relative advantage, technical context and information context. In addition, there are different types of methods for empirical studies, e.g., Thollander and Palm [38] classified and described different barriers that may not fully explain the existence of the “energy efficiency gap” as follows: distortions in energy prices, different perspectives on energy, government fiscal and regulatory policies, constraints in the supply infrastructure, codes and standards, and structure.
The energy efficiency gap arises mainly from market failures. Market failure means that the market does not have the characteristics of the perfect market [13,39]. According to Adam Smith’s theory, cited in [40], the four types of market failures are imperfect markets, imperfect competition, imperfect information and asymmetric information. Market failures are the main barriers preventing the introduction of energy efficient technologies and related investments [41] and may lead to public intervention [12,42,43,44]. However, Backlund et al. [45] distinguish between market failure and barriers, as they consider market failure to be any deviation from the characteristics of the perfect market, while barriers are broader and include economic, organizational and behavioral barriers.

2.1. The Economic Perspective

2.1.1. Market Failure Barriers

Information problems are one of the most critical barriers to market failure. While Gillingham et al. [13] and Chai and Yeo [46] classified the information problems as information deficiency, asymmetric information and principal-agent, Cagno et al. [47] consider asymmetric information as an incomplete information problem that leads to the following additional barriers: split incentives, adverse selection and principal-agent relationships.
The lack of information on the energy efficiency of measures and technologies has a negative impact on industry decision support systems (DSS) [48]. Since investments in energy efficiency measures in industries (especially energy-intensive industries) are rare and are due to rapid technological development and change [49,50], as well as due to the difficulty of quantifying and measuring energy savings [51,52], distortion of decision-making in the selection of appropriate measures and technologies can lead to a more serious problem.
Asymmetric information is a particular form of incomplete information and occurs when the parties involved in the transaction have different levels of information [53,54] and can lead to inappropriate energy efficiency decisions. Asymmetric information leads to split incentives, adverse selection and principal-agent relationships [55].
Divided incentives are related to the fair distribution of investor benefits from energy efficiency investments [56,57], e.g., one department in a company may not be responsible for energy use [58]. In addition, a typical case in industry may be that managers who have only a short period of employment are reluctant and hesitant to invest in projects, measures and technologies with a long payback period [59]. However, by considering and emphasizing the life-cycle costs of investments, greater energy savings and benefits can be achieved.
Negative selection occurs when the buyer does not have sufficient information about the quality, efficiency and effectiveness of the technology and measure [60,61]. Since energy efficiency characteristics are not tangible and sensitive, most industrial decision-makers pay more attention to other factors, such as the original price and visible aspects, such as color and design [62]. This type of approach leads to a negative selection of the required technologies and measures.
The principal–agent relationship arises when principals do not have sufficient knowledge, experience and training to strictly monitor the energy efficient activities of the agent. This type of approach can lead to energy efficiency measures being overlooked [63]. For example, the principal–agent relationship was found to have a negative impact on the energy efficiency of passenger cars in the Netherlands [64].

2.1.2. Non Market Failure Barriers

The barriers that are not linked to market failures are categorized as hidden costs, capital costs, risks and heterogeneity.
Hidden costs are those costs that are usually overlooked when accounting for the benefits associated with energy efficient technologies [65,66]. The hidden cost includes overhead costs related to investments, data collection and analysis, and production disruptions [67].
Access to capital costs is one of the most important barriers to non-market failure. However, according to Golove and Eto [68], it is better to classify this as an information problem, because access to capital costs is a factor that examines the creditworthiness and feasibility study of a project. If an energy efficiency project has a high rate of return due to the high risk, it is an increased risk to implement the projects. Many consumers have access to capital only at costs above the average return on capital in the economy [37,69] and this poses a major challenge for SMEs, low-income consumers and end-users [70,71].
Risks can prevent the adoption of energy efficient measures and the use of energy efficient technologies. Risks fall into three categories: technical risks, business risks and external risks [72,73]. Taking into account the high discount rate and rejecting a certain type of technology or measure may justify rational action in view of the risks [74,75].
Heterogeneity is about the fact that even some cost-effective energy-efficient technologies may not be suitable for certain industries or regions [76]. This type of barrier is more common for industries and firms that have a particular or single type of production, or for technologies that have limitations due to temperature or pollution [38,77].

2.2. The Behavioral Perspective

In addition to economic barriers, behavioral barriers can increase the energy efficiency gap. These barriers are classified in terms of information, credibility and trust, values, inertia and limited rationality [78], and are discussed below.
Information plays a crucial role in reducing the energy efficiency gap. Information must be personal, specific, vivid, clear and simple, and provided in a timely manner [79]. Credibility and trust in the provider of the information are crucial to closing the energy efficiency gap. If the industrial user cannot access appropriate information on energy and cost efficient technologies, they may approach the most accessible and credible types of information [80].
Norms and habits lead to behavior and behavior shapes values. Norms, habits and values are very closely related to culture [81]. If values, such as support for others and environmental awareness, are highlighted in the group, it will influence individuals to take energy efficiency measures [82]. However, these values and mindsets need to be translated into everyday behavior and practices to promote culture.
Inertia represents the combination of the effect of treating gains differently from losses, giving greater weight to specific outcomes compared to uncertain outcomes, and reducing regret [83,84]. Habits and routines shape the behavior of individuals and organizations [85,86] and it is usually difficult to change behavior because individuals strive to prevent changes in the environment [87]. If the behavior and culture of the group has an environmental commitment, there is less inertia in using energy-efficient technologies and implementation takes less time and costs less [38,88]. Limited rationality is another barrier that can increase the gap in energy efficiency. Policy makers are surrounded by many constraints, such as time and information resource constraints, leading them to replace imprecise decisions and rules of thumb with optimized decisions [89]. Due to the conflicting interests and goals of individuals, DMs find themselves in a complicated situation of optimizing decisions to get the lowest price, but with the highest efficiency and effectiveness [90,91].

2.3. The Organization Perspective

Companies and firms are composed of different individuals and departments that have different cultures, priorities, interests and cross-sector interaction and integration [65,73]. As explained when discussing the constraints on bounded rationality, optimized decision making in such an ambiguous situation becomes complicated. It is important to note that the organizational formation can lead to barriers to the adoption of energy efficient technologies. The related barriers are categorized into power and culture.
In terms of power, it is due to the lack of resources and different interests between different departments within the company that there is a hidden conflict on how to achieve and use the limited resource. Based on the structure, perception and priorities of the company, managers have different levels of power. If the company’s energy manager has a low status, energy measures and related efficient measures may be given low priority accordingly [52].
Culture is formed by norms, knowledge and ideology and is closely related to values [92]. Developing organizational culture by raising awareness of environmental issues, related problems and solutions can promote energy efficiency within the company [93]. Moreover, it can justify the failure to introduce energy efficient technologies [94].

2.4. Energy Efficiency Gap and Energy Policies

Since the energy system is a socio-technical system [95], not only the technology, but also the environment, such as behaviors, regulations, organizations and individuals, are crucial to the development of the system, which leads policy makers to understand industrial energy efficiency to be a multidimensional subject [96]. To improve energy efficiency, it is important to take a multi-faceted view of the barriers to energy efficiency and to consider policy measures to address both market failures and barriers. This type of approach leads to the classification of barriers into different areas, such as policy, management, financing and information. Some other studies seek to rank barriers based on the area in which the study is conducted, but the validity and importance of barriers in this type of study is limited to the location and time in which the study is conducted [46].
To overcome the barriers to energy efficiency, the European Commission proposed white certificates, voluntary agreement (VA) and long-term agreement (LTA) programs, financial support programs, and promotion of the energy services market [97]. The main objective of the measures is to provide funds to support energy efficiency measures and programs and to increase the demand for energy efficient technologies by raising the price of energy. However, similar to the carbon leakage phenomenon [98], an increase in the price of energy may lead to a relocation of activities to areas with lower energy prices [99]. In addition to the above measures, education and information programs, such as energy labelling [100], energy audits [101], energy management systems [102] and training and certification of energy managers, are being implemented in order to raise awareness [103].

Energy Management System

Energy contributes to the socio-technical system and the environment influences the development of the system [104]. To address the problems of energy efficiency, a systematic approach must be considered. This means considering different perspectives and angles to address the barriers [105]. Energy conservation is a necessary measure for addressing the barriers, and plays a crucial role in preventing the energy gap from widening [44,106].
Although less attention has been paid to holistic and systematic analysis and interconnectedness of barriers to energy efficiency, energy management aims to improve energy efficiency in industry by analyzing how barriers are interconnected, interlinked and interact. It also involves the design, development and implementation of long-term strategies by a committed and educated energy manager [107,108].
Nagesha and Balachandra [109] suggested that barriers may have multiple structural levels. Interpretive structural modeling (ISM) is a type of decision-making framework used in energy conservation to identify and rank the barriers to energy efficiency and analyze the interactions between them [110,111]. In the paper “Barriers to energy efficiency improvement and decision-making behavior in Thai industry”, a decision-making framework for energy efficiency investment is proposed [112], while the Motivation, Capability, Implementation and Result (MCIR) framework was proposed by Chai and Yeo [46] to overcome barriers to energy efficiency through a systems approach. Cagno et al. [47] considered external and internal barriers and the actors affected by the barriers. They aimed to overcome and determine the overlap between barriers, the impact of barriers on firms’ decision-making, implicit responses and the relationship between barriers. Prashar, [113] by implementing a PDCA (Plan, Do Check, Act) cycle, encouraged a continuous investigation of energy saving opportunities and associated energy saving activities (ESAs) to promote energy optimization, and by developing a management energy efficiency maturity (EEM) framework, promoted a systematic and continuous integration of energy efficiency practices.

3. Methodology

There is a lack of studies that address a systematic approach to removing barriers to improving energy efficiency in the maritime cluster. In disciplines where established methodologies and research are lacking, the development of frameworks and conceptual designs are more useful, efficient and effective than robust and rigorous models [114,115]. The validity of the proposed conceptual framework can be supported by mathematical methods.
Figure 1 shows the research design and sequences of the study. First, a systematic literature review was conducted from journals, conference proceedings, industry and company reports in different sectors and the maritime business cycle. Barriers to energy efficiency improvement from different industries and sectors were listed. In the second phase, various energy barriers from the list (the list created in the previous phase) were analyzed and the barriers related to energy efficiency improvement in the shipbuilding industry were identified. In order to overcome the energy barriers, it is important to take into account the surrounding characteristics of the energy sector. Therefore, in the third phase of the study, the authors conducted an extensive literature review and identified and classified the most important and crucial disciplines for solving the energy efficiency problems in shipbuilding into five main disciplines, namely, operations, policy and legislation, technology and innovation, human factors (consisting of behavioral and organizational systems) and economics. The barriers (from the list in phase two) were categorized under these five disciplines (see Figure 2).
In order to reduce the energy gap, overcome the problem and prioritize the barriers within the five disciplines, four2 criteria were selected: how severe the barriers are, how easy it is to remove the barriers and how much impact they have on energy efficiency and economic performance. However, it is important to note that the barriers within the categorized framework are interlinked, interrelated and interact with each other. In the last step, the interactions between the barriers from different disciplines have been clarified using two3 multi-criteria decision making (MCDM)4 methods, namely, fuzzy analytical hierarchy process (FAHP) and fuzzy multiple attribute group decision making technique (FMAGDM)5. The framework helps managers in a fuzzy atmosphere to identify and rank the barriers according to their preferences through a transdisciplinary approach and to make rational investment decisions to improve the energy efficiency of their portfolio.

3.1. Systematic Literature Review

As part of step one of this research, a total of 1142 works were collected that concerned the energy sector and related barriers to energy efficiency in different clusters. A title screening excluded 369 duplicated and unrelated studies. Furthermore, the abstracts and conclusions of the articles were reviewed and 583 academic articles that did not discuss the topic of the review and those with a weak context were excluded. The filtered academic articles, i.e., 190, were carefully read and, after excluding articles with repeated findings, the barriers were categorized into different disciplines, as shown in Figure 2. As a result, the five disciplines became the corners and pillars of the “diamond”, as a new and holistic form of barriers to energy efficiency in construction phase of ships (see Figure 2).

3.2. The Systematic and Transdisciplinary Approach to Solve the Problem

Systematic and the transdisciplinary approaches have been used to develop the proposed framework. The systematic approach is helpful in addressing large, complex and transdisciplinary issues, and it promotes a shift from linear to circular thinking [116]. A systematic approach involves looking at problems from different perspectives [117] and defining a boundary for the system to identify its components [118,119]. In addition, the relationships and interactions between the system components should be emphasized.
There are various methods, perspectives and theories that are used to analyze the energy system and solve related problems, but it is important to synthesize the technology through an interdisciplinary approach in a life cycle perspective to explore the relationship and interaction between the barriers and different stakeholders [18,19]. Energy system is a socio-technical system. This means that in order to solve energy problems, not only the technical solution and technology are important, but also the environment, e.g., the human factor, social aspects, activities, policies and legislation, economic and financial factors must be considered, and, instead of one-dimensional thinking, the interdisciplinary approach must be taken into account [106]. Multidisciplinary and transdisciplinary are two levels of interdisciplinarity [120,121,122]. While interdisciplinary researchers cling to their languages, concepts and mythologies, transdisciplinary researchers integrate methods, approaches, concepts and languages and create a new language, method and concept to solve the problem [123,124]. A transdisciplinary approach allows the researcher to break through silos and cross the boundaries between disciplines [125,126].

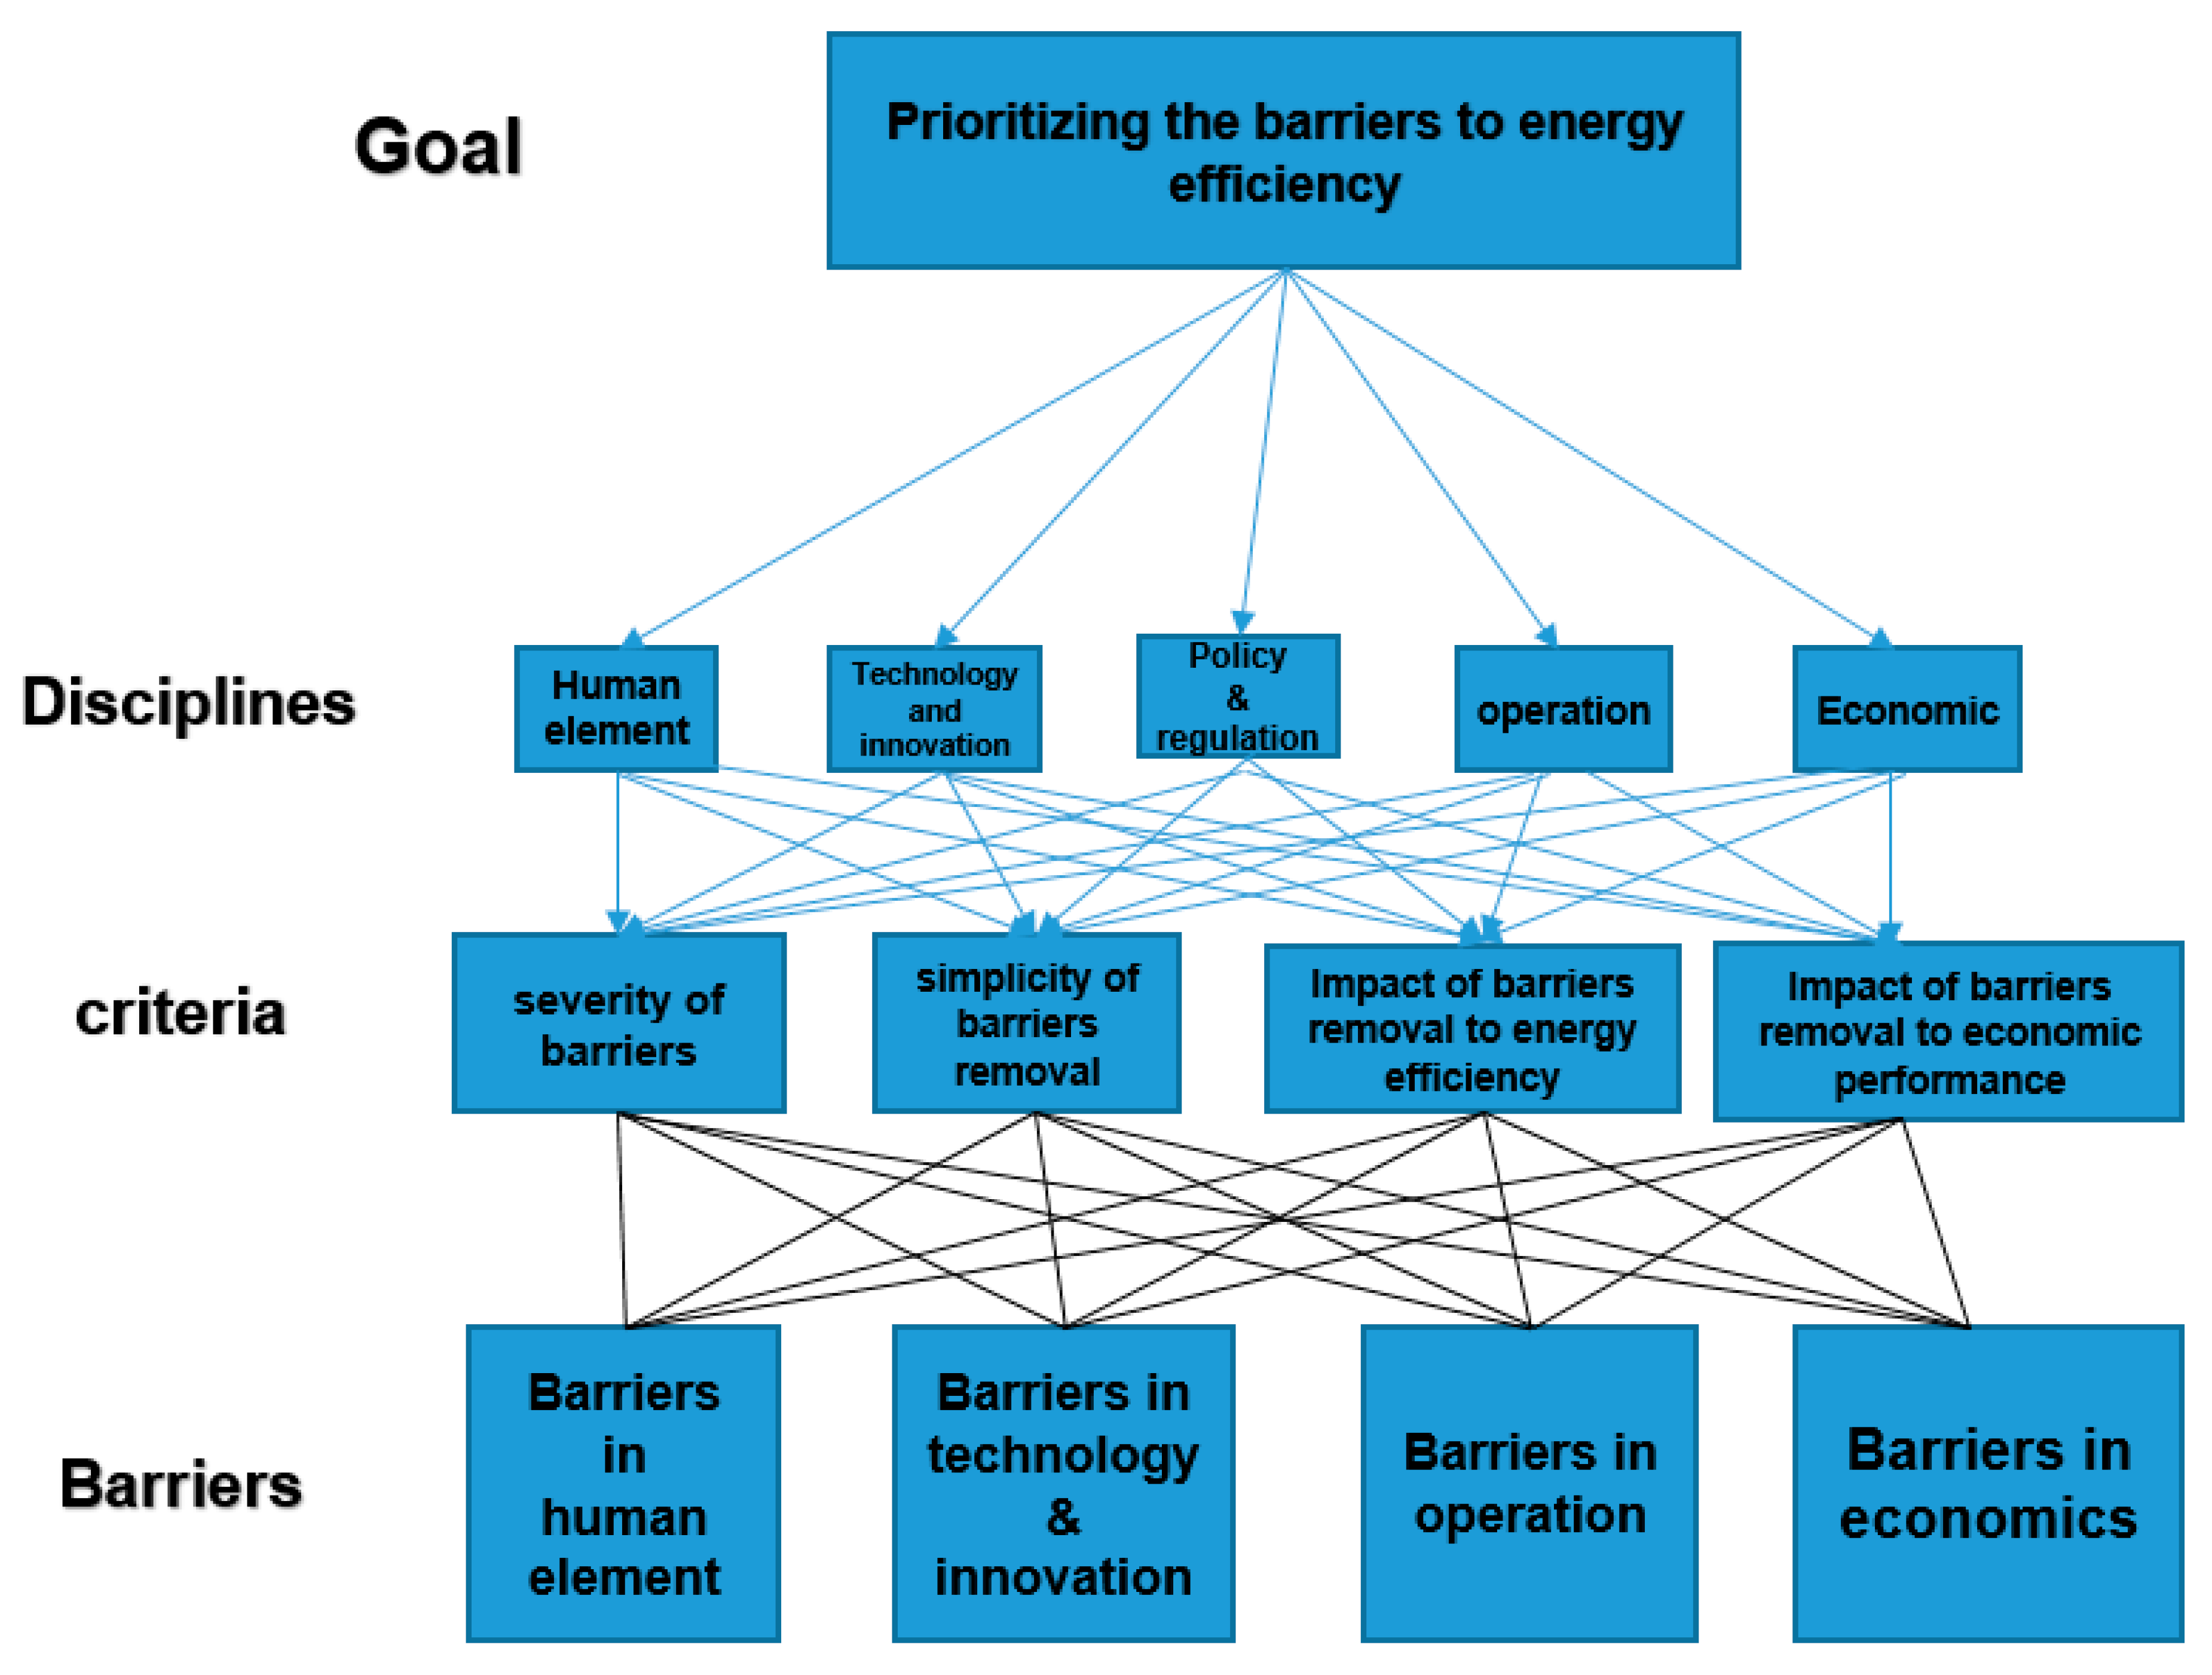
3.3. Develop a Holistic, Systematic and Interdisciplinary Framework

A conceptual holistic, systematic and transdisciplinary framework is proposed, based on DMs’ priorities and on the feedback process. Figure 3 shows the process of identifying and ranking the energy efficiency barriers based on the DMs’ preferences, which consist of five key steps, namely “goal formation”, “system analyzing”, “scenario construction”, “multi-criteria decision making (MCDM) assessment” and “strategy formation”.
The framework starts with “goal formation”. At this stage, based on the priorities and interests of the decision makers in terms of energy efficiency measures, the barriers are classified into five disciplines. However, depending on stakeholders’ interests, the disciplines may change.
In the second step, “system analysis”, the importance of the disciplines will be determined using the FAHP method on the basis of the priorities of the DMs.
“Scenario construction” is the third step in the creation of the framework, where DMs, using the FAHP, determine the importance of the criteria based on their preferences. Here, the question is whether the four criteria have the same importance across the five disciplines. If the criteria have different importance in each discipline, the DMs can create a matrix of comparison weights for each criterion in each discipline.
The fourth step is the “MCDM assessment”. In this step, by referring to the results of steps two and three and using fuzzy multiple attribute group decision making (FMAGDM), the DMs can rank the barriers with respect to criteria in each discipline.
“Strategy building” is the final step in the framework. Based on the results of the previous step, managers have a better understanding of the types of barriers and their importance from different perspectives. There is no silver bullet for overcoming energy efficiency [133]. The results of the framework help administrations to make rational decisions on the selection and adoption of energy efficiency measures and to trade-off between different solutions, as well as to select and design appropriate energy efficiency policies. The framework is supported by the PDCA cycle to make the framework dynamic so that it can be updated with new technologies and DMs’ priorities.

3.3.1. Fuzzy Analytical Hierarchy Process (FAHP)

As discussed in Section 3 and shown in Figure 3, the FAHP method was used to determine the weight of main disciplines and criteria. Triangular fuzzy number (TFN) demonstrates by three numbers of A = ( a , b , c ); as a, b and c are lowest potential value, higher potential value and the highest potential number of fuzzy number ñ respectively. A is a triangular fuzzy number, where a b   c , has the following function [134];
μ ñ ( A ) ( X ) = { 0 X < a X a b a a   X     b c X c b b X   c 0 X > c
The geometric mean technique [135] was used to calculate the fuzzy weights in this study. While Ƒ i = g e o m e t r i c   m e a n   o f   t h e   i th row, and Ꞷi = fuzzy weight of the i th event;
Ƒ = ( ñ i , 1     ñ i , 2       ñ i , n )   1 / n =   (( a   i , 1 X   a   i , 2   X   a   i , 3     X   a   i , n )   1 / n , (( b   i , 1 X   b   i , 2   X   b ,   i 3     X   b   i , n )   1 / n ,   ( c   i , 1   X   c   i , 2   X   c   i , 3     X   c   i , n )   1 / n )
i = Ƒ i Ƒ 1 Ƒ 2 . Ƒ n
After determining the fuzzy (weights) for disciplines and criteria (Ꞷi), the geometric mean method was used to obtain the defuzzified (DF) mean of the weights [136]:
DF   i = [ ( c i a i ) + ( b i a i ) ] 3 + a i
Then   Wi = DF   i DF i

3.3.2. Fuzzy Multiple Attribute Group Decision Making (FMAGDM)

The fuzzy TOPSIS (FTOPSIS) method was used to handle FMAGDM. The fuzzy TOPSIS method is a suitable method for solving group decision problems [137]. To rank the alternatives, the method determines the distances to both the fuzzy positive-ideal solution (FPIS) and the fuzzy negative-ideal solution (FNIS) simultaneously [138].
Assuming that each discipline has K alternatives, the weight of each criterion and the score of the alternatives with respect to each criterion can be calculated as follows:
Ծ j = 1   K   [   Ծ j   1   ( + )   Ծ j   2   ( + )   · · · ( + )   Ծ j   K   ]
j = 1   K   [   j   1   ( + )   j   2   ( + )   · · · ( + )   j   K   ]
where Ծ ij K and Ꞷj K are the rating and the importance weight of the Kth decision maker. However, in this study Ꞷj K, the weight for the main disciplines and criteria were achieved through the FAHP method (see Section 3.3.1). Continuing on from this, a fuzzy multi-criteria group decision-making problem matrix can be as follows:
AlternativesCriteria (Attributes)
C1C2Cm
A1 Ծ 11 Ծ 12 Ծ 1m
A2 Ծ 12 Ծ 22 Ծ 2m
.....
…......
An Ծ n1….….…. Ծ nm
Ꞷ1Ꞷ2….….Ꞷn
where Ծ ij, ∀i; j and Ꞷj, j = 1,2,…, n are linguistic variables, which can be described by triangular fuzzy numbers, Ծ ij = ( a ij, b ij, c ij), and Ꞷj = (Ꞷj1, Ꞷj2, Ꞷj3). The linear scale transformation was used to transform the various criteria scales into a comparable scale. Therefore, the normalized fuzzy decision matrix Ŕ was achieved by:
Ŕ = [ŕij]m×n,
where B   a n d   C   are the set of benefit criteria and cost criteria, respectively, and
ŕ ij = ( a i j c j * ,   b i j c j * ,   c i j c j * ) ,   j   B ; ŕ ij = ( a j c i j ,   a j b i j ,   a j a i j ) ,   j     C ; c j * = M a x   c ij   if   j   B ; a j = M i n   a ij   if   j C .
By considering the different importance of each criterion, the authors could construct the weighted normalized fuzzy decision matrix as:
Ṽ = [ṽij]mxn, i = 1 , 2 , ,   m ,   j = 1 , 2 , ,   n (8), where ṽij= ŕij (.) Ꞷj.
The fuzzy positive ideal solution (FPIS, A * ) and fuzzy negative ideal solution (FNIS, A ) are: A * = ( * 1, * 2, …, * n ), and A = ( 1, 2, …, n), where * j = (1,1,1) and j = (0,0,0), j = 1,2,…,n. The distance of alternatives from FPIS and FNIS are calculated as follows:
d i * = j = 1 n d ( ij ,   * i )           i = 1 , 2 , , m
d i = j = 1 n d ( ij ,   j )           i = 1 , 2 , , m
The closeness coefficient of each alternative to determine the ranking order of the alternatives is calculated by:
C C i = d i d i * + d i ,                   i = 1 , 2 , , m    
Figure 4 shows the hierarchical prioritizing of the barriers to energy efficiency by AHP for a shipyard.

4. Results and Discussions

4.1. Case Study

To prove that the framework works, interviews were conducted with five senior managers (DMs) at an Iranian ship repair yard and an offshore infrastructure builder (ISY). The interviewees had five main responsibilities for energy aspects in the shipyard. ISY is an active ship repair yard in Iran and builds many offshore and subsea infrastructures. Figure 3 shows the implementation of the framework for ISY. All steps and sequences have been summarized and the results are presented in Table 1, Table 2, Table 3 and Table 4.

4.1.1. Goal Formation

The taxonomy developed in the study is shown in Figure 2. The barriers were classified into five disciplines for ISY. These are: human factors, operations, technology and innovation, policy and regulation, and economics.

4.1.2. System analysis

Table 1 shows ISY’s priorities with respect to five main disciplines. In the second step of “system analyzing”, the weight of the disciplines for the case yard was determined based on the prioritized disciplines by applying the FAHP. For calculating the determined weight of each discipline, Equations (1)–(4) were used (see Section 3.3.1). As shown in Table 1, finance (0.560) was the most important discipline for ISY, and technology and innovation (0.144) was the second highest priority for ISY. Policies and regulations (0.125) were identified as the third highest priority of the company and the human factor (0.031) was identified as the least important discipline for the yard in the present case. There was a serious imbalance between the disciplines. Interestingly, the importance of the first priority (economics) in the ISY was 18 times higher than the least priority (human element) in the ISY.

4.1.3. Scenario Construction

Scenario construction was the third step in the implementation of the framework. At this stage, four criteria were introduced: the severity of the barriers, the ease of removing the barriers, the impact of the barriers on energy efficiency and the economic performance. The aim here was to see whether the four criteria have the same importance across the five disciplines. If the criteria have different importance in each discipline, the managers can create a matrix of comparison weights for each criterion in each discipline. Interviewees were asked which criterion is most important to them in overcoming the barriers. The FAHP method (Equations (1)–(4), see Section 3.3.1) was used to determine the importance of the criteria. Table 2 shows the ranking of the criteria.
As shown in Table 2, the effect of removing barriers to economic performance (0.513) was the most significant. This criterion was five times more important than the least important criterion (severity of barriers (0.102)) for the ISY. The second highest priority for ISY was the effect of removing barriers on energy efficiency (0.267) and the simplicity of removing barriers (0.118) was the third highest priority for ISY. Finally, the severity of barriers was the least important priority for the yard (0.102).

4.1.4. MCDM Assessment

Table 3 and Table 4 show the results of the ranking of the barriers in each discipline and the final ranking of the barriers for ISY. The fourth step was the “MCDM assessment”. In this step, by applying the weight of both disciplines and criteria, the yard DMs were able to rank the barriers within each discipline and overall. The FTOPSIS methodology was used to manage the FMAGDM and rank the barriers6.

Ranking of ISY’ Barriers

Table 3 shows the ranking of the barriers in each discipline for the ISY. After applying the weight of criteria (see Section 4.1.3) and utilizing the FMAGDM method, the authors could rank the barriers in each disciplines based on the priorities of DMs in ISY.
Technology and innovation
“Inappropriate technology”, “technical risk” and “immaturity of the technology” were the main barriers in the “Technology and Innovation” discipline for the yard in question. Some cost-effective energy-efficient technologies may be unsuitable for certain industries or regions [76]. This type of barrier is more common for industries and companies that have a specific or single type of production, or for technologies that have limitations due to temperature or pollution [38,77]. As an example for the shipyard in question, the new modern winches were not suitable for the shipyard due to the extremely high temperature in the region, which caused them to stop working during operation.
The technical risk (the second main barrier), was directly related to the third main barrier, which was the “immaturity of the technology”. Investment risk can lead to a widening of the energy efficiency gap [13,44]. The “immaturity of technology” barrier is due to the innovative nature of the technologies and measures [24]. A new technology is subject to future performance and evaluation to confirm its maturity. The company DMs claimed that some technologies on the market are not proven or do not have the effectiveness stated in their information, and company managers do not want to invest in high risk technologies whose effectiveness are subject to further evaluation.
Economics
“Lack of funding”, “limited access to capital costs” and the “cost of identifying opportunities” were the main barriers to the yard’s financial discipline. Energy efficient technologies, especially in shipbuilding, are very expensive and limited access to capital was the main challenge for ISY [33], which may improve during the economic recession [111]. According to the respondents, these barriers have increased mainly due to the international sanctions against Iran. The limited access to capital leads to poor budgeting, which makes energy efficiency less important for the yard [36].
“Costs of production interruptions” are an important barrier in energy-intensive industries and are categorized as hidden costs in the classical categorization [44]. The barrier is placed as the highest priority in the case yard. In addition, the “increase in perceived costs of energy saving measures” (fifth highest priority barrier) and “cost-effectiveness analysis and tendering” (sixth highest priority barrier) were categorized as hidden costs. Hidden costs are categorized as barriers that are not market-based and may hinder energy efficiency investments [44]. The hidden cost may be due to the cost of collecting and analyzing information [66], and it is more common in small industries [129].
“Split incentives” were ranked as the sixth highest priority. The common example of the shipyard was a typical case in industry, where shipyard managers, who have a short tenure, were reluctant and hesitant to invest in projects, measures and technologies with a long payback period [59]. The last four barriers were “capital market barriers”, “lack of investment capacity”, “lack of information on the profitability of energy saving measures” and “competition from other projects”. The “capital market barriers” and “lack of investment capacity” were related to problems in accessing capital and were classified as behavioral barriers [33]. According to the interviewees, this problem is becoming more serious, especially after the international sanctions against Iran. Finally, the “lack of information on the profitability of energy saving measures” and “competition from other projects” are considered as insufficient information. Lack of information can lead to a widening of the energy efficiency gap [35,46].
Operation
“Disruption” was the main barrier in the discipline. The cost of any disruption is categorized as a hidden cost [67]. Shipyard managers were concerned that ship production would be disrupted due to energy efficiency measures. This concern led to an increased lack of energy efficiency within the shipyard. “Not using information”, “wrong form of information”, “wrong information” and “not maintaining information” were ranked second, third, fourth and fifth, respectively. “Form of information”, “incorrect form of information” and “incorrect information” are crucial to improving energy efficiency. The information provided to users must be specific, vivid, simple and personalized (SVSP) [13,36]. As an example, the form of the information provided on winches (see the section on technology and innovation) at the shipyard was not specific, leading to an increased investment risk. The relevant staff in the shipyards must be well trained to use information on technology and maintain it in order to remove the barriers around information [111].
Human element
An “inappropriate organizational structure” was the main barrier in the discipline. The barrier is categorized under the main theory of organizational barriers [36]. The shipyard did not have an independent and classical energy department, and only one junior engineer was responsible for managing the energy sector within the shipyard. The “low position of the energy manager” and the “lack of influence of the energy manager” (fourth highest barrier) in the shipyard made energy efficiency a low priority for managers (sixth highest priority) [13], and other issues a higher priority for capital investment (seventh highest priority) [52]. In addition, an “inappropriate organizational structure” (first barrier) affects the organizational culture. By developing a culture of environmental values, the yard can promote energy efficiency [82]. Improving the organization’s culture towards environmental protection can overcome the eleventh most important barrier, namely, the “lack of management support” for energy efficiency investments.
“Lack of technical skills” and “lack of trained staff” were considered to be the second and fifth biggest barriers in the shipyard respectively. Managers considered the “lack of technical skills of staff” as a barrier to energy efficiency [106]. This may increase the energy gap if it exists among top managers, as they may not realize the importance of investing in energy efficiency measures. The interviewees highlighted that staff need further training on energy efficiency meters and the possibilities to improve energy efficiency in the yard.
“Limited rationality” (the third largest barrier) is a type of behavioral barrier [78]. “Limited rationality” can increase the gap in energy efficiency. Instead of making the optimal decision, DMs, due to a lack of information tend to make decisions based on the rule of thumb and strive to make a satisfactory decision instead of optimizing their decision [13]. The DMs in the shipyard highlighted many constraints, such as “lack of time” (eighth of the main barriers), that cause them to replace the imprecise decisions and rules of thumb with the optimized decisions [89]. Shipyard managers also highlighted that, due to a lack of access to the required budget, there are conflicting interests and goals of individuals and departments within the shipyard. This conflict presents a complicated situation for the shipyard managers in terms of optimizing their decisions to obtain the lowest price for the energy efficiency measures, but at the same time achieving the most efficient effects [90,91].
“Inertia” was the seventh biggest barrier for the shipyard. Interviewees highlighted that there is resistance among individuals to invest in energy efficiency measures. This is related to the habits and routines formed by individuals and organizational behavior [85,86] and it is usually difficult to change behavior in the short term because individuals strive to prevent changes in the environment [87].
Policy and regulation
ISY meets the requirements of ISO 14,001 (Environmental Management System). However, there were questions about how it would be implemented and how environmental issues would be prioritized in relation to business objectives. The “lack of an environmental policy from the government” was considered by the yard manager as the main barrier. They considered that there are not sufficient and appropriate policies for environmental protection, and if there are any, they are weak and not sufficiently enforced (fourth highest priority) and monitored by the government [111]. They also complained that they do not receive any support in the form of incentives or subsidies from the government to improve energy efficiency within their portfolio. Shipyards need more of this kind of support during the economic recession and international sanctions [129].

4.1.5. Strategy Building

“Strategy formation” is the final step in the framework. Shipbuilding authorities can identify and rank barriers according to their priorities. This helps them to have a better understanding of the concept of barriers, allowing them to make rational decisions on investments in energy efficiency measures [132]. In this section, the weights for the disciplines calculated in Section 4.1.2 were applied and, using Equations (5)–(10) of the FMAGDM, the ranking of the barriers was then completed. Table 4 shows the final ranking of the barriers. Based on the final ranking, ISY DMs can eliminate the bounded rationality barrier in the shipyard, and DMs can make rational decisions and also optimize their decisions in improving the energy efficiency within their portfolio, overcoming the barriers.

Measures to Overcome the Barriers

Disciplines
The ranking of barriers in Table 4 shows that the discipline weights have a significant impact on prioritizing the barriers. The analysis show that there is a severe imbalance among the disciplines for prioritizing among the barriers. The top discipline was economic, and its weight was 18 times that of the least important discipline (human element). The significant imbalance among the importance of the disciplines might lead to bias in prioritizing the barriers and the potential in improving the energy efficiency may be lost. There is a recommendation that the DMs of the case shipyard normalize their perspectives among the various disciplines. This way of approach will help them to identify the potential for improving energy efficiency, even with lower cost [106]. For example, training of the personnel can increase awareness of (both low and high ranked) personnel. It will affect the behavioral culture of the organization and can eliminate barriers, such as the low position of the energy manager, the lack of influence of the energy manager, and a low priority of energy efficiency measures for managers [13].
Technology
Inappropriate technology, technical risks and the immaturity of the technology were placed as the second, sixth and eleventh main barriers for the yard, respectively. Shipyard managers should be well educated and aware of the concepts of technology, and they should be able to access sufficient information in order to make rational decisions. The impacts of inappropriate and immature technologies can be mitigated through an appropriate feasibility study and by examining the current state of the art and following the good examples of other yards.
The use of immature technologies increases the technical risk [26] and depends on the risk appetite of the yard management. There are managers who want to be pioneers and will accept the risk. However, the technical risk can be reduced if the manufacturer takes into account the smart contract. Cooperation with technology manufacturers and acceptance to introducing the technology in the yard can be a win-win deal [38]. The manufacturer can evaluate the product and the yard can benefit from any energy savings without having to pay the huge capital cost and with a lower risk.
Economic
The lack of funding was the first priority for the yard. The interviewees claim that this has become serious after the implementation of international sanctions. Although removing the international sanctions is at the government level, by introducing appropriate budgeting, DMs can solve the cost of identifying opportunities. Applying appropriate budgeting and considering a bottom-up approach to budget allocation in the organization can help to overcome the limited availability of capital for those departments that need more budget to improve energy efficiency [111]. There are extensive opportunities for improving energy efficiency by implementing low-cost products, such as system optimization measures to achieve an average energy efficiency of 20–30% [38].
Operation
Interviewees highlighted that disruption due to the implementation of energy efficiency measures is the biggest problem in the discipline, but it was ranked 14th in the final ranking. Appropriate planning, well trained and skilled staff (especially senior managers), and use of the right (credibility and trust) form of information (specific, vivid, simple and personalized (SVSP)) [13] can prevent disruption of the yard’s operations and prevent the wasting of time and costs. In order to overcome the barrier, it is important that an appropriate feasibility study and an up-to-date technical survey are conducted with respect to the shipyard’s current and future projects. This is also linked to the appropriate organization of the yard [36]. By predicting the appropriate time for the installation of new technologies and considering related tasks, disruptions to shipyard operations can be minimized and resolved. In addition, if there is a well-trained and strong energy manager (team) with sufficient power and independence, the process can be accelerated and the risks can be minimized.
Human element
The human element was the least important discipline among the others. Since the importance of the different disciplines has a significant impact on the final ranking of the barriers, the human factor barriers were ranked 22–33. By overcoming barriers, such as inappropriate organizational structure (23rd biggest barrier), other barriers from other disciplines, such as disruption (14th biggest barrier), can also be overcome. To resolve the barrier of organizational structure, the value of the organization should be changed to environmental protection [44]. To achieve this goal, individuals—especially top managers—must have the ambition to increase energy efficiency within the shipyard [36]. This can be accelerated by increasing staff awareness through training [106] and by conducting various workshops. It is suggested that the yard’s top managers pay more attention to human discipline and the related barriers. In addition, the problem of time constraints can be overcome by recruiting well-trained and skilled staff [111].
Policy and regulations
Energy efficiency plays an important role in promoting the energy security of states and in tackling climate change [2]. It is a top priority in the policy decisions of nations responding to the Paris Agreement [3]. As a major stakeholder, the government can justify energy efficiency measures in industry. In the case of the shipyard, the international sanctions against Iran present a major problem for the shipyard in accessing capital. The sanctions affect the ability of Iranian industries to invest in energy efficiency measures. Due to the lack of access to capital, the yard’s priorities for energy efficiency measures have changed and they have been placed at a lower level of priorities. However, by implementing projects, such as Voluntary Agreements (VAs) and Long Term Agreements (LTAs), the government—like some other countries, such as the Netherlands and Japan—can help industries to improve energy efficiency in their context [97]. Training of energy managers in the shipbuilding industry, raising awareness, funding research and development (R&D) and establishing codes and protocols are other measures that can help the government to improve energy efficiency in the shipbuilding industry.

5. Conclusions

It is important to consider a holistic, systematic and transdisciplinary approach to overcoming barriers to improving energy efficiency. In this study a framework for overcoming the barriers to energy efficiency within shipyards is proposed. The framework is holistic, systematic and transdisciplinary, and takes into account the interrelationship and interaction between different barriers. It consists of five main disciplines, namely, the human element, technology and innovation, operation, policy and regulations, and economics. The focused group of the study includes the top managers of shipyards, who have the highest weight in the final decision for investment in energy efficiency measures. Implementing the framework overcomes the bounded rationality barrier and helps DMs to make rational and optimal decisions in a vague environment regarding improving energy efficiency. Additionally, following the PDCA cycle and considering the changeable DMs priorities contributes a dynamic feature to the framework. Due to the framework’s generic characteristics, it may be applied to other industries, and policy makers and researchers in those industries can also employ the framework to overcome barriers to improving energy efficiency.
The following steps was taken to design and develop the framework:
  • Systematic literature review on barriers of energy efficiency from various sectors and industries;
  • Analysis and categorizing different barriers in the shipbuilding industry;
  • Design and develop the framework by categorizing the identified barriers in to five main disciplines;
  • Using two MCDM methods (FAHP and FMAGDM) to understand the interaction between the barriers.
To validate the proposed framework, a case study was conducted for an Iranian shipyard. Interviews were conducted with five senior managers of the shipyard, and their priorities of the categorized barriers in each discipline were determined. Four criteria were presented to them for prioritizing the barriers, namely, how severe the barriers are, how easy it is to remove the barriers, how much impact the removal of the barriers can have on energy efficiency, and how much impact the removal of the barriers can have on economic performance. By applying FAHP and FMAGDM, the priorities of the barriers were identified in each discipline and in general aspects. The results show that:
  • There is a significant imbalance between the importance of the different disciplines. Economic barriers are the most important and are considered to be 18 times more important than the least important discipline, i.e., barriers due to the human factor.
  • In the criteria side, the most important thing for DMs is the impact of “barriers removal to economic performance”. “Improvement of energy efficiency after barriers removal”, “simplicity of barriers removal”, and “severity of barriers” are ranked in order of importance”.
  • The weights assigned to the disciplines have significant impact on the final ranking of the barriers.
  • Due to international sanctions, the yard has problems with financing and limited access to capital. In addition, costs caused by disruptions of production is another major barrier to implementing energy efficiency measures at the yard.
  • In terms of technological discipline, the main barriers for the yard are “lack of appropriate technology at the yard”, “technical investment risk” and “immaturity of the technology”.
  • “Lack of environmental policy from the government”, “lack of government incentives” and “lack of environmental policy from the company” are considered to be the highest priority for the yard in terms of policy and regulations.
  • The least important barriers are related to the human factor. The main barriers in this discipline are “inappropriate organizational structure”, “lack of technical competence”, and “bounded rationality”.
In order to overcome the barriers, the integration of the barriers must be taken into account. Imbalances between the importance of the disciplines can lead to a loss of potential for improving energy efficiency. Appropriate budgeting and consideration of the bottom-up approach can help the yard to overcome the lack of budgeting and ensure that different departments have access to the necessary budget for investments in energy efficiency measures. There is significant potential for improving energy efficiency (20-30%) by implementing (low hanging fruit) measures that are cheap and affordable for the yard. In addition, addressing the organizational structure of the yard can play a major role in overcoming other barriers. It is important to shift the value of the yard to environmental protection. The role of top management and its commitment in this respect is extremely important. This approach can be accelerated by raising staff awareness through training and conducting various workshops. Governments as key stakeholders can motivate energy efficiency measures and regulations in the shipbuilding industry. By providing incentives, subsidies and implementing projects, such as voluntary agreements and long-term contracts, training shipbuilding energy managers, raising awareness, funding research and development and establishing codes and protocols, the shipbuilding industry can overcome the barriers to improving energy efficiency.

Author Contributions

Conceptualization: S.V.V. and A.I.Ö.; methodology: S.V.V., A.I.Ö. and A.S.; validation: S.V.V., A.I.Ö. and A.S.; formal analysis: S.V.V.; investigation: S.V.V.; resources: S.V.V.; data curation: S.V.V.; writing—original draft preparation: S.V.V.; writing—review and editing: S.V.V., A.I.Ö. and A.S.; visualization: S.V.V.; supervision: A.I.Ö. and A.S. All authors have read and agreed to the published version of the manuscript.

Funding

This research received no external funding.

Informed Consent Statement

Not applicable.

Acknowledgments

The authors would like to thank the reviewers and the journal’s editor for their valuable comments, which have greatly improved the study.

Conflicts of Interest

The authors declare no conflict of interest.

Notes

1
SEEMP is mandatory for all vessels of 400 GT or more and must be carried on board. However, it does not contain any explicit and mandatory content and implementation requirements. On the other hand, the ESEEMP is an improved SEEMP including mandatory content, such as an implementation plan on how to achieve the Carbon Intensity Indicator (CII) targets, and should be subject to approval.
2
Depending on the DMs’ preference, different criteria may be considered.
3
Depending on the type of data (explicit or linguistic) and the number of DMs, exceptional MCDM techniques can be used. The number of respondents may also vary depending on many factors, such as ownership and the organisational form of the yard. There are usually no more than three decision makers when it comes to making strategic choices regarding the strengths of a yard.
4
In an unclear environment of lack of information and inconsistency, managers generally fail to make rational decisions and set their priorities. MCDM methods can help managers to identify problems and make the best decision among different options in an ambiguous environment.
5
The Fuzzy TOPSIS (FTOPSIS) method was used to handle FMAGDM.
6
Equations (5)–(10) were used to rank the alternatives, please see Section 3.3.2.

References

  1. International Energy Agency (IEA). 2020. Available online: https://www.iea.org/reports/tracking-industry-2020 (accessed on 17 March 2021).
  2. Hess, D.J.; Renner, M. Conservative political parties and energy transitions in Europe: Opposition to climate mitigation policies. Renew. Sustain. Energy Rev. 2019, 104, 419–428. [Google Scholar] [CrossRef]
  3. Sun, H.; Ikram, M.; Mohsin, M.; Abbas, Q. Energy security and environmental efficiency: Evidence from oecd countries. Singap. Econ. Rev. 2021, 66, 489–506. [Google Scholar] [CrossRef]
  4. Rammer, C.; Gottschalk, S.; Peneder, M.; Wörter, M.; Stucki, T.; Arvanitis, S. Does energy policy hurt international competitiveness of firms? A comparative study for Germany, Switzerland and Austria. Energy Policy 2017, 109, 154–180. [Google Scholar] [CrossRef] [Green Version]
  5. Chatzistamoulou, N.; Kounetas, K.; Tsekouras, K. Energy efficiency, productive performance and heterogeneous competitiveness regimes. Does the dichotomy matter? Energy Econ. 2019, 81, 687–697. [Google Scholar] [CrossRef]
  6. International Energy Agency (IEA). 2019. Available online: https://www.iea.org/reports/world-energy-outlook-2019 (accessed on 9 May 2021).
  7. United Nation Conference on Trade and Development (UNCTAD), 2017. Review of Maritime Transport. 2017. Available online: https://unctad.org/en/pages/publicationwebflyer.aspx?publicationid=1890 (accessed on 14 February 2021).
  8. International Maritime Organization (IMO). MEPC\75\MEPC 75-7-15. REDUCTION of GHG EMISSIONS FROM SHIPS. Fourth IMO GHG Study 2020- Final Report. 2020. Available online: http://www.imo.org/en/About/Pages/Default.aspx (accessed on 7 January 2021).
  9. Chatzinikolaou, S.D.; Ventikos, N.P. Applications of Life Cycle Assessment in Shipping; INT-NAM 2014At: Istanbul, Turkey, 2014. [Google Scholar]
  10. Merk, O. Shipping Emissions in Ports; OECD: Paris, France, 2014. [Google Scholar]
  11. Nordtveit, E. Life Cycle Assessment of a Battery Passenger Ferry. Master’s Thesis, University of Agder, Kristiansand and Grimstad, Norway, 2017. Available online: http://hdl.handle.net/11250/2493457 (accessed on 12 May 2021).
  12. Sorrell, S.; Schleich, J.; Scott, S.; O’Malley, E.; Trace, F.; Boede, U.; Radgen, P. Reducing Barriers to Energy Efficiency in Public and Private Organizations; Science and Policy Technology Research (SPRU); University of Sussex: Sussex, UK, 2000. [Google Scholar]
  13. Gillingham, K.; Newell, R.; Palmer, K. Energy Efficiency Economics and Policy. Annu. Rev. Resour. Econ. 2009, 1, 597–620. [Google Scholar] [CrossRef]
  14. Gillingham, K.; Palmer, K. Bridging the Energy Efficiency Gap: Policy Insights from Economic Theory and Empirical Evidence. Rev. Environ. Econ. Policy 2014, 8, 18–38. [Google Scholar] [CrossRef] [Green Version]
  15. Rehmatulla, N.; Calleya, J.; Smith, T. The implementation of technical energy efficiency and CO2 emission reduction measures in shipping. Ocean Eng. 2017, 139, 184–197. [Google Scholar] [CrossRef]
  16. Dewan, M.H.; Yaakob, O.; Suzana, A. Barriers for adoption of energy efficiency operational measures in shipping industry. WMU J. Marit. Aff. 2018, 17, 169–193. [Google Scholar] [CrossRef]
  17. Acciaro, M.; Hoffmann, P.N.; Eide, M.S. The energy efficiency gap in maritime transport. J. Shipp. Ocean. Eng. 2013, 3, 1. [Google Scholar]
  18. Killip, G.; Fawcett, T.; Cooremans, C.; Wijns-Craus, W.; Subramani, K.; Voswinkel, F. Multiple Benefits of Energy Efficiency at the Firm Level: A Literature Review; European Council for an Energy Efficient Economy: 2019. Available online: https://ora.ox.ac.uk/objects/uuid:b4a51feb-071e-474e-a284-e95285145f29 (accessed on 10 May 2021).
  19. Pastor, A.; Vieira, D.; Soudijn, F.; Edelenbosch, O. How uncertainties are tackled in multi-disciplinary science? A review of integrated assessments under global change. Catena 2020, 186, 104305. [Google Scholar] [CrossRef]
  20. van Smirren, J. Influences and impact of the energy industry on the new blue economy and its workforce development. In Preparing a Workforce for the New Blue Economy; Elsevier: Amsterdam, The Netherlands, 2021; pp. 201–209. [Google Scholar]
  21. Gemak Shipyard. OFFSHORE & OIL GAS PROJECTS. 2021. Available online: https://www.gemak.com/BusinessActivities.aspx?q=12 (accessed on 17 March 2021).
  22. Thollander, P.; Danestig, M.; Rohdin, P. Energy policies for increased industrial energy efficiency: Evaluation of a local energy programme for manufacturing SMEs. Energy Policy 2007, 35, 5774–5783. [Google Scholar] [CrossRef] [Green Version]
  23. Voinov, A.; Filatova, T. Pricing strategies in inelastic energy markets: Can we use less if we can’t extract more? Front. Earth Sci. 2014, 8, 3–17. [Google Scholar] [CrossRef]
  24. Jaffe, A.B.; Stavins, R.N. The energy-efficiency gap What does it mean? Energy Policy 1994, 22, 804–810. [Google Scholar] [CrossRef]
  25. Brent, D.A.; Ward, M.B. Energy efficiency and financial literacy. J. Environ. Econ. Manag. 2018, 90, 181–216. [Google Scholar] [CrossRef] [Green Version]
  26. Rohdin, P.; Thollander, P.; Solding, P. Barriers to and drivers for energy efficiency in the Swedish foundry industry. Energy Policy 2007, 35, 672–677. [Google Scholar] [CrossRef] [Green Version]
  27. Allcott, H.; Greenstone, M. Is There an Energy Efficiency Gap? J. Econ. Perspect. 2012, 26, 3–28. [Google Scholar] [CrossRef]
  28. Camarasa, C.; Nägeli, C.; Ostermeyer, Y.; Klippel, M.; Botzler, S. Diffusion of energy efficiency technologies in European residential buildings: A bibliometric analysis. Energy Build. 2019, 202, 109339. [Google Scholar] [CrossRef]
  29. Gissey, G.C.; Dodds, P.; Radcliffe, J. Market and regulatory barriers to electrical energy storage innovation. Renew. Sustain. Energy Rev. 2018, 82, 781–790. [Google Scholar] [CrossRef]
  30. Thollander, P.; Ottosson, M. An energy efficient Swedish pulp and paper industry—Exploring barriers to and driving forces for cost-effective energy efficiency investments. Energy Effic. 2008, 1, 21–34. [Google Scholar] [CrossRef] [Green Version]
  31. Pavlyk, V. Assessment of green investment impact on the energy efficiency gap of the national economy. Financ. Mark. Inst. Risks 2020, 4, 117–123. [Google Scholar] [CrossRef]
  32. Blumstein, C.; Krieg, B.; Schipper, L.; York, C. Overcoming social and institutional barriers to energy conservation. Energy 1980, 5, 355–371. [Google Scholar] [CrossRef] [Green Version]
  33. Hirst, E.; Brown, M. Closing the efficiency gap: Barriers to the efficient use of energy. Resour. Conserv. Recycl. 1990, 3, 267–281. [Google Scholar] [CrossRef]
  34. Howarth, R.; Andersson, B. Market barriers to energy efficiency. Energy Econ. 1993, 15, 262–272. [Google Scholar] [CrossRef] [Green Version]
  35. Eyre, N. Barriers to Energy Efficiency: More Than Just Market Failure. Energy Environ. 1997, 8, 25–43. [Google Scholar] [CrossRef]
  36. Weber, L. Some reflections on barriers to the efficient use of energy. Energy Policy 1997, 25, 833–835. [Google Scholar] [CrossRef]
  37. Fleiter, T.; Hirzel, S.; Worrell, E. The characteristics of energy-efficiency measures–a neglected dimension. Energy Policy 2012, 51, 502–513. [Google Scholar] [CrossRef]
  38. Thollander, P.; Palm, J. Improving Energy Efficiency in Industrial Energy Systems: An Interdisciplinary Perspective on Barriers, Energy Audits, Energy Management, Policies, and Programs; Springer Science & Business Media: Berlin/Heidelberg, Germany, 2012. [Google Scholar]
  39. TYap, J.; Escresa-Guillermo, L.; Paras, Y.G.M. Access to Sustainable Energy in the Philippines: Market Failure and Political Economy Considerations (April 2020). ASOG WORKING PAPER 20-006. Available online: https://ssrn.com/abstract=3578493 (accessed on 12 August 2021). [CrossRef]
  40. Munoz, L. Is Environmental Externality Management a Correction of Adam Smith’s Model to Make it Environmentally Friendly and Shift it Towards Green Markets or is it a Distortion on Top of Another Distortion? Int. J. Econ. Bus. Manag. Stud. 2017, 4, 1–16. [Google Scholar] [CrossRef]
  41. Gerarden, T.D.; Newell, R.; Stavins, R.N. Assessing the Energy-Efficiency Gap. J. Econ. Lit. 2017, 55, 1486–1525. [Google Scholar] [CrossRef] [Green Version]
  42. Apeaning, R.W.; Thollander, P. Barriers to and driving forces for industrial energy efficiency improvements in African industries—A case study of Ghana’s largest industrial area. J. Clean. Prod. 2013, 53, 204–213. [Google Scholar] [CrossRef] [Green Version]
  43. Fawcett, T.; Hampton, S. Why & how energy efficiency policy should address SMEs. Energy Policy 2020, 140, 111337. [Google Scholar] [CrossRef]
  44. Sorrell, S.; O’Malley, E. The Economics of Energy Efficiency; Edward Elgar Publishing: Cheltenham, UK, 2004; p. 2607. [Google Scholar]
  45. Backlund, S.; Thollander, P.; Palm, J.; Ottosson, M. Extending the energy efficiency gap. Energy Policy 2012, 51, 392–396. [Google Scholar] [CrossRef] [Green Version]
  46. Chai, K.-H.; Yeo, C. Overcoming energy efficiency barriers through systems approach—A conceptual framework. Energy Policy 2012, 46, 460–472. [Google Scholar] [CrossRef]
  47. Cagno, E.; Worrell, E.; Trianni, A.; Pugliese, G. A novel approach for barriers to industrial energy efficiency. Renew. Sustain. Energy Rev. 2013, 19, 290–308. [Google Scholar] [CrossRef]
  48. Dunlop, T. Mind the gap: A social sciences review of energy efficiency. Energy Res. Soc. Sci. 2019, 56, 101216. [Google Scholar] [CrossRef]
  49. Coccia, M. The theory of technological parasitism for the measurement of the evolution of technology and technological forecasting. Technol. Forecast. Soc. Chang. 2019, 141, 289–304. [Google Scholar] [CrossRef]
  50. Hötte, K. How to accelerate green technology diffusion? Directed technological change in the presence of coevolving absorptive capacity. Energy Econ. 2020, 85, 104565. [Google Scholar] [CrossRef]
  51. Batlle, E.A.O.; Palacio, J.C.E.; Lora, E.E.S.; Reyes, A.M.M.; Moreno, M.M.; Morejón, M.B. A methodology to estimate baseline energy use and quantify savings in electrical energy consumption in higher education institution buildings: Case study, Federal University of Itajubá (UNIFEI). J. Clean. Prod. 2020, 244, 118551. [Google Scholar] [CrossRef]
  52. Soepardi, A.; Thollander, P. Analysis of relationships among organizational barriers to energy efficiency improvement: A case study in Indonesia’s steel industry. Sustainability 2018, 10, 216. [Google Scholar] [CrossRef] [Green Version]
  53. Dean, E.; Elardo, J.; Green, M.; Wilson, B.; Berger, S. The Problem of Imperfect Information and Asymmetric Information. In Principles of Economics: Scarcity and Social Provisioning, 2nd ed.; BCcampus Open Publishing: Victoria, BC, Canada, 2020. [Google Scholar]
  54. Myers, E. Asymmetric information in residential rental markets: Implications for the energy efficiency gap. J. Public Econ. 2020, 190, 104251. [Google Scholar] [CrossRef]
  55. Adetutu, M.O.; Stathopoulou, E. Information Asymmetry in Voluntary Environmental Agreements (VEAs): Theory and Evidence from UK Climate Change Agreements (CCAs). Oxf. Econ. Pap. 2021, 73, 644–670. [Google Scholar] [CrossRef]
  56. Wrigley, K.; Crawford, R.H. Identifying policy solutions for improving the energy efficiency of rental properties. Energy Policy 2017, 108, 369–378. [Google Scholar] [CrossRef]
  57. Kangas, H.-L.; Lazarevic, D.; Kivimaa, P. Technical skills, disinterest and non-functional regulation: Barriers to building energy efficiency in Finland viewed by energy service companies. Energy Policy 2018, 114, 63–76. [Google Scholar] [CrossRef] [Green Version]
  58. Reina, V.J.; Kontokosta, C. Low hanging fruit? Regulations and energy efficiency in subsidized multifamily housing. Energy Policy 2017, 106, 505–513. [Google Scholar] [CrossRef] [Green Version]
  59. Shaikh, I.; O’Connor, G.C. Understanding the motivations of technology managers in radical innovation decisions in the mature R&D firm context: An Agency theory perspective. J. Eng. Technol. Manag. 2020, 55, 101553. [Google Scholar] [CrossRef]
  60. Qiu, Y.; Colson, G.; Wetzstein, M.E. Risk preference and adverse selection for participation in time-of-use electricity pricing programs. Resour. Energy Econ. 2017, 47, 126–142. [Google Scholar] [CrossRef] [Green Version]
  61. Palm, J.; Reindl, K. Understanding barriers to energy-efficiency renovations of multifamily dwellings. Energy Effic. 2017, 11, 53–65. [Google Scholar] [CrossRef]
  62. Kahn, B.E. Using Visual Design to Improve Customer Perceptions of Online Assortments 1. Routledge Companion Consum. Behav. 2017, 93, 304–327. [Google Scholar] [CrossRef]
  63. Rehmatulla, N.; Smith, T. Barriers to energy efficiency in shipping: A triangulated approach to investigate the principal agent problem. Energy Policy 2015, 84, 44–57. [Google Scholar] [CrossRef] [Green Version]
  64. Graus, W.; Worrell, E. The principal–agent problem and transport energy use: Case study of company lease cars in the Netherlands. Energy Policy 2008, 36, 3745–3753. [Google Scholar] [CrossRef] [Green Version]
  65. Menanteau, P.; Lefebvre, H. Competing technologies and the diffusion of innovations: The emergence of energy-efficient lamps in the residential sector. Res. Policy 2000, 29, 375–389. [Google Scholar] [CrossRef]
  66. Cardoso, C.A.; Torriti, J.; Lorincz, M. Making demand side response happen: A review of barriers in commercial and public organisations. Energy Res. Soc. Sci. 2020, 64, 101443. [Google Scholar] [CrossRef]
  67. Good, N.; Ellis, K.A.; Mancarella, P. Review and classification of barriers and enablers of demand response in the smart grid. Renew. Sustain. Energy Rev. 2017, 72, 57–72. [Google Scholar] [CrossRef] [Green Version]
  68. Golove, W.; Eto, J. Market Barriers to Energy Efficiency: A Critical Reappraisal of the Rationale for Public Policies to Promote Energy Efficiency. In Market Barriers to Energy Efficiency: A Critical Reappraisal of the Rationale for Public Policies to Promote Energy Efficiency, OSTI.GO, U.S.; 1996. Available online: https://www.osti.gov/biblio/270751-RXrf5G/webviewable/ (accessed on 16 May 2021).
  69. Trianni, A.; Cagno, E.; Thollander, P.; Backlund, S. Barriers to industrial energy efficiency in foundries: A European comparison. J. Clean. Prod. 2013, 40, 161–176. [Google Scholar] [CrossRef] [Green Version]
  70. Trianni, A.; Cagno, E. Dealing with barriers to energy efficiency and SMEs: Some empirical evidences. Energy 2012, 37, 494–504. [Google Scholar] [CrossRef]
  71. O’Keeffe, J.M.; Gilmour, D.; Simpson, E. A network approach to overcoming barriers to market engagement for SMEs in energy efficiency initiatives such as the Green Deal. Energy Policy 2016, 97, 582–590. [Google Scholar] [CrossRef] [Green Version]
  72. Sorrell, S.; Mallett, A.; Nye, S. Barriers to Industrial Energy Efficiency: A Literature Review, Background Study for the UNIDO Industrial Development Report (IDR)‘Industrial Energy Efficiency Pays, Why Is It Not Happening?’; SPRU, University of Sussex: Brighton, UK, 2010. [Google Scholar]
  73. Hilorme, T.; Zamazii, O.; Judina, O.; Korolenko, R.; Melnikova, Y. Formation of risk mitigating strategies for the implementation of projects of energy saving technologies. Acad. Strateg. Manag. J. 2019, 18, 1–6. [Google Scholar]
  74. Sutherland, R.J. Market Barriers to Energy-Efficiency Investments. Energy J. 1991, 12, 15–34. [Google Scholar] [CrossRef]
  75. Leskinen, N.; Vimpari, J.; Junnila, S. Using real estate market fundamentals to determine the correct discount rate for decentralised energy investments. Sustain. Cities Soc. 2020, 53, 101953. [Google Scholar] [CrossRef]
  76. Sun, J.; Wang, Z.; Li, G. Measuring emission-reduction and energy-conservation efficiency of Chinese cities considering management and technology heterogeneity. J. Clean. Prod. 2018, 175, 561–571. [Google Scholar] [CrossRef]
  77. Akram, R.; Chen, F.; Khalid, F.; Ye, Z.; Majeed, M.T. Heterogeneous effects of energy efficiency and renewable energy on carbon emissions: Evidence from developing countries. J. Clean. Prod. 2020, 247, 119122. [Google Scholar] [CrossRef]
  78. Nehler, T.; Parra, R.; Thollander, P. Implementation of energy efficiency measures in compressed air systems: Barriers, drivers and non-energy benefits. Energy Effic. 2018, 11, 1281–1302. [Google Scholar] [CrossRef] [Green Version]
  79. Sussman, R.; Chikumbo, M.; Miller, N. After the Audit: Improving Residential Energy Efficiency Assessment Reports; American Council for an Energy-Efficient Economy: Washington, DC, USA, 2019. [Google Scholar]
  80. Fresner, J.; Morea, F.; Krenn, C.; Uson, J.A.; Tomasi, F. Energy efficiency in small and medium enterprises: Lessons learned from 280 energy audits across Europe. J. Clean. Prod. 2017, 142, 1650–1660. [Google Scholar] [CrossRef]
  81. Raymond, C.M.; Kenter, J.O.; van Riper, C.J.; Rawluk, A.; Kendal, D. Editorial overview: Theoretical traditions in social values for sustainability. Sustain. Sci. 2019, 14, 1173–1185. [Google Scholar] [CrossRef] [Green Version]
  82. Lopes, J.R.; de Araújo Kalid, R.; Rodríguez, J.L.; Ávila Filho, S. A new model for assessing industrial worker behavior regarding energy saving considering the theory of planned behavior, norm activation model and human reliability. Resour. Conserv. Recycl. 2019, 145, 268–278. [Google Scholar] [CrossRef]
  83. Hewett, M.J. Achieving energy efficiency in a restructured electric utility industry. In Report Prepared for Minnesotans for an Energy Efficient Economy; Centre for Energy & Environment: Minneapolis, MN, USA, 1998. [Google Scholar]
  84. Li, F.G.; Strachan, N. Modelling energy transitions for climate targets under landscape and actor inertia. Environ. Innov. Soc. Transit. 2017, 24, 106–129. [Google Scholar] [CrossRef]
  85. Verplanken, B.; Wood, W. Interventions to Break and Create Consumer Habits. J. Public Policy Mark. 2006, 25, 90–103. [Google Scholar] [CrossRef] [Green Version]
  86. Sardianos, C.; Varlamis, I.; Chronis, C.; Dimitrakopoulos, G.; Alsalemi, A.; Himeur, Y.; Bensaali, F.; Amira, A. Reshaping consumption habits by exploiting energy-related micro-moment recommendations: A case study. In Smart Cities, Green Technologies and Intelligent Transport Systems; Springer: Cham, Switzerland, 2019; pp. 65–84. [Google Scholar]
  87. Bindl, U.K.; Unsworth, K.L.; Gibson, C.B.; Stride, C.B. Job crafting revisited: Implications of an extended framework for active changes at work. J. Appl. Psychol. 2019, 104, 605–628. [Google Scholar] [CrossRef] [Green Version]
  88. Nguyen, N.; Greenland, S.; Lobo, A.; Nguyen, H.V. Demographics of sustainable technology consumption in an emerging market: The significance of education to energy efficient appliance adoption. Soc. Responsib. J. 2019, 15, 803–818. [Google Scholar] [CrossRef]
  89. Koops, L.G. Optimized Maintenance Decision-Making—A Simulation-Supported Prescriptive Analytics Approach Based on Probabilistic Cost-Benefit Analysis. PHM Soc. Eur. Conf. 2020, 5, 14. [Google Scholar]
  90. Sanstad, A.H.; Howarth, R. ‘Normal’ markets, market imperfections and energy efficiency. Energy Policy 1994, 22, 811–818. [Google Scholar] [CrossRef]
  91. Bonilla-Campos, I.; Nieto, N.; del Portillo-Valdes, L.; Manzanedo, J.; Gaztañaga, H. Energy efficiency optimisation in industrial processes: Integral decision support tool. Energy 2020, 191, 116480. [Google Scholar] [CrossRef]
  92. Goren, P.; Motta, M.; Smith, B. The Ideational Foundations of Symbolic Ideology. Politi. Psychol. 2020, 41, 75–94. [Google Scholar] [CrossRef]
  93. Chang, W.J.; Liao, S.H.; Wu, T.T. Relationships among organizational culture, knowledge sharing, and innovation capability: A case of the automobile industry in Taiwan. Knowl. Manag. Res. Pract. 2017, 15, 471–490. [Google Scholar] [CrossRef]
  94. Westervelt, E.T.; Loechl, P.M.; Clark, S.A.; DuPont, C.E. Enhancing Army Energy Culture with Behavioral Approaches; Engineer Research and Development Center (US) Champaign United States: Champaign, IL, USA, 2020. [Google Scholar]
  95. Ruth, M.; Goessling-Reisemann, S. Handbook on Resilience of Socio-Technical Systems. In Handbook on Resilience of Socio-Technical Systems; Edward Elgar Publishing: Cheltenham, UK, 2019. [Google Scholar]
  96. Hong, J.; Gu, J.; Liang, X.; Liu, G.; Shen, G.Q. Characterizing embodied energy accounting with a multi-dimensional framework: A study of China’s building sector. J. Clean. Prod. 2019, 215, 154–164. [Google Scholar] [CrossRef]
  97. European Commission (EU). Communication from the Commission. Action Plan for Energy Efficiency: Realizing the Potential. 2006, p. 545. Available online: https://eur-lex.europa.eu/legal-content/EN/TXT/?uri=celex%3A52006DC0545 (accessed on 13 June 2021).
  98. Kondo, R.; Kinoshita, Y.; Yamada, T. Green Procurement Decisions with Carbon Leakage by Global Suppliers and Order Quantities under Different Carbon Tax. Sustainability 2019, 11, 3710. [Google Scholar] [CrossRef] [Green Version]
  99. Coady, D.; Parry, I.W.H.; Shang, B. Energy Price Reform: Lessons for Policymakers. Rev. Environ. Econ. Policy 2018, 12, 197–219. [Google Scholar] [CrossRef] [Green Version]
  100. Filippidou, F.; Nieboer, N.; Visscher, H. Are we moving fast enough? The energy renovation rate of the Dutch non-profit housing using the national energy labelling database. Energy Policy 2017, 109, 488–498. [Google Scholar] [CrossRef]
  101. Bertoldi, P. European Union Energy Efficiency Policies for Buildings’. In Handbook of Energy Efficiency in Buildings’; Elsevier: Amsterdam, The Netherlands, 2018. [Google Scholar]
  102. Palm, J.; Thollander, P. Reframing energy efficiency in industry: A discussion of definitions, rationales, and management practices. Energy Behav. 2019, 1, 153–175. [Google Scholar] [CrossRef]
  103. Jekabsone, A.; Kamenders, A.; Rosa, M. Implementation of Certified Energy ManagementSystem in Municipality. Case Study. Environ. Clim. Technol. 2020, 24, 41–56. [Google Scholar] [CrossRef]
  104. Pregger, T.; Naegler, T.; Weimer-Jehle, W.; Prehofer, S.; Hauser, W. Moving towards socio-technical scenarios of the German energy transition—lessons learned from integrated energy scenario building. Clim. Chang. 2020, 162, 1743–1762. [Google Scholar] [CrossRef]
  105. Bingham, N.; Manohar, R. A Systematic Approach for Arbitration Expressions. IEEE Trans. Circuits Syst. I Regul. Pap. 2020, 67, 4960–4969. [Google Scholar] [CrossRef]
  106. Thollander, P.; Karlsson, M.; Rohdin, P.; Johan, W.; Rosenqvist, J. Introduction to Industrial Energy Efficiency: Energy Auditing, Energy Management, and Policy Issues; Academic Press: Cambridge, MA, USA, 2020. [Google Scholar]
  107. Fernando, Y.; Hor, W.L. Impacts of energy management practices on energy efficiency and carbon emissions reduction: A survey of malaysian manufacturing firms. Resour. Conserv. Recycl. 2017, 126, 62–73. [Google Scholar] [CrossRef] [Green Version]
  108. Trianni, A.; Cagno, E.; Marchesani, F.; Spallina, G. Classification of drivers for industrial energy efficiency and their effect on the barriers affecting the investment decision-making process. Energy Effic. 2017, 10, 199–215. [Google Scholar] [CrossRef]
  109. Nagesha, N.; Balachandra, P. Barriers to energy efficiency in small industry clusters: Multi-criteria-based prioritization using the analytic hierarchy process. Energy 2006, 31, 1969–1983. [Google Scholar] [CrossRef]
  110. Wang, G.; Wang, Y.; Zhao, T. Analysis of interactions among the barriers to energy saving in China. Energy Policy 2008, 36, 1879–1889. [Google Scholar] [CrossRef]
  111. Jafarzadeh, S.; Utne, I.B. A framework to bridge the energy efficiency gap in shipping. Energy 2014, 69, 603–612. [Google Scholar] [CrossRef]
  112. Hasanbeigi, A.; Menke, C.; Du Pont, P. Barriers to energy efficiency improvement and decision-making behavior in Thai industry. Energy Effic. 2010, 3, 33–52. [Google Scholar] [CrossRef]
  113. Prashar, A. Adopting PDCA (Plan-Do-Check-Act) cycle for energy optimization in energy-intensive SMEs. J. Clean. Prod. 2017, 145, 277–293. [Google Scholar] [CrossRef]
  114. Adler, P. When knowledge is the critical resource, knowledge management is the critical task. IEEE Trans. Eng. Manag. 1989, 36, 87–94. [Google Scholar] [CrossRef] [Green Version]
  115. Sovacool, B.K.; Axsen, J.; Sorrell, S. Promoting novelty, rigor, and style in energy social science: Towards codes of practice for appropriate methods and research design. Energy Res. Soc. Sci. 2018, 45, 12–42. [Google Scholar] [CrossRef]
  116. Ashouri, M.; Fung, B.C.; Haghighat, F.; Yoshino, H. Systematic approach to provide building occupants with feedback to reduce energy consumption. Energy 2020, 194, 116813. [Google Scholar] [CrossRef]
  117. Williams, B.; Hummelbrunner, R. Soft systems methodology. In Systems Concepts in Action; Stanford University Press: Redwood City, CA, USA, 2020; pp. 241–261. [Google Scholar]
  118. Mingers, J.; White, L. A review of the recent contribution of systems thinking to operational research and management science. Eur. J. Oper. Res. 2010, 207, 1147–1161. [Google Scholar] [CrossRef] [Green Version]
  119. Rossi, P.H.; Lipsey, M.W.; Henry, G.T. Evaluation: A Systematic Approach; Sage Publications: Thousand Oaks, CA, USA, 2018. [Google Scholar]
  120. Klein, J.T. Evaluation of Interdisciplinary and Transdisciplinary Research: A Literature Review. Am. J. Prev. Med. 2008, 35, S116–S123. [Google Scholar] [CrossRef]
  121. Park, J.-Y.; Son, J.-B. Transitioning toward Transdisciplinary Learning in a Multidisciplinary Environment. Int. J. Pedagog. Learn. 2010, 6, 82–93. [Google Scholar] [CrossRef] [Green Version]
  122. Batra, S. Interdisciplinary Research in Social Sciences: Approaches and Rationale. J. Res. 2017, 8, 37. [Google Scholar] [CrossRef]
  123. Klein, J.T. A taxonomy of interdisciplinarity. In The Oxford Handbook of Interdisciplinarity; Oxford University: Oxford, UK, 2010; Volume 15, pp. 15–30. [Google Scholar]
  124. Penprase, B.E. Interdisciplinary science. In STEM Education for the 21st Century; Springer: Cham, Switzerland, 2020; pp. 93–119. [Google Scholar]
  125. Schary, D.P. Breaking Silos: Interdisciplinary Research in Kinesiology. 2014. Available online: https://ir.library.oregonstate.edu/concern/graduate_thesis_or_dissertations/jq085n95f (accessed on 23 July 2021).
  126. Szostak, R.; Gnoli, C.; López-Huertas, M. Interdisciplinary Knowledge Organization; Gabler, JASIST; Springer: Berlin/Heidelberg, Germany, 2016. [Google Scholar] [CrossRef] [Green Version]
  127. A Brown, M. Market failures and barriers as a basis for clean energy policies. Energy Policy 2001, 29, 1197–1207. [Google Scholar] [CrossRef]
  128. Mulder, P.; de Groot, H.L.; Hofkes, M.W. Explaining slow diffusion of energy-saving technologies; a vintage model with returns to diversity and learning-by-using. Resour. Energy Econ. 2003, 25, 105–126. [Google Scholar] [CrossRef] [Green Version]
  129. Rohdin, P.; Thollander, P. Barriers to and driving forces for energy efficiency in the non-energy intensive manufacturing industry in Sweden. Energy 2006, 31, 1836–1844. [Google Scholar] [CrossRef] [Green Version]
  130. Faber, J.; Markowska, A.; Nelissen, D.; Davidson, M.; Eyring, V.; Cionni, I.; Selstad, E.; Kågeson, P.; Lee, D.; Buhaug, Ø.; et al. Technical Support for European Action to Reducing Greenhouse Gas Emissions from International Maritime Transport. Available online: https://ec.europa.eu/clima/system/files/2016-11/ghg_ships_report_en.pdf (accessed on 23 July 2021).
  131. Faber, J.; Behrends, B.; Nelissen, D. Analysis of GHG Marginal Abatement Cost Curves. Available online: https://cedelft.eu/wp-content/uploads/sites/2/2021/04/7410_defreportJFSD.pdf (accessed on 10 July 2021).
  132. Fleiter, T.; Worrell, E.; Eichhammer, W. Barriers to energy efficiency in industrial bottom-up energy demand models—A review. Renew. Sustain. Energy Rev. 2011, 15, 3099–3111. [Google Scholar] [CrossRef]
  133. Broto, V.C. Urban Energy Landscapes; Cambridge University Press: Cambridge, UK, 2019. [Google Scholar] [CrossRef]
  134. Wang, J.-W.; Cheng, C.-H.; Huang, K.-C. Fuzzy hierarchical TOPSIS for supplier selection. Appl. Soft Comput. 2009, 9, 377–386. [Google Scholar] [CrossRef]
  135. Coffey, L.; Claudio, D. In defense of group fuzzy AHP: A comparison of group fuzzy AHP and group AHP with confidence intervals. Expert Syst. Appl. 2021, 178, 114970. [Google Scholar] [CrossRef]
  136. Mohammadi, L.; Meech, J.A. AFRA—Heuristic expert system to assess the atmospheric risk of sulphide waste dumps. J. Loss Prev. Process. Ind. 2013, 26, 261–271. [Google Scholar] [CrossRef]
  137. Xu, Z.; Chen, J. An interactive method for fuzzy multiple attribute group decision making. Inf. Sci. 2007, 177, 248–263. [Google Scholar] [CrossRef]
  138. Mu, Z.; Zeng, S.; Wang, P. Novel approach to multi-attribute group decision-making based on interval-valued Pythagorean fuzzy power Maclaurin symmetric mean operator. Comput. Ind. Eng. 2021, 155, 107049. [Google Scholar] [CrossRef]
Figure 1. Research design and sequences of the study.
Jmse 09 01113 g001
Figure 2. Categorization of key barriers in the shipbuilding industry. Resource; [12,22,32,33,38,44,69,71,74,106,127,128,129,130,131,132].
Jmse 09 01113 g002
Figure 3. Transdisciplinary approach to design and develop the framework.
Jmse 09 01113 g003
Figure 4. The hierarchical prioritizing of the barriers to energy efficiency by AHP for a shipyard.
Jmse 09 01113 g004
Table 1. Ranking of disciplines.
Disciplines Human ElementOperationTechnology & InnovationPolicy & RegulationEconomics
Companies
ISY0.0310.1400.1440.1250.560
Table 2. Ranking of criteria.
CriteriaSeverity of BarriersSimplicity of Barriers RemovalImpact of Barriers Removal to Energy EfficiencyImpact of Barriers Removal to Economic Performance
Company
ISY0.1020.1180.2670.513
Table 3. Ranking of the ISY barriers in each discipline.
Barriers T1 T2 T3 E1 E2 E3 E4 E5 E6 E7 E8 E9 E10 E11 O1 O2 O3 O4 O5 H1 H2 H3 H4 H5 H6 H7 H8 H9 H10 H11 H12 H13 P1 P2 P3 P4
ISY
Ranking213410278153669125436789111052541734213
Table 4. Final ranking of ISY.
BarriersT1T2T3E1E2E3E4E5E6E7E8E9E10E11O1O2O3O4O5H1H2H3H4H5H6H7H8H9H10H11H12H13P1P2P3P4
ISY
Ranking62114123910175881314192221202829303133322724272623292518161517
Publisher’s Note: MDPI stays neutral with regard to jurisdictional claims in published maps and institutional affiliations.

