Article

A Spatial Analysis of the Potentials for Offshore Wind Farm Locations in the North Sea Region: Challenges and Opportunities

1
Faculty of Spatial Sciences, University of Groningen, 9700 AE Groningen, The Netherlands
2
Faculty of Science and Engineering, University of Groningen, 9700 AE Groningen, The Netherlands
*
Author to whom correspondence should be addressed.
ISPRS Int. J. Geo-Inf. 2020, 9(2), 96; https://doi.org/10.3390/ijgi9020096
Submission received: 10 January 2020 / Accepted: 27 January 2020 / Published: 4 February 2020

Abstract

:
Over the last decade, the accelerated transition towards cleaner means of producing energy has been clearly prioritised by the European Union through large-scale planned deployment of wind farms in the North Sea. From a spatial planning perspective, this has not been a straight-forward process, due to substantial spatial conflicts with the traditional users of the sea, especially with fisheries and protected areas. In this article, we examine the availability of offshore space for wind farm deployment, from a transnational perspective, while taking into account different options for the management of the maritime area through four scenarios. We applied a mixed-method approach, combining expert knowledge and document analysis with the spatial visualisation of existing and future maritime spatial claims. Our calculations clearly indicate a low availability of suitable locations for offshore wind in the proximity of the shore and in shallow waters, even when considering its multi-use with fisheries and protected areas. However, the areas within 100 km from shore and with a water depth above –120 m attract greater opportunities for both single use (only offshore wind farms) and multi-use (mainly with fisheries), from an integrated planning perspective. On the other hand, the decrease of energy targets combined with sectoral planning result in clear limitations to suitable areas for offshore wind farms, indicating the necessity to consider areas with a water depth below –120 m and further than 100 km from shore. Therefore, despite the increased costs of maintenance and design adaptation, the multi-use of space can be a solution for more sustainable, stakeholder-engaged and cost-effective options in the energy deployment process. This paper identifies potential pathways, as well as challenges and opportunities for future offshore space management with the aim of achieving the 2050 renewable energy targets.

1. Introduction

The EU Commission 2019 Fourth Biennial Progress Report on Climate Action underlined that the vast majority of EU countries are on track to reaching the 2020 renewable energy sources target (20% of EU energy from renewables). However, in order to sustain these levels in 2021, most member states will need to continue increasing their efforts in deploying renewables [1]. Additionally, bold energy goals for 2030 and 2050, formulated in legally binding documents [2,3,4], indicate the urgency to prioritise the transition towards cleaner means of producing energy.
A key issue that has obstructed energy targets set for 2050, which are to limit the global warming below 2 °C, is that the future extension of the energy infrastructure could lead to conflicting claims for the use of the onshore space [5,6]. Given the growing land use pressure and the social opposition against local wind farm projects [7] or solar fields, offshore space is increasingly perceived as a viable option for scaling up the deployment of energy infrastructure [5,8]. In particular, the North Sea is an attractive sea basin for renewable energy infrastructure, due to its reliable resources of wind power, relatively shallow waters [9,10,11,12] and the proximity of developed energy and electricity markets [13].
However, as recent studies and policy documents have underlined [14,15], the efficient management of the highly occupied offshore space in the North Sea [6] is essential in reaching the 2050 energy deployment goals. Previous research [8] already indicated serious scarcity of suitable space (water depth above –55 m) in the North Sea, with an estimation of only 3% unclaimed space. This could host 47–84 GW (3.6–6.4 MW/density), which is considerably lower than the 180 GW needed to decarbonise the power sector of the North Sea countries by 2045 [16]. Therefore, it is not only the technological readiness [17] but also societal, institutional and spatial aspects that need to be coordinated [18]. Moreover, according to the Wind Europe Central Scenario for the deployment of renewable energy in the North Sea basin, by 2030, up to 48 GW installed capacity will be fully commissioned [19]. This represents more than five times the installed capacity in the North Sea in 2016. Hence, there is a need to assess the possibilities for multi-use of space, which consequently foregrounds the importance of coordinating and planning the marine space.
The difficulty of coordinating the marine space in the North Sea from an integrated perspective is mainly due to the fragmented, sectoral, and nationally focused planning tools for offshore space [6,20,21]. Attempts to assess the spatial challenges and tensions have been conducted mainly at the country level [22], while there have been few studies that analyse the status-quo of interactions between current offshore activities and renewable energy deployment from an integrated North Sea perspective. Projects such as WINDSPEED discuss the interactions between wind energy installations and other offshore activities in the North Sea [6]. In addition, several studies (Table A1) have explored the concept of multi-use in the marine space, including its drivers, risks and benefits. Nevertheless, very little is known regarding the amount of available space, when considering the different options for multi-use with offshore wind farms.
Difficulties in allocating space for offshore energy infrastructure might hamper the pursuit of ambitious energy goals. In the meantime, finding suitable space for offshore wind farms is greatly affected by the interaction with other offshore activities. Hence, the objective of this paper is to indicate the opportunities and challenges in the allocation of space for wind energy infrastructure and generation capacity in the North Sea, while considering its interaction with other offshore activities. We will present: (1) an inventory of the existing spatial claims on the North Sea using a Geographical Information System, (2) the main opportunities/constraints and requirements with regards to interactions between traditional claims and the offshore wind infrastructure and (3) possible spatial implications of future offshore spatial claims on availability of space for wind energy. The novelty of the study, as well as its main scientific contribution, can be seen through the development and visualisation of four scenarios that depict both the potential and the constraints of future offshore wind farms in the North Sea. This will be realised through a mixed-methods approach, which brings together spatial components of site allocation, the different approaches for managing interactions offshore and projections for future increase or decrease of spatial claim of different activities.
This study contributes to the understanding of conflict resolution alternatives for the deployment of renewable energy infrastructure in the North Sea. Additionally, this research can be seen through the assessment of the critical locations and cost-effective spatial options for the offshore wind farms, which can support policy development and decision-making. By supporting a roadmap of energy deployment in the North Sea, the objectives of this study are in line with the UN Sustainable Development Goal for affordable and clean energy (SDG 7).
The research area includes the Exclusive Economic Zones (EEZ) of the Netherlands, Denmark, Germany, Sweden, Norway, Scotland and England (Figure 1). The upper delimitation of the research area is formed by the OSPAR area boundaries. In this study, we do not consider the territorial waters of the analysed maritime areas (up to 12 nautical miles from the coastal line), due to the multitude of spatial conflicts, the large number of protected areas (Wadden Sea in the Netherlands, Germany and Denmark) and the visual impact that wind farms would have on the coastal landscape. These negative externalities have all been strongly opposed by society.
Following this introduction, Section 2 continues by discussing the methods and the selection of data and scenarios used in this study. Section 3 discusses the main results from the literature review, the expert and stakeholder interviews, in the form of four scenarios with associated maps. A further analysis of the findings occurs in Section 4, where the outcomes of the scenarios in terms of available space and techno-economic requirements are discussed. Section 5 discusses the main conclusions by targeting the key elements that need to be considered in the space allocation process for future wind infrastructure.

2. Materials and Methods

For this study, a mixed-methods approach was applied. It combined (1) desk research for the collection, analysis and interpretation of qualitative and quantitative data with (2) desk research combined with field research involving expert interviews for scenario development and (3) the visualisation and quantification of scenarios (see methodological steps in Figure A1). In more depth, this was conducted as follows:
  • The desk research conducted as a literature review identified the status-quo of spatial claims and interactions in the North Sea, which implied: (1) the synthesis of the main offshore activities from the Marine Spatial Plans (MSP) (qualitative), followed by, (2) the collection, classification and visualisation of georeferenced data sets for the identified current activities, using an open-source geographic information system (QGIS, quantitative).
  • Furthermore, the desk research conducted as a literature review provided an understanding of the existing planning options for the management of the offshore space and trends for future development of offshore activities. This information was the result of reviewing: (1) legal documents (MSP) and (2) reports/projections for future use.
  • The initial assumptions formulated for the future management of offshore space in relation to deployment of offshore wind farms were validated and reformulated through semi-structured interviews (field research).
  • Lastly, the finalised assumptions (in the form of four scenarios) and their spatial implications were visualised and quantified using a Geographic Information System (GIS).

2.1. Literature Review

The legal document analysis contributed to a better understanding of the main offshore activities, which were prioritised through international and national laws, and their interaction with offshore wind farms. The synthesis of legal (national priorities, constraints, practices) and technical details (safety zones e.g., buffer of 500 m around O&G pipelines) is the result of the literature review and document analysis.
In addition to the MSP analysis, a review of previous research on the multi-use of space was conducted (Table A1). The analysis focused on the opportunities and the threats (political, societal, technological drivers/barriers) as well as the strengths and weaknesses (societal, technological, environmental added value/impacts) for the different possible co-location options for existing offshore activities and offshore wind farms. This led to a classification of three types of current practices for interactions with the offshore wind energy infrastructure: no-go/exclusion areas (mainly due to safety measures), co-location (possibly with adaptations, following the impact assessment and the agreements between involved stakeholders) and synergies (currently seen as a long term option for gaining added value and joint use of resources/mutual benefits). Additionally, concrete projections for future developments in offshore space use were identified in relation to: protected areas (national reports, assessments of valuable and vulnerable areas), oil/gas infrastructure (national reports, projections) and shipping routes (projections from the ACCSEAS project). The literature review represented the basis for formulating the initial hypothesis regarding interactions offshore and the initial set of codes used for the semi-structured interviews.

2.2. Collecting Quantitative Data: Individualised GIS Repository and Data Analysis

To map the distribution and spatial coverage of offshore activities and calculate the available space for offshore wind farms, we compiled an inventory of spatial data from different sources and in different formats (Table 1).
All acronyms in this text are defined in Table A2.

2.2.1. Management and Processing of Data Sets.

The management of the GIS datasets included the adjustment, alignment and manual geo-referencing in order to achieve a complete and coherent overview of the activities in the North Sea area with: (1) a common coordinate system, European Datum 1950-ED50, (2) common denomination and (3) a coherent graphic representation. Another important step in the data collection process was verifying the validity of the datasets by comparing them to datasets from official documents at the national level (Maritime Spatial Plans) and online portals (OSPAR, Wind Europe interactive map).
The datasets describing fishery activities were compiled by merging two different data sources (Table 1). Thus, the classification of fishing intensity categories, as detailed in scenarios, resulted from comparing the OSPAR raw data with the mean values presented in other studies [23]. The rationale behind this was to best represent the reality of fishing intensity in the North Sea. Therefore, we used two categories: (1) medium intensity, with values between 39 and 97 hours of fishing, and (2) high intensity, with values above 97 hours of fishing.

2.2.2. Scenario (2050) Visualisation-Spatial Data

The studied area included the Exclusive Economic Zones of the countries with the largest shares in the offshore part of the North Sea (excluding Belgium and France). Sweden is included in the analysis as it is part of the ENSYSTRA project, which is funding this research. For the GIS visualisation of the scenarios developed for the future interactions and development offshore, we used the following data source:
  • Available datasets (Table 1), with the filters isolating features with the status: planned/proposed/licensed (by case).
  • The scoping areas for offshore wind developments, 2025 to 2030, from different sources, (by country). The main sources are official open-source datasets, verified with governmental documents, where available (MSP), and documents released by Energy Agencies (Danish Energy Agency), as depicted in Table 2.
  • Digitisation of official maps (reports and governmental open maps) indicating the future proposed spatial claims (e.g., proposed protected areas).
  • The calculation and digitisation of possible future claims using the status-quo and projections for future claims (e.g., shipping routes projections from ACCSEAS project—Accessibility for Shipping, Efficiency Advantages and Sustainability—http://www.accseas.eu/). The calculation rules for the width of shipping lanes and their safety areas, according to projections for shipping density from the ACCSEAS project, have been detailed in Figure A2.

2.2.3. Mapping the Spatial Potential for Renewable Energy Production

The available space in the status-quo is obtained by excluding (geo-processing tool difference) the surfaces occupied by the existing offshore activities, from the total studied area, which are presented in Table 1. For visualising the availability of space in the four developed scenarios, we identified the spatial implications for each of the proposed assumptions for the future development of offshore activities and interactions with the offshore wind infrastructure. The spatial implications of the scenario assumptions are presented in Tables 6, 7, 8 and 9, in the results section.
In mapping the available space, a number of factors which influence the effective site location of wind farms (geology of the seabed, birds’ migratory routes, etc.) were not included in this study. These requirements can represent objectives for future studies, provided that the data becomes available. However, techno-economic factors such as the water depth and the distance to shore play a crucial role in the cost-effective allocation of offshore wind farms and the routing of cables [24]. These factors are directly related to the costs of turbines, foundations, grid connections, transformer platforms and the installation, as well as operation and maintenance costs [25]. Based on previous studies [26], we classified water depth into three categories: above –55 m (for monopole and jacked/tripod), –55 m to –120 m and below –120 m (see Figure 2). Regarding the distance to shore, we applied the classification from Möller et al. (2012) for the EEZ: 10-50 km from shore, 50-100 km from shore and beyond 100 km from shore (see Figure 2). The results indicate the availability of space when opting for different space management strategies in relation to the investments needed.

2.3. Semi-Structured Interviews

In order to validate and complement the qualitative data gathered through the literature review, we conducted a set of 17 semi-structured, in-depth interviews, which engaged a wide range of relevant stakeholders from the Netherlands, Germany, Denmark, Sweden, Norway and Scotland.
The questions used were based on the initial set of codes deduced from the literature review (examples in Table A3) and focused on the key themes: current spatial claims, spatial interactions with OWF, key stakeholders’ engagement, conflict mitigation strategies, drivers/barriers of multi-use with OWF, and potential future offshore developments. This process allowed for the identification of: (1) national targets/ambitions for OWF deployment, (2) national approaches and uncertainties regarding the potential multi-use of space options, (3) main policy, technological, economic, societal drivers/barriers influencing the allocation of space for OWF and (4) national projections for future developments of offshore activities (national and North Sea level).
The interviews allowed for a detailed and complex understanding of the underlying mechanisms behind different spatial planning traditions related to the multi-use of offshore space. All interviewed stakeholders gave their informed consent before their participation in the study. The protocol for this study was approved by the Research Ethics Committee of the Faculty of Spatial Sciences at University of Groningen, the Netherlands. Together with the literature review findings, the insights obtained through the interview analysis were used to formulate four scenarios with regard to the potential future development of the offshore wind activities and their spatial implications.

2.4. Scenario Formulation

The four exploratory scenarios developed in this paper can help challenge the existing assumptions for future offshore development and indicate the spatial implications of different options for space management in relation to the offshore energy deployment. The scenario formulation engaged the previous phases of the research and was concluded with building the scenario narrative (desk research). The scenarios were formulated based on two major factors: the national interpretation of the EU energy targets (ambitious or low-energy targets) and the planning approaches (integrated or sectoral) (Figure 3).
Firstly, ambitious EU energy targets fostered the formulation of scenarios for the number of GWs to be deployed in the North Sea by 2030 (e.g., Wind Europe Central Scenario with 48 GW installed capacity) and 2050 (e.g., World Energy Council Netherlands (2017) of 250 GWs). However, these targets have been interpreted differently at the national level, displaying different levels of political commitment to fostering the deployment of renewables offshore, as detailed in the Results section. The uncertainty of political engagement, as indicated by the unclear national energy targets beyond 2030, was captured in the scenario formulation (ambitious/low-energy targets) to exemplify the effect on energy deployment offshore and its associated spatial implications.
Secondly, the planning approach (sectoral or integrated) for the spatial management of the North Sea plays an important role in the formulation of future scenarios of energy infrastructure deployment. Scenarios C and D are based on a sectoral planning approach, which focuses on individual sectoral objectives and goals (shipping, nature protection, fishing, etc.), without considering synergies and the multi-use of space. Scenarios A and B are based on an integrated planning approach in the process of space allocation, and consider the spatial and temporal interrelations between activities, multi-use of space and participatory planning processes.
Additionally, based on policy reports and interviews, we included in each scenario, three variables (external trends) related to future offshore spatial claims: (1) the measures for protecting the maritime environment, (2) the depletion of oil and gas resources in the North Sea and (3) the maritime traffic density, routes and transportation types.
Lastly, based on the in-depth analysis of existing studies on the multi-use of space between offshore activities, we synthesised the main social and techno-economic drivers/barriers, benefits and added values of the potential interaction between sea uses and offshore wind energy infrastructure.

3. Results

3.1. Mapping of Current Activities as Represented in the Marine Spatial Plans (MSP)

From a transnational spatial planning perspective, the North Sea basin is characterised by diverse and fragmented legislative frameworks for space management. There is a growing number of collaborative initiatives regarding energy transition, environmental protection and food security. Within local legal frameworks, the policy for offshore wind has been formulated for different sectors and in separate policy networks because of cost-efficiency. When discussing the overall management of the marine environment resources and the use of space, it was recently highlighted that the legal framework is still fragmented [27], nationally focused and rarely synchronised.
An important step forward is represented by the introduction of the use of marine space and resources to benefit the economic development and the marine environment, which has at its basis the ecosystem approach [22,28]. On a general level, the MSP addresses three dimensions of the sea, namely the seabed, the water column and the surface. This emphasises the possibility of considering the multi-functional use of space, where time is an essential component [28].
Through the MSP framework, the activities are prioritised either according to the national legal framework (e.g., the Mining Act, the Water Act and the Offshore Wind Energy Act, in the case of the Netherlands) or according to the international regulations (e.g., the Fisheries Act, UNCLOS—international law for shipping, Natura 2000, Habitats Directive—for the natural protected areas). Therefore, the MSP provides legal certainty and, to a certain degree, predictability, also as a result of cross-sectoral integration [29]. However, in relation to the international and national laws, the spatial interaction and possible synergies between the different offshore activities and the renewables are still not clearly defined across the North Sea countries.
This makes the process of allocating offshore space, through the MSP, open to debate and susceptible to change in the future. Based on the analysis of the MSP (and its equivalent policy documents, where MSP was not available) of the studied area, a summary of the current situation regarding interactions between the activities offshore and the wind energy infrastructure, has been compiled in Table 3. The conclusions presented are generic for all North Sea countries (unless explicitly indicated) and have been validated through stakeholder interviews. The spatial implication of the current spatial management options for energy deployment is illustrated in Figure 4.
For the quantification of the current available space, we excluded all major offshore activities which had designated areas (therefore, fishing areas are not part of this exclusion map). The remaining available space is concentrated in areas with a water depth of between –55 m to –120 m, accounting for 146,374 km 2 , which can host 498–937 GWs, at a power density of between 3.6 and 6.4 MW/ km 2 [16]. However, a water depth of below –55 m imposes technical restrictions for offshore wind farms. In these cases, with technological improvements and reductions in the cost of technologies, large-scale floating wind farms could be installed in the North Sea.
The more cost-effective option would be to focus on the areas with a water depth of above –55 m (for monopile and jacket foundation types), where the available space is limited to 55,815 km 2 , area that can host 190-357 GWs. However, these calculations do not take into account the conflict with fishing activities, shipping (outside IMO and national routes) and future developments of offshore activities. These constraints are part of the scenarios developed in this study.

3.2. Scenario Development and Visualisation

In the development of the scenarios for the spatial availability for offshore wind farm deployment up to the year 2050, a number of internal and external drivers were considered. The assumptions regarding the evolution of those drivers are based on trends identified during the literature review and interviews.

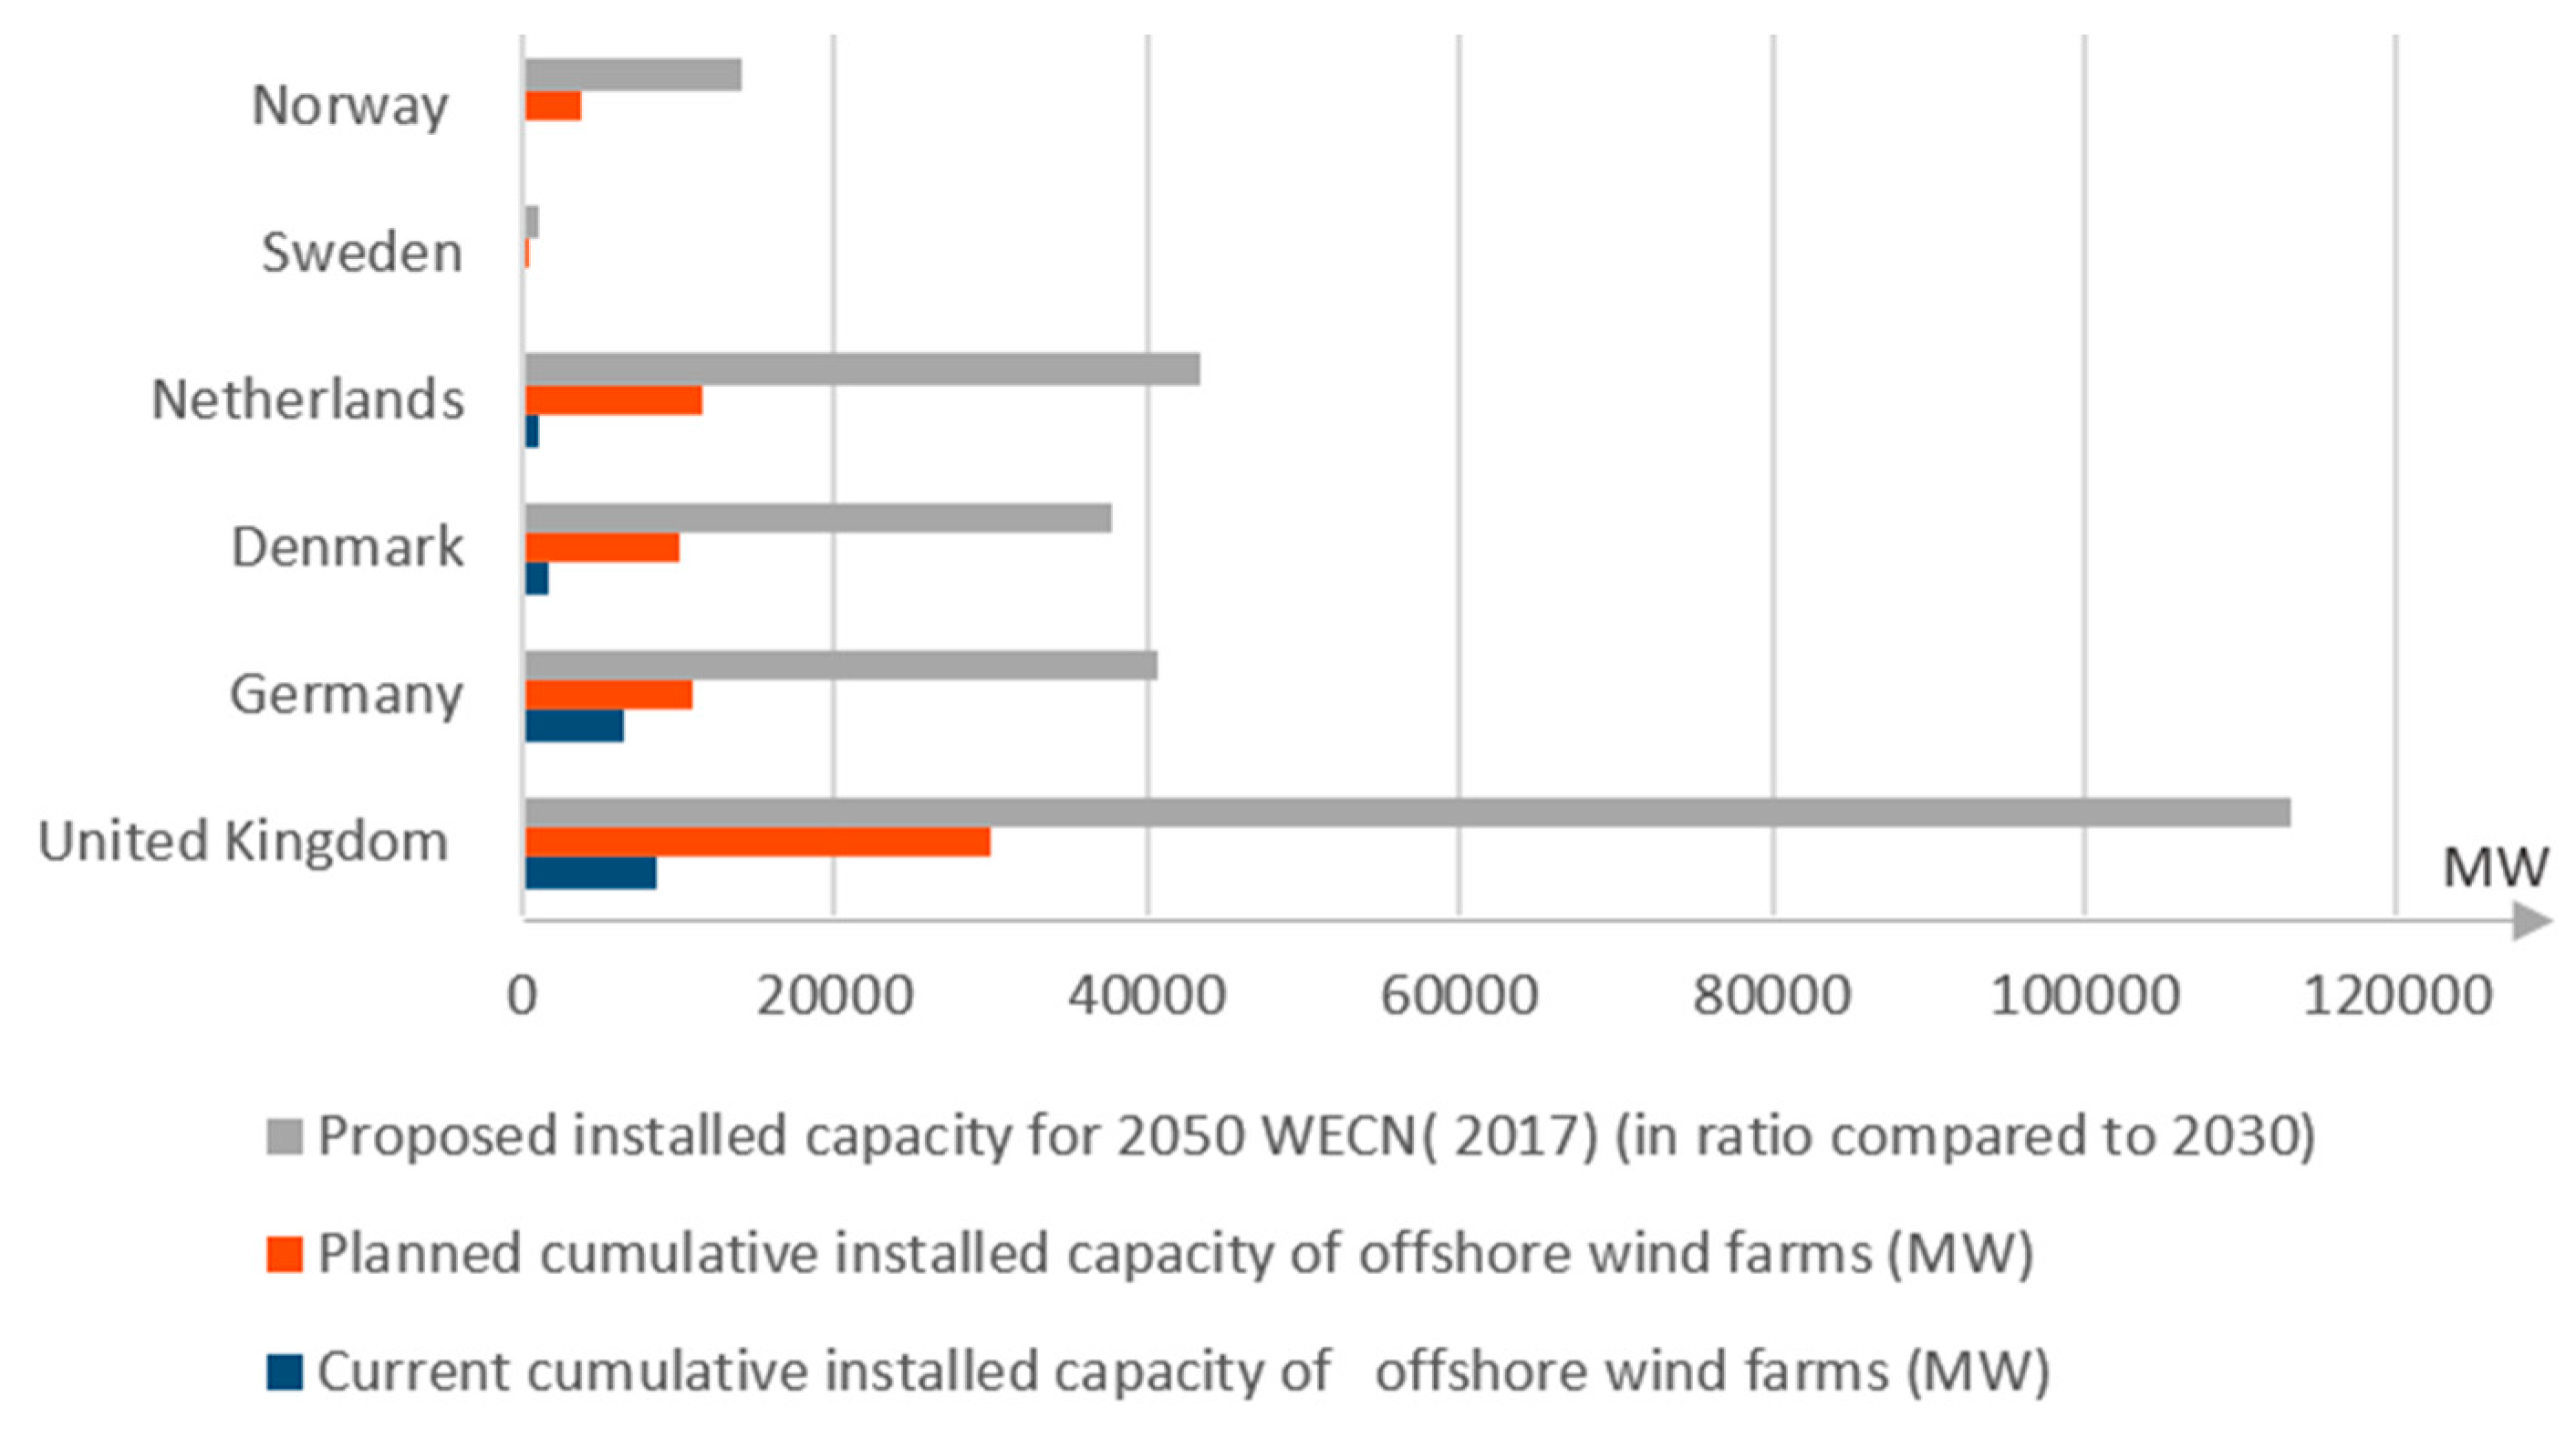
3.2.1. External Drivers and Trends

External drivers. EU and National energy targets:
One of the main external drivers dictating the speed of the energy transition, through renewable deployment, is represented by the national interpretation of EU Energy goals for the coming period (2025/2035). There are still no clear or concrete energy targets for 2030 and 2050 in terms of GWs being deployed in the EEZ for most of the countries in the North Sea. Moreover, the conducted interviews and literature review revealed that there are almost no legally binding engagements from the national governments, which has a clear negative influence on stakeholder’s decisions to invest in offshore wind farms.
The difference between the analysed countries, when looking at the current and proposed cumulative capacity of offshore wind farms (2030 and 2050), is illustrated in Figure 5. The increase in energy targets is evidence that the deployment of the renewable energy infrastructure should be accelerated. When comparing the current planned cumulative capacity of offshore wind farms of the North Sea countries, in relation to the surface of their EEZ (Figure 5 and Figure 6), we can conclude:
  • UK has the highest energy targets, the largest EEZ and high current cumulative capacity
  • Germany has high-energy targets, spatial scarcity and high current cumulative capacity
  • The Netherlands and Denmark have high-energy targets, spatial scarcity and a low current cumulative capacity
  • Norway has low-energy targets, a large amount of offshore space and a low current cumulative capacity
In the case of Sweden, there is still uncertainty with regard to national targets for deploying offshore wind farms in the North Sea part of the EEZ. This can also be due to the overlap of multiple spatial interests, from intensely transited shipping routes, maritime protected areas, military areas, commercial fishing, etc. While solutions for the overlap between multiple uses are being considered in the preliminary MSP (multi-use between wind farms and nature protected areas), there are cases of delays in the wind farms authorisation process due to political disapproval (Administrative Board of Halland). This further emphasises the necessity to consider the policy drivers.
As indicated in Figure 6, there is a clear correlation between the current cumulative installed capacity and the proposed capacity for 2030. The high uncertainty regarding the interpretation of EU goals at the national level has been captured in the proposed scenarios, as is detailed in the methods section.
Sources: 2030 capacity: UK—UK Government (Industrial Strategy, Offshore Wind Sector Deal), Germany—Draft site Development Plan 2019 for the North and Baltic Sea, Denmark—Danish Energy Agency (Large-scale offshore screening), The Netherlands—The Climate Agreement, Sweden—Wind Europe Central Scenario for Sweden, Norway—Integrated Management of the Marine environment of the North Sea and Skagerrak. 2050 capacity: The North Sea Opportunity [11].
External trends. Future spatial claims:
The management of the dynamic marine space relies on the continuous interaction between national jurisdiction over exploiting resources in the EEZ (up to 200 NM) and the international regulations established primarily through UNCLOS (Law of the Sea Convention) [31]. Moreover, global trends, such as the transition from fossil fuels to renewables, changes in global economies and international concerns regarding the environmental protection of the network of MPAs [34], will have an impact on the future marine spatial claims in the North Sea region. Therefore, in the formulation of all four scenarios, we considered a number of studies that discuss the potential development of three major offshore spatial claims as a result of the following external influences: growing/stagnation of transportation by sea, decommissioning of oil and gas infrastructure and the degree of flexibility regarding the protection of the maritime environment (interplay between the urgency of renewable energy deployment and international goals for environmental protection) (see Table 4).
The increase of traffic density offshore after 2020 is argued to impose barriers for the deployment of large-scale renewable energy infrastructures in the North Sea (ACCSEAS project). However, more recent studies (NorthSEE), indicate a slow growth rate of shipping predicted by the low level of GDP growth (IMF). Indeed, our calculations of the required space according to the future projected traffic densities (ACCSEAS project) resulted in similar lane widths compared to the current designated routes. The calculation rules and the values for the resulted lane widths for the projected traffic densities can be found in Figure A2.

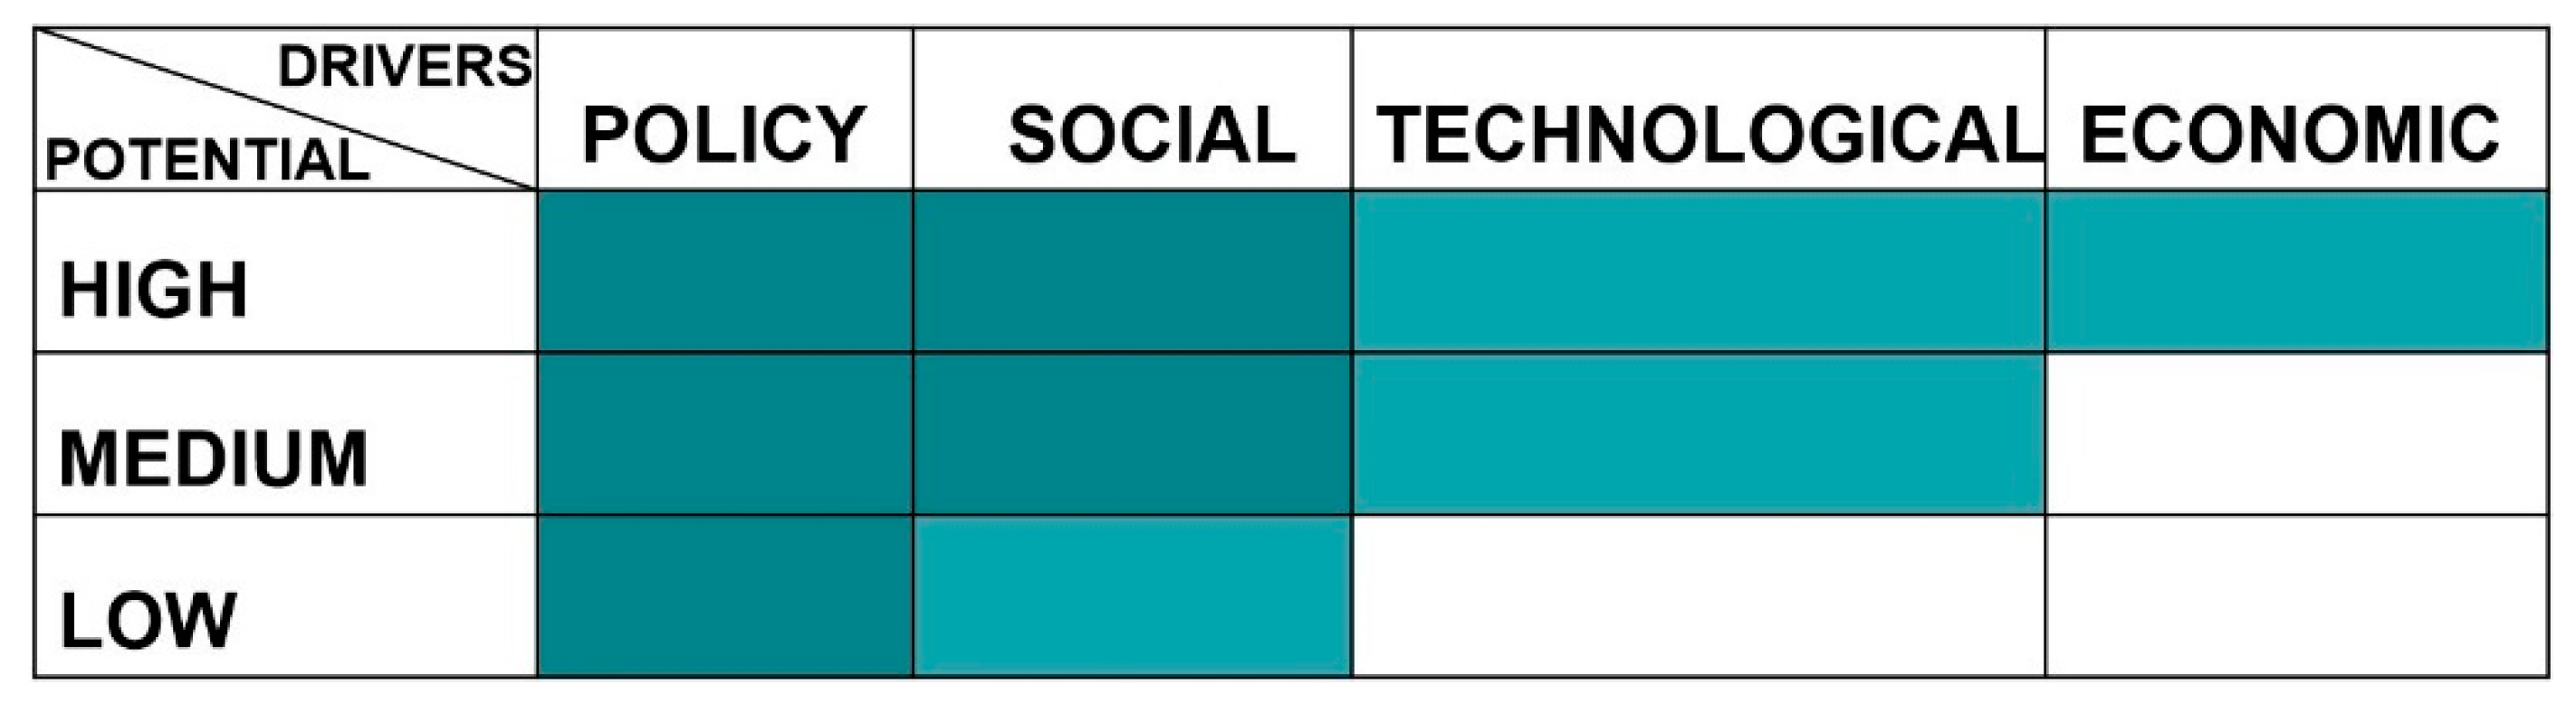
3.2.2. Internal Drivers for the Multi-Use of Space

Internal drivers: Multi-use of space
The current literature on multi-use of space, that is the intentional co-location of activities, stresses its multiple benefits in terms of techno-economic and societal gains [38,39]. Firstly, the techno-economic added value (through research and innovation) is referring to the development of new technologies which offer novel ways to exploit sea resources and improve the conservation status. Examples of benefits related to the multi-use with wind farms are the shared maintenance and operation costs, reduced fatigue loads of wind turbines (due to wave attenuation by seaweed farming) (MERMAID) but also opportunities for habitat restoration [40]. Other possible combinations include activities such as fisheries, tourism and cultural heritage [38], wind farms and aquaculture or protected areas for fish and wind farms [41] (Table A1). Secondly, co-location of activities can be regarded as a solution for the scarcity of space offshore, which is emphasised in the MSPs [14,42]. This addresses the mediation of the increasing conflicts between fisheries and offshore wind farms that have been proposed to be developed in areas with valuable fishing grounds.
While recognising the potential of combining activities offshore from a techno-economic perspective exists [39], actually pursuing multi-use is far from evident. Instead, criteria such as fairness, equity, transparency, sustainability and consideration of synergies that can emerge (both spatially and legally) should be considered [43]. Therefore, only considering the techno-economic drivers and barriers as a condition for assessing the spatial interaction between activities is insufficient. In the MUSES project, the need for actors to also actively engage in a joint search for synergies has been recommended, which would require at least two sides: both uses or one use and a regulatory body. The SAMOS project adds that, in doing so, also extensive research into, for example, hazards, risks, actual impacts and changes in policies to pursue implementation would be required. Hence, research and experiments are key prerequisites for multi-use to become a reality.
The assessment of different offshore activities combinations was based on the analytical framework developed through the MUSES project [44,45]. Therefore, we have addressed through the literature review and expert opinion (semi-structured interviews) a number of policy, social, technological and economic drivers and barriers in each of the studied countries. The assessment was realised and was applied to the combination between offshore wind farms and fisheries, protected areas, military areas, shipping, oil and gas (Table 5, Figure A3). The objective of the interviews was to gain insights regarding the current barriers and opportunities of co-location with offshore wind farms, in the North Sea. The results of the interviews (classification of three types of potential for multi-use, Table 5) revealed a low level of intentional joint co-location of activities in the maritime space, as well as considerable differences in approaches among the analysed countries.
One of the most debated co-locations is between the offshore wind farms and fishing activities. With more restricted fishing areas in the North Sea, the opposition of the fisheries community in the face of large offshore energy deployment has seen an increase in the last years. Despite the fact that countries like Scotland and England allow the navigation of fishing vessels and passive fishing in offshore wind farms, this has not been a common practice amongst the fishermen. The main barriers identified by representatives of fishing organisations in Scotland are related to safety of navigation, insurance (no coverage for damages in wind farms) and lack of cooperation/knowledge exchange with the wind farm developers.
A general barrier in increasing the potential for the multi-use of space is represented by the lack of knowledge with regards to techno-economic implications and the environmental impacts of combining activities in the same area. As emphasised by the majority of the interviewed stakeholders, the policy drivers can boost, through financial and regulatory mechanisms, the investments in pilot projects testing the effectiveness and feasibility of combining offshore wind infrastructure and other users of the maritime space. The degree of multi-use potential, based on the likelihood of meeting the requirements for each combination for the analysed countries, is presented in Table 5 and detailed in Figure A3. In assigning the potential for co-location with offshore wind infrastructure for each combination, the following categories have been distinguished, based on the stakeholder interviews and literature review:
  • High potential (legally binding): strong policy driver based on regulatory mechanisms (legally binding permission), which permits co-location under certain conditions (impact assessments: Scotland/England). High societal benefits and support (e.g., engaging the coastal fishing communities in pilot projects: England/Sweden) supported by increased cross-sector cooperation and knowledge transfer (transfer of knowledge from fishing/aquaculture industry to offshore wind developers). Increased initiatives for advancements in technological adaptation and economic feasibility, financial support in the form of insurances for potential damages and accidents offshore (not currently practiced) and technological adaptation of equipment for an effective and safe co-location (not currently practiced).
  • Medium potential (policy driven): flexible policy based on financial and regulatory incentives (e.g., transition funds: The Netherlands), which can foster the incipient advancements for the technical and process adaptation of the co-located activities (e.g., pilot projects aiming to address safety measures: The Netherlands-SOMOS project), high societal benefits and support capacity based on cross-sector cooperation and knowledge transfer (e.g., engaging different stakeholders in the decision-making process: part of the MSP process) and research advancements towards the mitigation of negative environmental externalities.
  • Low potential (society driven): rigid policy driven by societal impact pressures, environmental conservation pressures or space scarcity requirements, low technical and process adaptations of the co-located activities and minimum research advancements towards the mitigation of negative environmental externalities.
It should be noted that the assessment of different multi-use combinations per country (Table 5) is realised on a sectoral basis, relative to the current practices and potential (as resulted from interviews) in each case. Therefore, in terms of space allocation (scenarios), the percentages for multi-use which were considered vary depending on the activity and country and are detailed in Table A4 and Table A5 and in Table 6, Table 7, Table 8 and Table 9.

3.2.3. Scenarios for the Management of Space Allocation for Future Energy Deployment in the North Sea (2050) and Their Spatial Implications

Based on the variations between the two proposed primary drivers (high/low national ambitions for energy targets and the sectoral/integrated spatial planning approach, Figure 3), which are shaping the future deployment of offshore wind farms and potential future spatial claims in the North Sea, we developed four scenarios. In each of the four scenarios, secondary factors (shipping, oil and gas, nature-protected areas and multi-use of space) influenced by different options for space allocation (primary drivers) are detailed (including their spatial implications).
Each of the four scenarios capture the influence of primary drivers on the future development of the major offshore spatial claims, with reference to a number of base-line projections and trends identified in the existing literature and the conducted interviews. In the case of the maritime traffic (Table 4 and Figure A2), the space requirements for the projected shipping activity (NorthSEE Project/ACCSEAS predictions) would not exceed the already designated areas (IMO routes or locally designated routes), in any of the presented scenarios. For the GIS visualisation, more detail and corrections on designated routes have been presented in the scenarios for Denmark, the Netherlands and Germany, based on AIS data.
The changing energy production landscape in the North Sea basin, based on reduced fossil fuel use, is a major economic challenge [46,47,48]. However, there is a growing interest for the re-use/re-purpose of existing oil and gas infrastructure proposed to be decommissioned, due to the potential saving of societal costs and synergies with the emerging renewable infrastructure [37,47]. However, the actual date of decommissioning (COP: cessation of production) depends on many factors, mainly prices and operation costs, followed by cash flow and the investment level for new O&G projects [49]. Based on the current predictions, approximately a quarter of the existing infrastructure would be decommissioned by 2025 [50,51]. Taking into account the primary drivers for each developed scenario, our assumptions for 2050 range from: (a) complete decommissioning and removal (Scenario D) to (b) only achieving the 2025 projections (Scenario C). The area choice for decommissioning in each scenario is based on a number of already defined scenarios for decommissioning presented in Table A4.
The increased international (OSPAR) and national (policies) pressures can result in multiple possibilities for future spatial claims for protected areas in the North Sea under different planning approaches, and prioritised activities offshore. Our scenarios take into account a number of options from: (a) an increased awareness for protecting and linking valuable and vulnerable habitats [34], resulting in more areas designated to protection with no possibility of multi-use, to (b) a more flexible management which takes into account the possibility of combining activities under certain management conditions (Table A5).
SCENARIO A—ambitious energy targets/integrated planning approach:
The ambitious energy targets at the national level would rely on a high capacity for the design and enforcement of large-scale renewable energy infrastructure in the North Sea. Additionally, speeding up the energy transition in an integrated planning environment implies equitable management of the offshore space resources, considering the requirements of all offshore activities, in a balanced and possibly even mutually beneficial manner.
In a densely utilised space, this leads to the application of the multi-use concept for the interaction between offshore wind farms and maritime protected areas (Table A5), fisheries, military areas, or oil and gas infrastructure (Table 6). As detailed in previous projects (Table A1), the successful co-location of two offshore activities involves a combination of strong policy drivers, tools and platforms for the interaction, communication/data exchange between stakeholders, substantial financial incentives to foster technological adaptation (pilot projects and testing sites) and consistent research for the identification of hazards and risks in different multi-use scenarios.
In an integrated planning and high-energy goals context, the predictions for future claims of space include the designation of more protected areas (interviews/governmental reports) and the decommissioning and removal of oil and gas platforms (due to environmental concerns). The spatial implications of this scenario for the major offshore activities and the available space are presented in Table 6, Table 7 and Figure 7. More details can be found in Table A4 (oil and gas estimations) and Table A5 (potential future protected areas).
Our calculations indicate that the majority of the available space, at a water depth of above –55 m is located in the northern part of the Dutch and German EEZ, at a distance beyond 100 km from shore. In the Danish EEZ, the available space is also concentrated in the north of the EEZ. However, for a large-scale deployment and an efficient use of space, multi-use with fisheries must be considered in the new unlocked areas, after the decommissioning and removal of all offshore oil and gas installations.
SCENARIO B—Low renewable energy ambitions/integrated planning approach:
The low-energy targets at the national level would imply low political support for the deployment of large-scale renewable energy infrastructure in the North Sea. Additionally, an integrated planning context promotes the equitable co-location of the marine activities, which stresses the need for maximising synergies and minimising externalities. With low priority for energy deployment, this would result in reconsidering the ecological aspects of energy deployment and minimising the human impact on the marine environment (cumulative environmental impact).
In this scenario, the potential co-location is a result of policy drivers (coordination and integration of regulations) and capacity buildings for stakeholder interaction. However, the low investments lead to increased financial risks (liability/insurance concerns), and therefore, a delay in technological adaptation. Therefore, the multi-use concept is applied at lower scales, mainly between offshore wind farms and protected areas or fishing activity (Table 8).
The future spatial claims include the designation of a number of new protected areas and the decommissioning and removal of only 1/2 of the current potential for 2050 O&G platforms (environmental concerns and societal costs). The spatial implications of this scenario and the available space can be found in Figure 8, Table 9, Table A4 and Table A5 (oil and gas estimations / potential future protected areas).
This scenario illustrates the spatial implications of multiple new designated areas for nature protection, partial decommissioning of oil and gas infrastructure and partial multi-use possibilities with nature protected areas and fisheries. The northern part of the studied area (north of Scotland and Norway) contains optimal places for offshore wind farms, provided that strategies for multi-use with fisheries and designated corridors for shipping are put in place.
SCENARIO C—low-energy targets/sectoral planning approach:
Maintaining the renewable energy goals at a low level for 2050 would lead to the slow deployment of wind farms in the maritime areas and increased costs of installation and transportation of electricity. Furthermore, following the current planning approaches, the transnational dialogues would continue to take place on a sectoral basis, and not under the MSP umbrella. Therefore, in this scenario, the imbalances of power between sectors would dictate the priorities for offshore management of space.
In a sectoral planning context, the social and environmental pressures (fisheries organisations and protected areas’ agencies) led to a higher consideration of their spatial claims (more protected areas, restrictions of building on fishing grounds). The management of offshore space is therefore based on the exclusion of activities (sectoral planning), whereas the multi-use of space is not considered.
The assumptions of this scenario have results similar to the status-quo, where synergies between different activities offshore (multi-use with wind farms) are not fully exploited. This is due to the lack of policy guidance for the integration of multiple activities, and incoherence of the legislative and regulatory framework at the EU level. Moreover, low funding opportunities leads to a lack of pilot projects to establish common parameters for co-location and for the mitigation of potential negative externalities. The spatial implications of future development trends, available space and options for multi-use of space in this scenario are detailed in Table 10, Table 11 and Figure 9.
The potential constraints in this scenario are related to reduced suitable areas with a water depth of above –55 m and fragmented space due to increased spatial claims and lack of coordination. This scenario underlines the importance of considering interconnected energy hubs and multi-purpose offshore platforms (for conversion of energy and maintenance of OWF) in order to benefit from the remaining available space further from shore and in deeper waters.
SCENARIO—ambitious energy targets/sectoral planning approach:
Scenario D is based on the assumptions of growing ambitions to reach the energy targets set through legally binding documents at the European/national level (National Energy Plans), in a sectoral planning approach environment. The sectoral planning of the offshore space would prioritise the spatial needs of the large-scale energy deployment, as it would take the lead on the political agenda.
Achieving the energy goals would also imply the fast progress on an energy efficiency policy for limiting energy demand growth without affecting economic growth and living standards [55]. A possible outcome could be represented by the enforcement of green procurement rules such as purchasing local goods, services and practices [56]. Moreover, the focus on energy efficiency, cumulated with a substantial growth in the price of crude oil, can lead to energy-saving activities such as bringing production steps closer to end-user markets, reducing packing volume and switching to less energy-intensive modes of transportation [57]. This could result in lower maritime traffic (cargo and related to oil and gas activity) in the North Sea.
With lower spatial claims from other offshore activities, there is a low pressure on the maritime space; therefore, the multi-use of space is not considered in this scenario due to high costs of implementation and unknown risks. However, a small number of new protected areas have been proposed by local governments in some of the North Sea countries. The new proposed protected areas, as well as the wind farm areas, are closed for fishing, underlining the decreasing priority of this activity. The spatial implications and available space are presented in Table 12, Table 13 and Figure 10.
Scenario D presents the consequences of managing the offshore space from a sectoral perspective, while prioritising the ambitious energy targets. This offers the possibility for large-scale deployment in suitable areas. For example, in the Netherlands, in shallow waters at a small distance from the shore. However, the disregard of the spatial claims of other offshore activities, especially the interaction with fisheries, would come with undeniably negative socio-economic consequences.

4. Discussion

4.1. Comparison between Scenarios

The main assumptions for the future offshore claims are based both on an extensive literature review and interviews with relevant stakeholders in countries around the North Sea. The uncertainty regarding the political support in pushing forward the energy transition is captured in the low/high renewable energy transition targets driver, an important indicator for future investments (as also underlined in interviews). The second main driver considered in the formulation of the scenarios is the type of planning: sectoral (current practices) or integrated (under the MSP umbrella). Through the lens of the four scenarios, different future developments of the shipping, oil/gas and environmental protection activities have contributed to the calculation of space availability in the four scenarios (Figure 11).
Figure 12 depicts the estimated GWs which can be produced (at 3.6–6.4 MW/km2 density) in areas with a water depth of above –120 m and a distance to shore of under 100 km, suitable areas due to the cost of turbines, foundations, grid connections, transformer platforms and installation, operation, and maintenance costs [25], as well as costs related to the foundation type [26]. In this case, the GWs that can be produced are equal in Scenarios B and C. However, 17 to 30 additional GWs can be produced in Scenario B (Figure 12). Similarly, aside from the extra 8 to 15 GWs in Scenario A compared to Scenario C, the multi-use areas in Scenario A can bring 16 to 28 additional GWs.
As resulted from all scenarios, the areas most claimed by offshore activities are within 50 km from shore, with a water depth of above –55 m, located mainly in the south of the studied area (Dutch, German, Danish EEZ). Even in the least constrained scenario (D—high-energy ambitions/sectoral planning), the potential GWs which could be produced in those areas do not exceed approximately 20-35 GW. Provided that new technologies (such as floating wind farms) will be developed and deployed, areas with a water depth of between –120 and –55 m will be unlocked (Figure 12).
The available space increases significantly with the increase in the distance from shore (area over 100 km), in particular in the range –120 m to –55 m water depth (Table 14). While there are considerable differences between Scenarios A and D, in Scenario A, an additional 47-85 GWs are unlocked due to multi-use with fisheries and protected areas. Therefore, while Scenario D proposes more space for deploying offshore wind farms, in this scenario, there is a high possibility of delays in the authorisation process, due to a high conflict of interests between multiple stakeholders specific to a sectoral type of planning. Moreover, the socio-economic and environmental costs related to a prioritisation of renewable deployment without considering cumulative impacts and other activities such as fisheries and protected areas would likely add delays in the authorisation process and can be highly contested.
In light of these results, Scenarios A and B, which propose an integrated type of planning, with collaboration between the different stakeholders of the offshore space (and implicitly multi-use of space), can represent viable alternatives to Scenarios C and D, which focused on sectoral planning.

4.2. Main Drivers

One of the main drivers for Scenarios A and B is the integrated planning of the offshore space. Table 15 illustrates the substantial unlocked potential that would be gained through successfully managing the multi-use between offshore wind farms and fisheries (medium intensity fisheries—Scenarios A and B), protected areas (in different amounts, see Table A5), and military areas (1.5% in Scenario A).
Compared to the large available area of the Scottish EEZ, in each of the four presented scenarios, the available space in the Dutch, German and Danish EEZ is considerably smaller due to multiple competing claims. This influences the urgency to consider the multi-use of space with fisheries, nature protected areas or military areas in order to meet the energy goals while also considering cost-effective options. As illustrated in Figure 13, most of the potential multi-use areas with fisheries (56%) occurs in areas further than 100 km from shore, while the multi-use areas in shallow waters (above –55 m) close to the shore (under 50 km) can host no more than 5 GWs (Figure 13).
Similarly, most of the potential multi-use areas between offshore wind farms and nature-protected areas (72%, Figure 14) are located further than 100 km from shore, while only 8% are located under 50 km from shore (approximately 5 GWs). At a distance from shore of between 50 and 100 km, there is potential to produce between 58 to 103 GWs (densities of 3.6 and 6.4 MW/km2). This underlines not only the scarcity of space in the proximity of the shore, but also the need to consider the available areas further offshore.
The scarcity of space in the proximity of the shore is clear also in the least advantageous scenario for energy deployment (Scenario C, Figure 15). Despite the lack of available space close to the shore (only 11%), there is substantial potential for deployment in areas located at a distance between 50 to 100 km from land, accounting for approximately 186 to 331 GWs (at densities between 3.6 MW/km2 to 6.4 MW/km2). This can represent a solid justification for promoting the development of offshore platforms for converting the renewable energy (AC to DC) produced in wind farms. The deployment in deep waters will meet difficulties related to high investments, which are needed for development of floating turbines. However, the main advantages of those locations are related to lower conflicts with valuable fishing grounds or proposed protected areas, as well as the possibility to allocate sites in closer proximity to the shore, such as for the case of England.

4.3. Methodological Reflections

The main advantage of the mixed-method approach applied in this study is the generation of a holistic set of scenarios, based on inputs from multiple sources (literature review, reports, projections for future use and interviews with relevant stakeholders). We analysed the main factors influencing the availability of space in cost-effective areas (close to shore, shallow waters) under different conditions (high/low-energy targets, integrated/sectoral planning). The effective use of unlocked areas (through the multi-use of space and common strategies) and the avoidance of bottlenecks in the authorisation process, would require multiple conditions such as: the political readiness (policies, institutional framework), techno-economic adaptation (shared costs, risks, design adaptation), financial support (incentives), extensive engagement and the coordination of all actors claiming the offshore space.
We also compiled a consistent inventory of spatial data for the offshore activities, underlined as an important gap for the studied areas. The spatial database is reliable (official databases and repositories), up-to-date and allows for the representation of the offshore space in a homogenous manner. However, the large area of study brought a number of limitations in choosing the criteria of analysis, mainly related to the level of detail: (1) only the main offshore activities, with consistent available data sets were considered, (2) the study did not consider the geo-morphologic characteristics of the marine environment (type of soils, seismicity, etc.), (3) important elements of the marine environment were not considered (birds migratory routes), due to the lack of data for the whole studied area and (4) new technologies such as autonomous ships were not considered in the study, due to the uncertainty of their impact on the separation of shipping lanes. Moreover, the assumptions we formulated could be challenged in the future, especially considering the dynamic of future claims and the vast areas occupied by those activities. Considering the distribution of military areas mainly in the proximity of the shore, the contribution to multi-use could be increased from the current 1.5% in Scenario A, provided more collaboration and agreement is realised between involved parties. Therefore, more constraints and parameters could be added when the analysis is reproduced at a national or regional level.
Moreover, the assumptions related to each scenario, while justified by interviews, could be subjects of debate. The method developed allows for altering assumptions and for replication in different areas or at different times. The main aspects and key drivers for the management of the offshore space have also been identified (fisheries, protected areas, military areas, oil and gas activity). Hence, this study forms a clear basis for possible future studies.
In general, employing methods for identifying suitable locations or reducing conflict between different users sharing the same space has traditionally been one of the original areas for which geographic information systems have been developed [58]. In this paper, the framework for assessing space availability has been enriched by embracing both qualitative perspectives (reports, interviews on future developments) as well as quantitative data (the overlay of different maps of suitability factors). Therefore, the role of GIS can be seen not only through the visualisation of available space through the lens of different scenarios but also through the quantification of potential energy generation capacity.
The alternative future images presented, as well as the possible challenges and opportunities, can enforce the decision-making process. The anticipated opportunities and threats can foster the informed strategic deployment of offshore wind farms, taking advantage of the cost-effective locations while also balancing the interests and impacts on the marine environment. However, the shortcoming of this method can be seen through the uncertainties related to the development of key activities. One example is the development of the oil and gas industry. The assumptions related to oil and gas decommissioning address only the existing infrastructure and do not allow for the current and future discoveries of oil and gas fields in the North Sea Continental Shelf. The 2019 projections of the UK Oil and Gas Authority indicate a potential higher production for 2050, as compared to 2015 projections [59].

5. Conclusions

Large-scale deployment of offshore wind infrastructure in the North Sea faces important constraints due to conflict with other offshore activities (Table 1). This research identified the impact of those activities on future potentials to allocate space for offshore wind energy infrastructure in the North Sea up to 2050. For this endeavour, we applied a mixed-method approach, combining the literature review, data analyses and expert interviews.
In our exploration, we created four scenarios for future management of offshore space. We presented the estimated potential for deploying offshore wind farms (in GWs at two different densities) for single use and/or multi-use (Scenarios A and B). Our results clearly emphasised that the areas in close proximity to the shore and with shallow waters offer the least possibilities for deploying offshore wind farms additional to areas planned for 2030 (maximum 20 GWs in Scenario A, maximum 35 GWs in Scenario D). This applies even when considering multi-use with fisheries or protected areas (additional maximum 6 GWs in Scenario A, maximum 2.7 GWs in Scenario B). However, we identified an existing high potential, which could be utilised in future deployments, within a distance of 50 to 100 km from shore and a water depth of –120 to –55 m. This holds true for one user of space only offshore wind farms, with a capacity to harvest from a maximum of 139 installed GWs in Scenario B to a maximum of 191 installed GWs in Scenario D.
Furthermore, multi-use with fisheries and nature-protected areas could raise the amount of available space to a maximum of 160 (Scenario B) to 334 (Scenario A) installed GWs, for the whole North Sea area. If we only consider the multi-use with marine-protected areas, the gathered amount of installed GWs reduces from 19 to 14 installed GWs under current conditions. However, to support this potential, numerous studies (see Table A1) emphasise the need for a collaborative approach, strong financial incentives, and technical adaptation realised through an integrated planning approach. On the other hand, a sectoral approach with high-energy targets (Scenario D) presents a high spatial potential but also high risks for delays in the authorisation process due to socio-economic impacts on fishery communities and potential negative environmental externalities.
Localising the critical points for locating offshore wind farms can represent a relevant instrument for the development of a roadmap for energy transition in the North Sea area and reaching the EU energy goals, as part of the UN sustainable Development Goals for affordable and clean energy (SDG 7). In reaching the EU targets for energy deployment, the multi-use of space mainly with fisheries, but also with protected areas, could produce additional space. However, trade-offs need to be considered such as design adaptation of wind farms, data/knowledge exchange between sectors, and financial instruments for further research on potential impacts. Therefore, platforms for communication, using GIS tools for sharing data and initiating a dialogue between offshore wind developers and other users of marine space, are crucial in identifying opportunities and threats related to spatial overlapping of activities. This implies the need for an integrated and strategic management of the future deployment. Key steps towards realising this potential are: (1) a continuous dialogue between the offshore wind farm sector, fisheries, nature-protecting areas and military, (2) the creation of a common GIS base for all the North Sea countries, with inputs from all stakeholders involved and (3) a strong shared policy in the form of clear and uniform legal frameworks for multi-use projects and financial tools to support research and pilot projects. If, in the future, a collaborative effort is implemented and the management of offshore activities remains sectoral, decisions will have to be made about the various costs involved, which are either related to infrastructure extension or the co-location of multiple uses.
In order to gain a more in-depth understanding of the feasibility of potential allocation areas, we aim to add the impacts on the maritime environmental receptors to our analysis. These imply an assessment of the impacts of offshore wind farms on bird migratory routes and the natural habitats of fish and mammals. Having a better understanding of the spatial potential and constraints of offshore wind farm deployments, facilitated by the GIS analysis framework, represents a valuable component of the effective planning for the energy transition roadmap.

Author Contributions

Conceptualisation: Laura Florentina Gusatu, Claudia Yamu, Christian Zuidema and André Faaij; Methodology: Laura Florentina Gusatu, Claudia Yamu, Christian Zuidema and André Faaij; Software: Laura Florentina Gusatu, Claudia Yamu; Validation: Laura Florentina Gusatu, Claudia Yamu, Christian Zuidema and André Faaij; Formal Analysis: Laura Florentina Gusatu; Investigation: Laura Florentina Gusatu, Claudia Yamu, Christian Zuidema and André Faaij; Resources: Laura Florentina Gusatu, Claudia Yamu, Christian Zuidema and André Faaij; Data Curation: Laura Florentina Gusatu; Writing—Original Draft Preparation: Laura Florentina Gusatu; Writing—Review and Editing: Laura Florentina Gusatu, Claudia Yamu, Christian Zuidema and André Faaij; Visualisation: Laura Florentina Gusatu; Supervision: Claudia Yamu, Christian Zuidema and André Faaij; Project Administration: Laura Florentina Gusatu, Claudia Yamu, Christian Zuidema and André Faaij; Funding Acquisition: Claudia Yamu, Christian Zuidema and André Faaij. All authors have read and agreed to the published version of the manuscript.

Funding

This research is part of part of a project that has received funding from the European Union’s Horizon 2020 research and innovation programme under the Marie Skłodowska-Curie grant agreement No 765515.

Acknowledgments

Through this research we acknowledge the expert contribution of stakeholders who participated in the interviews in order to further the understanding of current and future tensions between offshore renewables and current activities in the North Sea.

Conflicts of Interest

The authors declare no conflict of interest. The funders had no role in the design of the study; in the collection, analyses, or interpretation of data; in the writing of the manuscript, or in the decision to publish the results.

Appendix

Table A1. Projects analysing multiple use options in the offshore space. Source [60,61].
NameYearMulti-use Combination (with OWF)Observations/Recommendations
COEXIST Source: [62]2010Guidelines: interactions in coastal waters
  • Maps of suitability for aquaculture production
  • Guidance on the relevant parameters for integration of aquaculture, fisheries and other activities in the coastal areas (knowledge on the water quality, extensive research regarding the local conditions, key environmental variables, potential negative impacts).
ORECCA Source: [63]2010Guidelines: offshore renewable energy conversion platformsFocus: technological, financial, environmental opportunities and constraints emerged from mixing offshore wind farms, wave installations and tidal installation.
Guidelines/results:
Finance: balance between market-pull and technological-push; funding opportunities in countries which are already leaders/where the resource exists; grant schemes; risk sharing mechanism; knowledge on cost sharing through cross border collaborations; promote demonstrating projects;
Technology: policies for design consensus (common solutions); identify priority areas for the implementation.
Infrastructure: develop clustered port and offshore supply chain infrastructure (facilitate the exploitation of key resource hotspots); prioritize studies that optimize the clustering of ports; prioritize the National level grid reinforcements that facilitate large scale offshore deployments (coordinated approach for the development of grid ports and offshore supply chain infrastructure); co-location of technologies (efficient use of resources); develop infrastructures common for all technologies accommodated (substations, submarine cables, technologies for electrical connections, floating platforms, HVDC systems);
Environmental: harmonize European legislation and regulations; focus research on environmental impacts; implement streamlined one-stop-shop marine consenting systems; develop /MSPs; develop SEA for each technology; knowledge exchange on EIA; promote ‘’adaptive management’’ and ‘’deploy and monitor’’ approaches; correlate legislation and regulations with the industrial technological trends and advancements; consider cumulative pressures on the environment; encourage the use of test sites.
H2OCEAN Source: [64]2012Guidelines: wind-wave power open-sea platformFocus: Development of offshore energy hubs combining wind-wave power open-sea platforms equipped for hydrogen generation with support for multiple users of energy.
Guidelines/results: societal, economic, technical and environmental aspects of the offshore platforms, based on a number of site-based tests (a North Atlantic site, a North Sea site, a Mediterranean site)
SOMOS Source: [65]2016Guidelines: safe production of food and feed from marine plantsFocus: safety assessment and safety control in the case of combining food production offshore (seaweed) and energy production.
Guidelines/results: The framework proposed involves several phases:
exploration of potential multi-use activities, the relevant stakeholders (available data) and tools to be used;
understanding probability of opportunities/ threats, ambiguities, uncertainties, control options, mitigation measures, coping strategies, all acknowledged by stakeholders;
appraisal of hazards, risks, consequences under different scenarios and events, based on by stakeholder norms and values, providing information for cost-benefit analysis, identification of critical hazards, multi-criteria analysis;
decision on actions to be undertaken;
implementation of measures;
evaluation and revision of safety concerns, during a participatory process involving stakeholders.
MUSES Source: [44,45]2017Guidelines: Multi-use in European Seas:
-offshore wind farms, tourism;
-oil and gas/decommissioning; – repurposing;
-offshore wind farms, aquaculture;
-offshore wave energy, aquaculture;
-offshore wind farms, other marine renewable energy infrastructure.
Focus: multi-use between different offshore activities (not limited to joint use of installations, but also entails joint activities).
Guidelines:
Integration and coordination (cross-sectoral platforms for actors and institutions);
National policy and regulation, with EU guidance (for a clear multiple-use framework);
Capacity building and training (cross-sector knowledge exchange, especially with fisheries and aquaculture);
Funding and investment (prioritize the technical advancements and innovations to support multiple use);
Research and pilot projects (construct business models and understand the value chain);
Marketing and dissemination (local adaptation and platform for disseminating information on multiple-use).
Barriers:
Regulation/policy (unclear regulations for multiple use);
Finance (high financial risk due to lack of investment/incentives);
Environmental concerns (still unclear knowledge regarding the potential impacts);
Stakeholder perceptions (power balance, weak representation of interests, different insights in impacts and risk for each sector);
Technological delay (low technological readiness, adaptability and compatibility of uses);
Liability and insurance (high costs of insurance due to safety risks, such as accidents with fishing vessels, effects of a spill-over to aquaculture farms, etc.).
TROPOS Source: [66]2012Scenarios: modular multi-use deep water platformFocus: (case-study approach) the potential locations for multi-use platforms which combine offshore wind energy, aquaculture, offshore transport facilities, tourism and ocean environmental monitoring.
Results: The study presents 4 scenarios:
Container Terminal Scenario: only large floating container platforms, with large annual throughput, in competitive energy and labour cost regions are viable;
Service Hub Scenario: the construction of offshore service hubs on their own is a cost-effective solution for large-scale farms (>200 MW), unless very close to the shore and to a service port (<10-15 km). This might be a solution for deep water locations with high wind resource. There are also potential synergies with aquaculture, in an integrated concept (substation and offshore wind services facilities, with the processing and packaging for the aquaculture products). However, the wind farm (by its scale) would have a leading priority in deciding the location.
Aquaculture on-growing unit scenario (30 cages attached to individual wind turbines): not negative results, but not substantial returns on investments. However, it is estimated that the economy of scale may play a crucial role for aquaculture. Also, the sharing of space for related activities (substation, packaging, etc.) would positively influence returns. Another advantage is given by the energy use of the aquaculture farm, produced by the offshore wind farms.
Leisure Island scenario (visitor centre, hotel, restaurant, other facilities): shows a negative return on investments, the least viable concept. Results might differ when reducing costs for O&M, energy costs and increasing platform revenues (exclusive activities and services).
MERMAID Source: [12]2012Case-studies: multi-purpose platform for wind energy, aquaculture and transportFocus: Offshore wind farm and mussel farming.
Conclusions: Likely to be viable from a financial and socio-economic perspective.
In particular, sites located close to the Dutch shore are likely to have improved financial and socio-economic performance;
Adding seaweed is not economically viable under current technical and economic conditions (investments, O&M costs, market prices);
The financial viability of mussel farming and seaweed farming would improve if there would be subsidies available for “stat-ups” for offshore production.
Knowledge barriers:
Missing information on ecological consequences (monetization of environmental externalities);
Limited site-specific data on financial and economic assessment (mainly supported by literature and expert judgement);
The evaluation of results through a social cost benefit analysis, taking into account data gaps.
Figure A1. Methodological steps.
Ijgi 09 00096 g0a1
Table A2. Glossary.
Table A2. Glossary.
ACAlternating Current
ACCSEASAccessibility for Shipping, Efficiency Advantages and Sustainability (EU INTERREG IVb North Sea Region Programme Project)
AISAutomatic Identification System
BSHBundesamt für Seeschifffahrt und Hydrographie (Federal Maritime and Hydrographic Agency)
CAACivil Aviation Authority
CCSCarbon Capture and Storage
CONTISContinental Shelf Information System
COPCessation of Production
DCDirect Current
EBNEnergie Beheer Nederland
EDEuropean Datum
EEZExclusive Economic Zone
EMODnetEuropean Marine Observation and Data Network
ENSYSTRAENergy SYStems in TRAnsition
EPSGEuropean Petroleum Survey Group
EUEuropean Union
GDP Gross Domestic Product
GISGeographic Information System
GWGigawatt
IMFInternational Monetary Fund
IMOInternational Maritime Organization
INSPIREINfrastructure for SPatial InfoRmation in Europe
MPAMarine Protected Areas
MSPMarine Spatial Plan
MUPMulti Use Platforms
MUSESMulti-use in European Seas (European Union’s Horizon 2020 research and innovation programme)
MWMegawatt
NATSNational Air Traffic Services
NIMBYNot in My Back Yard
NLOGNetherLands Oil and Gas
NMNautical Miles
NMPiNational Marine Plan interactive
NorthSEENorth Shipping Energy Environment (EU INTERREG North Sea Region Programme Project)
NSRNorth Sea Region
O&GOil and Gas
OWFOffshore Wind Farms
OSPARThe name is composed by “OS” and “PAR” from the original Oslo and Paris Conventions
SDGSustainable Development Goals
SOMOSSafe Production of Marine Plants and Use of Ocean Space (Project)
TMTransverse Mercator
TNONederlandse Organisatie voor Toegepast Natuurwetenschappelijk Onderzoek (Netherlands Organisation for Applied Scientific Research)
TSSTraffic Separation Schemes
UNUnited Nations
UNCLOSUnited Nations Convention on the Law of the Sea
Figure A2. Calculation rules for future shipping lanes (using projections from ACCSEAS—Accessibility for shipping. Efficiency, Advantages and Sustainability project: http://www.accseas.eu/). Source of calculation of shipping lane width rules: Confederation of European Shipmasters’ Associations, International regulations and guidelines for maritime spatial planning related to safe distances to multiple offshore structures (e.g., wind farms).
Ijgi 09 00096 g0a2
Table A3. Coding of the interviews.
Code CategoriesExample of Codes
Primary codes
(1)
OWF/protected areas, etc.
(2)
Restriction/safety distance/overlap
(3)
Management/national authorities
(4)
Agreements/communication
(5)
Cost/impacts/adaptation
(6)
Extension/reduction/projections
Secondary codes
(1)
National priorities/economic or cultural value
(2)
Restricted areas/co-location
(3)
Trust building/policy priorities
(4)
Consultation processes/impact assessment
(5)
Social added-value/techno-economic impacts of multi-use
(6)
O&G decommissioning/environmental protection/shipping intensity
Categories
(1)
Main offshore activities
(2)
Necessary measures for conflict resolution
(3)
Collaboration and data exchange between stakeholders
(4)
Spatial planning approaches
(5)
Status-quo of multi-use
(6)
Trends for protected areas/oil and gas/shipping
Themes (derived from theory)
(1)
Current offshore spatial claims
(2)
Spatial interactions
(3)
Key stakeholder’s engagement
(4)
Conflict mitigation strategies
(5)
Drivers/barriers of multi-use
(6)
Potential future offshore developments
Figure A3. Presence of the main drivers for multi-use (high degree in dark blue/low degree in light blue) in relation to the classification of high/medium/low potential.
Ijgi 09 00096 g0a3
Table A4. Assumptions for the decommissioning and removal of oil and gas infrastructure.
SCENARIOS
2050
A - high renewable targets/integrated planningB - low renewable targets integrated planningC - low renewable targets/sectoral planningD - high renewable targets sectoral planning
ASSUMPTIONSOil - complete decommissioning
Gas - complete decommissioning
Oil - complete decommissioning
Gas – partial decommissioning
Oil - partial decommissioning
Gas – partial decommissioning
Oil - complete decommissioning
Gas - complete decommissioning
Literature:
- low expectance of major new discoveries, the maturity of oil/gas fields (decrease of exploration drills) in Denmark [67];
-end of economic lifespan of a large number of Dutch oil and gas fields;
- projections of rapid decline of UK oil and gas production the lead to large-scale decommissioning of oil and gas installations [37].
-the reuse /repurpose (e.g. rigs-to-reefs) of installations has emerged as a viable option, however, with only marginal financial benefits but increased ecological benefits [54].
Literature:
-The continue decline of the oil production [68,37,69] is indicative of the future large scale decommissioning of the offshore oil installations in all North Sea countries;
-However, a number of scenarios [37] project a decrease of decommissioning after the year 2025.
- Added to this, new gas fields have been recently discovered, such as Glengorm and Glendronach, in UK [69].
Literature:
Projections of the Oil & Gas Authority UK for oil and gas production by 2050 underline the potential of 0,3 million barrels of oil equivalent/day. Also, estimations for decommissioning [50,51] indicate that in the period 2017- 2025, 1/4 of the offshore installations will be removed.
Literature:
Similar to Scenario A:
- decrease of exploration drills, indicating maturity of gas fields which leads to end of technical, and consequently economic lifespan of wells [67,69];
- lack of cooperation between sectors implies no possibility for re-use or re-purpose, due to high financial and environmental risks, not yet analysed.
Assumptions: In this scenario, the main drivers for complete decommissioning are the depletion of resources combined with policy push for carbon emission reduction. Due to integrated planning, a number of the installations are re-used as energy hubs or support for the marine ecosystem of rich and biodiverse habitats. These assumptions are also based on the projections for oil/gas supply of the "Community Renewables" scenario produced by National Grid UK [68].Assumptions: Therefore, under low renewable energy targets and an integrated planning approach, our assumptions are:
- the full decommissioning of oil platform (policy push) and
- partial decommissioning of gas infrastructure (which will still play a role in the 2050 energy mix). these assumptions are in line with the 2019 National Grid ESO Future Energy Scenarios [68].
Assumptions: Under a sectoral planning and with low renewable energy targets, the assumptions are for:
- continuation of oil and gas production in the North Sea.
- Following the trend for 2017-2025, our assumption is that by 2050, only 1/2 of the offshore installations would have been removed. Assuming that fossil fuels would still play a role in the energy mix is also in line with Scenario "Steady Progression" of National Grid ESO [68].
Assumptions: the assumptions are:
- the sectoral planning and high renewable targets accelerate the decommissioning process and cessation of oil and gas production.
- there is no multi-use or re-use of installations.
Site location Scenario A:
-all offshore installations are decommissioned.
-a number of key located installations re-used (energy hubs, multi-functional platforms).
Site location Scenario B: In selecting the offshore gas fields and adjacent installations which would potentially provide a share of the 2050 energy mix, we considered the giant gas fields with lower decline rates and higher gas peak productivity (where data available). The small gas fields are not considered due to decrease in gas prices and high operation costs [54].
In this scenario, we assume the following gas fields and adjacent installations will not be decommissioned:
UK: giant gas fields discoveries in the north of UKCS - Scotland (due to CCS policy for the gas fields in the South); Netherlands: gas fields and installations planned for decommissioning after 2025, in the scenario for gas price of 12 dollars ct/Nm3 and COP based on reserves, contingent resources and prospective resources [54];
Denmark: giant oil/gas fields Dan, Gorm, Halfdan, Tyra, dwarf oil/gas field Skyold (due to low decline rate and high productivity in peak year). Norway: giant gas fields Sleipner Vest, Peopn, Troll and Frigg.
Site location Scenario C: In addition to the sites selected for Scenario B, a number of giant oil fields were added to the remaining locations.
UK: giant existing oil fields and gas fields discoveries in the north of UKCS - Scotland (due to CCS policy for the gas fields in the South); Netherlands: location of gas installations planned after 2025 in the scenario for gas price of 12 dollars ct /Nm3 and COP based on reserves, contingent resources and prospective resources [54];
Denmark: giant oil/gas fields Dan, Gorm, Halfdan, Tyra, dwarf oil/gas field Skyold (due to low decline rate and high productivity in peak year). Norway: giant gas fields Sleipner Vest, Peopn, Troll and Frigg.
Site location Scenario D:
-all offshore installations decommissioned.
Table A5. Assumptions for the interaction with protected marine environment/scenarios. The percentages for the quantification of the potential multiple use of space are proposed according to current practices (approximately 10% for England, approximately 2% for Germany).
CountryA - high renewable targets/integrated planningB - low renewable targets/integrated planningC - low renewable targets / sectoral planningD - high renewable targets/sectoral planning
The NetherlandsCurrent Natura 2000 areas.
Additional: Centrale Oestergronden;
2% multi-use of current areas;
10% multi-use in new areas
Current Natura 2000 areas.
Additional: Centrale Oestergronden; GasFonteinen; Borkumse Stenen; Brunke Bank
2% multi-use of current areas; 2% multi-use in new areas
Current Natura 2000 areas.
Additional: Centrale Oestergronden; GasFonteinen; Borkumse Stenen; Brunke Bank
no multi-use
Current Natura 2000 areas.
Additional: Centrale Oestergronden (as resulted from interviews and document review, a clear area of interest for environmental protection);
no multi-use
GermanyCurrent Natura 2000 areas
2% multi-use of current areas
Current Natura 2000 areas
no multi-use
Current Natura 2000 areas
no multi-use
Current Natura 2000 areas
no multi-use
DenmarkCurrent Natura 2000 areas
10% multi-use of current areas
Current Natura 2000 areas
2% multi-use
Current Natura 2000 areas
no multi-use
Current Natura 2000 areas
no multi-use
SwedenCurrent Natura 2000 areas
10% multi-use of current areas
Current Natura 2000 areas
2% multi-use
Current Natura 2000 areas
no multi-use
Current Natura 2000 areas
no multi-use
Norwayno protected areasAdditional: Particularly valuable and vulnerable areas: Sandeel habitat south, Mackerel spawning grounds, Siragrunnen (bank area), Karmøyfeltet bank area, Sandeel habitat north (Viking bank)
2% multi-use in new areas
Additional: Particularly valuable and vulnerable areas: Sandeel habitat south, Mackerel spawning grounds, Siragrunnen (bank area), Karmøyfeltet bank area, Sandeel habitat north (Viking bank)
no multi-use
no protected areas
ScotlandCurrent Natura 2000 areas. Additional: proposed MPAs and SAC areas (North-East Faroe Shetland Channel, Pobie Bank Reef, Central Fladen, Norwegian boundary sediment plain, Turbot Bank, East of Gannet and Montrose fields, Firth of Forth Banks Complex)
2% multi-use of current areas; 10% multi-use in new areas
Current Natura 2000 areas. Additional: proposed MPA, SAC areas (North-East Faroe Shetland Channel, Pobie Bank Reef, Central Fladen, Norwegian boundary sediment plain, Turbot Bank, East of Gannet and Montrose fields, Firth of Forth Banks Complex), the search areas
2% multi-use of current areas; 2% multi-use in new areas
Current Natura 2000 areas. Additional: proposed MPA, SAC areas (North-East Faroe Shetland Channel, Pobie Bank Reef, Central Fladen, Norwegian boundary sediment plain, Turbot Bank, East of Gannet and Montrose fields, Firth of Forth Banks Complex), the search areas
no multi-use
Current Natura 2000 areas.
no multi-use
EnglandCurrent Natura 2000 areas
10% multi-use of current areas
Current Natura 2000 areas; Additional: Marine Conservation Zones: Swallow Sand, Fulmar, North East of Farnes Deep, Farnes East
10% multi-use of current areas; 2% multi-use in new areas
Current Natura 2000 areas. Additional: Marine Conservation Zones: Swallow Sand, Fulmar, North East of Farnes Deep, Farnes East
no multi-use
Current Natura 2000 areas
no multi-use
Sources: Netherlands [60], United Kingdom [34,61], Norway [32].

References

  1. The European Parliament and the Council of the European Union. Renewable Energy Directive. 2009. Available online: https://eur-lex.europa.eu/legal-content/EN/ALL/?uri=CELEX%3A32009L0028 (accessed on 5 November 2018).
  2. European Commission. A Policy Framework for Climate and Energy in the Period from 2020 to 2030. 2014. Available online: https://eur-lex.europa.eu/legal-content/EN/ALL/?uri=CELEX%3A52014DC0015 (accessed on 3 December 2018).
  3. United Nations. Paris Agreement. 2015. Available online: https://unfccc.int/process-and-meetings/the-paris-agreement/the-paris-agreement (accessed on 3 December 2018).
  4. Mostegl, N.M.; Pröbstl-Haider, U.; Haider, W. Spatial energy planning in Germany: Between high ambitions and communal hesitations. Landsc. Urban Plan. 2017, 167, 451–462. [Google Scholar] [CrossRef]
  5. Jongbloed, R.H.; van der Wal, J.T.; Lindeboom, H.J. Identifying space for offshore wind energy in the North Sea. Consequences of scenario calculations for interactions with other marine uses. Energy Policy 2014, 68, 320–333. [Google Scholar] [CrossRef]
  6. Devine-Wright, P. Place attachment and public acceptance of renewable energy: A tidal energy case study. J. Environ. Psychol. 2011, 31, 336–343. [Google Scholar] [CrossRef]
  7. Geraint, E.; Gianluca, F. JRC Science for policy report. The Social Acceptance of Wind Energy. 2016. Available online: https://publications.jrc.ec.europa.eu/repository/bitstream/JRC103743/jrc103743_2016.7095_src_en_social%20acceptance%20of%20wind_am%20-%20gf%20final.pdf (accessed on 10 September 2018).
  8. Michiel Müller, N.V.; Haesen, E.; Ramaekers, L.; Verkaik, N. Translate COP21 2045 Outlook and Implications for Offshore Wind in the North Seas. 2017. Available online: https://northseawindpowerhub.eu/wp-content/uploads/2017/10/Translate-COP21-Public-report-July2017-final.pdf (accessed on 5 November 2018).
  9. Ministerie van Infrastructuur en Milieu. North Sea 2050 Spatial Agenda. 2014. Available online: https://www.government.nl/documents/policy-notes/2014/07/28/north-sea-2050-spatial-agenda (accessed on 5 November 2018).
  10. Jacquemin, J.; Butterworth, D.; Garret, C.; Baldock, N.; Henderson, A. Inventory of Location Specific Wind Energy Cost. Available online: https://ec.europa.eu/energy/intelligent/projects/en/projects/windspeed. (accessed on 5 November 2018).
  11. World Energy Council Netherlands. The North Sea Opportunity. 2017. Available online: https://www.weltenergierat.de/wp-content/uploads/2018/03/North-Sea-Opportunity.pdf (accessed on 5 November 2018).
  12. Giannouli, P.; Koundouri, P.; Xepapadeas, T.; Xepapadeas, P.; Mailli, E.; Davila, O.G.; Levantis, E.; Kourogenis, N.; Garçäo, R.; Rosén, L.; et al. Deliverable: D 8.3 Socio-economic Analysis of the North Sea., North Sea Site. 2012. Available online: http://www.vliz.be/projects/mermaidproject/docmanager/public/index.php?dir=Deliverables%2F&download=D8_3_Socio_Economic_North_Sea_Site.pdf. (accessed on 5 November 2018).
  13. Schillings, C.; Wanderer, T.; Veum, K.; van Stralen, J.; Van Der Wal, J.T.; Jacquemin, J. WindSpeed Decision Support System (DSS), a Planning Instrument to Reduce Conflicts between Offshore Wind Parks and Environmental Concerns. Available online: https://pdfs.semanticscholar.org/67fc/ac3abac9ded62a99b4d40f6abb1641079efe.pdf (accessed on 5 November 2018).
  14. Dutch Central Government. Policy Document on the North Sea 2016–2021. Available online: https://www.government.nl/documents/policy-notes/2015/12/15/policy-document-on-the-north-sea-2016-2021-printversie (accessed on 10 September 2018).
  15. Ruijgrok, E.C.M.; van Druten, E.J.; Bulder, B.H. Cost Evaluation of North Sea Offshore Wind Post 2030. 2019. Available online: https://northseawindpowerhub.eu/wp-content/uploads/2019/02/112522-19-001.830-rapd-report-Cost-Evaluation-of-North-Sea-Offshore-Wind.pdf (accessed on 4 March 2019).
  16. ECN-TNO. Cost Evaluation of North Sea Offshore Wind Post 2030. 2019. Available online: https://northseawindpowerhub.eu/wp-content/uploads/2019/02/112522-19-001.830-rapd-report-Cost-Evaluation-of-North-Sea-Offshore-Wind.pdf (accessed on 4 March 2019).
  17. Sørensen, H.C.; Fernández Chozas, J. The Potential for Wave Energy in the North Sea. In Proceedings of the 3rd International Conference on Ocean Energy, Bilbao, Spain, 1–6 October 2010; Available online: https://vbn.aau.dk/en/publications/the-potential-for-wave-energy-in-the-north-sea (accessed on 10 September 2018).
  18. De Boer, J.; Zuidema, C. Integrated energy landscapes How coevolution encourages planners to focus on developing linkages between renewable energy systems and local landscapes. In Spatial Planning in a Complex Unpredictable World of Change; de Roo, G., Boelens, L., Eds.; InPlanning co-op, 2015; pp. 1–20. [Google Scholar] [CrossRef]
  19. Nghiem, A.; Pineda, I. Wind energy in Europe: Scenarios for 2030. Available online: https://linkey.nl/uploads/wind-energy-in-europe-scenarios-for-2030.pdf (accessed on 4 March 2019).
  20. SEANSEE project. Comparison of North Sea EIA’s and SEA’s of Maritime Spatial Plans and wind energy developments. An Analysis of Similarities and Differences between North Sea Countries in Benefit of the SEANSE-Project. 2019. Available online: https://www.msp-platform.eu/sites/default/files/baseline_study_on_sea_1.pdf (accessed on 4 March 2019).
  21. Seanergy 2020 Project. Delivering Offshore Electricity to the EU: Spatial Planning of Offshore Renewable Energies and Electricity Grid Infrastructures in an Integrated Eu Maritime Policy. 2012. Available online: https://ec.europa.eu/energy/intelligent/projects/sites/iee-projects/files/projects/documents/seanergy_2020_executive_summary_en_en.pdf (accessed on 4 March 2019).
  22. Smith, G.; Jentoft, S. Marine spatial planning in Scotland. Levelling the playing field? Mar. Policy 2017, 84, 33–41. [Google Scholar] [CrossRef]
  23. Van der Reijden, K.J.; Hintzen, N.T.; Govers, L.L.; Rijnsdorp, A.D.; Olff, H. North Sea demersal fisheries prefer specific benthic habitats. PLoS ONE 2018, 13, 12. [Google Scholar] [CrossRef] [PubMed] [Green Version]
  24. Vagiona, D.G.; Kamilakis, M. Sustainable site selection for offshore wind farms in the South Aegean-Greece. Sustainability 2018, 10, 749. [Google Scholar] [CrossRef] [Green Version]
  25. Möller, B.; Hong, L.; Lonsing, R.; Hvelplund, F. Evaluation of offshore wind resources by scale of development. Energy 2012, 48, 314–322. [Google Scholar] [CrossRef] [Green Version]
  26. Bailey, H.; Brookes, K.L.; Thompson, P.M. Assessing environmental impacts of offshore wind farms: Lessons learned and recommendations for the future. Aquat. Biosyst. 2014, 10, 1–13. [Google Scholar] [CrossRef] [PubMed] [Green Version]
  27. Kelly, C.; Ellis, G.; Flannery, W. Conceptualising change in marine governance: Learning from Transition Management. Mar. Policy 2018, 95, 24–35. [Google Scholar] [CrossRef] [Green Version]
  28. The European Parliament and the Council of the European Union. DIRECTIVE 2014/89/EU OF the European Parliament and of the Council of 23 July 2014 establishing a framework for maritime spatial planning. 2014. Available online: https://eur-lex.europa.eu/legal-content/EN/TXT/?uri=celex%3A32014L0089 (accessed on 5 November 2018).
  29. Commission of the European Community. Roadmap for Maritime Spatial Planning: Achieving Common Principles in the EU. 2008. Available online: https://eur-lex.europa.eu/LexUriServ/LexUriServ.do?uri=COM:2008:0791:FIN:EN:PDF (accessed on 5 November 2018).
  30. Federal Maritime and Hydrographic Agency. Spatial Plan for the German Exclusive Economic Zone in the North Sea. 2009. Available online: https://www.bsh.de/EN/TOPICS/Offshore/Maritime_spatial_planning/National_spatial_planning/_Anlagen/Downloads/Raumordungsplan_Textteil_Nordsee.html?nn=2043950 (accessed on 11 June 2018).
  31. United Nations. United NationsConvention on the Law of the Sea. 1982. Available online: https://www.un.org/depts/los/convention_agreements/texts/unclos/unclos_e.pdf (accessed on 11 June 2018).
  32. Norwegian Ministry of the Environment. Integrated Management of the Marine Environment of the North Sea and Skagerrak (Management Plan). Available online: https://tethys.pnnl.gov/publications/integrated-management-marine-environment-north-sea-skagerrak-management-plan (accessed on 11 June 2018).
  33. The Scottish Government. Scotland’s National Marine Plan Scotland’s National Marine Plan. 2015. Available online: https://www.gov.scot/publications/scotlands-national-marine-plan/ (accessed on 5 November 2018).
  34. Ospar Commission. 2018 Status Report on the OSPAR Network of Marine Protected Areas. 2019. Available online: https://www.ospar.org/documents?v=40944 (accessed on 6 May 2019).
  35. Nilsson, H.; van Overloop, J.; Ali Mehdi, R.; Pålsson, J. Transnational Maritime Spatial Planning in the North Sea: The Shipping Context. Report. 2017. Available online: https://northsearegion.eu/media/4836/northsee_finalshippingreport.pdf. (accessed on 5 November 2018).
  36. Porathe, T.; Oltmann, J.-H. ACCSEAS Baseline and Priorities Report. Interreg IVB North Sea Reg. Program. Available online: https://www.iala-aism.org/content/uploads/2016/08/accseas_baseline_and_priorities_report_v3.0.pdf (accessed on 5 November 2018.).
  37. Nextstep, Re-use & Decommissioning Report 2018. Available online: https://www.nexstep.nl/re-use-decommissioning-report-2018/ (accessed on 4 March 2019).
  38. Przedrzymirska, J.; Zaucha, J.; Depellegrin, D.; Fairgrieve, R.; Kafas, A.; Calado, H.A.G.P.; Vergílio, M.; Varona, M.C.; Lazić, M.; Schultz-Zehden, A.; et al. Multi-use of the sea: from research to practice. Available online: https://www.researchgate.net/publication/329381177_Multi-use_of_the_sea_from_research_to_practice (accessed on 4 March 2019).
  39. Schupp, M.F.; Bocci, M.; Depellegrin, D.; Kafas, A.; Kyriazi, Z.; Lukic, I.; Schultz-Zehden, A.; Krause, G.; Onyango, V.; Buck, B.H. Toward a Common Understanding of Ocean Multi-Use, Front. Mar. Sci. 2019, 6, 1–12. [Google Scholar]
  40. Kamermans, P.; Walles, B.; Kraan, M.; van Duren, L.A.; Kleissen, F.; van der Have, T.M.; Smaal, A.C.; Poelman, M. Offshore wind farms as potential locations for flat oyster (Ostrea edulis) restoration in the Dutch North Sea. Sustainability 2018, 10, 11. [Google Scholar] [CrossRef] [Green Version]
  41. Kafas, A. MUSES project case study 1A. Offshore wind and commercial fisheries in the east coast of Scotland. MUSES deliverable: D3. 3: Case study implementation—Annex 1 Andronikos Kafas Marine Scotland. Available online: https://sites.dundee.ac.uk/muses/wp-content/uploads/sites/70/2018/02/ANNEX-1-CASE-STUDY-1A.pdf (accessed on 4 March 2019).
  42. Court, H. Analysis of the East Inshore and East Offshore Marine Plans. Available online: https://assets.publishing.service.gov.uk/government/uploads/system/uploads/attachment_data/file/312513/east-plan-analysis.pdf (accessed on 4 March 2019).
  43. Kyriazi, Z. From identification of compatibilities and conflicts to reaching marine spatial allocation agreements. Review of actions required and relevant tools and processes. Ocean Coast. Manag. 2018, 166, 103–112. [Google Scholar] [CrossRef]
  44. Schultz-Zehden, A.; Lukic, I.; Ansong, O.J.; Altvater, S.; Bamlett, R.; Barbanti, A.; Bocci, M.; Buck, B.H.; Calado, H.; Varona, M.C.; et al. Ocean Multi-Use Action Plan. 2018. Available online: https://www.submariner-network.eu/images/news/MUSES_Multi-Use_Action_Plan.pdf (accessed on 4 March 2019).
  45. Kafas, A. Case Study 1A-Offshore Wind and Commercial Fisheries in the East coast of Scotland. Available online: https://www.msp-platform.eu/sector-information/offshore-wind-and-fisheries (accessed on 4 March 2019).
  46. The RSA Great Recovery & Zero waste Scotland Programme, North Sea Oil and Gas Rig Decommissioning and Re-use Opportunity Report. Available online: https://www.thersa.org/globalassets/pdfs/reports/rsa-great-recovery---north-sea-oil-and-gas-report.pdf (accessed on 4 March 2019).
  47. EBN. Netherlands Masterplan for Decommissioning and Re-use. 2017. Available online: https://www.ebn.nl/wp-content/uploads/2016/12/EBN-Masterplan-for-decommissioning.pdf (accessed on 4 March 2019).
  48. Oil & Gas UK. Norwegian Continental Shelf Decommissioning Insight 2016. Available online: https://oilandgasuk.co.uk/wp-content/uploads/2016/02/Norwegian-Continental-Shelf-Decommissioning-Report-2016.pdf (accessed on 4 March 2019).
  49. Baum, R.M. Focus on energy. Chem. Eng. News 2017, 83, 5. [Google Scholar]
  50. Scottish Enterprise. Oil and Gas Decommissioning. Subsea Engineering Opportunity, International Market Insights Report Series. 2018. Available online: http://www.evaluationsonline.org.uk/evaluations/Browse.do?ui=browse&action=show&id=676&taxonomy=IIN (accessed on 4 March 2019).
  51. OGUK. “Decommissioning Insight 2018,” Oil Gas UK-Decommissioning Insight. 2018. Available online: https://oilandgasuk.co.uk/wp-content/uploads/2019/03/OGUK-Decommissioning-Insight-Report-2018.pdf (accessed on 4 March 2019).
  52. Hollingsworh, D. Tilting at Windmills: Reconciling Military Needs and Wind Energy Initiatives in the 21st Century. Oil Gas Nat. Resour. Energy J. 2018, 4, 1. [Google Scholar]
  53. American Wind Energy Association. The Department of Defense and American Wind Power: Partners in Protecting National Security and Military Readiness. 2018. Available online: https://www.awea.org/Awea/media/Policy-and-Issues/Project%20Development/WindEnergyandMilitaryCompatibilityWhitePaperandCaseStudies.pdf (accessed on 5 November 2018).
  54. EBN. Focus on Dutch Oil & Gas 2016. Available online: https://www.ebn.nl/publicatie/focus-on-dutch-oil-gas-2016/ (accessed on 5 November 2018).
  55. United Nations Department of Economic and Social Affairs. Accelerating SDG 7 Achievement: SDG 7 Policy Briefs in Support of the High-Level Political Forum 2019. Available online: https://sustainabledevelopment.un.org/content/documents/22877UN_FINAL_ONLINE_20190523.pdf (accessed on 5 November 2018).
  56. OECD, Regions in Industrial Transition. Policies for People and Places. 2019. Available online: https://www.oecd.org/cfe/regional-policy/Draft_policy_highlights_RIT_FINAL.pdf (accessed on 11 November 2019).
  57. Bouton, S.; Creyts, J.; Kiely, T.; Livingston, J.; Nauclér, T. Energy Efficiency: A Compelling Global Resource. 2010. Available online: https://www.mckinsey.com/~/media/mckinsey/dotcom/client_service/Sustainability/PDFs/A_Compelling_Global_Resource.ashx (accessed on 5 November 2018).
  58. Batty, M. Using Geographical Information Systems. In Geographic Information Systems, Spatial Modelling and Policy Evaluation; Fischer, M.M., Nijkamp, P., Eds.; Springer: Berlin/Heidelberg, Germany, 2018. [Google Scholar]
  59. Oil & Gas Authority, OGA Overview 2019. Available online: https://www.ogauthority.co.uk/media/5407/oga-overview-2019-low-res.pdf (accessed on 1 January 2020).
  60. Dotinga, H.; Trouwborst, A. The Netherlands and the designation of marine protected areas in the North Sea. Implementing international and European law. Utr. Law Rev. 2009, 5, 21. [Google Scholar] [CrossRef]
  61. Marine Scotland. Northern North Sea proposal - Joint Recommendation regarding the protection of Special Areas of Conservation and Marine Protected Areas in the North Sea. Available online: https://fiskeristyrelsen.dk/media/9068/northern-north-sea-proposal.pdf (accessed on 5 November 2018).
  62. Stelzenmüller, V.; Schulze, T.; Gimpel, A.; Bartelings, H.; Bello, E.; Bergh, O.; Reys, D. Guidance on a Better Integration of Aquaculture, Fisheries, and other Activities in the Coastal Zone: From Tools to Practical Examples; DTU Libruary: Lyngby, Denmark, 2013; ISBN 978-0-9926602-0-8. [Google Scholar]
  63. ORECCA Project -European Commission. Available online: https://cordis.europa.eu/project/id/241421/reporting (accessed on 5 November 2018).
  64. H2OCEAN Project -European Commission. Available online: https://cordis.europa.eu/project/id/288145 (accessed on 5 November 2018).
  65. Van den Burg, S.W.K.; Röckmann, C. Report on Economic, Ecological and Societal Impacts of the Integration of Multi-sector Activities: Description of Hazards, Assessment and Visualization D3.3. 2018. Available online: https://www.wur.nl/upload_mm/9/8/4/7957cae3-25a3-43d7-8c61-067a0aa19fd6_D3.3%20Report%20on%20economic%2C%20ecological%20and%20societal%20impacts%20of%20the%20integration%20of%20multi-sector%20activities.pdf (accessed on 6 May 2019).
  66. TROPOS Project -European Commission. Available online: http://www.troposplatform.eu/ (accessed on 5 November 2018).
  67. Höök, M.; Söderbergh, B.; Aleklett, K. Future Danish oil and gas export. Energy 2009, 34, 1826–1834. [Google Scholar] [CrossRef] [Green Version]
  68. National Grid ESO. Future Energy Scenarios 2019. Available online: http://fes.nationalgrid.com/ (accessed on 6 May 2019).
  69. Hall, M. Gas Production from the UK Continental Shelf: An Assessment of Resources, Economics and Regulatory ReformI, The Oxford Institute for Energy Studies. 2019. Available online: https://www.oxfordenergy.org/wpcms/wp-content/uploads/2019/07/Gas-Production-from-the-UK-Continental-Shelf-NG-148.pdf (accessed on 6 May 2019).
Figure 1. Map of the studied area.
Ijgi 09 00096 g001
Figure 2. (a) Water depth and (b) distance to shore.
Ijgi 09 00096 g002
Figure 3. Scheme of scenarios for the deployment of renewables, up to 2050.
Ijgi 09 00096 g003
Figure 4. Available space offshore when excluding existing activities/spatial claims for different offshore activities.
Ijgi 09 00096 g004
Figure 5. The surface of the Exclusive Economic Zones (EEZ) for the countries in the studied area.
Ijgi 09 00096 g005
Figure 6. Current and planned (2030) cumulative capacity for offshore wind farms.
Ijgi 09 00096 g006
Figure 7. Scenario A: high renewable energy ambitions/integrated planning.
Ijgi 09 00096 g007
Figure 8. Scenario B: low renewable energy ambitions/integrated planning.
Ijgi 09 00096 g008
Figure 9. Scenario C: low renewable energy ambitions/sectoral planning.
Ijgi 09 00096 g009
Figure 10. Scenario D: High renewable energy ambitions/sectoral planning.
Ijgi 09 00096 g010
Figure 11. Estimated potential GWs according to the available space in all proposed scenarios.
Ijgi 09 00096 g011
Figure 12. Estimated potential GWs: within 100 km from shore, with a water depth of –120 to –55 m (without considering multi-use in Scenarios A and B).
Ijgi 09 00096 g012
Figure 13. Percentage of areas for multi-use with fisheries proposed in Scenario A.
Ijgi 09 00096 g013
Figure 14. Percentage of areas for multi-use with protected areas proposed in Scenario A.
Ijgi 09 00096 g014
Figure 15. Percentage of available areas in relation to the distance to shore and water depth in Scenario C.
Ijgi 09 00096 g015
Table 1. Geographic Information System (GIS) repository for selected offshore activities.
Offshore ActivitySourceData FormatGeographical CoverageEditing/
Processing
Telecommunication cables
  • EMODnet
  • Rijkswaterstaat geo-services
  • CONTIS BSH
  • Marine Scotland NMPI
Shapefile
  • North Sea
  • The Netherlands
  • Germany
  • Scotland
Buffer zone 500 m
PipelinesEMODnetShapefileNorth SeaBuffer zone 500 m
Shipping—IMO
  • Rijkswaterstaat geo-services
  • CONTIS BSH
  • Norwegian Coastal Administration
Shapefile
  • The Netherlands
  • Germany
  • Norway
Merge layers (anchoring areas, TSS)
Shipping—important shipping routesEMODnet - Automatic Identification SystemRaster (.tif)North SeaClassification of values (5 classes)/Manual geo-referencing for Denmark, UK
Military areas
  • Rijkswaterstaat geo-services
  • CONTIS BSH
  • Marine Scotland NMPI
  • UK Military Airfields Guide (CAA, NATS, etc.)
ShapefileRaster
  • The Netherlands
  • Germany
  • Scotland
  • UK
Manual geo-referencing for UK and Denmark based on raster data
Aggregate extraction (sand, gravel)
  • EMODnet
  • Rijkswaterstaat geo-services
  • The Crown Estate
  • INSPIRE
Shapefile
  • North Sea
  • The Netherlands
  • UK
  • Denmark
-
Oil and Gas installations
  • OSPAR
  • Oil and Gas Authority
  • NLOG (TNO/Ministry of Economic Affairs and Climate)
Shapefile
  • North Sea
  • UK
  • The Netherlands
Buffer 500 m
Marine Protected Areas—Natura 2000European Environmental AgencyShapefileNorth SeaClip to North Sea area
Valuable and vulnerable marine areas
  • Norwegian Environmental Agency (Geonorge)
  • Policy Document on The North Sea 2016-2021
  • Marine Scotland NMPI
Shapefile
  • Norway
  • The Netherlands
  • Scotland
-
Wind areas—OPERATIONAL/authorised
  • OSPAR
  • Rijkswaterstaat geo-services
  • Marine Scotland NMPI
Shapefile
  • North Sea
  • The Netherlands
  • Scotland
Filtering (by status)
Wind SCOPING areas—proposed IN ORDER TO REACH THE 2030 ENERGY GOALS
  • OSPAR
  • Rijwaterstaat geo-services
  • Marine Scotland NMPI
  • Danish Energy Agency report
  • Kartverket
Shapefile/Image (Denmark)
  • North Sea
  • The Netherlands
  • Scotland
  • Denmark
  • Norway
Filtering (by status)/Geo referencing
Fishing intensity
  • OSPAR
  • North Sea demersal fisheries prefer specific benthic habitats [23]
Shapefile
Raster file
  • North Sea
  • South of North Sea
Quantile classification of values (5 classes)
Polygonise (raster to vector)
Table 2. Offshore wind farm development areas designated for meeting the 2025–2030 energy targets.
CountryStatus of Data SetDATESource/Aknowledgement
The NetherlandsDesignated wind areas2018Rijkswaterstaat Geoservices—established in the National Water Plan 2009-2015
GermanyOffshore wind farm projects connected by 20252019BSH—Draft Site Development Plan 2019 for the North and Baltic Sea
DenmarkSuitable location for future locations—large-scale screening2019Danish Energy agency, https://ens.dk/sites/ens.dk/files/Vindenergi/fact-sheet-10gw.pdf
NorwayOffshore assessment/investigation areas2012Norwegian Water Resources and Energy directorate, under Norwegian license for public data: https://data.norge.no/nlod/no/1.0
ScotlandScoping areas of search (work in progress)2018https://www.gov.scot/publications/scoping-areas-search-study-offshore-wind-energy-scottish-waters-2018/ Under the open Government licence. http://www.nationalarchives.gov.uk/doc/open-government-licence/version/3/
EnglandRound 3 zones – WIND 22014OSPAR - https://odims.ospar.org/layers/geonode:ospar_offshore_renewables_2014_01_001
SWEDENNo areas designated to reach the 2030 targets--
Table 3. Interactions with wind energy infrastructure—Status-quo.
Offshore ActivityInteraction with Offshore Wind Energy Infrastructure/Legal Basis
Shipping (mainly the Traffic Separation Schemes) RESTRICTED AREAS—due to the necessity for safety and freedom of navigation in the international shipping lanes [14,30]—based on UN Convention on the Law of the Sea (UNCLOS) [31].
Cables and pipelinesRESTRICTED AREAS—the pipeline and cable corridors have a 500 m safety zone [14,30]—UN Convention on the Law of the Sea (UNCLOS) [31]
Oil and gas infrastructureRESTRICTED AREAS—due to difficulties in carrying out seismic surveys and exploration drilling to map the petroleum production [32]—mining laws, environmental laws
Maritime protected areasRESTRICTED AREAS (exception: England)—current policy and international regulations, the Natural 2000 areas (Special areas of Conservation Special Protected Areas) are restricted for locating wind farms or other permanent installations [30], since mitigation of damaging effects (seabird mortality, disturbance from electromagnetic fields) is unlikely [32]—UNCLOS/Natura 2000 areas/Habitat Directives/Marine Strategy Framework Directive
Military areasRESTRICTED AREAS—due to safety measures and interference with military training activities. Conflictual interaction—The fishing activity is one of the traditional uses in the North Sea, with a recognised social, cultural and economic importance. Unlike most of the activities at sea, fishing is seasonal and widespread, which makes it difficult to predict [33]—EU Common Fisheries Policy.
Aggregate extraction (sand, gravel)RESTRICTED AREAS [30]
Fishing activitiesCONFLICTUAL interaction—The fishing activity is one of the traditional uses in the North Sea, with a recognised social, cultural and economic importance. Unlike most of the activities at sea, fishing is seasonal and widespread, which makes it difficult to predict [33]—EU Common Fisheries Policy.
Table 4. Potential future spatial claims (external context)—implications for the scenario development.
ActivityFuture DevelopmentsArgumentation
ShippingLimited increase
 Source: NorthSEE [35]
The main trends for shipping activity include: increased size of ships, decrease of travel distance of products from source to end user and the introduction of autonomous ships.
Substantial increase
 Sources: ACCSEAS [36]; North Sea MSP projections (MSP Platform)
Projections indicate a 50% increase in maritime traffic in the NSR by 2020+. This requires a calculation of the potential impacts on the future spatial claims.
Oil and gasIncreased decommissioning
 Sources: Oil and Gas UK, Nextstep [37]
The decommissioning of oil and gas infrastructure in the North Sea is expected to accelerate: a large extent of the platforms would be removed in the Netherlands and UK, and to a lower extend in Norway and Denmark.
Nature protected areasIncreased concerns for maritime environmental protection
 Source: National objectives (MSP), OSPAR Network of Marine Protected Areas [34], interviews
National governments have expressed intentions for extending the MPAs in the North Sea. Among the North Sea countries, only the Netherlands and Scotland have more concrete plans to designate space offshore areas.
Table 5. Potential for multi-use between offshore wind farms and other marine uses/per country.
Multi-Use with Offshore Wind FarmsThe NetherlandsGermanyDenmarkSwedenNorwayUK
FisheriesMediumLowMediumLowLowHigh
Maritime protected areasMediumLowMediumLowLowHigh
Military areasLowLowMediumLowLowMedium
Shipping—local routesMediumMediumLowMediumLowMedium
Oil and gasMediumLowLowLowMediumMedium
Table 6. Scenario A: High renewable energy ambitions/integrated planning.
High Renewable Energy Ambitions/Integrated Planning
Scenarios assumptions/activitySpatial implications
Fisheries
(1)
Multi-use: wind farms and passive fishing (small vessels).
(2)
Identified highly valuable areas for fishing (intense fishing): not designated to any activity (free space for fishing).
(3)
Corridors designed for the passage of larger fishing vessels to the fishing grounds.
(4)
Aquaculture becomes economically and technically feasible in wind farms close to shore.
(1)
The overlap with areas of medium intensity for fishing (OSPAR data) are multi-use areas.
(2)
The highly valuable areas for fishing (intense fishing—OSPAR data): interdiction for any activity which might impede fishing.
(3)
The strategic design of corridors requires elaborated studies.
(4)
Multi-use with small scale aquaculture farms (due to nutrient depletion): will not be represented, given the scale of the map.
Maritime protected areas
(1)
Additional areas are proposed to be protected;
(2)
As a result of cross-sectoral collaboration, and with strong policy drivers (strategic planning, environmental impact assessment), a variation of 0%-10% of multi-use in nature protected areas is considered feasible (UK case).
(1) and (2) See Table A5;
Military areas
In general, military areas remain no-go zones for wind farms. However, the multi-use of space can be the subject of individual cases. Conditions include but are not limited to: adaptation of height in the proximity of radar systems, “terrain masking” (places terrain/obstacle in between radar and wind farm) and “terrain relief“, which elevates the radar, software development for aircrafts [52,53].
We assume a maximum potential for the multi-use of 1.5% (Scottish case) of the military areas (case by case, under the presented conditions).
Shipping (main shipping lines)
The increased sea traffic density (ACCSEAS project) requires the adaptation of vessels and support structures to accommodate and service other activities, including renewable energy structures. The logistic requirements (security, installation, maintenance) impose increased financial investments and strong collaboration between sectors.
According to our calculations, based on the International regulations and guidelines for Maritime Spatial Planning (see Figure A2), the designated shipping lanes (IMO routes, national routes) will not increase in width.
Oil and gas
With high motivation for deploying energy infrastructure and an equal consideration for all offshore activities, the assumptions are that 2/3 of the total O&G infrastructure will be decommissioned and removed. This is due to the ecological costs of removing the entire infrastructure and also considerations for synergies (re-use) for the infrastructure decommissioned “in situ”.
This will also result in a lower density of shipping for operation and maintenance activities.
The Netherlands: the location of priority areas for decommissioning and removal are chosen according to the scenarios developed by EBN—Focus on Dutch Oil and Gas 2016 (EBN) [54]. Other North Sea countries: 2/3 of the area allocated for O&G activities (including shipping) would become available.
See Table A4 for detailed assumptions.
Table 7. Available space—Scenario A.
Distance to ShoreWater Depth Estimated   Surface   ( km 2 ) Estimation   of   GWs   ( Density   3.6   MW / km 2 ) Estimation   of   GWs   ( Density   6.4   MW / km 2 )
AVAILABLE SPACE (no Overlap with Other Major Offshore Activities)Close to shore (under 50 km)above –55 m31681120
between –120 m and –55 m82153053
below–120 m10,7233969
Between 50 km and 100 kmabove –55 m37051324
between –120 m and –55 m23,00883147
below –120 m27,41299175
Further offshore (over 100 km)above –55 m22,79682146
between –120 m and –55 m91,256329584
below –120 m25,08190161
MULTI-USE OF SPACEOffshore wind farms and:Fishing activity49,236177315
Protected areas31931120
Military areas48023
Table 8. Scenario B: Low renewable energy ambitions/integrated planning.
Low Renewable Energy Ambitions/Integrated Planning
Scenarios assumptions/activitySpatial implications
Fisheries
(1)
Low co-location potential between wind farms and passive fishing (small vessels).
(2)
Identified valuable areas for fishing (intense fishing): not designated to any activity (free space for fishing)
(3)
Corridors designated for passing through of larger fishing vessels to the fishing grounds.
(4)
Multi-use between offshore wind farms and aquaculture might be an opportunity, depending on the economic and technical feasibility.
(1)
Around 50% of the overlap with areas of medium intensity for fishing (OSPAR data): multi-use areas.
(2)
The valuable areas for fishing (intense fishing—OSPAR data) do not allow any activity which might impede fishing.
(3)
The strategic design of corridors requires elaborated studies.
(4)
Multi-use with small scale aquaculture farms close to shore.
Maritime protected areas
(1)
Additional areas are proposed to be protected.
(2)
Based on cumulative environmental impact assessments for large-scale deployment of renewables, a variation of 0%–2% of multi-use in nature protected areas is considered feasible (German case).
(1) and (2) See Table A5.
Military areas
The low pressures to consider multi-use of space with military areas results in diminished opportunities for reconsidering spatial claims for training. Therefore, no reduction of the required space is considered.
The current military areas remain no-go zones for offshore wind farms.
Shipping
(1)
In an integrated planning context (safety measures for navigation and interaction with other activities), there is no extension of the current shipping lanes, which remain no-go areas for wind farms.
(2)
A new shipping lane will be designated to link the Netherlands and Norway (economic consideration–link with new markets and shipping routes).
(1)
According to our calculations (Figure A2), the increase in the traffic density will not imply wider shipping lanes for the already designated areas (IMO routes, national routes).
(2)
Approximately 4% of the available space in the north of Dutch EEZ will be reserved for a new shipping lane to Norway (approximation two lanes).
Oil and gas
(1)
The oil and gas infrastructure are partially decommissioned and removed (environmental concerns), while the remaining infrastructure has either been decommissioned “in situ” or re-used (multi-use platform projects, Table A1).
(2)
The reduction of offshore activities related to oil and gas production has decreased the operation and maintenance shipping routes.
(1)
Half of the total area allocated for oil and gas activities becomes available.
(2)
Reduction in shipping routes proportional to the reduced oil and gas activity.
Table 9. Available space—Scenario B.
Distance to ShoreWater Depth Estimated   Surface   ( km 2 ) Estimation   of   GWs   ( Density   3.6   MW / km 2 ) Estimation   of   GWs   ( Density   6.4   MW / km 2 )
AVAILABLE SPACE (no overlap with other major offshore activities)Close to shore (under 50 km)above – 55 m30161119
between –120 m and –55 m75362748
below –120 m98573563
Between 50 km and 100 kmabove – 55 m35971323
between –120 m and –55 m21,72378139
below –120 m26,21594168
Further offshore (over 100 km)above – 55 m18,98368121
between –120 m and –55 m74,301267476
below –120 m24,19287155
MULTI-USE OF SPACEOffshore wind farms and:Fishing activity22,87282146
Protected areas2156814
Military areas000
Table 10. Scenario C: Low renewable energy ambitions/sectoral planning.
Low Renewable Energy Ambitions/Sectoral Planning
Scenarios assumptions/activitySpatial implications
Fisheries
The pressures from fishing communities for more fishing areas, the lack of trust and cooperation with the wind developers and low-energy targets have led to the implementation of no-go areas for wind farms and no multi-use.
The clusters of areas with medium and high fishing intensity are conflict areas for offshore wind farms (low probability for authorising wind farms/high costs for compensation).
Maritime protected areas
Low renewable energy targets and a sectoral planning approach allow the expansion of claims for environmental protection. Due to the potential cumulative impacts, the multi-use of the offshore space, between renewable and protected areas, is not considered.
(1)
(2)
No multi-use of space.
Military areas
The lack of collaboration and communication with the military authorities results in diminished opportunities for reconsidering military spatial claims. No reduction of the required space is considered.
The current military areas remain no-go zones for offshore wind farms.
Shipping
(1)
Through a sectoral planning approach, the needs of the shipping sector for expansion will be prioritised over the deployment of renewables. Following the current global trend, the maritime traffic intensity will increase and diversify (autonomous ships), which will lead to increased claims in the offshore area. The shipping lanes are no-go areas for OWF.
(2)
Additionally, a new shipping lane will be designated to link the Netherlands and Norway (economic consideration: link with new).
(1)
According to our calculations (Figure A2), the increase in the traffic density will not imply wider shipping lanes for the existing designated areas (IMO routes, national routes). New shipping lanes for autonomous ships could be designated.
(2)
Approximately 4% of the available space in the north of Dutch EEZ will be reserved for a new shipping lane to Norway (approximation for two lanes).
Oil and gas
(1)
Due to environmental concerns, the oil and gas infrastructure has been partially decommissioned and removed (equivalent of the 2025 projections), while the remaining infrastructure has been decommissioned “in situ”.
(2)
The reduction of offshore activities related to oil and gas production has also decreased the operation and maintenance shipping areas.
(1)
The assumption considered in this scenario is that the slow decommissioning will not exceed the levels projected for 2025.
(2)
Reduction in shipping areas proportional to the reduced oil and gas activity.
Table 11. Available space—Scenario C.
Distance to ShoreWater Depth Estimated   Surface   ( km 2 ) Estimation   of   GWs   ( Density   3.6   MW / km 2 ) Estimation   of   GWs   ( Density   6.4   MW / km 2 )
AVAILABLE SPACE (no Overlap with Other Major Offshore Activities)Close to shore (under 50 km)above –55 m30161119
between –120 m and –55 m75362748
below –120 m98573564
Between 50 km and 100 kmabove –55 m35971323
between –120 m and –55 m21,72378139
below –120 m26,21594169
Further offshore (over 100 km)above –55 m18,98368122
between –120 m and –55 m74,301267478
below –120 m24,19287155
Table 12. Scenario D: High renewable energy ambitions/sectoral planning.
High Renewable Energy Ambitions/Sectoral Planning
Scenarios assumptions/activitySpatial implications
Fisheries
The imbalance of powers between the offshore wind farm developers and the fishing organisations lowered the priority level of fishing requirements. The result is the limited access of fishing ships in the wind farms (passing through) and no consideration for the valuable fishing grounds.
The fishing activity has no reserved areas.
Maritime protected areas
(1)
Despite being lower on the political agenda compared to energy deployment, the environmental protection is still an area of interest for the North Sea.
(2)
The high costs of multi-use and the unclear risks lead to no opportunity to combine these two activities.
(1)
New protected area in the Netherlands (Table A5).
(2)
There is no multi-use of space
Military areas
The lack of collaboration and communication with the military authorities results in diminished opportunities for reconsidering spatial claims for training. No reduction of the required space is considered.
The current military areas remain no-go zones for offshore wind farms.
Shipping
Through a sectoral planning approach, the required space for large-scale energy deployment will be prioritised over the expansion of shipping routes. With a focus on the local markets, the shipping intensity will be reduced. However, due to safety reasons, the width of shipping lanes will not be reduced.
According to our calculations (Figure A2), the increase in traffic density (ACCSEAS project) will not imply wider shipping lanes for the already designated areas (IMO routes, national routes).
Oil and gas
(1)
The space requirements for offshore renewables as well as the depletion of the oil and gas reserves led to the large-scale decommissioning and removal of oil and gas infrastructure in the North Sea.
(2)
There would be no O&G-related shipping routes for operation/maintenance.
(1)
All the offshore oil and gas infrastructure will be removed by 2050.
(2)
No more shipping related to oil and gas activity.
Table 13. Available space—Scenario D.
Distance to ShoreWater Depth Estimated   Surface   ( km 2 ) Estimation   of   GWs   ( Density   3.6   MW / km 2 ) Estimation   of   GWs   ( Density   6.4   MW / km 2 )
AVAILABLE SPACE (no Overlap with Other Major Offshore Activities)Close to shore (under 50 km)above –55 m55272035
between –120 m and –55 m11,6414275
below –120 m15,84157101
Between 50 km and 100 kmabove –55 m96143562
between –120 m and –55 m29,886108191
below –120 m40,210145257
Further offshore (over 100 km)above –55 m37,499135240
between –120 m and –55 m108,446390694
below –120 m37,922137243
Table 14. Available space ( km 2 and estimated GWs) for single use: over 100 km from shore, with a water depth above –120 m (without considering multi-use in Scenarios A and B).
Distance from Shore: Over 100 kmWater DepthEstimated GWs at Density: 3.6 MW/km2Estimated GWs at Density: 6.4 MW/km2
A: integrated planning/high-energy targetsabove –55 m82146
between –120 m and –55 m329584
below –120 m90161
B: integrated planning/low-energy targetsabove –55 m68121
between –120 m and –55 m267476
below –120 m87155
C: sectoral planning/low-energy targetsabove –55 m69122
between –120 m and –55 m269478
below –120 m87155
D: sectoral planning/high-energy targetsabove –55 m135240
between –120 m and –55 m390694
below –120 m137243
Table 15. Available space ( km 2 and estimated GWs): multi-use of space in Scenarios A and B.
Multi-UseWater DepthSurface (km2)Density: 3.6 MW/km2Density: 6.4 MW/km2
Scenario AFishing activity49,236177315
Protected areas31931119
Military areas48023
Scenario BFishing activity22,87282146
Protected areas2156814
Military areas000

