A Comprehensive Analysis of the Voltage Unbalance Factor in PV and EV Rich Non-Synthetic Low Voltage Distribution Networks


1
Department of Energy and Power Systems, Faculty of Electrical Engineering and Computing, University of Zagreb, 10000 Zagreb, Croatia
2
HEP DSO Ltd. Elektra Koprivnica, 48000 Koprivnica, Croatia
*
Author to whom correspondence should be addressed.
Energies 2021, 14(1), 117; https://doi.org/10.3390/en14010117
Submission received: 17 November 2020
/
Revised: 22 December 2020
/
Accepted: 24 December 2020
/
Published: 28 December 2020
(This article belongs to the Special Issue Smart Photovoltaic Energy Systems for a Sustainable Future)
Abstract
:With the development of technology and the decrease in prices, power systems are facing a strong growth in the number of end-users with photovoltaics (PVs), battery storages and electric vehicles (EVs). A penetration of low carbon (LC) technologies has an impact not only on the financial aspect, but also on parameters of the power quality (PQ) in the power system. Since most of end-users with renewable energy sources (RES) are connected to a low-voltage (LV) distribution network, there is a high number of single-phase loads and distributed generators (DG) that can cause unwanted effects in LV networks. According to standards, electric energy must be of a certain quality in order to avoid harmful effects on the power system, being both the network or the end-users equipment. One of the PQ parameters is the voltage unbalance. Voltage unbalance occurs in networks with the high share of single-phase loads and generators. Since most loads in households are connected to the only one phase, the voltage unbalance is constantly present in the network, even without LC technologies. Single-phase connected PVs, residential battery storages and EV charging stations can increase voltage unbalance in the system. This paper systematically analyzes a real-world LV network and different stages and shares of connected PVs, residential battery storages and EVs to different phases. The value of the voltage unbalance factor (VUF) is observed for one week in January and August in 10-min intervals. It is shown that connected systems can significantly increase the VUF and potentially cause negative impact on the equipment and the power system as a whole. In turn we analyze a three-phase connection of these new LC technologies and demonstrate how in all analyzed cases PQ values remain within boundaries defined by the EN 50160 and the IEC 61000-3-13.
1. Introduction
In the past years, a number of governments have become aware of the power system’s impact on the environment. As part of the European Green Deal [1], the European Union (EU) proposed in September 2020 to raise the 2030 greenhouse gas emission reduction target to no less than 55% compared to 1999. The 2030 Climate and Energy Framework [2] has set key targets for 2030, that include at least 40% cuts in greenhouse emissions, 32% share for renewable energy and 32.5% improvement in energy efficiency. According to goals of 2050 long-term strategy [3], the aim of the EU is to have an economy with net-zero greenhouse gas emissions, i.e., to be climate-neutral by 2050. In order to accomplish that goal, governments are creating different instruments to stimulate end-users to invest in low carbon (LC) technologies and in that way, to contribute to accomplishing set goals.
Prices of LC technologies have been decreasing through years. Photovoltaics (PVs) have become one of the most important technologies for realizing a decarbonized power sector and sustainable energy supply. Over the last four decades, solar module prices have significantly fallen. The European Union’s PV Report from 2019 [4] states that the average selling price of solar modules fell by 20% for each doubling of a production volume. From the end of 2009, the benchmark Levelized Cost of Electricity from PV system fell by more than 80%. The solar modules price reduction was driven not only by a technological development but also by market conditions and increasing electricity prices. The share of battery storages follows the growth of the share of renewables. According to [5], it appears that the capacity of battery storages will triple by 2030, if the share of renewables doubles. Similar as the solar modules price, the price of a residential battery storage has decreased through years and it is expected to continue decreasing in coming years. The total installed cost of a lithium-ion battery could fall by an additional 54–61% by 2030. Since batteries are the part of an EV that is the most influent on the price, the decreasing price of batteries should result in lower prices of EVs through years. With the decrease of prices and financial reliefs from governments, more end-users are able to invest in LC technologies. In that way end-users can reduce their electricity bill and help in accomplishing goals set by EU and other governments.
The integration of LC technologies potentially presents challenges for a distribution network. LC technologies are connected close to end-users and more end-users decide to invest in LC technologies and install them behind-the-meter. In this paper, we observe a passive distribution network, with less data know about the network, especially about the end-users’ phase consumption. However, PQ boundaries are set and characteristic for both medium-voltage (MV) or low-voltage (LV) distribution network. The impact of behind-the-meter connection on the voltage unbalance parameter of the PQ on the MV and especially the LV network will be analyzed in this paper.
A high share of PVs in the MV or LV network can cause voltages with the magnitude that is higher than boundaries set by the grid code or the standards. [6] presents the optimal power flow (OPF)-based conservation voltage reduction (CVR) operation in distribution networks with the high share of PVs. The proposed CVR scheme takes the advantage of an advanced metering and communication infrastructures expected to be available to most DSOs in the near future. The optimization algorithm maximizes the customer’s benefit and the network efficiency, while at the same time it minimizes the overall imported active power considering network constraints. Authors in [7] propose different techniques for an overvoltage prevention in LV networks: grid reinforcement, the application of active transformers, active power curtailment, reactive power management by PV inverters, demand respond and application of electrical energy storage systems (EESSs). This paper takes into the consideration the impact of a PV battery storage system, which is one of the ways to mitigate the overvoltage. Results in [8] show that it is possible to mitigate the overvoltage due to PVs and to increase the maximum allowable penetration level in New Zealand’s LV distribution network are. Proposed methods are reactive power control with an appropriate voltage trigger level, with a power factor extended to 0.80, changing transformer tap-position to reduce the secondary voltage and increasing the voltage magnitude limit in New Zealand’s LV network from 1.06 p.u. to 1.10 p.u., which is the limit in many countries, including Croatia, the county in which the tested LV distribution network from this paper is located. Since the share of PV systems and EVs can cause voltage problems, it is important to find methods to avoid potential problems in LV distribution network. Authors in [9] demonstrate that the overvoltage caused by PVs are slightly reduced by EVs and more importantly authors propose on-load tap-changing (OLTC) control method that is effective in managing voltage issues caused by a PV generation and an EV demand in LV networks.
Another potential problem that can occur with a growing share of LC technologies in the distribution network is the overhead lines and cables congestion. The focus of [10] has been identifying the potential of smart active power curtailment mechanisms to extend the market-based approaches to avoid network congestions. As a result of simulations, a mixed-integer programming (MIP)-based curtailment algorithm is proposed to select buses for a curtailment in a radial LV network. Studies in [11] investigated the EVs hosting capacity of different LV distribution networks in the UK. Analyses have shown that for some of tested networks problems start at the 40% penetration and it is mainly because of the transformer located at the substation, followed by thermal problems at the LV feeders. Ref. [12] presents a congestion forecast framework for visualization the probability for the network congestion and the voltage deviation in a distribution network with large number of both PVs and EVs. Uncertainties associated with the PV production, the load demand and the charging of EVs are taken into the consideration in case studies made in the paper. Results, based on Australian case study, indicate that the off-the-shelf (OTS) control of residential storage systems, meant to charge from PV surpluses, on average, reduces problems such as thermal utilization both in LV and high-voltage (HV) networks [13]. The OTS control faces challenges during problematic days (high PV production, low demand), when network problems cannot be mitigated. Authors in [14] propose the adaptive decentralized (AD) control strategy for residential battery storages to reduce both voltage and thermal issues whilst benefiting customers. The performance of AD control is compared against OTS control. Results show that AD control overcomes the limitations of OTS control and allows mitigating all voltage and thermal issues. The work in [15] proposes an adaptive centralized asset congestion management (ACACM) in PV-rich LV networks. ACACM uses available data, limited monitoring and based on irradiance measurements, it estimates total PV generation and demand to constantly calculate the maximum PV generation without causing the congestion of feeders and transformers.
With the continuous growth of share of LC technologies in distribution network, satisfying the power quality (PQ) is becoming more challenging task. Each of PQ parameters has boundaries that must not be violated. Analyses in [16] quantify variations of voltage, frequency and power factor on a monthly basis over a twelve-month period at the point of customer’s connection at four households on different radial networks around Australia. The houses’ location regarding the nearest network transformer, the houses’ solar generation and the houses’ load profile were examined to find correlation between these factors and the measured voltage variations. No direct correlation was found, suggesting that PQ variations measured at these households are attributable to non-PV causes, which is opposite to conclusions about the impact of PVs on overvoltage made in [6,7,8,9]. Authors in [17] have presented a quantitative analysis of PQ issues in the LV network with 68% of rooftop solar PV penetration. A case study investigated the effects, such as irradiance level, loading level and the time of the day, on the PQ indicators. In the case study that was made, total harmonic distortion (THD) and DC injection levels do not violate the statutory limits and the total demand distortion (TDD) values exceed the specified limits at several cases. Authors emphasize the importance of analyzing the cumulative effect on the system PQ by the non-linear loads and LC technologies connected to the network by inverters. In the research presented in [18] all of the measured PV systems had significantly different harmonic patterns, which makes difficult to propose simplified values for modelling without measuring and analyzing a greater number of devices. It is important to emphasize the difference between site measurements and the laboratory tests with controlled harmonic voltage conditions [19]. Comparing site measurements and laboratory tests indicated that the emitted harmonic currents depend strongly on the harmonic voltages in the AC-voltage. In order to avoid impermissible high order harmonics in power systems due to the operation of PV-generators, realistic test conditions have to be established and applied. In the power system with the high share of the renewable energy sources (RESs), battery storages are frequently used so that the end-user can optimize the operation of their hybrid RESs and battery storage systems. Optimal placement, sizing and operation of energy storage system (ESS) could possibly help avoiding the PQ problems, such as overvoltage, network congestion, harmonic distortion, voltage unbalance etc., caused by penetration of RESs [20]. Using the hybrid system with the adequate inverter provides a high-quality injected current from the PV array into a grid with a THD of less than 5% and stability of bus voltage against variation of the load [21]. The growing number of end-users with EVs and home chargers contribute to the voltage drop and THD that exceed the set boundaries. However, an optimal operation and a smart charging can help mitigating PQ problems. In the case study shown in [22], the replacement of traditional EV chargers with smart ones reduced the current THD from 51.6% to 1.8%. The same example shows that the voltage drop in the last house is 7.3%, which is the value lower than boundaries in most standards and national grid codes. Smart chargers used in the example allow mitigation of the issues in the distribution network and enable controlling the voltage and the current in batteries in order to maximize the batteries lifespan. PQ problems related to overvoltage and network congestion, but not to some other PQ aspects, caused by PVs and EVs could be solved by a strategy of the demand-side management that re-schedules charging loads of EVs using the deterministic programming algorithm based on historical data to maintain network constraints within their boundaries [23]. The proposed scheme is able to mitigate the impact of PVs and EVs on distribution networks by adjusting peak loads accordingly. As a result, the proposed strategy has capability to postpone upgrading needs of power grids, avoiding significant costs of the network reinforcement. Rapid voltage fluctuations caused by PV output fluctuations can result in visible light flickers. Simulations show that by the 2030, voltage fluctuations will no longer be major problems, and by the 2050, EVs will be able to limit fluctuations in residual loads to low values [24].
One of the biggest challenges in LV networks, related to PQ, is the voltage unbalance. Since the most of the household have single-phase loads, even the existing situation, without installed PVs, battery storages and EV chargers, results in voltage unbalance that exceeds the standard limits [25]. High number of single-phase LC technologies can increase the voltage unbalance in each node and in the entire LV network. Stochastic approach, in which the PVs penetration level and output power are considered as random input variables show that voltage unbalance factor (VUF) in certain time points of the day is higher than without installed PVs. In some observed time-points, VUF exceeds the standard limits [26]. According to EN 50160 [27] and IEC 61000-3-13 [28], the VUF may not exceed 2% (in some cases 3%) in 95% of 10 min interval values in one week. The PV system can also be connected to the network as a balanced three-phase source. When the PV system is connected to the network as a balanced three-phase source, the impact on the voltage unbalance cannot be neglected. It is shown that three-phase connection of the PV system helps reducing voltage unbalance. Simulations in [29] observed the installment of the PV system in only one node. It is shown that no matter how far the installed PV system is from the node in which VUF is calculated is, the VUF reduces. The impact of PVs on the VUF in the LV urban distribution reference network does not present the problem, since the VUF does not exceed the 2–3% boundaries [30]. Both in [29,30] authors observe the impact of only PV system on the VUF and the analysis are made for reference networks. However, the situation in the non-synthetic LV network could be different and there is need to analyze the impact of more LC technologies than only PV systems in cases that could potentially appear. Authors in this paper observe the impact of PVs, battery storages and EVs on the VUF in non-synthetic distribution networks.
Voltage unbalance can cause negative impact on equipment in the distribution network. Voltage unbalance can deteriorate the performance and reduce life expectancy of induction machines because of the temperature rise, losses and the decreased efficiency, it can negatively affect the AC adjustable speed drive system that are used to improve the motor operational efficiency. The negative sequence component voltage causes the negative sequence current occurrence which does not convey the energy, but it contributes to energy loss and reduces the capacity of distribution lines [31]. Because of the mentioned, and the influence of voltage and the current unbalance on other equipment in the power system, it is important to mitigate and reduce the voltage unbalance whenever possible. Some papers propose mitigation techniques in order to avoid harmful effects of the unbalance on the power system. When the phase of the connection is adequately selected, the hybrid system of PVs and ESS could possibly help the reduction of the VUF and the avoidance of the voltage unbalance [32]. Case study made in Brazil shows that it is imperative for PV integration studies to adequately model a single-phase PV system and to design suitable voltage control approaches based on reactive power compensation in order to avoid the voltage unbalance [33]. When using the hybrid system of a PV and a battery storage, it is possible to preform balancing via the same bus, which is the first choice and more efficient than balancing via the same phase but draws high ancillary batteries’ current. When the capacity of the batteries is unavailable, balancing via the same phase and via the whole feeder compensate the deficiency [34]. Managing battery storages in a way to decrease the voltage unbalance does not present the economic value and the profit for end-users. Providing such services causes potential loss of profit for the end-user. Authors in [35] propose the intelligent and communication-based voltage profile regulating technique which is capable of simultaneously performing three steps: adjusting the voltage level by OLTC transformer, reducing the voltage unbalance by facilitating reactive power exchange and active power curtailment by the PV inverters. Because of the limitation of the PVs’ injection or generation, prosumers do not achieve the profit as large as they potentially could. Phase load balancing (PLB) technique described in [36] presents the algorithm that consists of the identification of topology for the distribution network, uploading the input data and PLB procedure. The algorithm does not only analyze the voltage unbalance, but also the value of the current in the neutral current, which decreased 94% from the average value when using the proposed technique. Analysis of the LV distribution network made in [37] shows that despite demand being maintained, total losses calculated by the explicit four-wire approach increased by 4.1% for a 15% unbalance compared to a fully balanced system.
The authors in this paper model a specific real-world distribution network of an entire distribution area in Croatia, composed of the MV and LV elements, and provide a comprehensive analysis of the impact that the behind-the-meter low carbon (LC) technologies will have on VUF in LV networks under different shares and operating regimes. Here we defined four connection scenarios and four LC behavior scenarios (including optimization model of market driven prosumers) to systematically address the issue and draw conclusions.
The authors make a proposal for a unified balanced 3-phase connection rule for connection of behind-the-meter LC technologies to the LV network and, by preforming a comprehensive scenario analysis over all defined scenarios and options, we demonstrate how this rule successfully mitigates the VUF issues in the modelled real-world distribution network. The increase of total losses of 1% in Croatian networks is equal to around 120 GWh. If we assume that the average price of electricity is 50 €/MWh, the increase of 1% means that annual financial losses are increased for around 6,000,000 €. In case a unified balanced three-phase connection rule proposed in this paper is adopted, those financial losses could be avoided. Some of other approaches for reducing the voltage and current unbalance proposed in [31] are: imposing regulation and standards with respect to equipment and transmission line construction and adopting standards on acceptable levels of current and voltage unbalance, structural modifications of single-phase loads—on both utility and customer sides, integration of single-phase voltage regulators and balancing compensators. Even though proposed approaches are efficient, they require the investment in the equipment, which presents additional cost to the system operator.
The contributions of this paper are:
- (1)
- Analysis of the impact of different LC technologies on the voltage unbalance in the non-synthetic LV distribution network. Most of the papers that analyze the same problem take into the consideration only PVs or the combination of PVs and battery storages, which are often used for decreasing the voltage unbalance [34]. In that way end-users lose the opportunity to maximize their profit. In this paper, the additional LC technology that was analyzed is EV charging station. The existing literature is analyzing the EV charging only from the perspective of relieving voltage and congestion problems [11,12] and not because of the impact that single-phase charging stations have on the voltage unbalance. Further, the existing literature body does not analyze different operational nodes and their impact on the voltage unbalance.
- (2)
- The authors in this paper analyze the voltage unbalance according to General Summation Law described in IEC 61000-3-13 [28], meaning that the voltage unbalance was not analyzed only in the end-user’s node, but also in the entire observed LV network. Authors in [26] analyze voltage unbalance in different time periods, while in [29] the voltage unbalance in only one node is analyzed. In [29,30] authors make the analyses in the reference synthetic network. Voltage unbalance in this paper was analyzed both from the perspective of the value in the non-synthetic LV distribution network and the occurrence of the VUF thresholding the limitation set by standards [27,28].
- (3)
- A unified balanced 3-phase connection rule for connection of behind-the-meter LC technologies to the LV network is proposed in this paper. Both in [29,30] authors propose and encourage the three-phase connection, but they do not include the analysis of the impact of battery storages and EVs. Other papers propose methods that can reduce the voltage unbalance with the hybrid system of battery storage and PV, in case when the connection phase is adequately selected. Analysis made in this paper shows that no matter the selection of connection phase, voltage unbalance occurs even in the situation when the hybrid system is used. Authors in [35,36] propose intelligent and communication-based techniques and algorithms in order to reduce voltage unbalance. Since the voltage can be changed by injecting or withdrawing energy, it is not possible that end-users maximize their profit, unless they are stimulated to change the consumption or reduction power at the node. The method proposed in this paper does not affect the profit and the comfort of the end-user, since they are not asked to participate in the voltage unbalance reduction.
The rest of the paper is organized as follows: Section 2 briefly introduces the methodology; the description of the LV network, load and PV profile, the optimization of charging and discharging of battery storages and charging of EVs. Section 3 presents results of simulations and the comparison between them. Finally, Section 4 highlights the conclusions and the future work.
2. Methodology
In this section, the modelling of the distribution network for analyzing the voltage unbalance is presented. The analyzed distribution network consists of the network feeder that represents the rest of the MV network, the MV node, the MV/LV transformer, 120 LV nodes and 118 LV overhead lines and underground cables. The detailed information about the MV/LV transformer is shown in Table 1. The average length of the LV overhead lines and cables is 0.05 km and the total length is 5.86 km. The observed LV network is modelled with 11 different types of overhead lines and cables. Each type is defined with R1 (Ω/km), X1 (Ω/km), R0 (Ω/km), X0 (Ω/km) and maximum current (A).
The details about nodes in the observed network are shown in Table 2. Table 2 defines type of each node, MV and LV busbar, which are MV and LV node of the transformer in the 10/0.4 kV substation, end-user’s node, which represents the node in which end-user is connected and has installed LC technologies and electric switch cabinet, which is the node that has no consumption or production but is only used as a node from which overhead lines or cables go to the end-users. The power demand changes depending the phase and the time, but in the worst-case scenario maximum power of the entire LV network is 671 kW. This occurs only if all three phases are maximum loaded in the single-phased end-user nodes and all three-phase connected end-users must also consume maximum power. It needs to be noted that this is not a realistic case.
The elements of the LV distribution network that are causing the voltage unbalance are loads, PVs, battery storages and EV charging stations. In the initial case, only the impact of households’ loads was observed. The results of the initial case are compared to different cases, with PVs, battery storages and EV at 20%, 40%, 60% and 80% of nodes.
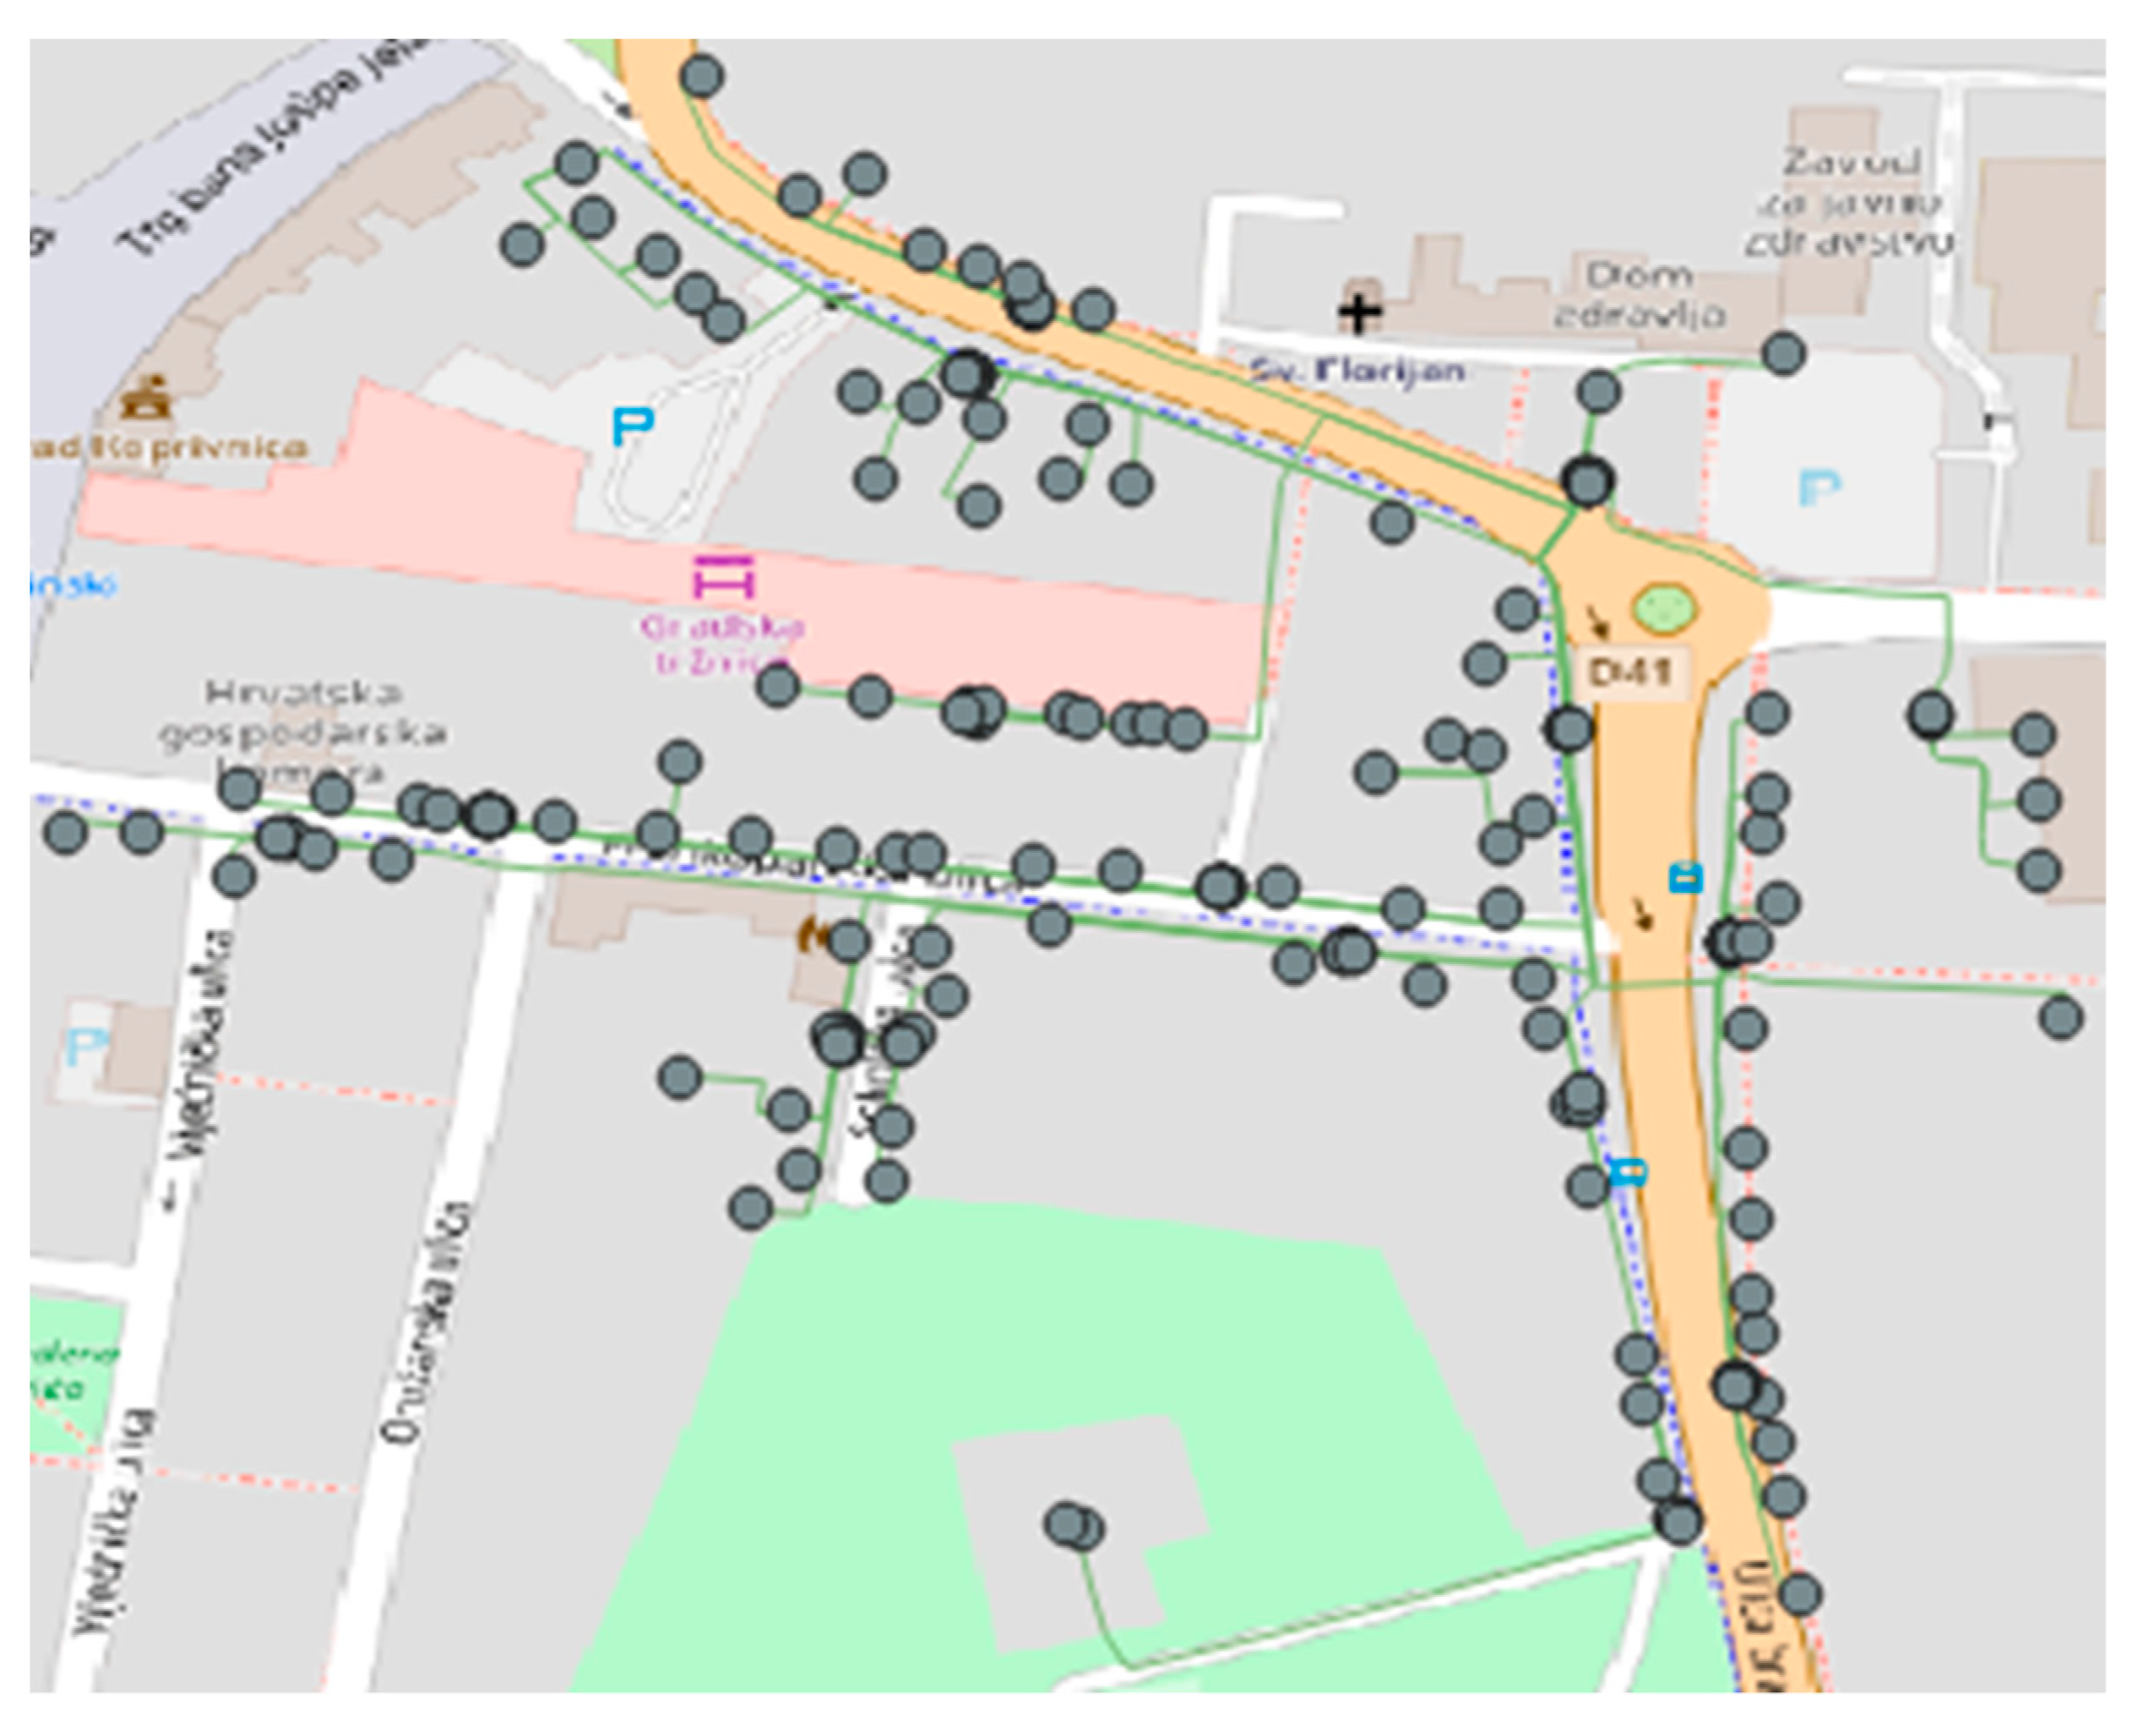
The LV distribution network is modelled using geographic information system (GIS) data. GIS data are becoming more important and are often used in a distribution network modelling [38] and distribution network analyses, e.g., distribution networks with a high penetration of PVs [39] and future distribution networks [40]. Figure 1 presents the analyzed LV distribution network, that is the part of the distribution network in Croatia, shown in QGIS. Using the attribute table in QGIS, it is possible to find more detailed information about nodes and lines. Information about nodes is the name and the type of each node. Types define the size of an end-user at each node, e.g., hospital which has three-phase loads, houses with single-phase loads, buildings with more than one household, electric switch cabinets that present the node from which cables go to each end-user etc. Information about lines is the length of each line, type of the line, from which is possible to find values of the resistance, the reactance, the maximum current and the node at the beginning and the end of the line.
2.1. Load Profile
Since the real-time measurements are not publicly available, the load profile curve was created with the help of Load Profile Generator [41]. The time-dependent load profile curve on 10 min basis is used. Two weeks were observed, 13–19 January 2020 and 1–7 August 2020. Besides the load profile curve, the installed power and the power factor for each node are known. It is implied that the installed power of each phase at the node is same, e.g., node LV54 presents a three-phase house and the maximum power of each phase is 2 kW. Since the most of households have loads that are single-phase connected to the network, values of loads connected to the node are not the same. Therefore, it is assumed that at each node one phase is loaded with 100%, one with 85% and one with 70% of the load profile curve shown in Figure A1 and Figure A2 in Appendix A. These curves are used for all nodes in which loads are single-phase connected to the network. In some nodes, e.g., in node LV2, big and important consumers, such as hospitals, are connected to the LV network. Loads in those nodes are symmetrically, three-phase connected to the network, i.e., the value of the load in each phase is the same.
2.2. PV Production Profile
PV production profile curve is created from the rooftop measurements. The value of production power in each time period is divided by the maximum production power. The time-dependent PV production profile curves on 10 min basis are created the from real data, i.e., rooftop measurements. The maximum PV production power is known in each node with the installed PV. Load profile curves for each day in January and August are shown in Figure A3 and Figure A4. The PV production profile curve values multiplied by the maximum power at each node give the value of the PV production at each node with the installed PV, for every time interval in observed week.
2.3. Battery Modelling
Deciding the optimal capacity of installed PV and residential battery storage system for making the profit could be a problem for end-users. It is expected that with the minorizing feed-in payments in the future, an optimal PV battery system size is going to shrink to a small-scale PV battery system [42]. Studies compare different energy management strategies, such as: optimization-based approaches, machine learning approaches and rule-based heuristic approaches [43]. Due to modelling assumptions, authors emphasize the necessity of taking with caution conclusions about the best energy management strategy. To unlock the volume of services provided by aggregators, authors in [44] explore the use of day-ahead time-varying active power export limits for each prosumer considering the constraints of the corresponding network.
The battery in this paper is modelled using two different optimization-based methods. In the first method, the objective function is minimizing the deviation between consumption and production at each node and the second is maximizing the profit from selling the energy on the energy market.
2.3.1. Method 1
In Method 1, the goal is to minimize the deviation between the consumption and the production. A residential battery storage can be charged both from PV production and from energy bought in the energy market. Residential battery storage can be discharged satisfying the demand at the node and selling the energy on the energy market. Method 1 does not take into consideration market prices, i.e., the battery will not charge because the price on the market is lower, it will charge because the production at the node is higher than the consumption. Depending on the characteristic of the end-user (single-phase or three-phase loads), VARTA [45] and Tesla Powerwall [46] batteries are used. Charging power, discharging power and state of charge are different, depending on the battery that is used at the node. State of charge (SOC) of the residential battery storage at the first and the last time period is set to be zero.
Equation (1) puts the constraint on the charging power of the battery for every node and at every time period, while Equation (2) puts the constraint on the discharging power. Equation (3). limits the state of charge of the battery:
Equations (4)–(6) define same constraints as Equations (1) and (2), with addition of condition that defines that the battery cannot be charged and discharged at the same time:
Equations (7) and (8) define the difference between the consumption and the production at every node and at every time period. Equation (9) defines the SOC at every node and every time period, regarding the SOC in the previous hour, charging and discharging power. The power of charging and discharging is multiplied by in order to convert power to energy:
Equation (10) represents the objective function, which has the goal of minimizing the total deviation between the consumption and the production at every node and every time period.
Figure A5 and Figure A6 in Appendix A show the charging and the discharging profile when the battery is modelled with the logic of self-sufficiency, both for January and August.
2.3.2. Method 2
In Method 2, the goal is to minimize the cost from participating on the DA market. Unlike the optimizing algorithm in Method 1, DA prices will be considered during battery charging and discharging cycles. End-user can both buy and sell on the electricity market. DA prices [47] are prices from CROPEX, the Croatian electricity market. As in Method 1, VARTA and Tesla Powerwall batteries are used, depending on the characteristic of the end-user (single-phase or three-phase loads). Charging power, discharging power and state of charge are different, depending on the battery that is used at the node. State of charge (SOC) of the residential battery storage at the first and the last time period is set to be zero.
Equations (11)–(18) are same as Equations (1)–(7) and Equation (9) described in Method 1.
Equation (19) represents the objective function of Method 2, which has the goal of minimizing the cost of buying the electricity, i.e., maximizing the profit of selling the electricity on the DA market:
Figure A7 and Figure A8 in Appendix A show the charging and the discharging profile when the battery is modelled as if prosumers are active DA market participants, both for January and August.
2.4. EV Charging Cycle Modelling
All end-users with installed PVs and residential battery storages, could potentially have EV charging stations. It is supposed that all end-users have the same Nissan Leaf Battery Electric Vehicle [48]. Similar as finding the optimal charging and discharging cycles of residential battery storages, optimal charging cycles for the battery in the EV are decided using the optimizing algorithm. The EV charging curve is price-based determined and it is same for all end-users. The battery can charge between 5:00 P.M. and 6:00 A.M. It is supposed that in these hours, end-users are at home, and it is possible for them to charge their EVs. Also, for each day in the week, the minimum charging capacity of the EV is different, depending on the wanted driving range.
Equations (20) and (21) define the maximum and the minimum charging power of the battery in the EV. Equations (22) and (23) put constraints on the SOC of battery in the EV, i.e., they define that the capacity of the battery must be between the minimum and the maximum capacity. Minimum capacity is defined by the end-user and the maximum capacity is defined by technical parameters of the EV:
Equation (24) represents the objective function of EV charging cycles. The goal of the objective function is to minimize the cost of the electricity bought on the DA market.
Table A1 and Table A2 in Appendix A show time periods during which EVs are charged, for one week in January and one week in August. In almost every time period, EV is charging with the maximum power. Because of the constraints, the EV is charging only during the night hours. The curve is not the same for every day because the needed capacity of the battery is different. The capacity is determined by the capacity at the end of the day and the needed driving range in the following day.
Table A1 shows hourly charging power for each EV’s during each day of the observed weeks. These values come as results of the optimization model presented with Equations (20)–(24) for each 10 min interval. The assumption made in the model is that EVs are only charged in the afternoon hours after the end-user arrive at their households, i.e., during the night. For this reason, only those periods are shown in Table A1. Because of the maximum charging power and the capacity of the battery, the EV is charged with 3.6 kW during most time intervals. During time periods that are not shown in Table A1, the value of charging power is 0 kW, i.e., the EVs are not charging. It is assumed that the behavior of all end-users is the same, meaning that the constraints defining charging periods are the same for every end-user with the EV.
The logic of EV charging is the same for January and for August. Table A2 shows the values for EV’s charging in August week.
3. Results
The aim of the paper is to provide a large set of scenarios and through a comprehensive analysis draw general conclusions on the impact of different LC technologies on PQ aspects in LV distributions networks. In the line with this, we created four scenarios and for each of the four scenarios, we performed four case studies. Each scenario and case study are simulated and analyzed over a period of one week in January and one week in August in time steps of 10 min. We have defined the following scenarios:
- Phase L1—Scenario 1
- Random phase—Scenario 2
- All three phases (three-phase)—Scenario 3
In Scenario 1, all LC technologies are connected to the phase L1 in every node. In Scenario 2, the phase on which LC technologies are connected, is randomly chosen for each node. In Scenario 3, we analyzed the three-phase connection of LC technologies in every node. The impact of the use of different technologies is shown in this paper. Observed cases are:
- PVs–Case 1
- PVs and EVs—Case 2
- PVs, batteries (Method 1) and EVs—Case 3
- PVs, batteries (Method 2) and EVs—Case 4
In Case 1, PVs are the only used LC technology. In Case 2 end-users have PVs and the EV charging station. In Case 3 and Case 4, PVs, battery storages (Method 1 and Method 2) and EV charging stations are connected to each observed node. The referent, or benchmark case (Initial scenario) is the one where no LC technologies are connected to the distribution network, only single-phase and three-phase loads. Simulations for each case and scenario are made for the share of LC technologies at 20% (Share 1), 40% (Share 2), 60% (Share 3), 80% (Share 4). Overall, this means that the entire distribution network described above is analyzed over 128 weekly 10 min simulations.
Asymmetrical Load Flow calculations were made using NEPLAN V558 software tool. As the results of analysis, the voltage magnitude and the voltage angle at each phase and each node are calculated. To determine the VUF, it is necessary to calculate the positive-sequence (Equation (25)) and the negative-sequence (Equation (26)) component of the voltage:
The VUF is defined as the ratio of the modulus of the negative-sequence to the positive-sequence components of the voltage at fundamental frequency, expressed as percentage [28]:
According to the Croatian Grid Code [49], the VUF at the LV node where the end-user is located must not exceed the value of 0.7% at 95% of 10 min interval in one week. General summation law is adopted for the distribution network with a large number of unbalanced installations (e.g., a number greater than 10 is considered), or when the unbalance changes randomly with time [28]. Since both conditions are satisfied in the tested network, General summation law was used to determine if the VUF in the LV network exceeds boundaries. Equation (30) defines the general summation law for resulting VUF:
3.1. Case 1
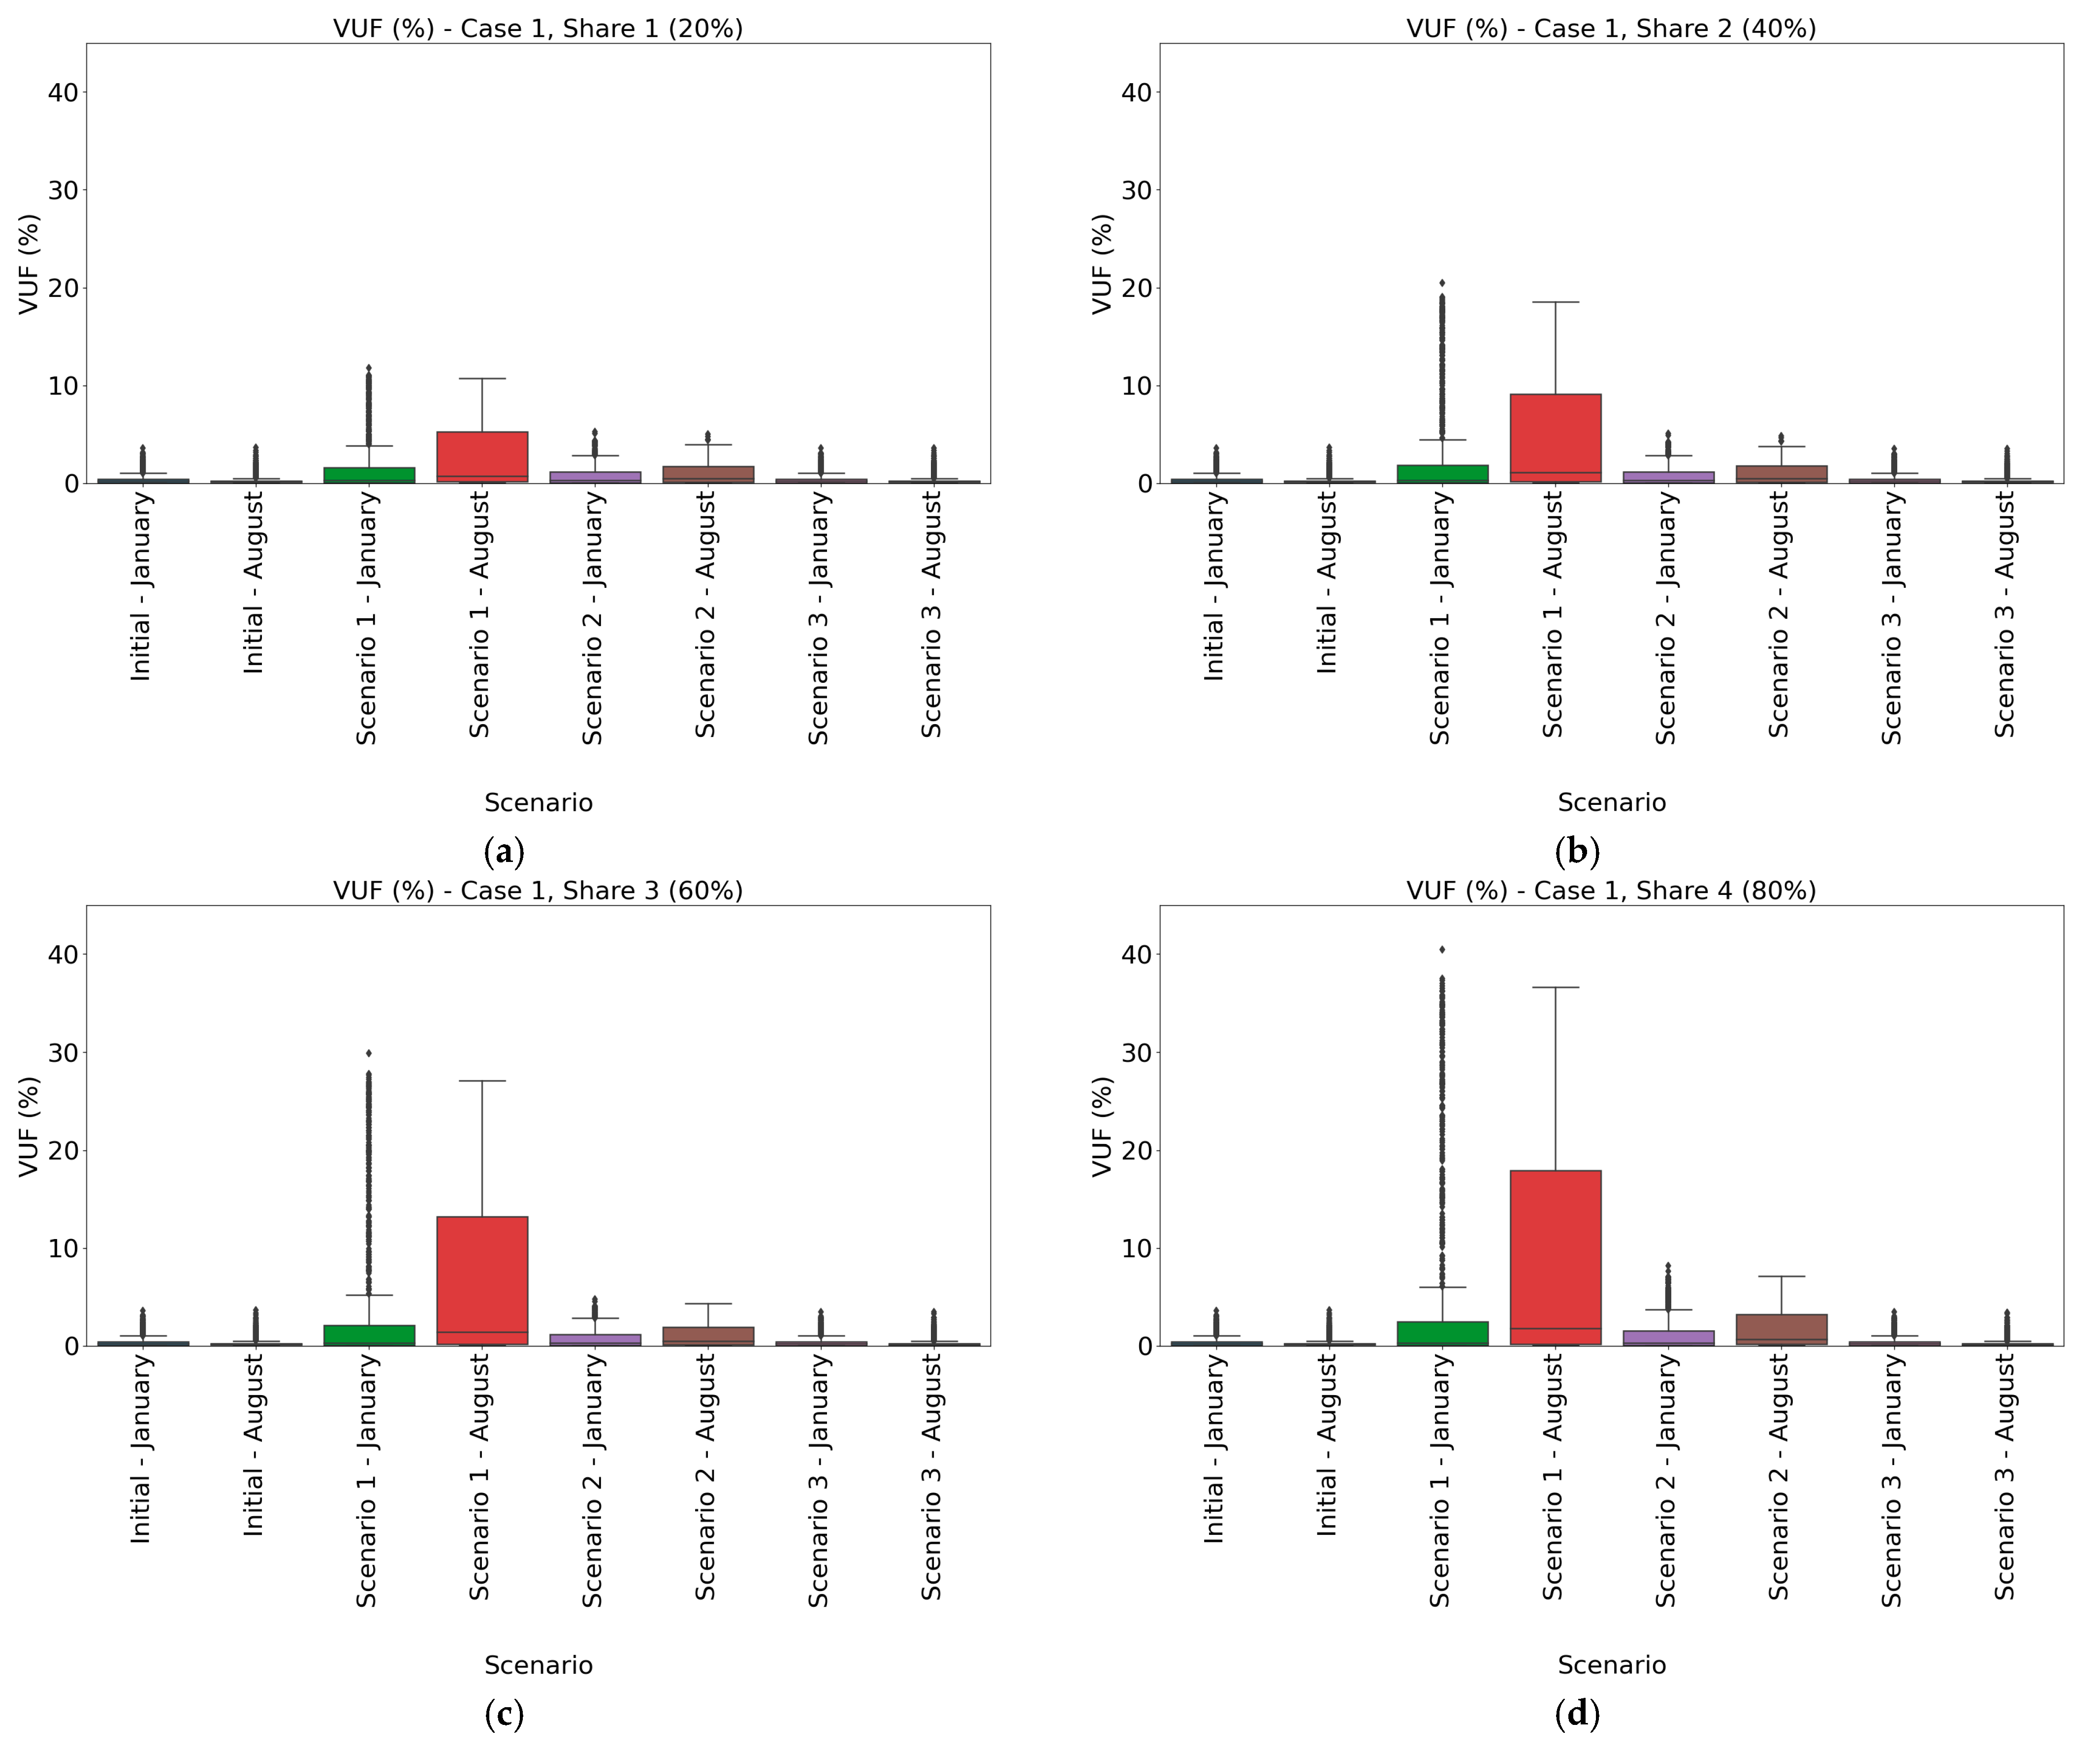
Figure 2a–d present the change of the value of the VUF with the increase of LC technologies penetration in case where end-users only have PVs on the rooftop. Comparing the results, the value of the VUF in August is generally higher than the value in January. It can be explained with the higher power of production from PVs in summer months. Therefore, the difference between total loads (consumption and production combined) of each phase is more significant in summer months. Also, the interquartile interval in August is larger compared to one in January. Because of that, there are a lot more outlier values in January. Those values must be considered because extreme scenarios and their occurrence is possible.
Comparing the results of different scenarios, the worst situation is in Scenario 1. In this scenario, PVs are always connected to same phase, phase L1. The range of the resulted VUF values is larger than in Scenario 2 and Scenario 3. Scenario 2 considers connecting PVs to a different phase at each node and that solution is preferred from the DSO’s perspective because of the avoidance of possible problems with the distribution network and the equipment. Besides the Initial scenario, the best scenario is one in which PVs are symmetrically connected to all three phases (Scenario 3). In that scenario results are similar as ones in the Initial, and the occurrence of problematic values of the voltage unbalance is not as often as in other scenarios. A three-phase connection of PVs is the possibility that should be encouraged by DSOs because the probability of negative impacts is seldom compared to a single-phase connection, when values are significantly higher, which leads to an unsatisfying performance of some of the equipment and of the distribution network as a whole.
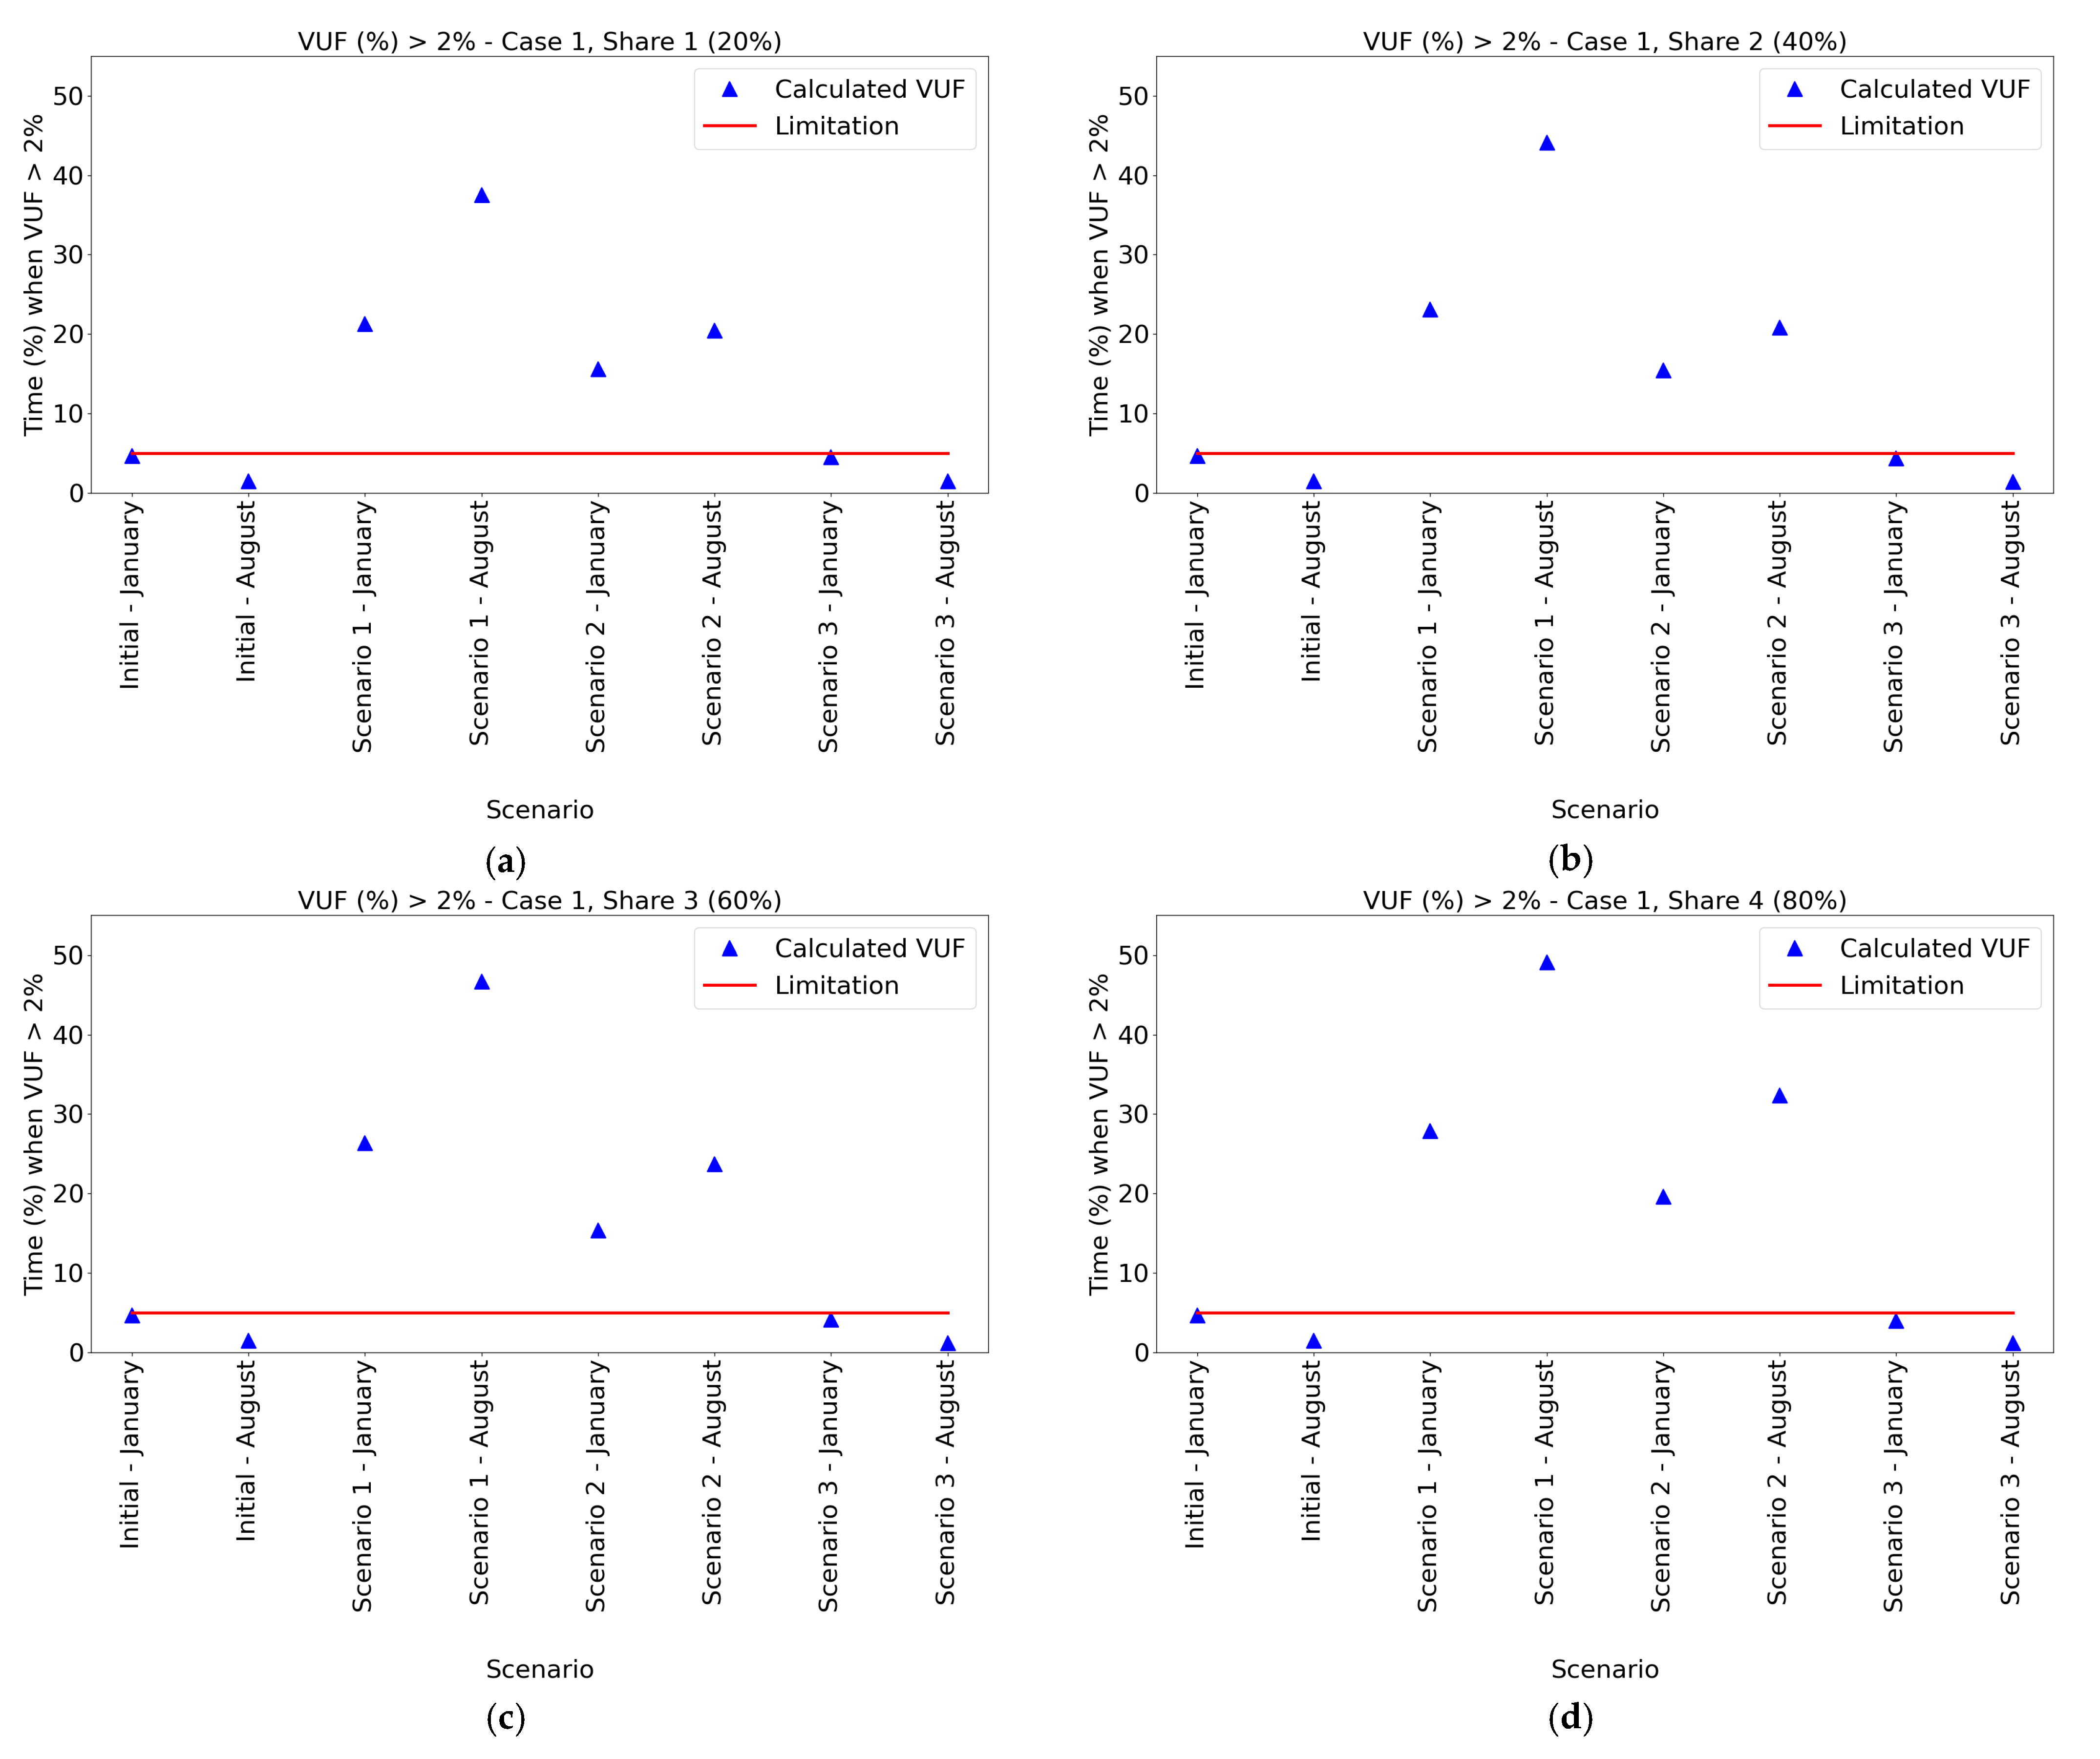
Figure 3a–d present how many ten-minutes intervals during one week are larger than the threshold value of 2%. In Initial scenario and Scenario 3 there is no problem with the voltage unbalance, i.e., the value of the VUF is less than 2% in more than 95% of 10 min intervals, which satisfies the standard IEC 61000-3-13 [28]. Comparing Initial and Scenario 2, the unallowed VUF in the observed LV network appears more often in January compared to August. However, in all other scenarios, unallowed VUF appears more often in August. In Scenario 1 unallowed voltage unbalance occurs in more than 20% in January and in little less than 40% in August when the penetration of PVs is lowest and larger than 40% when penetration is higher.
Results of Scenario 2 show that changing the phase on which PVs are connected benefits the system, i.e., the occurrence of VUF above the threshold value is not as often as in scenarios when PVs are connected to the same phase in each node.
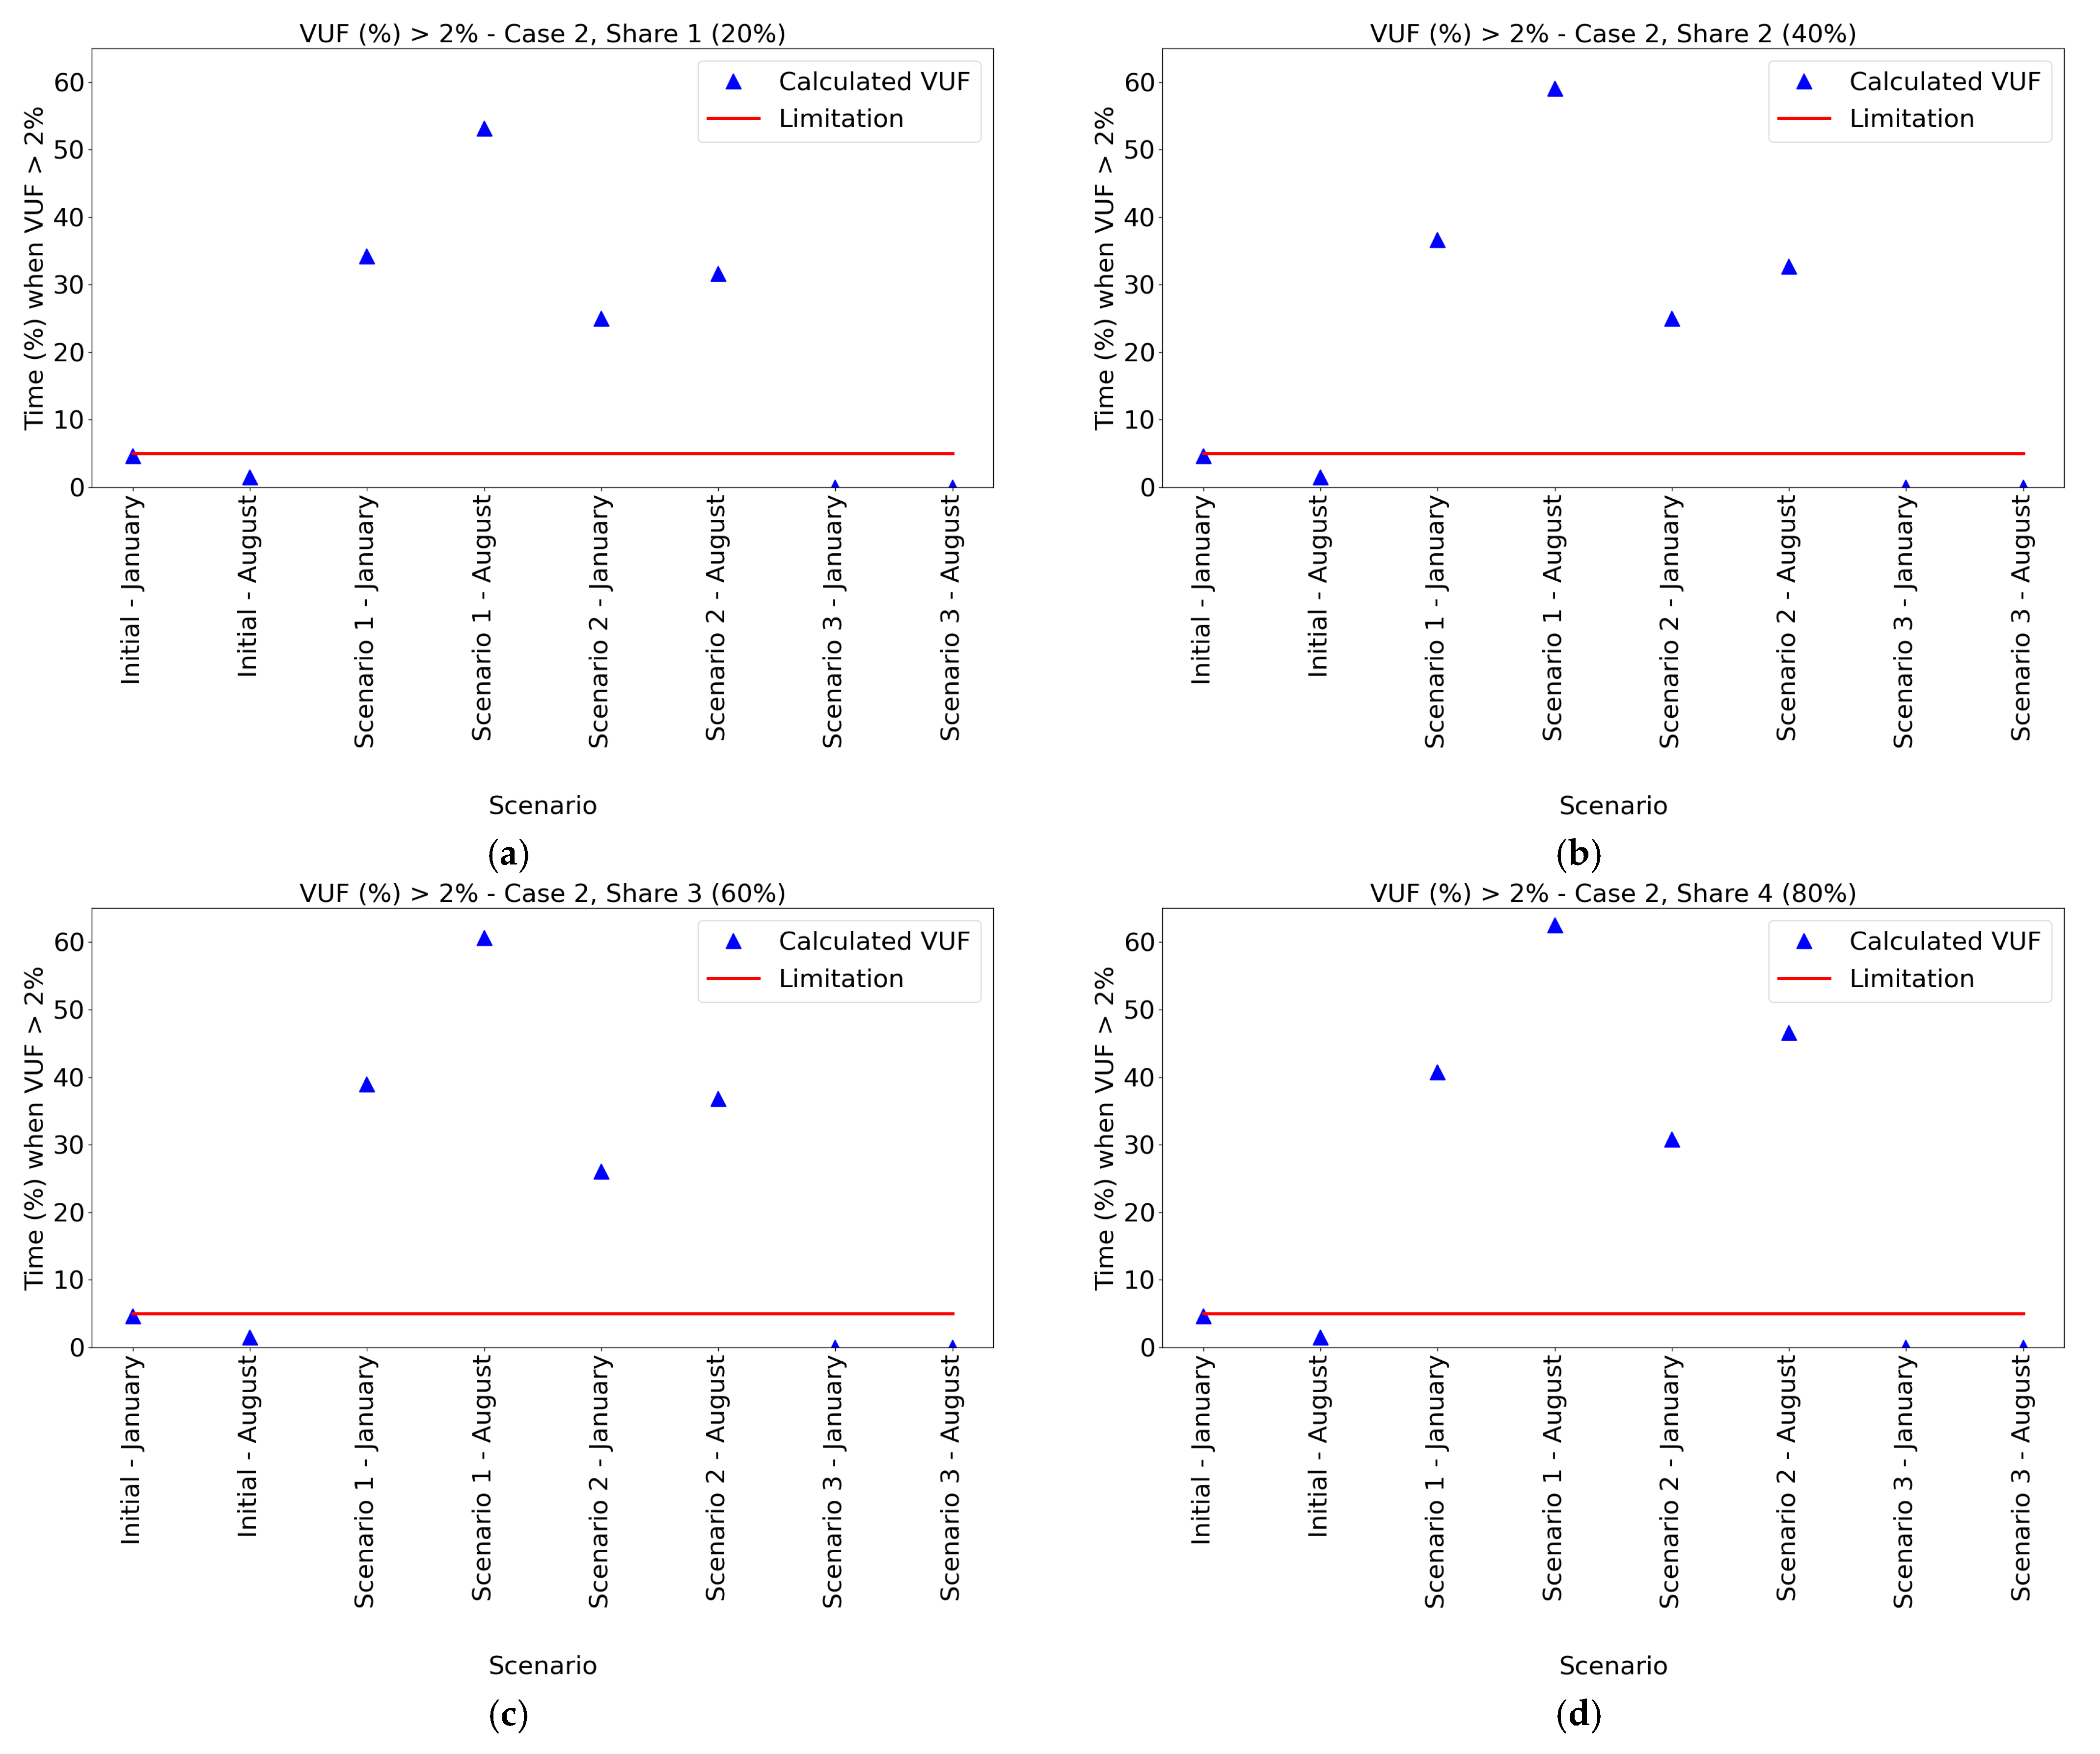
3.2. Case 2
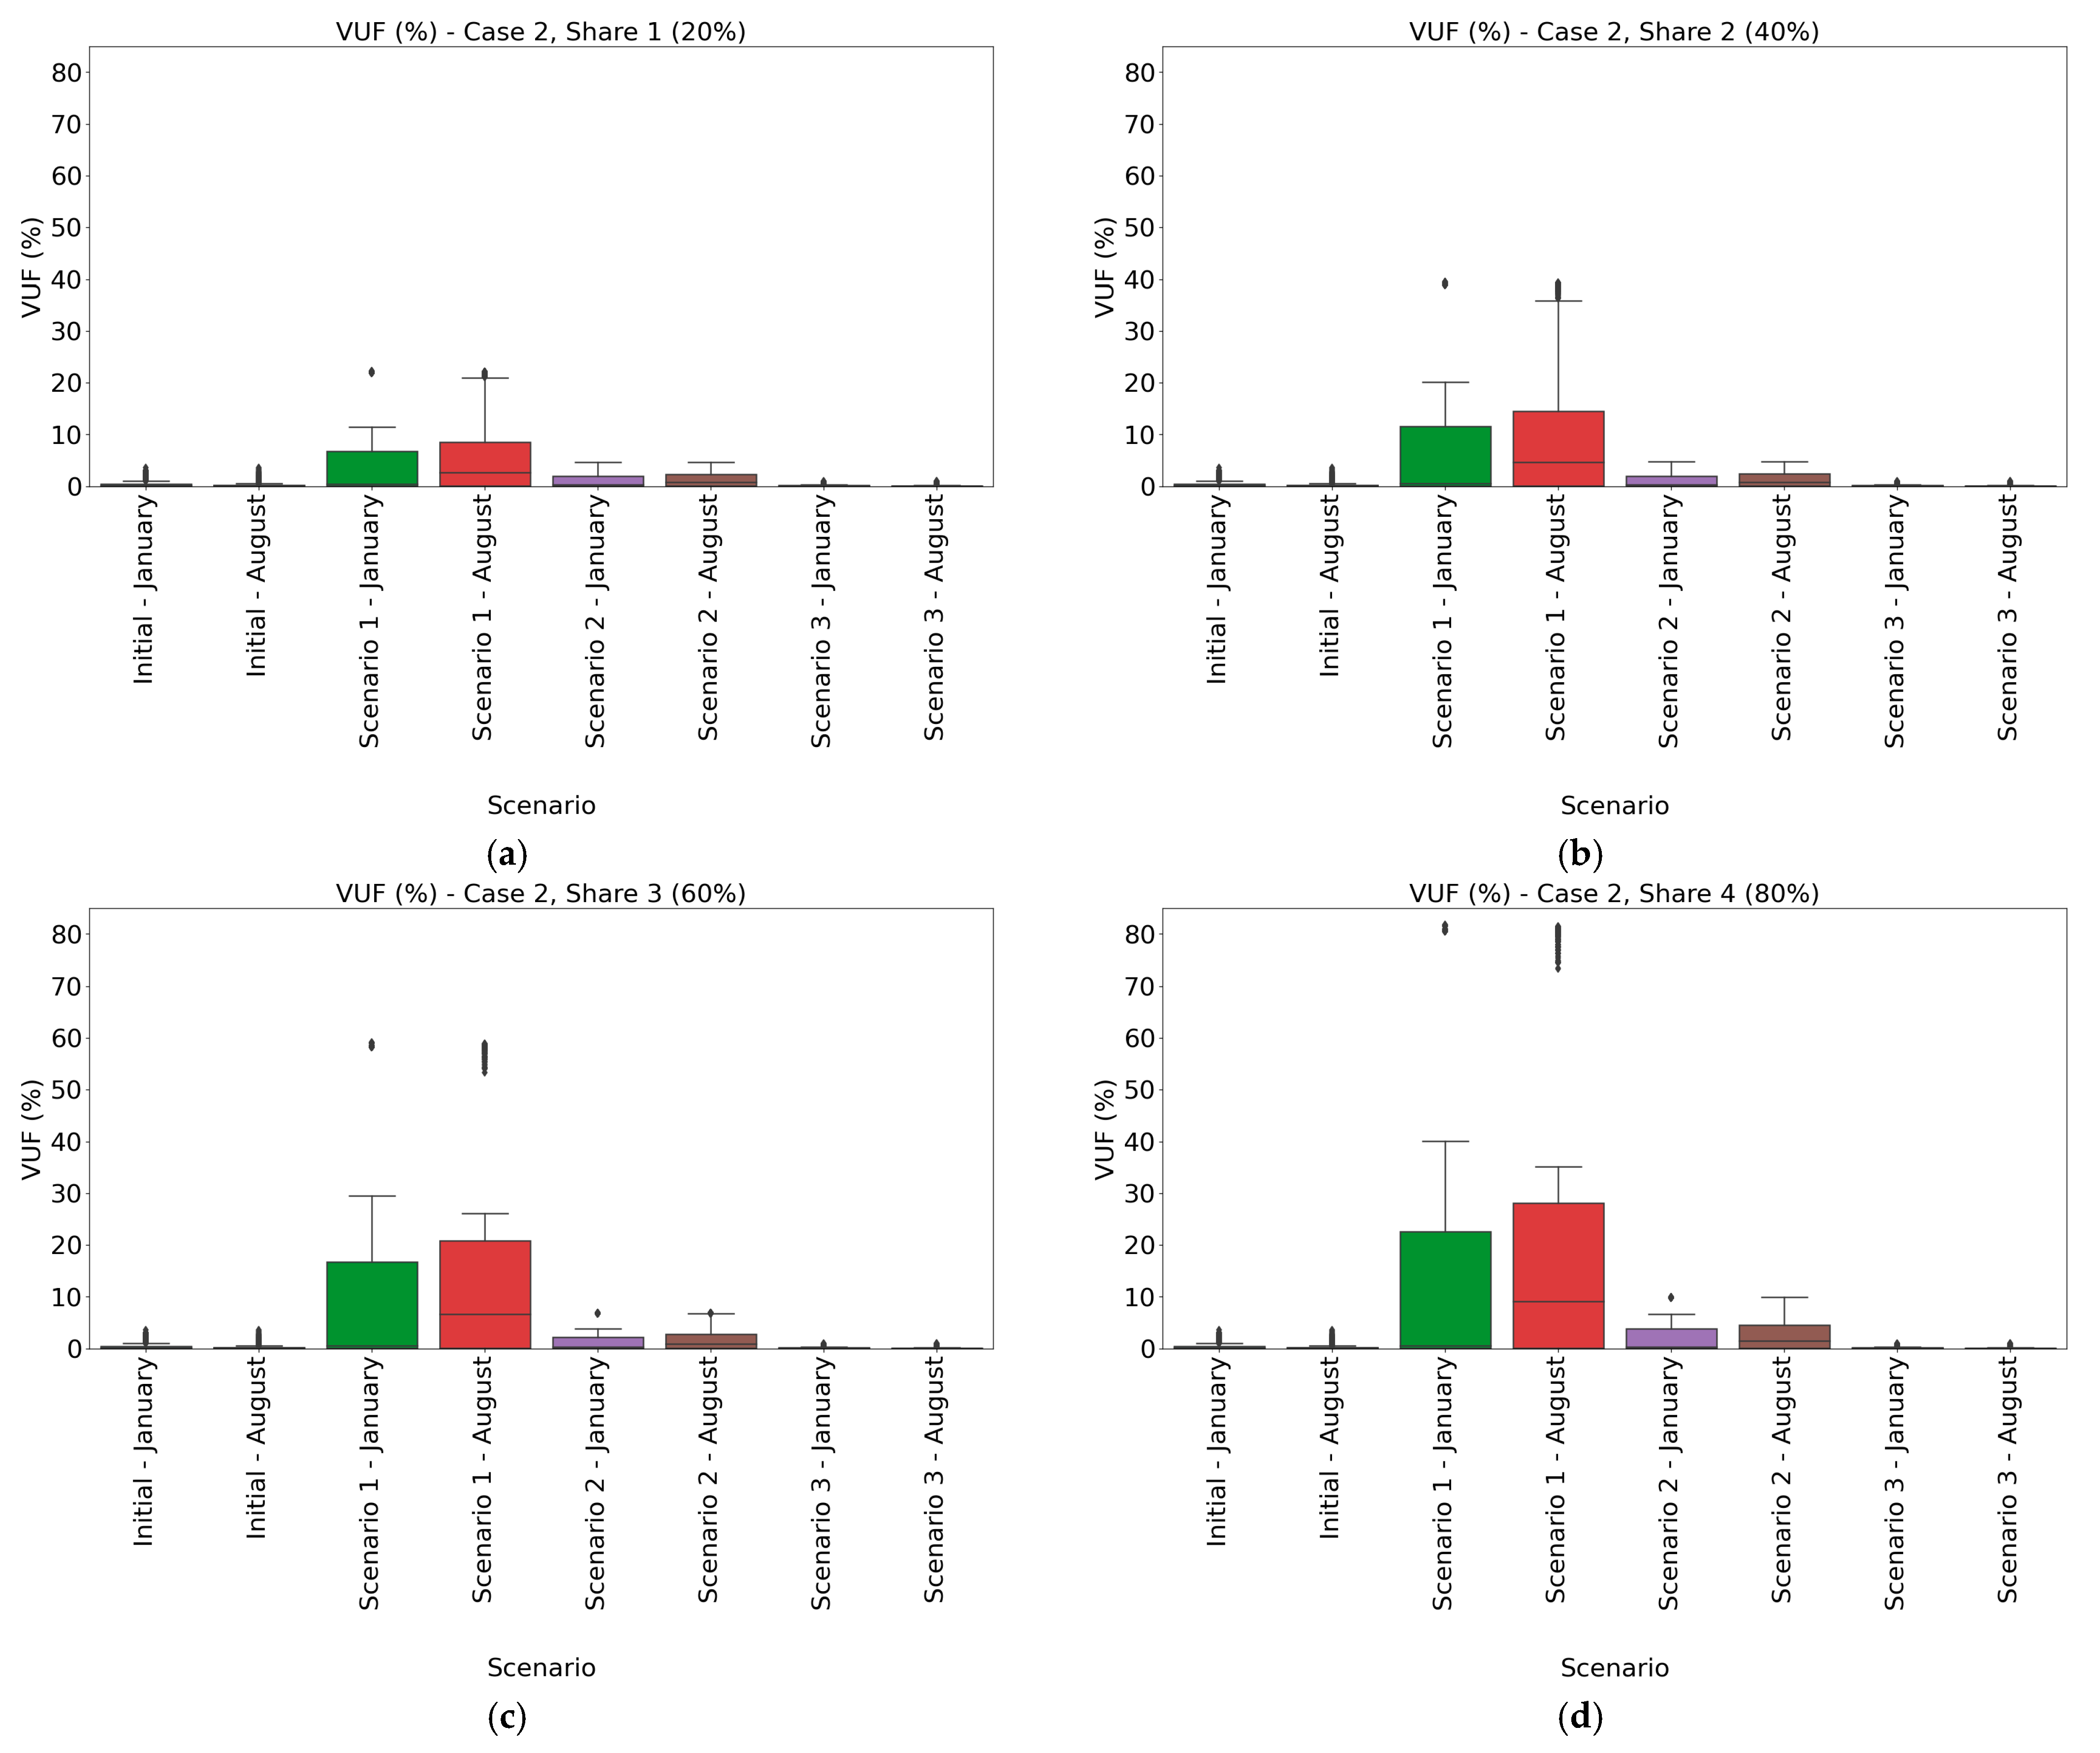
Figure 4a–d show results of the analysis made in Case 2. End-users in Case 2 besides PVs have EV charging stations and every one of them charges EVs during evening and early morning, when end-users are at home. It is supposed that every end-user drives Nissan Leaf. Therefore, the charging power curve is same for every end-user.
Comparing results of Case 2 to the previous case shows that charging EVs at home presents more problems from the network’s perspective than only a PV does. Interquartile range of the VUF values is larger than ranges in Case 1. Additional problems present outlier values, values that considerably differ from values in the interquartile range. Those values present time intervals in which difference between phase voltage magnitudes is larger than in the most of observed intervals. For example, results of Case 2, Share 4 in January and August show that for Scenario 1 most of the VUF values are not larger than 40%, but extreme values go even beyond 80%.
As one can notice in Scenario 1, placing the PVs and the EV chargers on the same phase causes more unbalance in the LV network compared to changing the phase of connection at each node. Interquartile range in Scenario 2 is smaller compared to ranges in Scenario 1. Even the outlier values are not as high as in Scenario 1.
Generally, values of VUF are larger in August than in January. Even though the interquartile range in January and August for share of 80% (Share 4) is similar for both months, there is a lot more outlier values in August. Since the EV charging curves look similar for both January and August, results in Case 2 lead to the conclusion that a PV has the dominant influence in the difference between two months.
Figure 5a–d show the percentage of time in which the summed VUF values in the LV network are higher than 2% for Case 2.
Once again, connecting the LC technologies on the same phase at each node presents a potentially large problem for the system. Depending on the share and the month, the VUF thresholding the limit can occur in more than 60% of 10 min intervals in one week (Scenario 1, Share 4, August). Even in Scenario 2, when the connecting phase changes, the unallowed VUF values can occur in almost 50% of the observed week (Share 3, Share 4, August). Knowing the negative impact that the unbalance can have on the equipment and the LV network, end-users should be encouraged to symmetrically distribute PVs and EV charging stations to all three phases, i.e., to install PVs and charging stations three-phase. No matter the share, results in Scenario 3 show that a three-phase placement of LC technologies additionally reduce the time in which the unallowed VUF is present in the network.
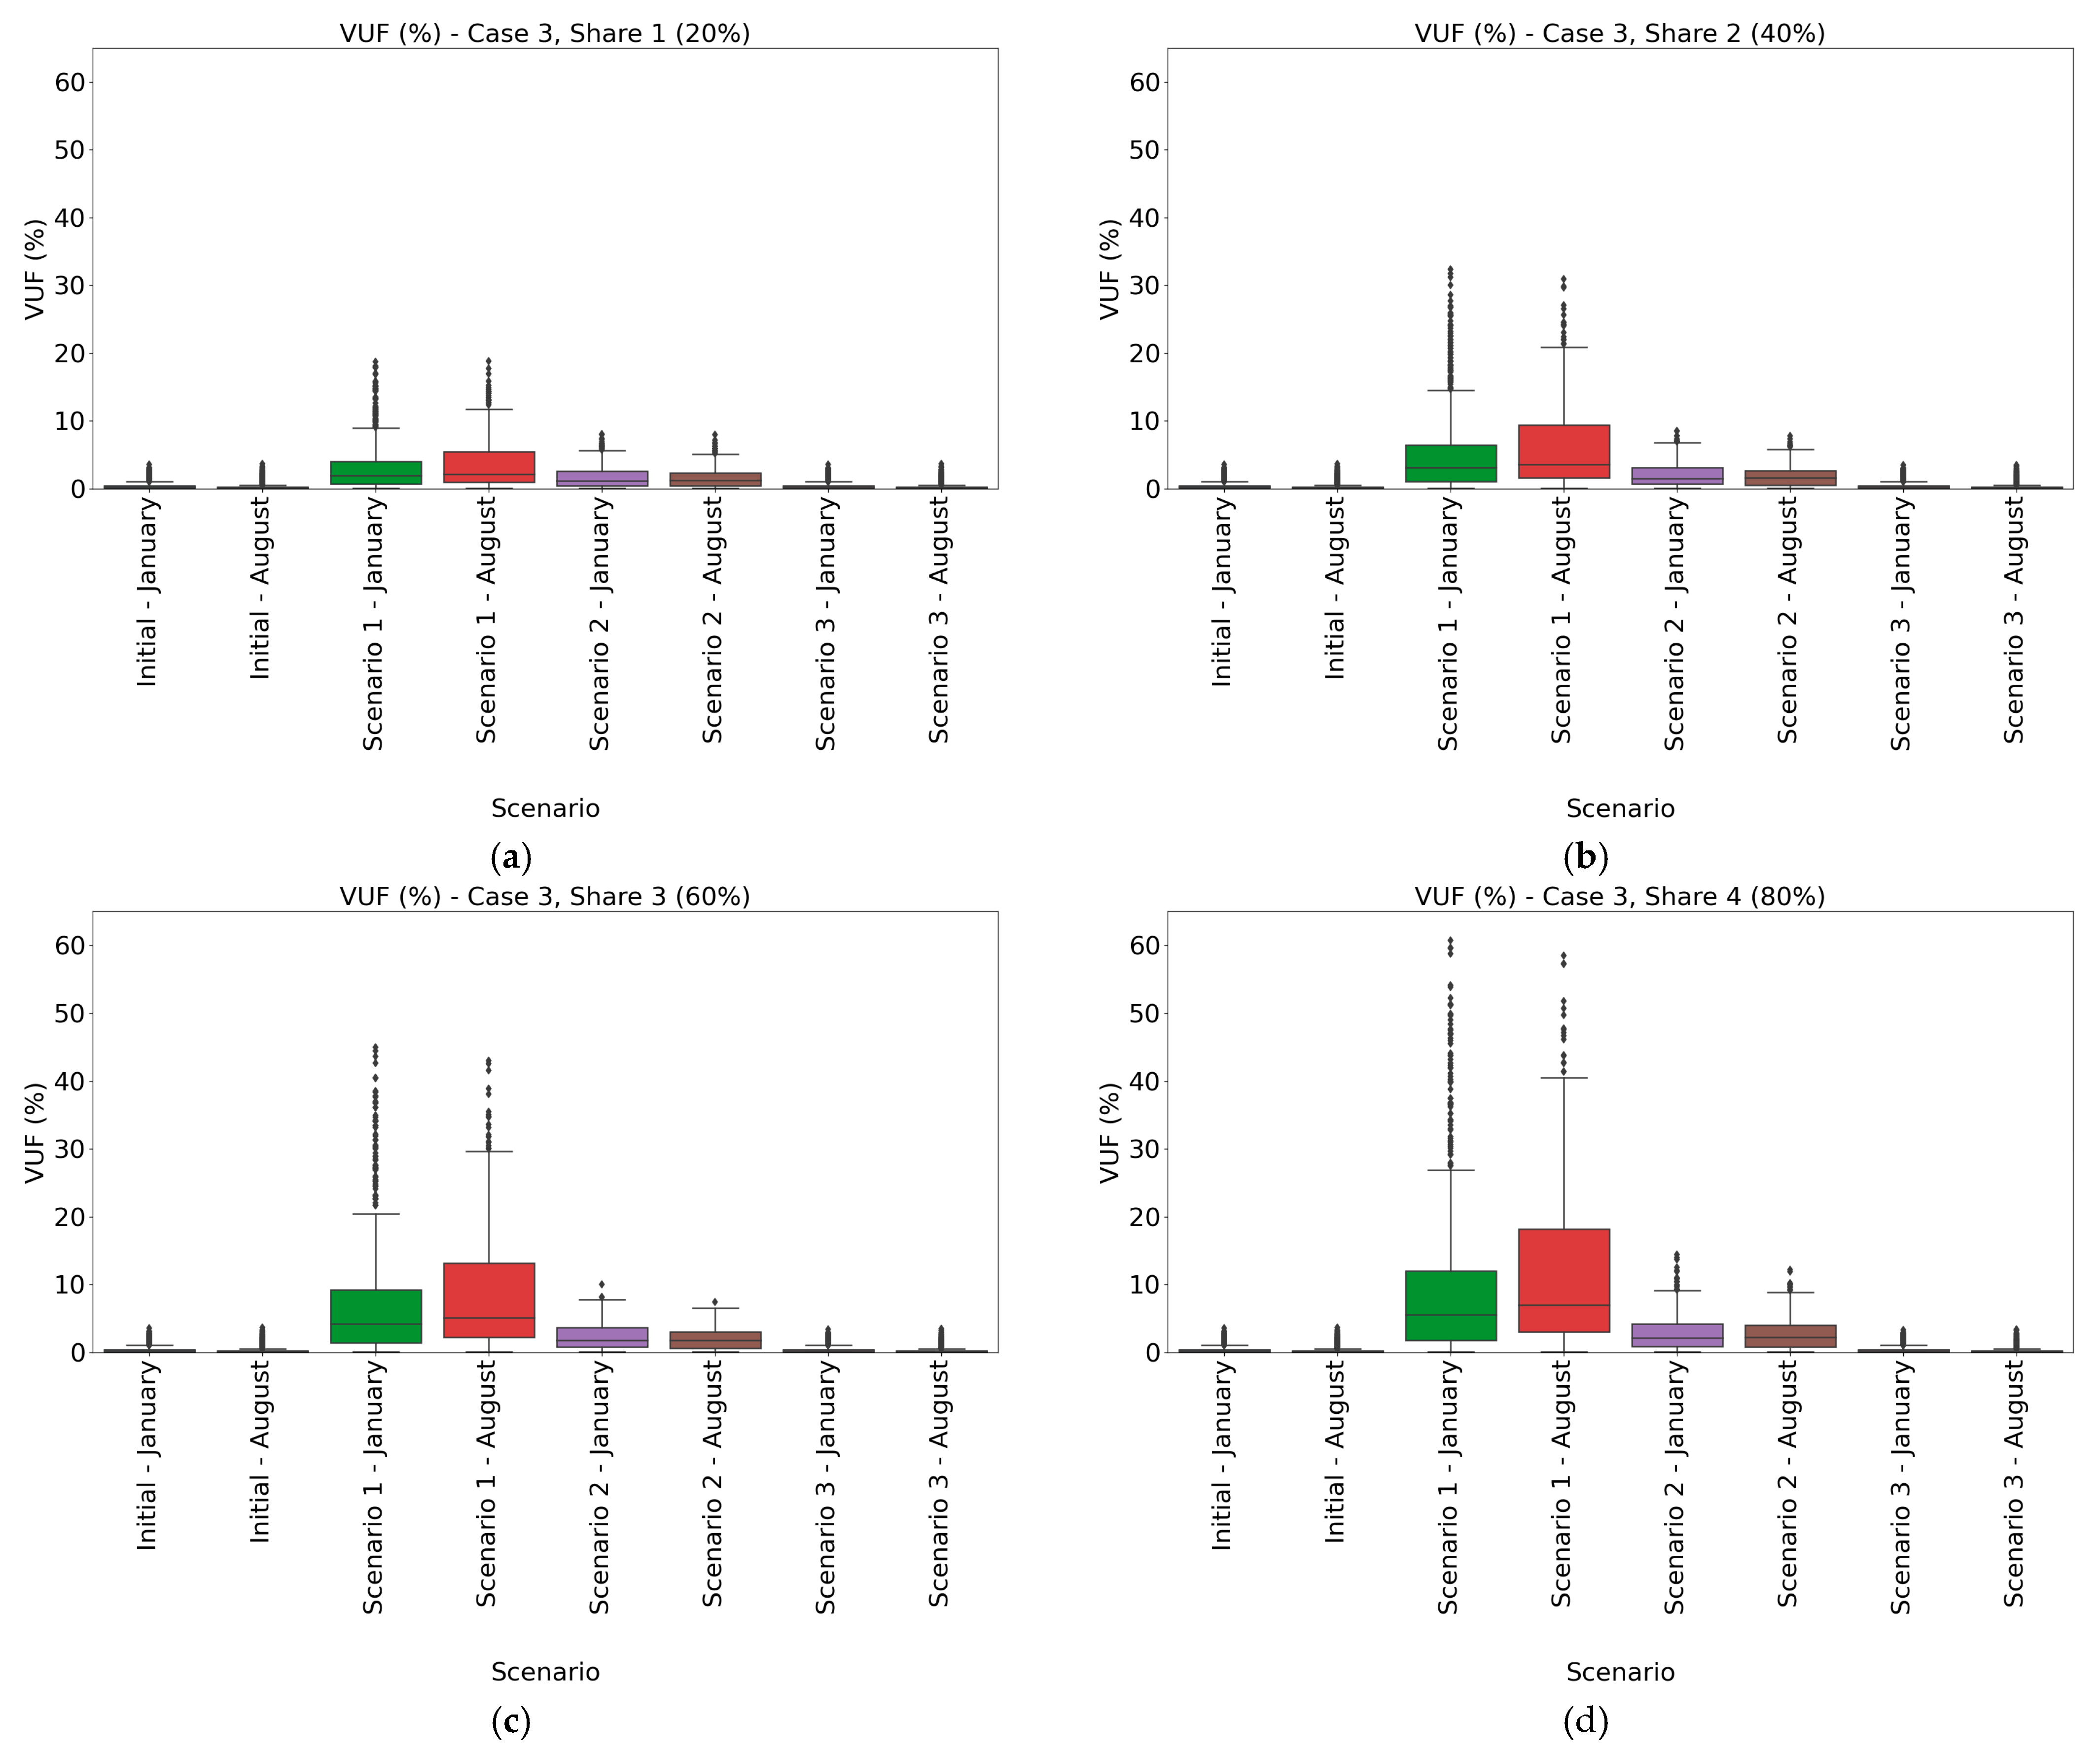
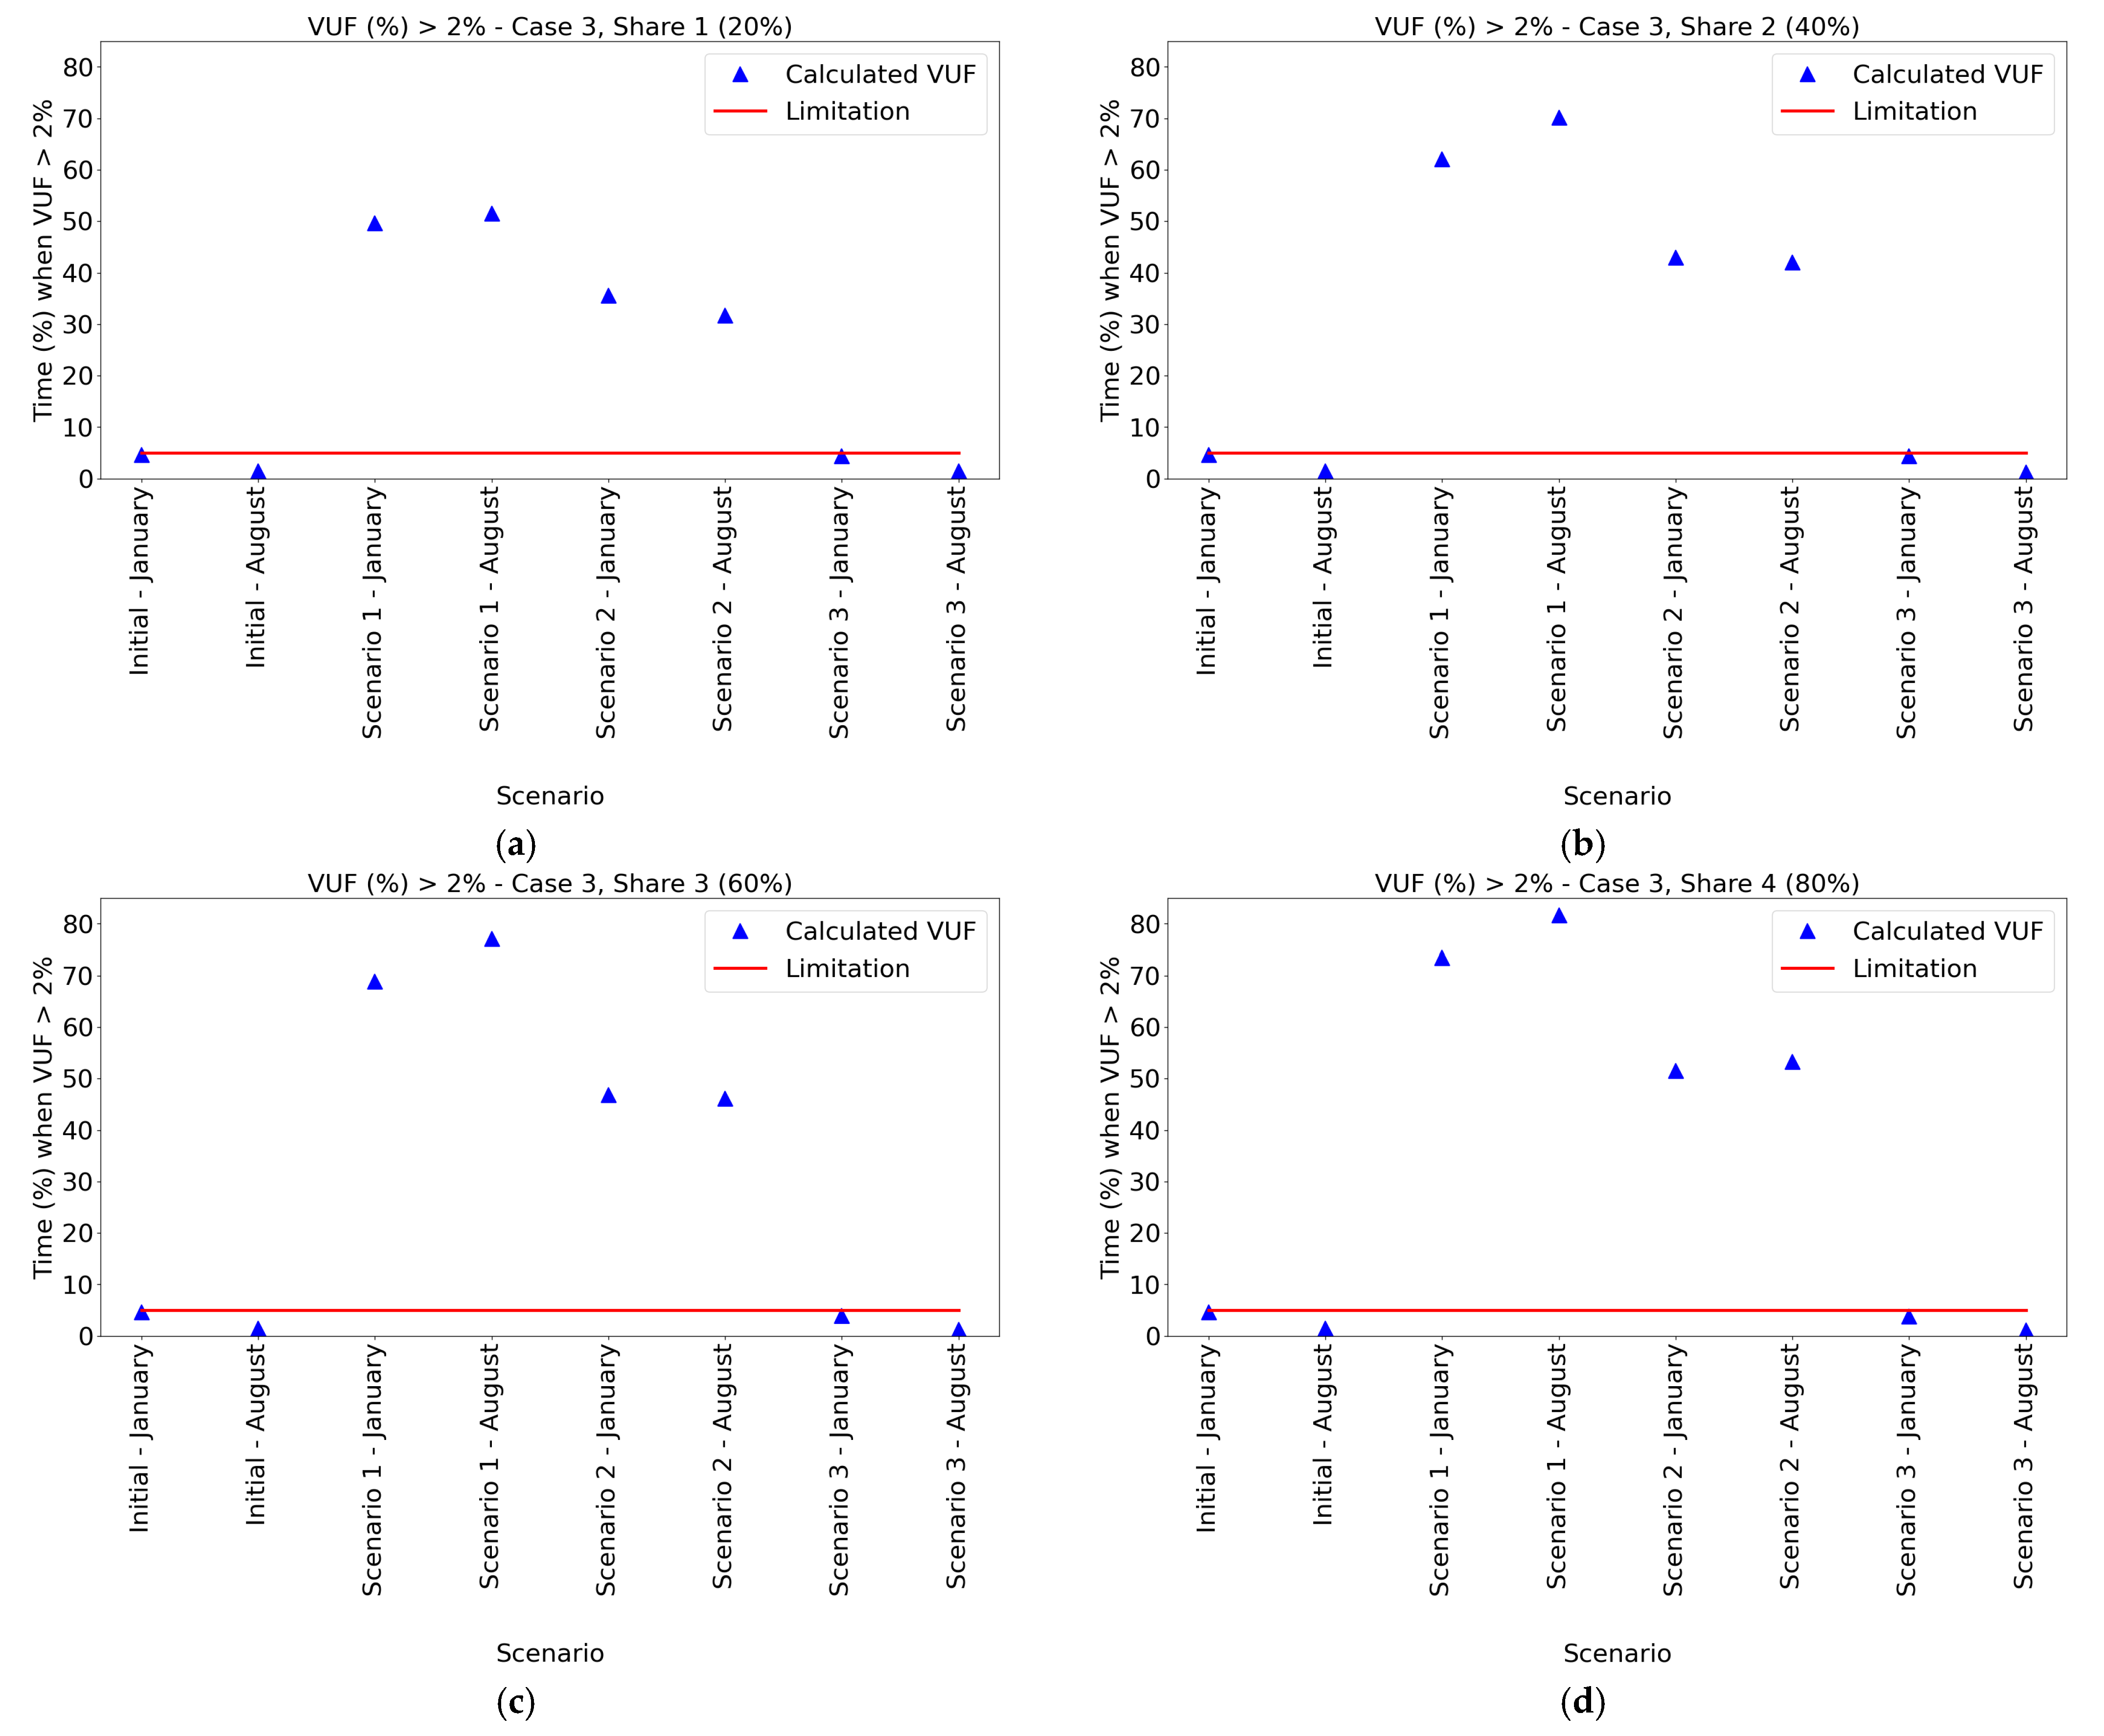
3.3. Case 3
Analysis in Case 3 was made for the end-user that has hybrid system consisting of the PV, the EV charging station and the battery with the charging and the discharging power curve created with Method 1 (Section 2.3.1). Figure 6a–d present results of the analysis. Comparing values to those in Case 2, when end-user did not have the battery, shows that using the battery storage could decrease maximum values of the VUF in the LV network, e.g., maximum values of the VUF in Case 3 do not exceed 60%, while values as high as almost 80% occur in Case 2.
The difference between January and August is not as significant as in Case 1. Since the battery is used for deviation minimization, increased generation power in the August is reduced with the battery storage. As in all previous cases, Scenario 2 shows that when end-users decide to single-phase connect their LC technologies, they should be connected to a different phase at every node. No matter the month, scenario and share, the maximum value of the VUF does not exceed 20%. Results show that the difference between Initial and Scenario 3 is not as significant as difference between Initial and scenarios in which hybrid system were connected single-phase. Values of the VUF that are thresholding limitations do not occur often and therefore reduce the negative impact.
Figure 7a–d show how often does the VUF value threshold the limit set by the standard [28] in Case 3. Despite the fact that the addition of the battery storage does not significantly impact on the VUF value or even decreases them (compared to Case 2), frequency of the unallowed VUF occurrence is higher in Case 3 than in above mentioned Case 2. While the month, share and scenario in which frequency is the highest, remains the same as in previous cases, results of the analysis in August, Scenario 1, Share 4, shows that the unallowed VUF values occur in more than 80% of the observed weekly 10 min intervals.
Comparing the results of Case 2 to ones of Case 3 shows that decreasing the VUF values does not inevitably mean decreasing the frequency of the occurrence of the VUF values that threshold limitations. In all scenarios and for all shares, a time when the VUF values are higher than 2% is higher in Case 3 than in Case 2. The exception is Scenario 3 in which LC technologies are three-phase connected to the node. Despite the share and the month, three-phase connection of the LC technologies does not present problems related to the unallowed VUF. In order to decrease the impact of single-phase loads, DSOs should encourage end-users to connect PVs, battery storages and EV charging stations symmetrically to all three phases, so that end-users become the solution and not the cause of the LV network problems.
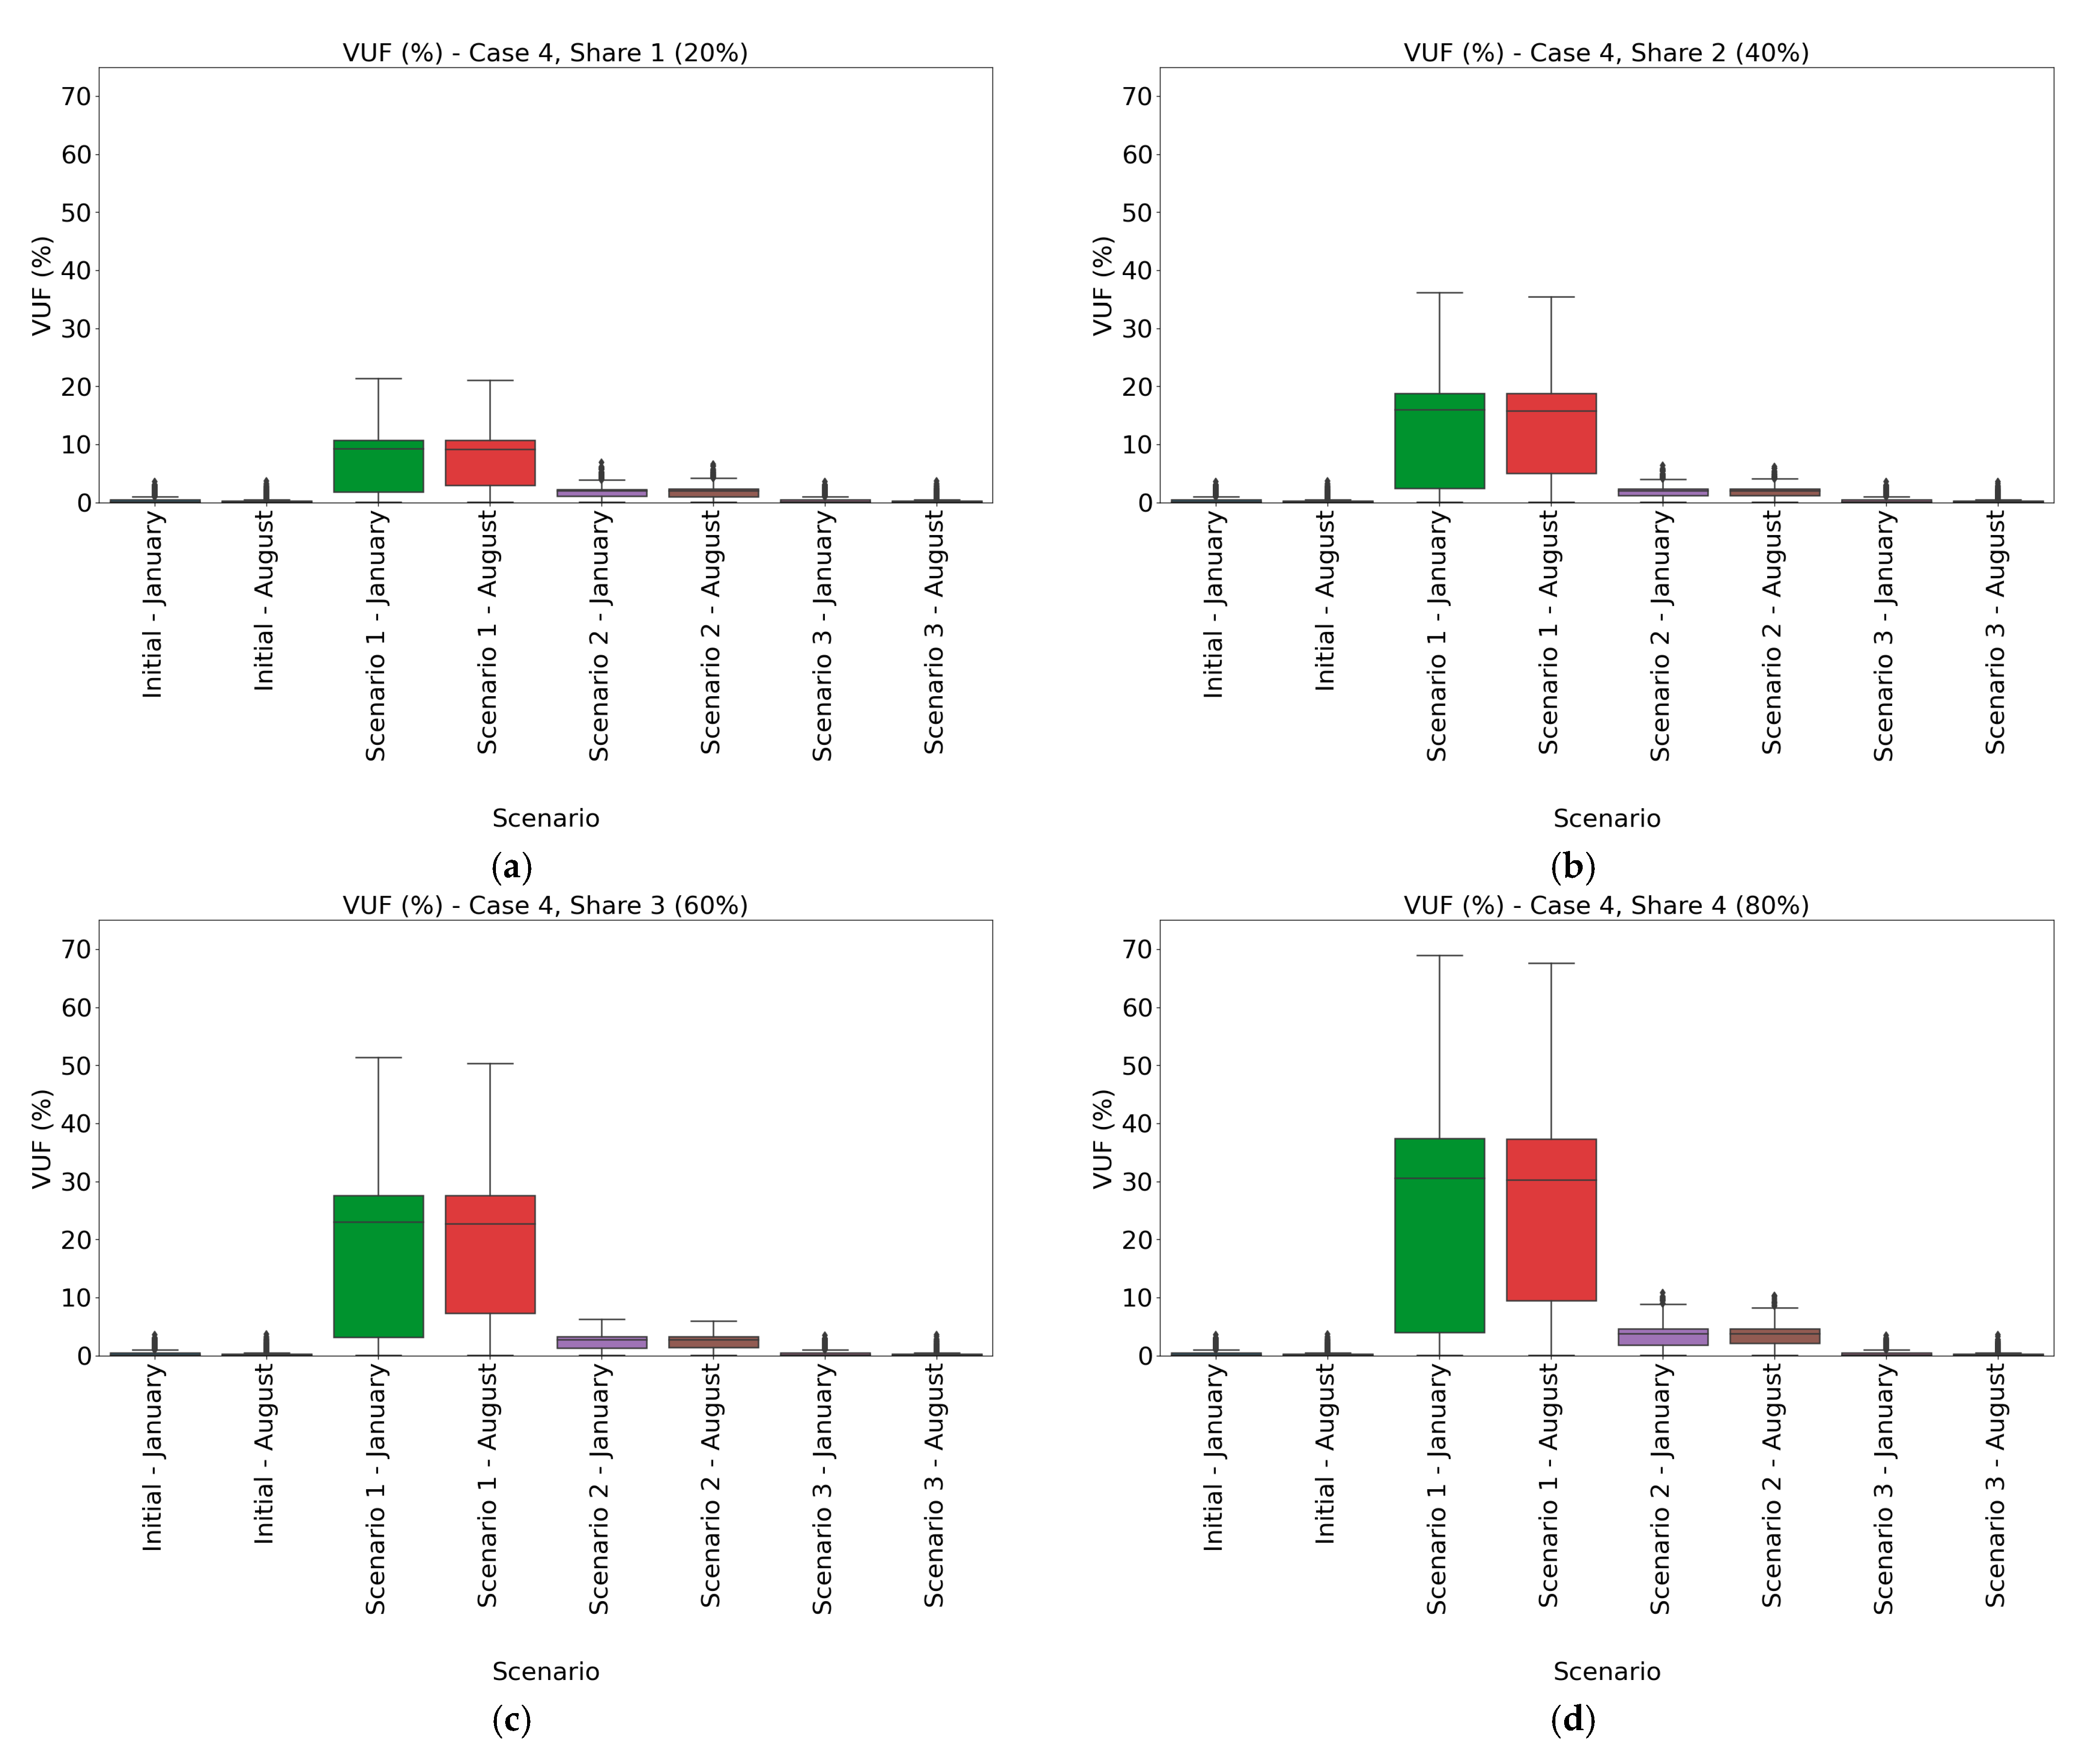
3.4. Case 4
Figure 8a–d show results of the analysis made in Case 4. Results show that end-users that have battery modelled as prosumers are active DA market participants cause voltage unbalance with values that are slightly higher than those in Case 4 (self-sufficient end-users). Maximum values are not as high as extreme ones in Case 2 when end-users with only the PV and the EV charging station cause the voltage unbalance with the value of the VUF that go as high as 80%.
However, it is important to emphasize the interquartile range in Case 4. The interquartile range is significantly higher than the one in the previous mentioned Case 2 and Case 3. That can be applied to all scenarios, shares and for both January and August. The other important thing is a smaller number of outlier values, which indicates that there is a small number of extreme situations in which the VUF values are outside the interquartile range. Therefore, from the DSO’s perspective, a situation in which charging and discharging cycles of the battery storage are market driven, is not a preferred situation which should be encouraged in order to avoid or decrease the VUF values that are above set boundaries.
Comparing results of Case 4, depending the share and the month, shows that values of the VUF in Scenario 1 are more than twice larger compared to those in Scenario 2. Also, with the growth of the share of LC technologies, maximum values of the VUF in scenarios when LC technologies are connected to the same phase in each node grow faster. Maximum value for Share 1 is little less than 25% and for Share 4, maximum value passes 70%. When end-users connect LC technologies to a different phase at each node, VUF values do not exceed 10%.
Comparing results of Case 4, depending the share and the month shows that values of the VUF in Scenario 1 are more than twice larger compared to those in Scenario 2. Also, with the growth of the share of LC technologies, maximum values of the VUF in scenarios when LC technologies are connected to the same phase in each node grow faster. Maximum value for Share 1 is little less than 25% and for Share 4, maximum value passes 70%. When end-users connect LC technologies to a different phase at each node, VUF values do not exceed 10%.
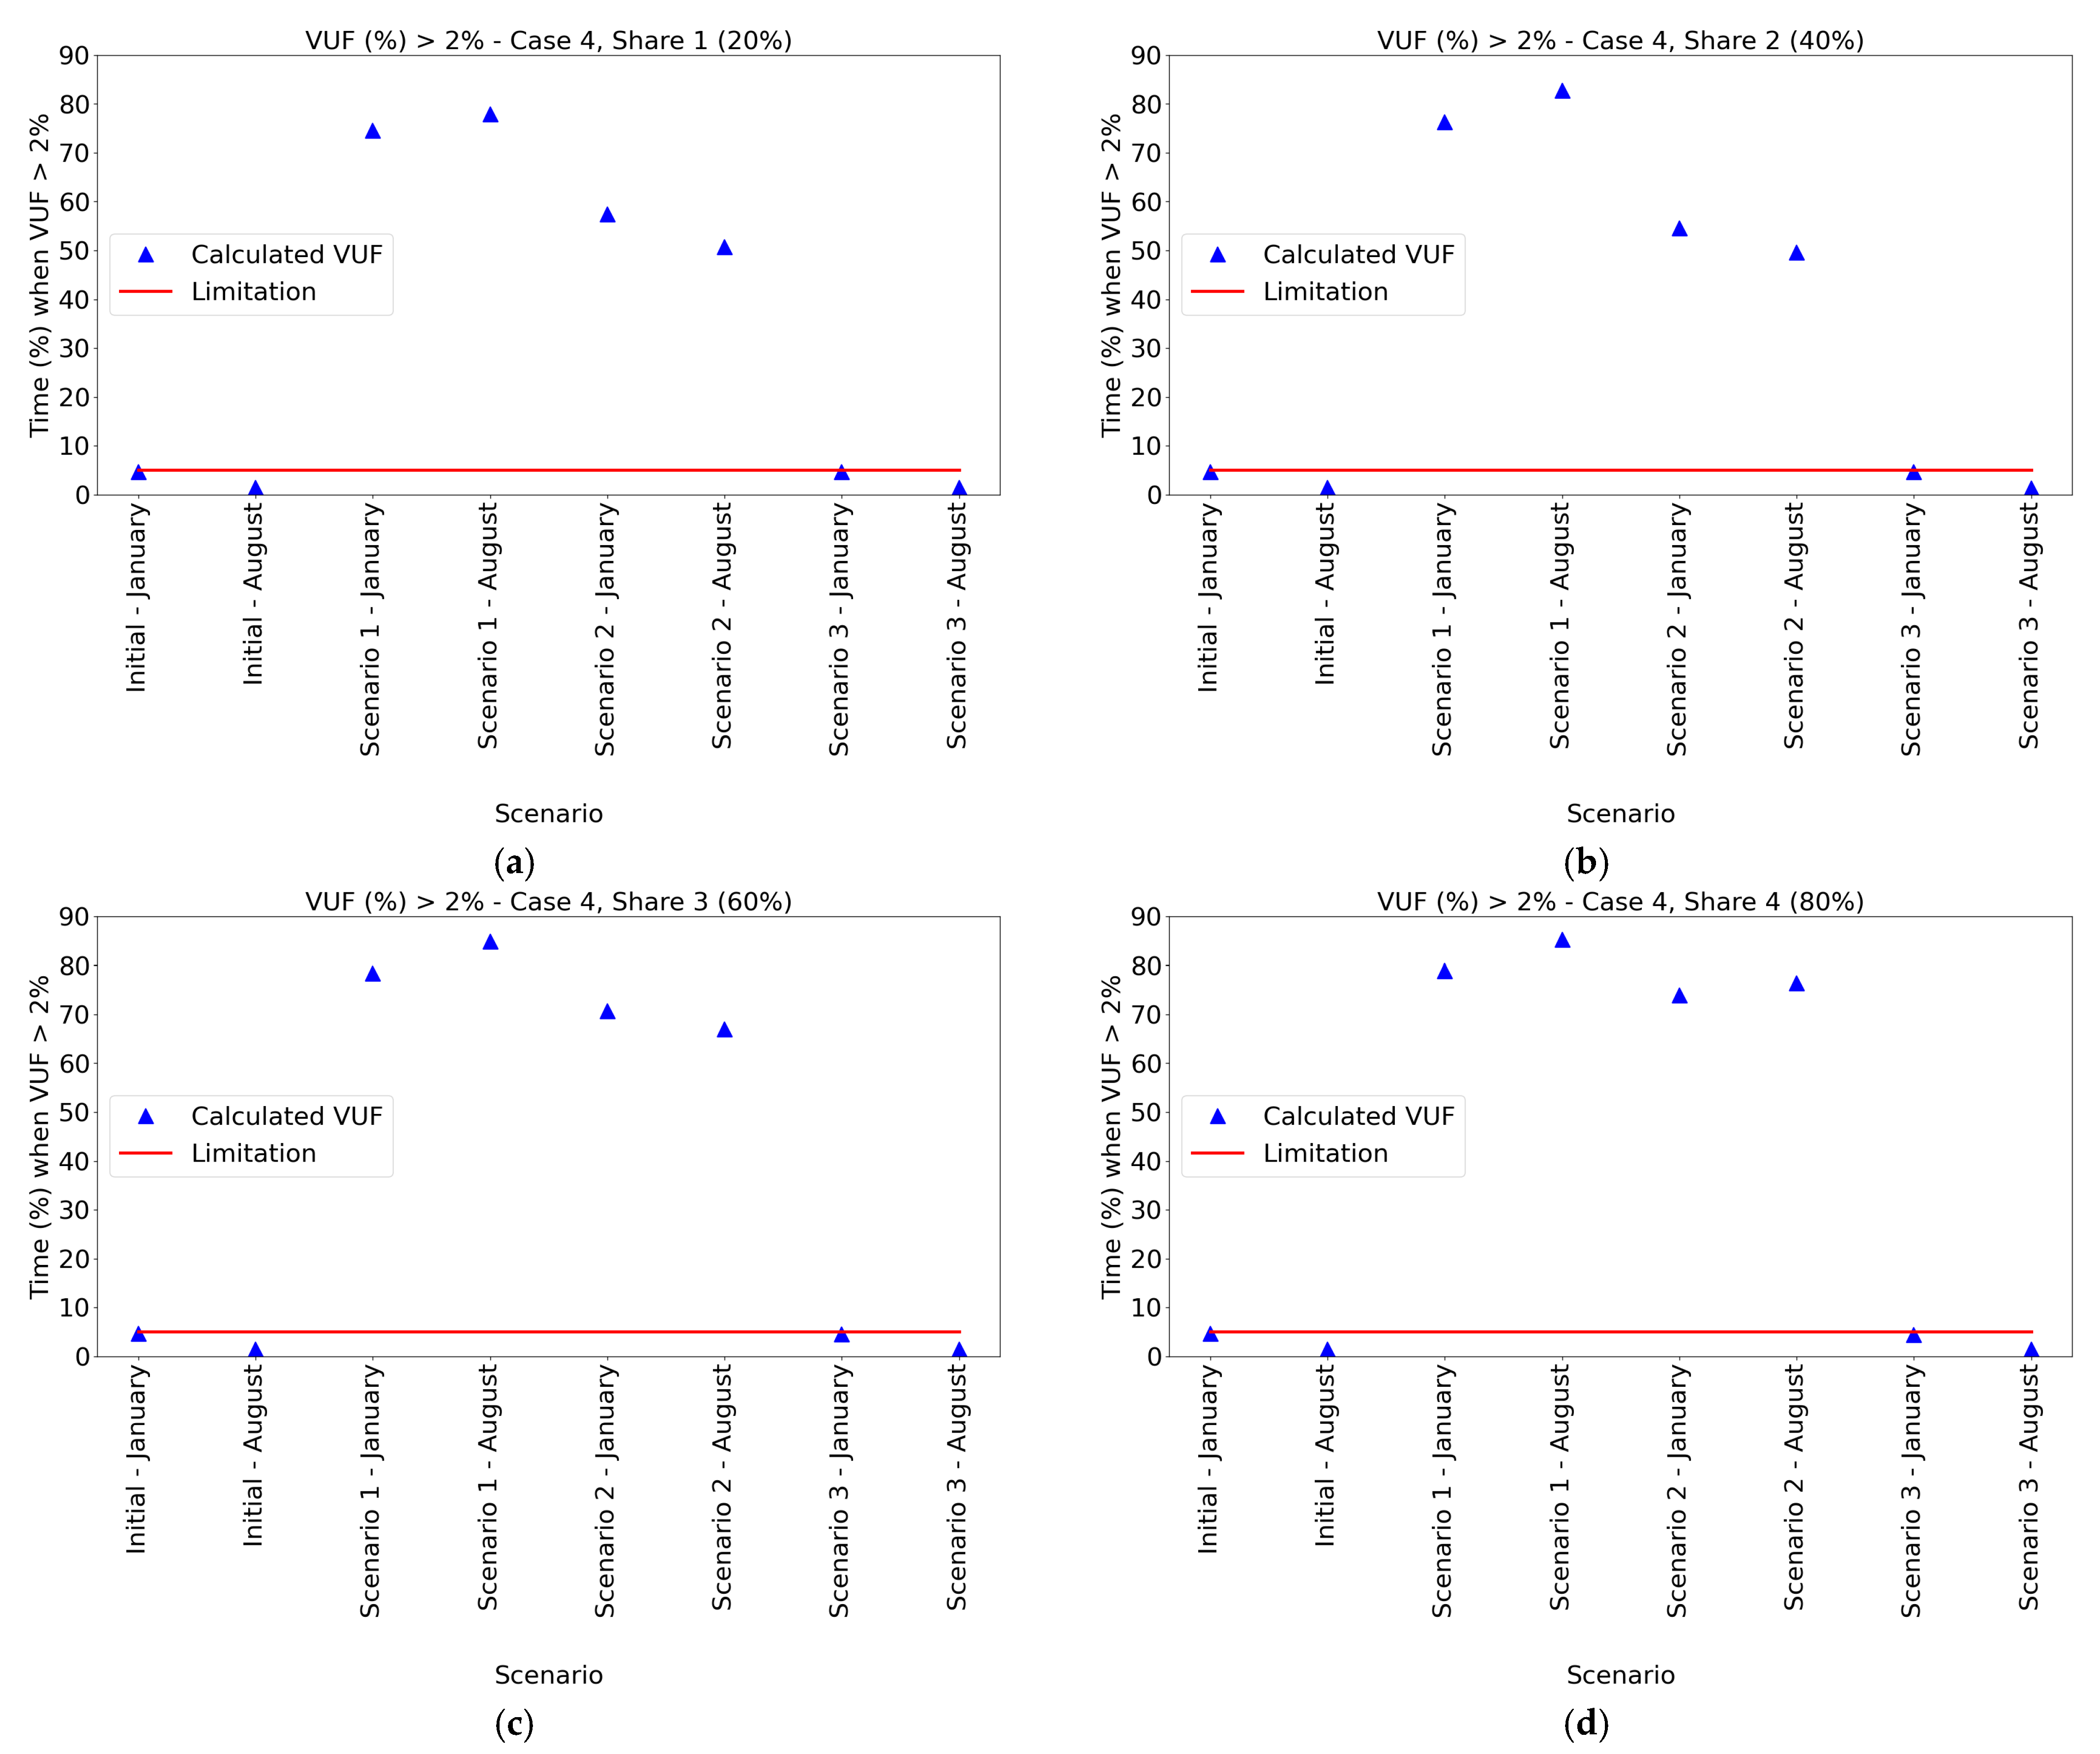
Figure 9a–d show that the previous mentioned occurrence of smaller values of the VUF does not necessarily mean that the situation in Case 4 is better than in other cases. Just the opposite, it is shown that Case 4 is the worst analyzed case in this paper. The analysis show that the most time in which the VUF is higher than the 2% limitations occurs in August, when in Scenario 1, Share 2–Share 4, VUF thresholds the limit in more than 80% of 10 min intervals during the observed week.
Same as in Case 3, the battery storage is used in Case 4. The difference is that in Case 3, battery storage is a modelled with the logic of the self-sufficiency. The comparison with Case 3 shows that changing the method which determines charging and discharging cycles does not significantly impact on the occasions related to the voltage unbalance, i.e., the occurrence of the VUF values thresholding the limit is almost as frequent as in Case 4 in Scenario 1. The difference in Scenario 2 is much more visible, which leads to the conclusion that changing the connection phase at each node improves the voltage unbalance. Results of Scenario 3 shows that a three-phase connection does not produce thresholding VUF values in alarming frequency.
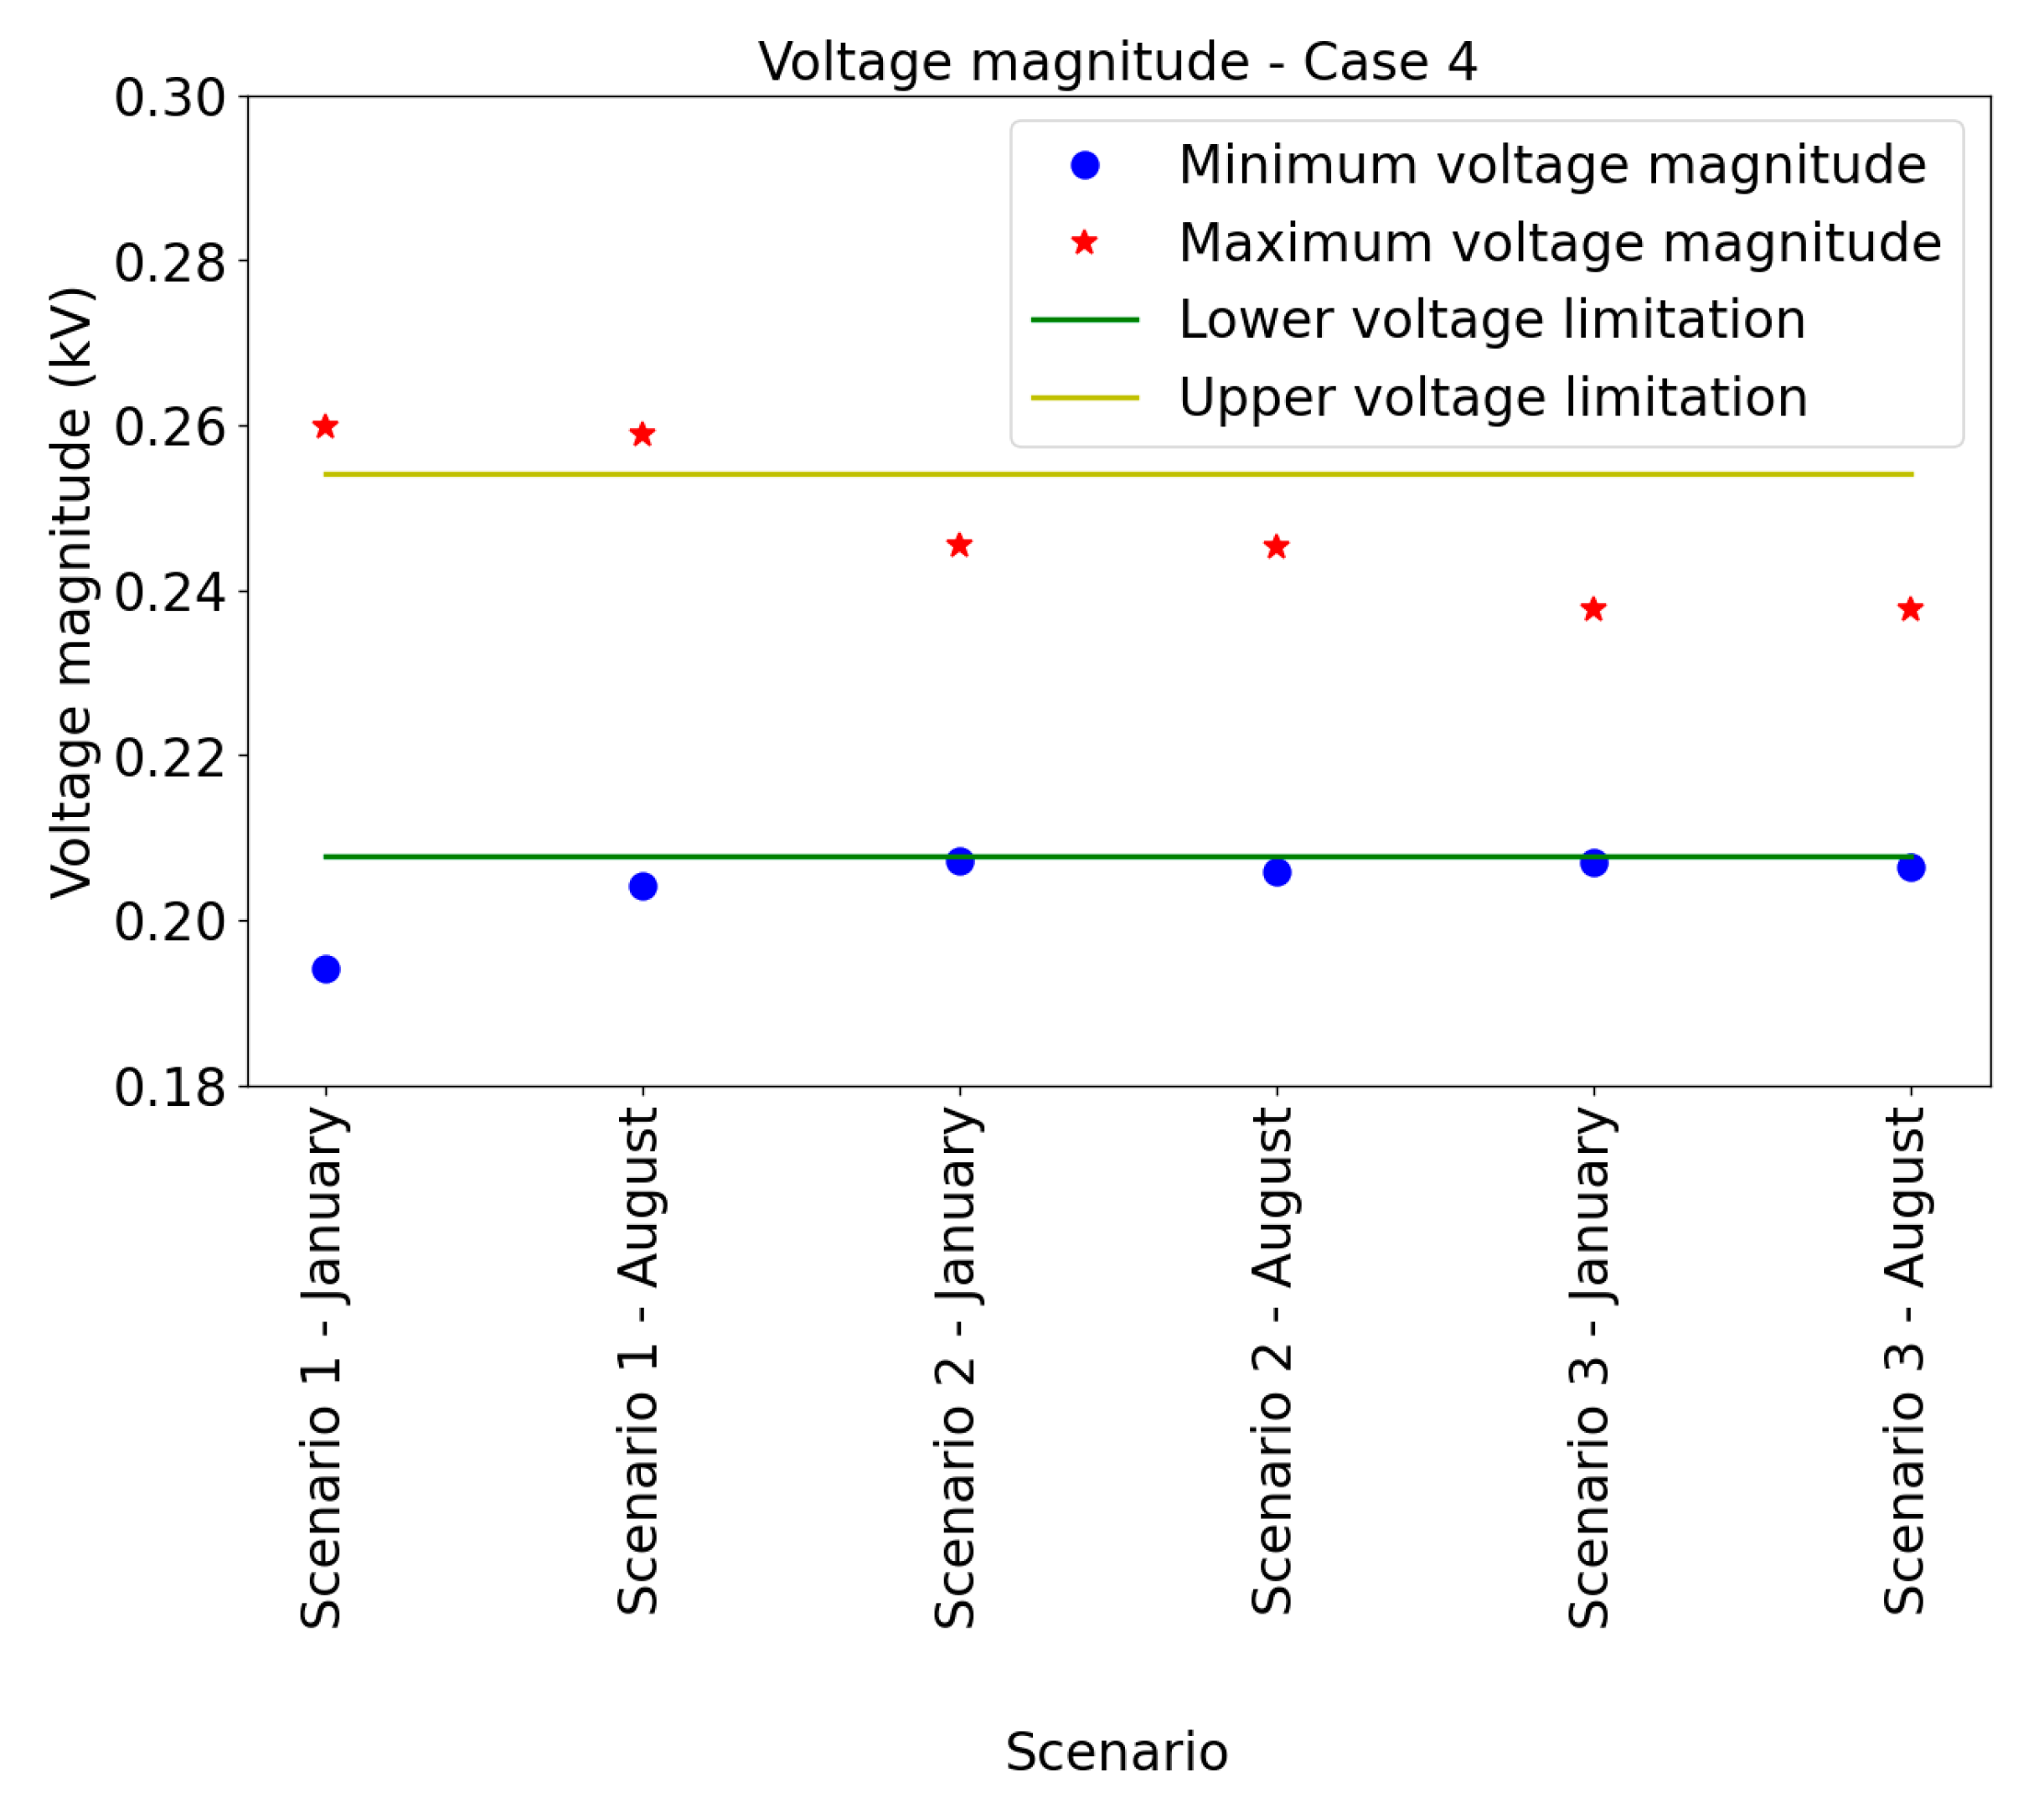
Figure 10 presents the voltage magnitude results with the 80% of LC technologies connected, i.e., the worst-case scenario in terms of voltage limit violations. It can be noticed that in certain instances and scenarios the undervoltage occurs in time periods when the consumption is the highest, and there is no production from the PVs, while in certain instances and scenarios the overvoltage occurs in time periods when the consumption is lower, the PVs’ production is high, and the battery storage is discharging. The lower voltage limitation is defined as 90% of the nominal voltage, and the upper limitation as 110% of the nominal voltage [27,49]. Since the DSO will definitely change it operational practices in case of large LC integration, either by reinforcing the network or by incorporating provision of flexibility services, further analyses on voltage magnitude are not in the focus of the paper.
4. Conclusions
This paper provides a comprehensive and systematic analysis of the real distribution network PQ indicators related to the voltage unbalance, focusing on the impact of the different LC technologies, either alone or in joint operation, on these indicators. Different integration levels of PVs, residential battery storages and EV charging stations are modelled and their impact is evaluated over a set of operational regimes. The results are shown for a representative part of the real-world distribution network in Croatia and put in the context of boundary values for the VUF set by standards and grid codes.
Four different cases are selected in order to assess the impact of LC technologies on the absolute value of the VUF as well as on the time periods when the VUF is larger than the set limit defined by General Summation Law described in IEC 61000-3-13. Case 1 includes only PVs, while in Case 2 the end-users have an additional option of the EV charging. Further, in Case 3 a battery storage is added to the above, coordinating the operation of all devices with the goal of maximizing self-sufficiency. Finally, in Case 4 all mentioned LC technologies are operated driven by DA market prices aiming at reducing total end-user’s operational costs.
All of the above-described cases are run over a set of scenarios, each presenting different connection to the distribution network. In Scenario 1 all LC technologies are connected to the same phase at each node. Even though it is highly unlikely that all end-users are connected to the same phase, it presents the worst-case scenario when almost all observed parameters are worse than in other scenarios. In Scenario 2, LC technologies are connected to different phases in different nodes, where the selected connection phase is the result of a developed random phase generator model. Scenario 3 presents the scenario in which LC technologies are three-phase connected, i.e., the value of production/consumption is symmetrically distributed to all three-phases.
Even though it is expected that no matter the case, single-phase connected LC technologies have negative impact on the voltage unbalance, different analyses presented in the paper show that even when only 20% of end-users install single-phase connected PVs, the value of the VUF is thresholding the 2% limitation set in [27,28] in almost 20% of the time. by almost 20% of the time. As the percentage of installed PVs grows (but also that of other technologies such as batteries and EVs), the value of VUF and the frequency of VUF overstepping the limitations is further increasing. As there is a direct link between these values and increased network losses [37], the system operator needs to ensure that the operational practice adopt to the new situation in order not to unnecessary increase the networks operational costs. In some cases, when the share of LC technologies is 80%, the value of VUF presents serious issues and challenges for the DSO. The worst case is Case 2 when the value of VUF exceeds 80% in Scenario 1, both in January and August.
Additionally, the paper analyses duration of the VUF being higher than 2% as defined per IEC 61000-3-13. Results are in line with those in the first analysis, problems occur in all cases, i.e., VUF is higher than 2% in more than 5% of 10 min intervals. The worst case is Case 4 (market drive operation), when the unallowed VUF occurs in around 85% of observed 10 min intervals in the worst-case scenario (Scenario 1). The scenario in which the values do not exceed boundaries more than it is set in the standard is Scenario 3, when LC technologies are three-phase connected.
Results show that in order to avoid problems related to the voltage unbalance, end-users should be encouraged to three-phase connect their LC technologies. Even though changing the phase of connection at each node is better solution than connecting LC technologies to the same phase at each node, results of Scenario 1 show that there is a high possibility of an occurrence of problems related to the voltage unbalance, even when end-users do not connect LC technologies to the same phase. A three-phase connection of LC technologies does not only reduce the value of the VUF and the frequency of the occurrence of the VUF thresholding the limit, but also enables higher power injection into the network. The available literature proposed a number of operational actions that can be suggested in order to reduce the network voltage unbalances, however majority of them requires complex models and control algorithms on the side of both end-users and the distribution system operator. Since, according to the Croatian Grid Code [49], end-users that are connecting to the network with the production power higher than 3.68 kW are already obligated to ensure three-phase connection to the network, recommending having all new LC devices connected as balanced three-phase ones, is the most simplistic solution and the most realistic one to be implemented in the near future. The results in the paper support such a recommendation and are, to the authors knowledge, the first time such benefits are quantified on realistic models and networks.
Even though results show the concerning trend from the perspective of the DSO, they could be observed as the worst-case scenario. The voltage unbalance has an impact on the performance of the end-user’s equipment, mostly on asynchronous machines and the number of asynchronous machines in the LV network is not so large. However, with the process of the electrification of the heating, there will be growth in a number of heat pumps, which are basically asynchronous machines. With trend shown in this paper, the performance of heat pumps will be reduced, and losses will be significantly higher. Therefore, DSOs should be looking for solutions that can mitigate the voltage unbalance in the network and simultaneously enable higher penetration of LC technologies in the LV network.
Since the voltage unbalance is directly connected to the performance of the equipment and network losses, it causes significant financial losses. The authors in [37] showed that there is direct connection between voltage unbalance and network losses. In case of a 15% unbalance, the network losses increase by 15%. Since the annual financial value of 1% network losses in Croatia is around 6,000,000 €, the system operator would like to reduce network losses and not increase them. The method proposed in this paper enables system operators to reduce costs without complex operations and investment in the equipment.
Even though end-user’s devices are single-phase, a lot of end-users in the Croatian LV distribution network are three-phase, meaning that they have access to all three-phases. In that case, the additional costs could be related to connection fees to the DSO or potential higher equipment investment for the end-user.
Author Contributions
Conceptualization, visualization, writing–original draft, T.A., T.C.; formal analysis, software and investigation, T.A.; methodology, writing–review and editing, T.A., T.C., M.B.; validation, T.C. and M.B. All authors have read and agreed to the published version of the manuscript.
Funding
This research was funded by Croatian Science Foundation (HRZZ) and Croatian Distribution System Operator (HEP ODS) under the project IMAGINE–Innovative Modelling and Laboratory Tested Solutions for Next Generation of Distribution Networks (PAR-2018-12) and by the Croatian Science Foundation and the European Union through the European Social Fund under project Flexibility of Converter-based Microgrids–FLEXIBASE (PZS-2019-02-7747).
Conflicts of Interest
The authors declare no conflict of interest.
Nomenclature
| Indices | |
| Index that determines observed node, | |
| Index that determines observed time period, | |
| Variables | |
| Charging power of the battery at every node and every time period | |
| Discharging power of the battery at every node and every time period | |
| Charging power of the battery in the EV in every time period | |
| State of charge of the battery at every node and every time period | |
| Difference between consumption and production at every node and every time period | |
| Positive difference between consumption and production at every node and every time period | |
| Negative difference between consumption and production at every node and every time period | |
| Binary variables | |
| Binary variable that determines if the battery is charging at the observed node and in the observed time period | |
| Binary variable that determines if the battery is discharging at the observed node and in the observed time period | |
| Parameters | |
| Maximum charging power of the battery, 1.8 kW for VARTA and 5 kW for Tesla Powerwall battery | |
| Maximum discharging power of the battery, 1.6 kW for VARTA and 5 kW for Tesla Powerwall battery | |
| Maximum charging power of the battery in the EV, 3.6 kW for Nissan Leaf | |
| Minimum charging power of the battery in the EV, 0 kW | |
| Maximum state of charge of the battery, 3.3 kWh for VARTA and 13.5 kWh for Tesla Powerwall battery | |
| Maximum state of charge of the battery in the EV, 36 kWh for Nissan Leaf | |
| Minimum state of charge of the battery in the EV defined by the end-user | |
| Power of the PV production at every node and every time period | |
| Power of the load at every node and every time period | |
| Price of electricity on day-ahead market in the observed time-period | |
| Constant that is equal to 10 min | |
Appendix A
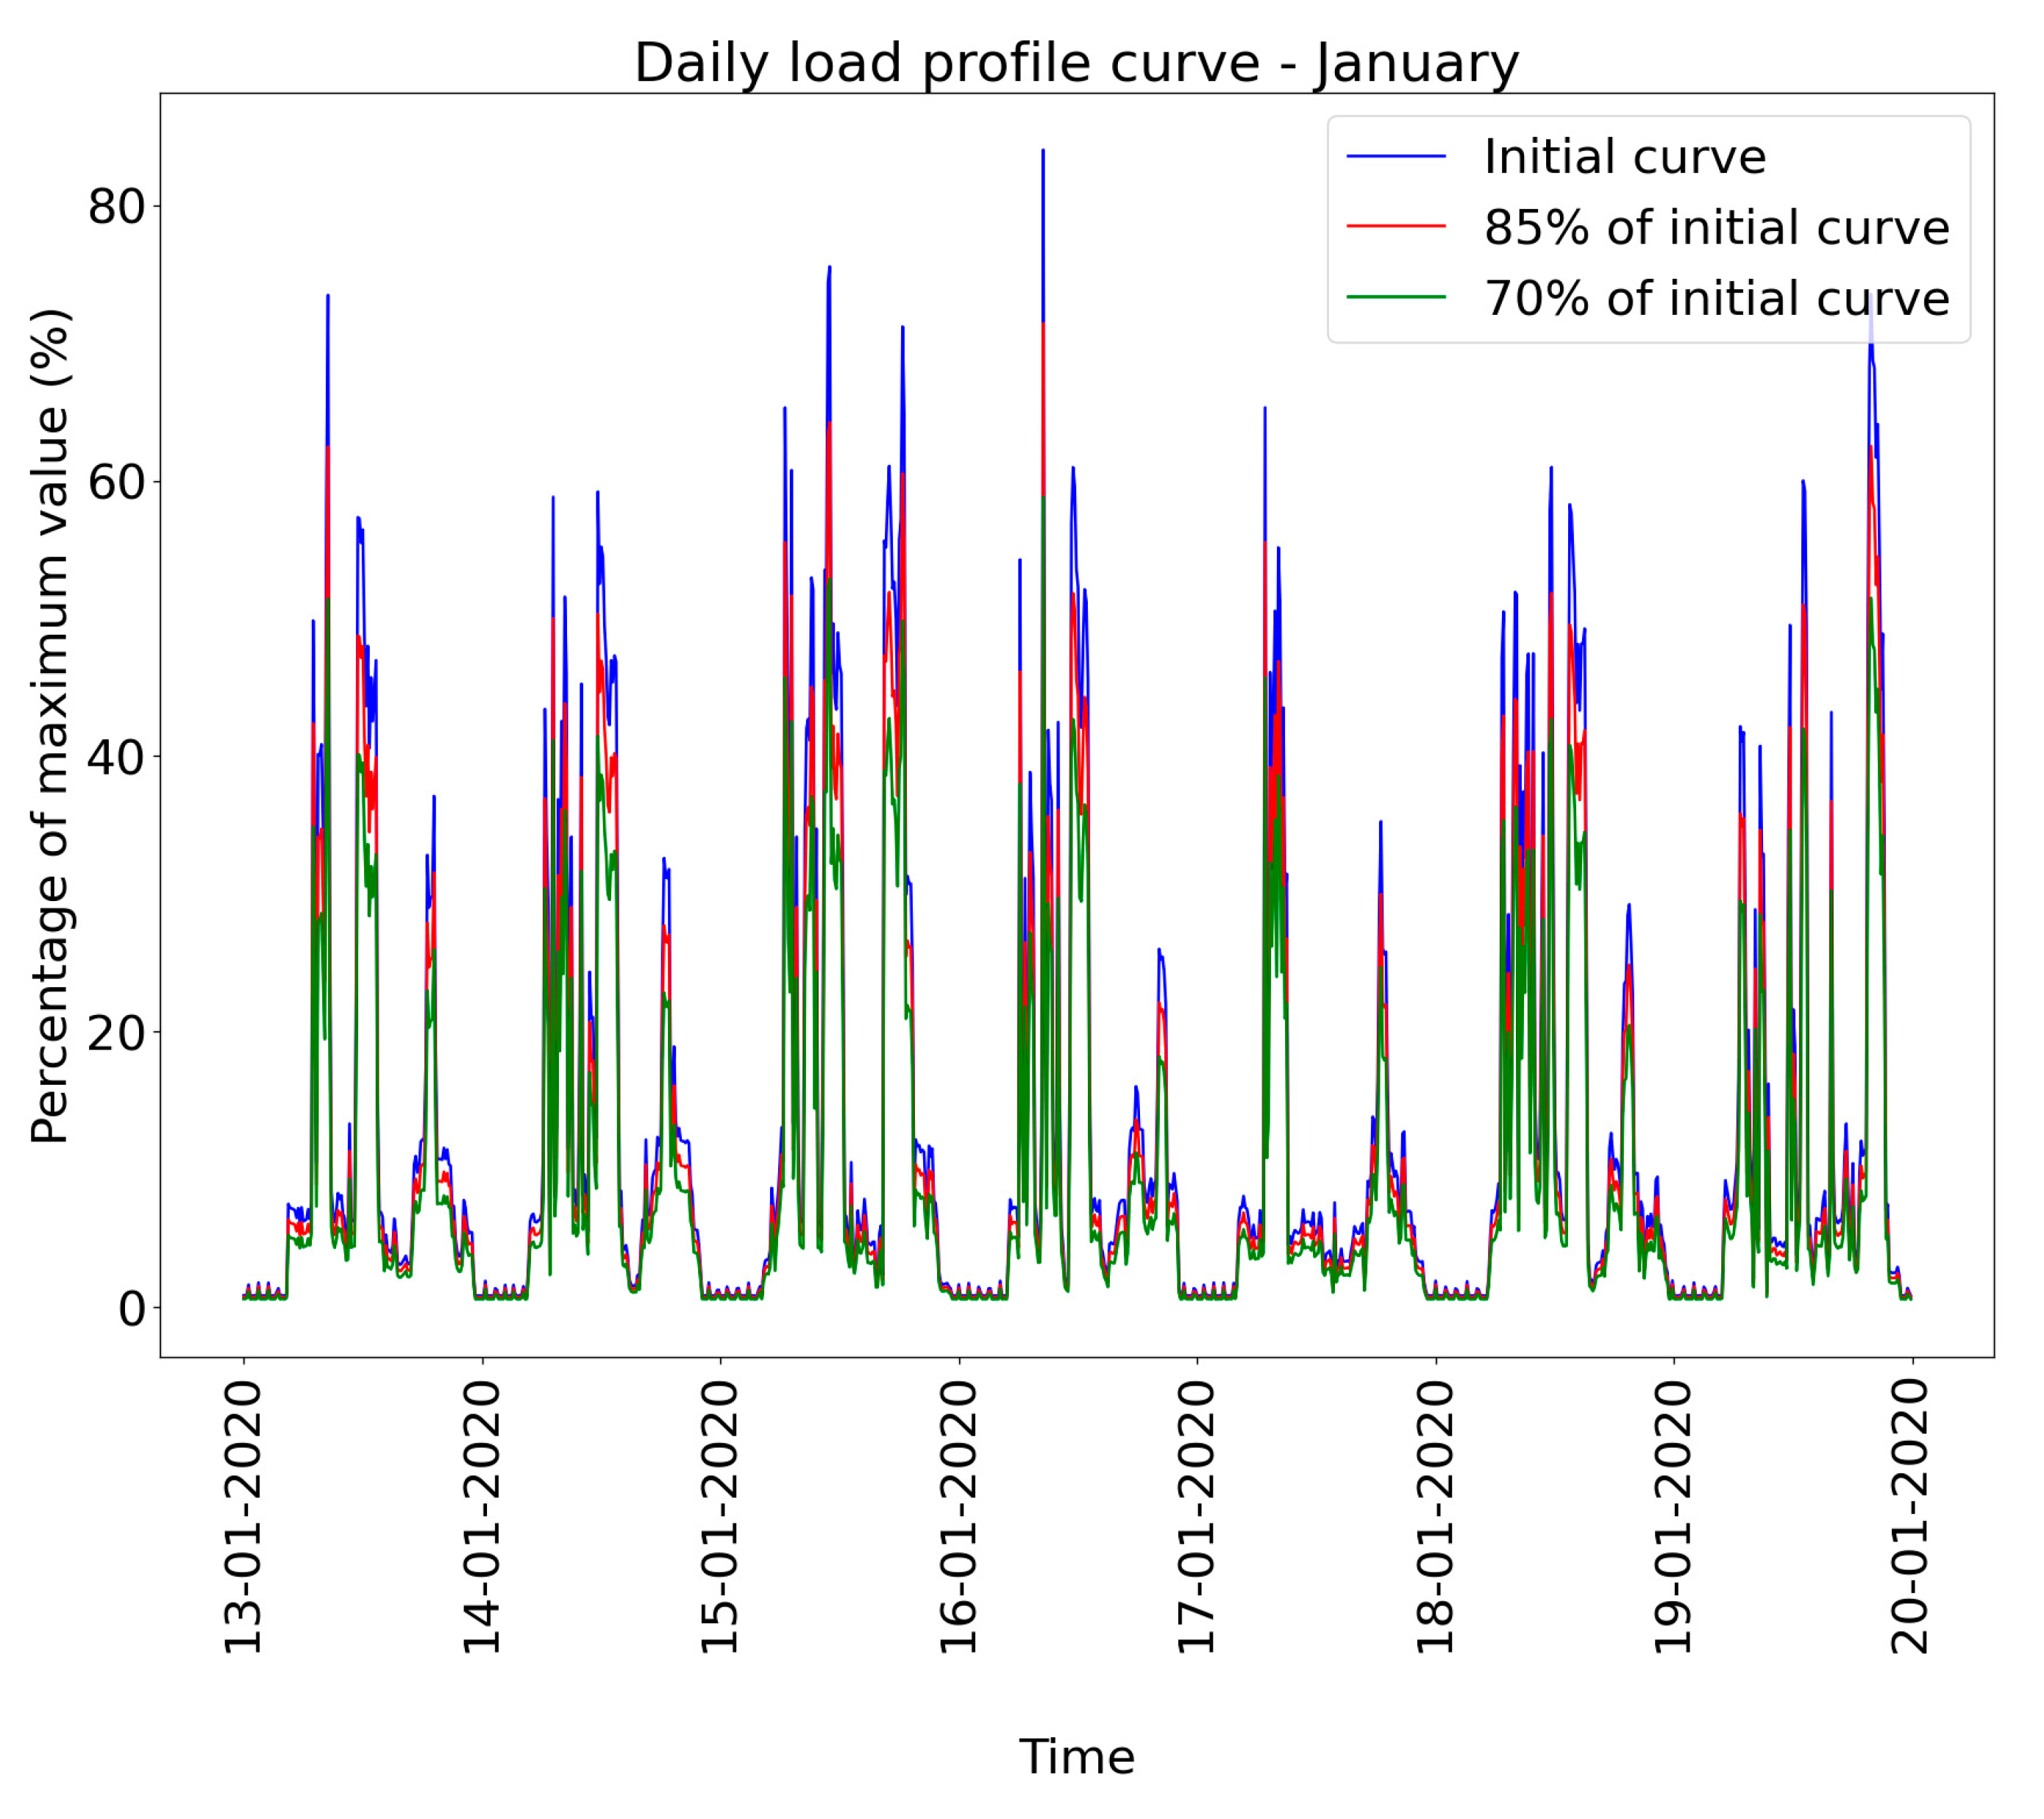
Figure A1 and Figure A2 show the load profile curve for each phase in January and August. The load profile curve was used to determine the value of the consumption of each end-user in every time period.
Figure A1.
Load profile curve–January.

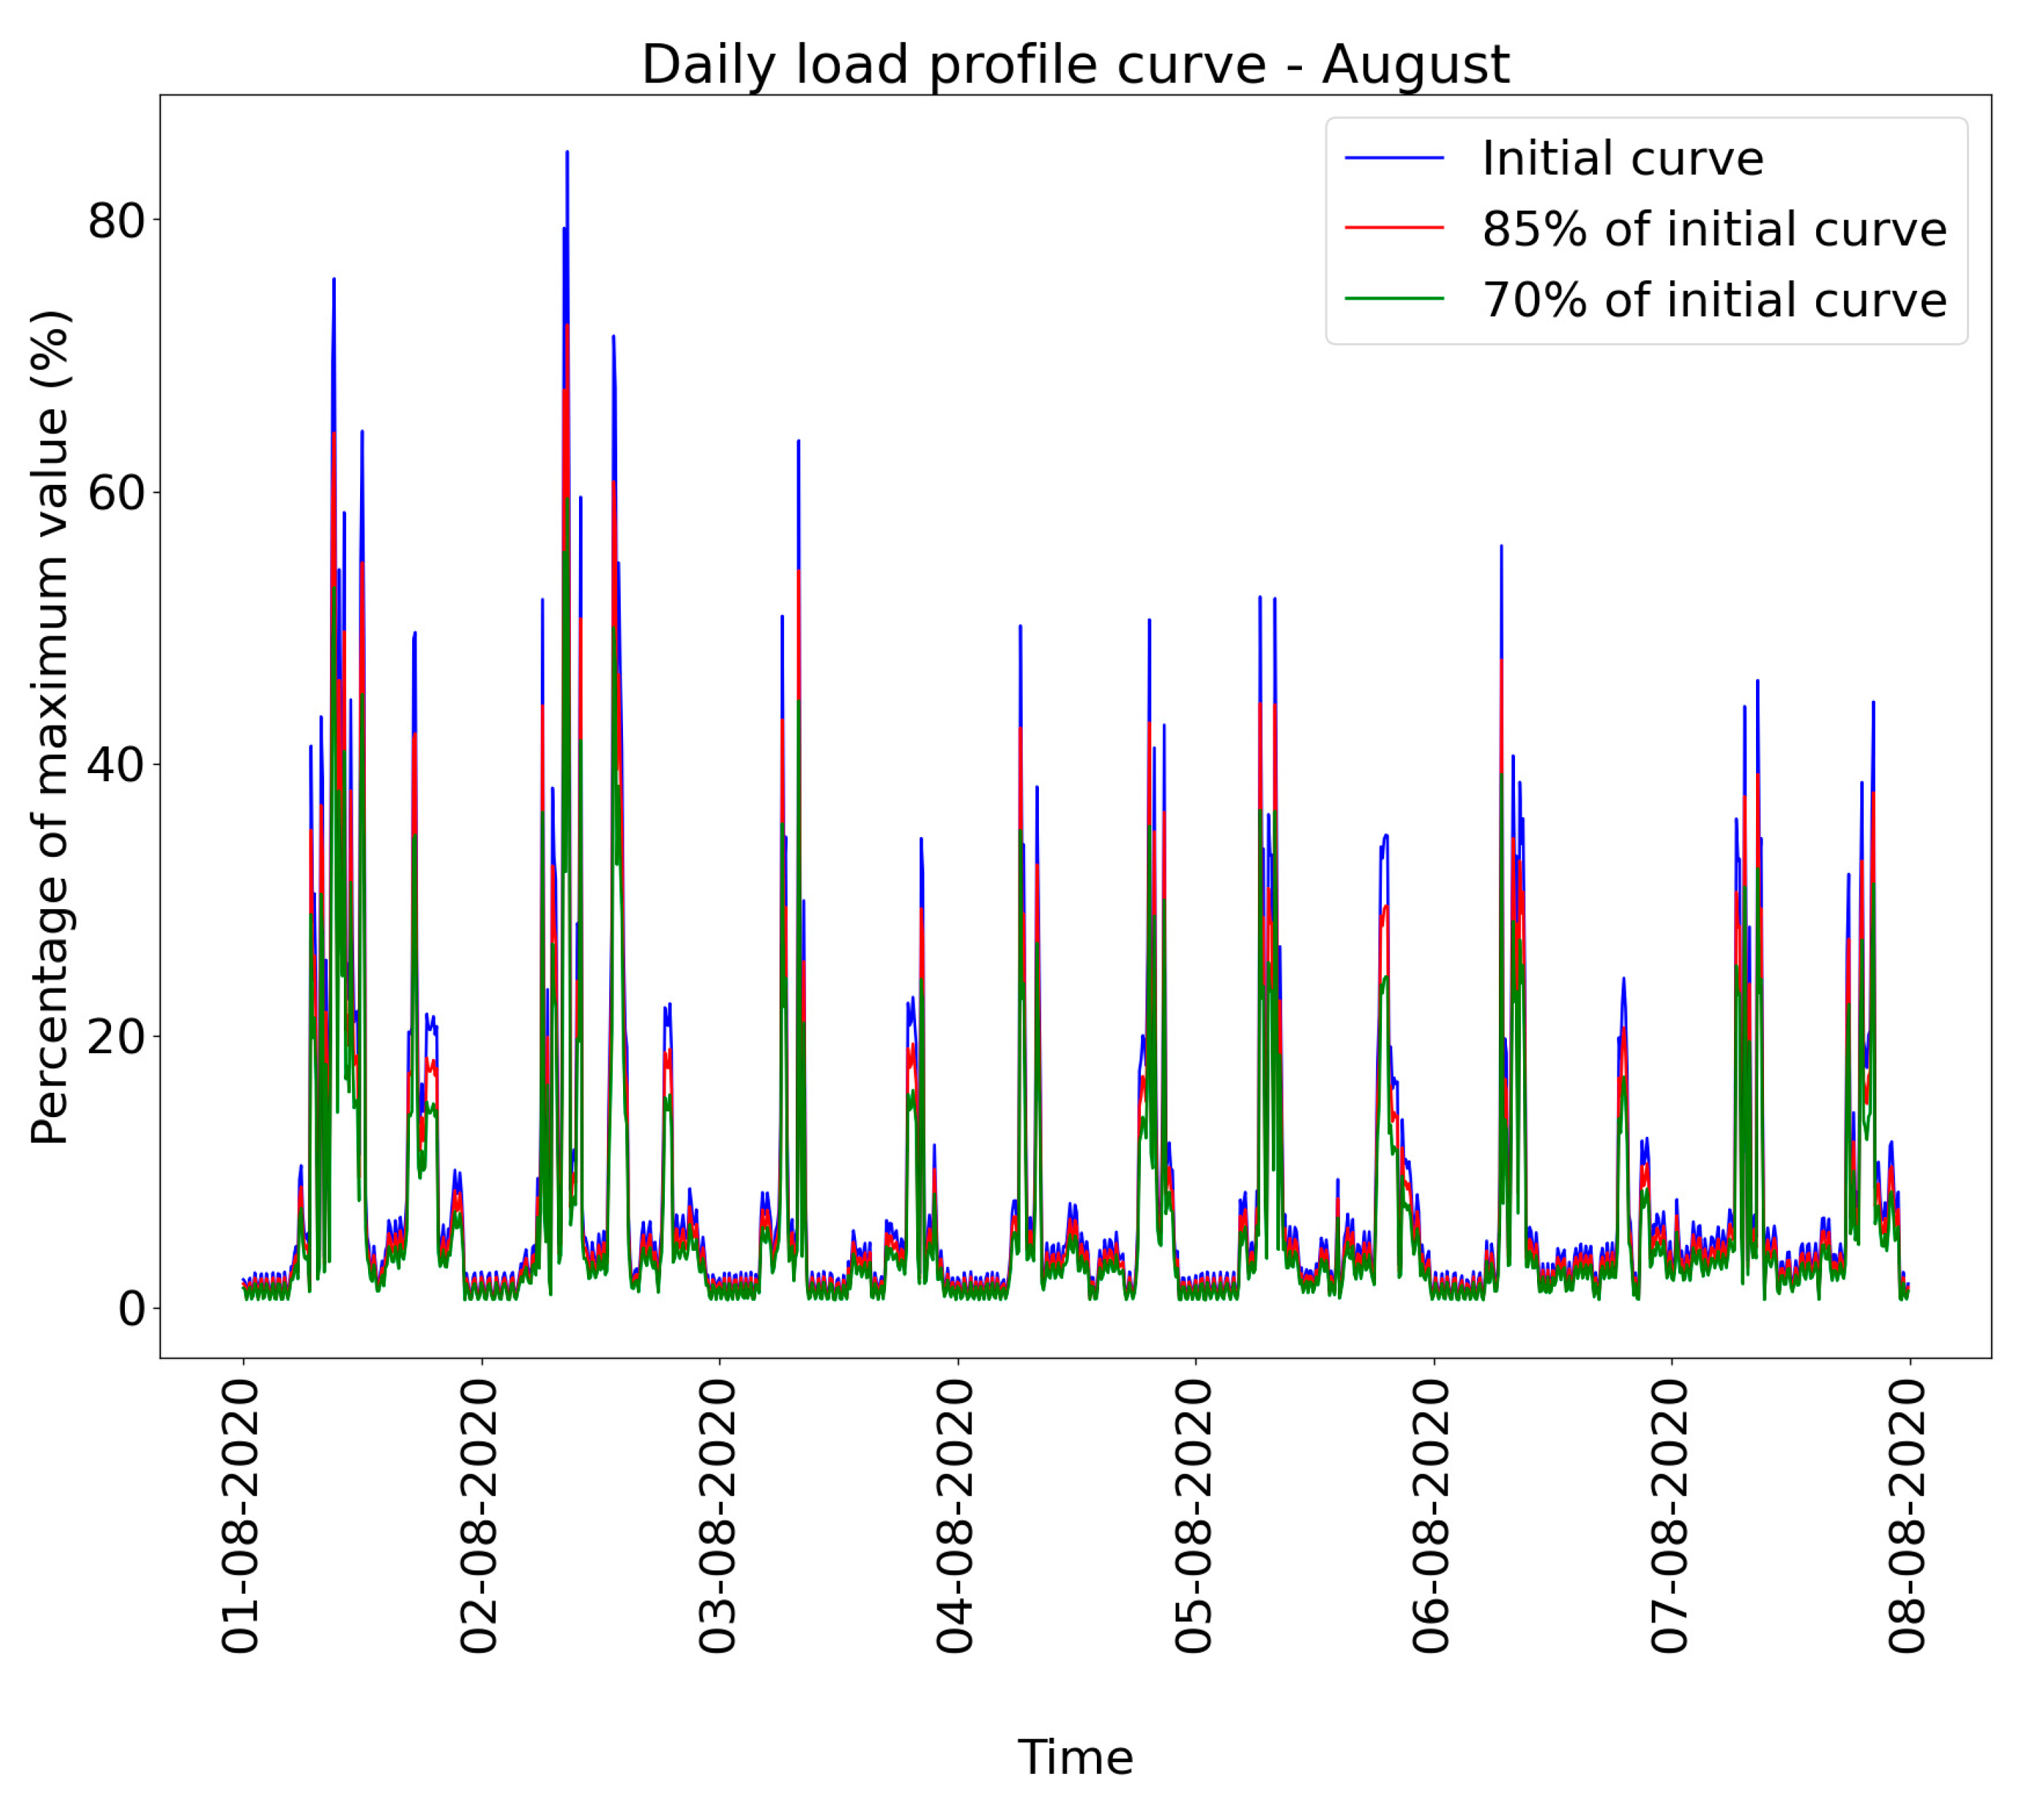
Figure A2.
Load profile curve—August.

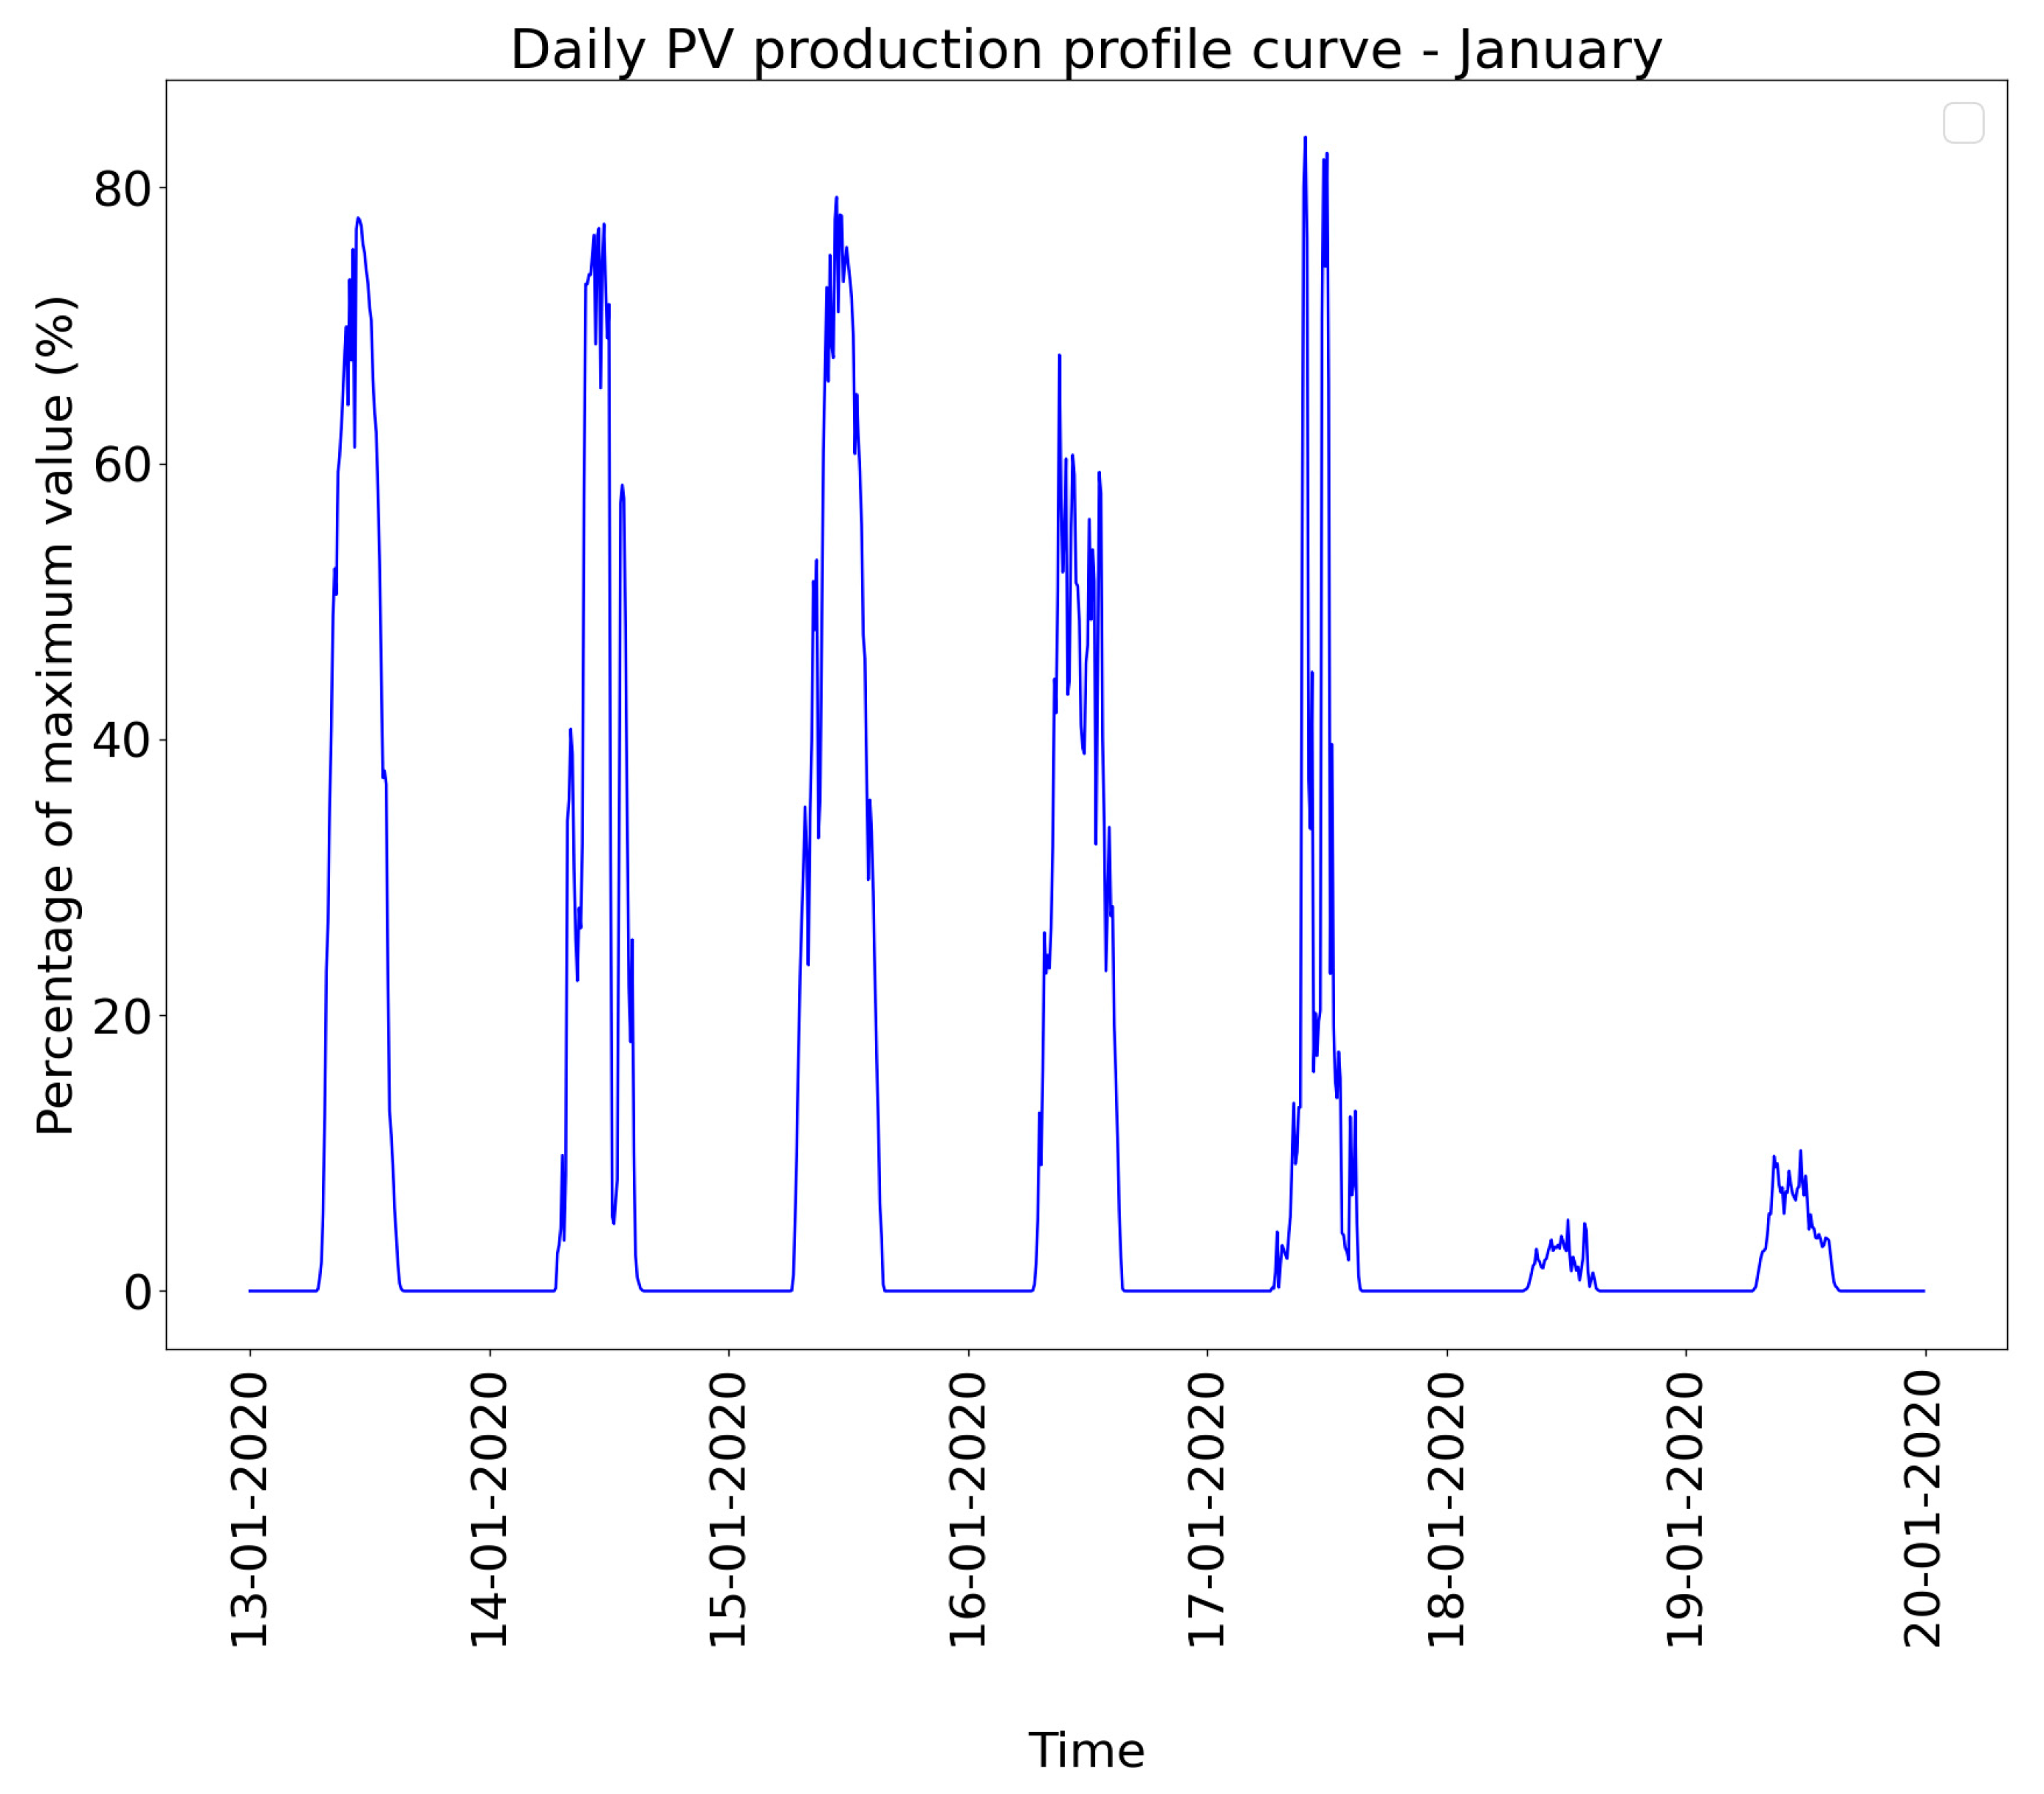
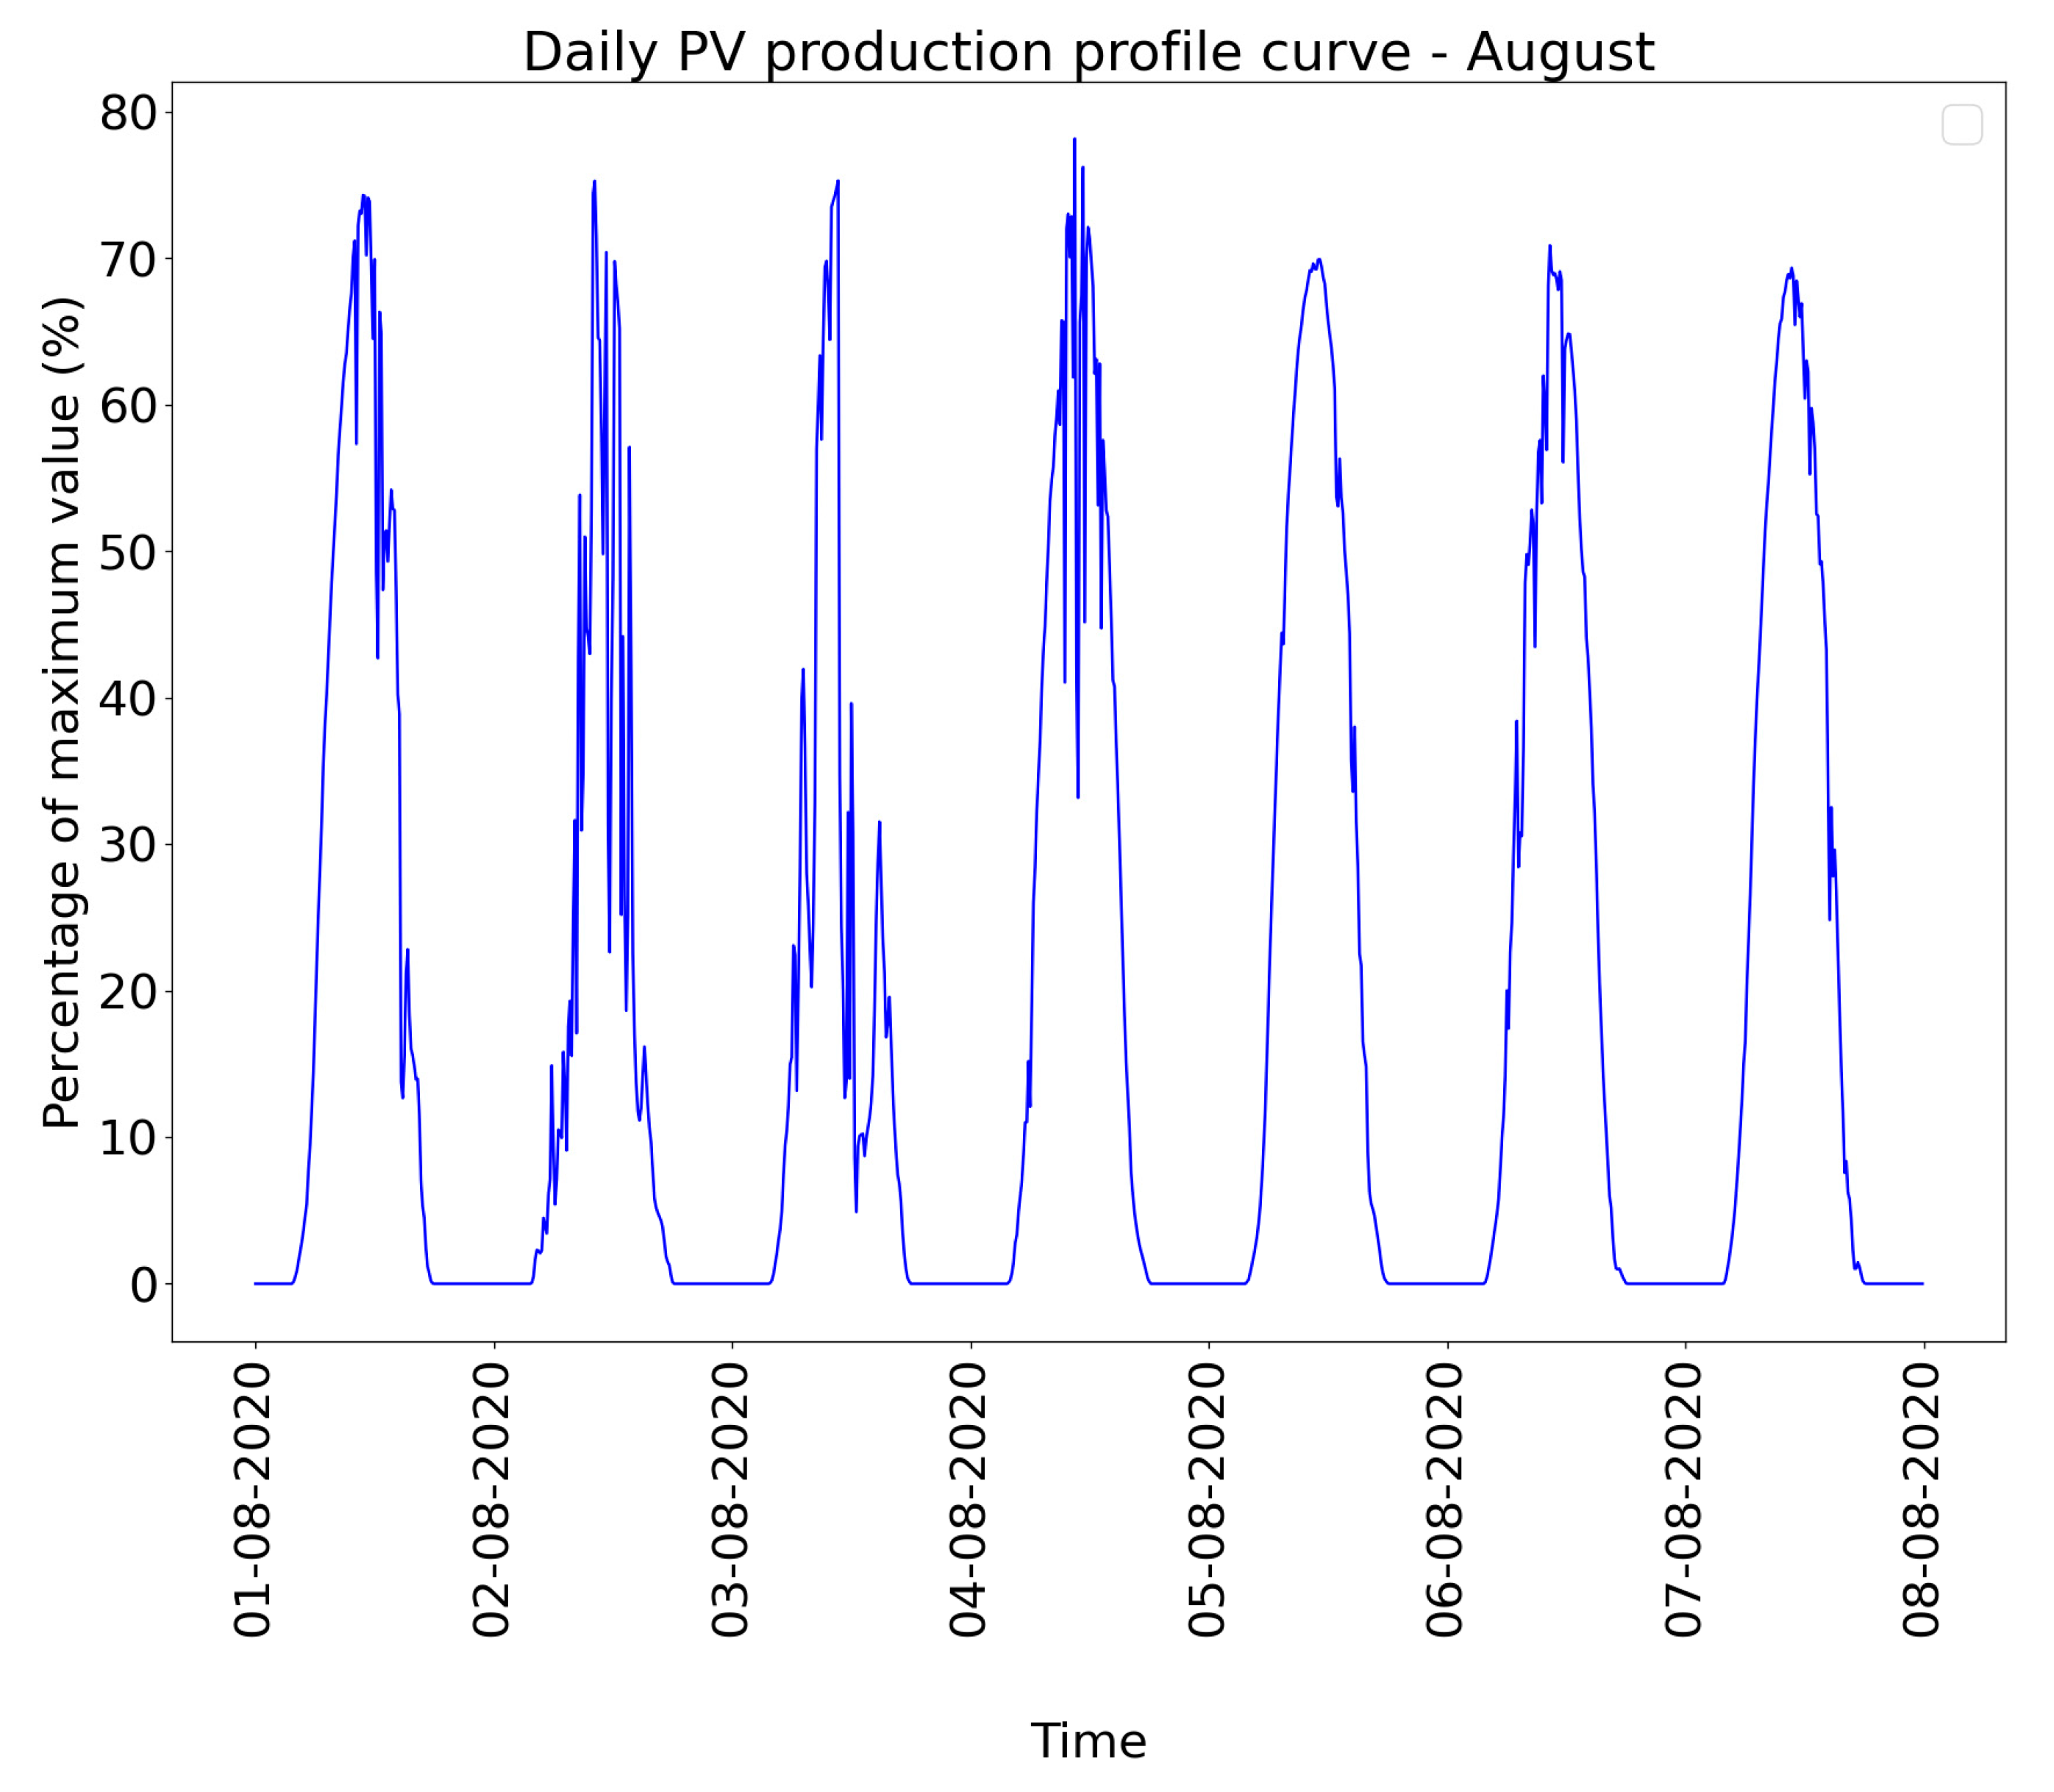
Figure A3 and Figure A4 represent the PV production profile curve on the ten-minute basis for every day in the week in January and August. The PV production power of the end-user with the installed PV was calculated from the daily PV production profile curve.
Figure A3.
PV production profile curve—January.

Figure A4.
PV production profile curve—August.

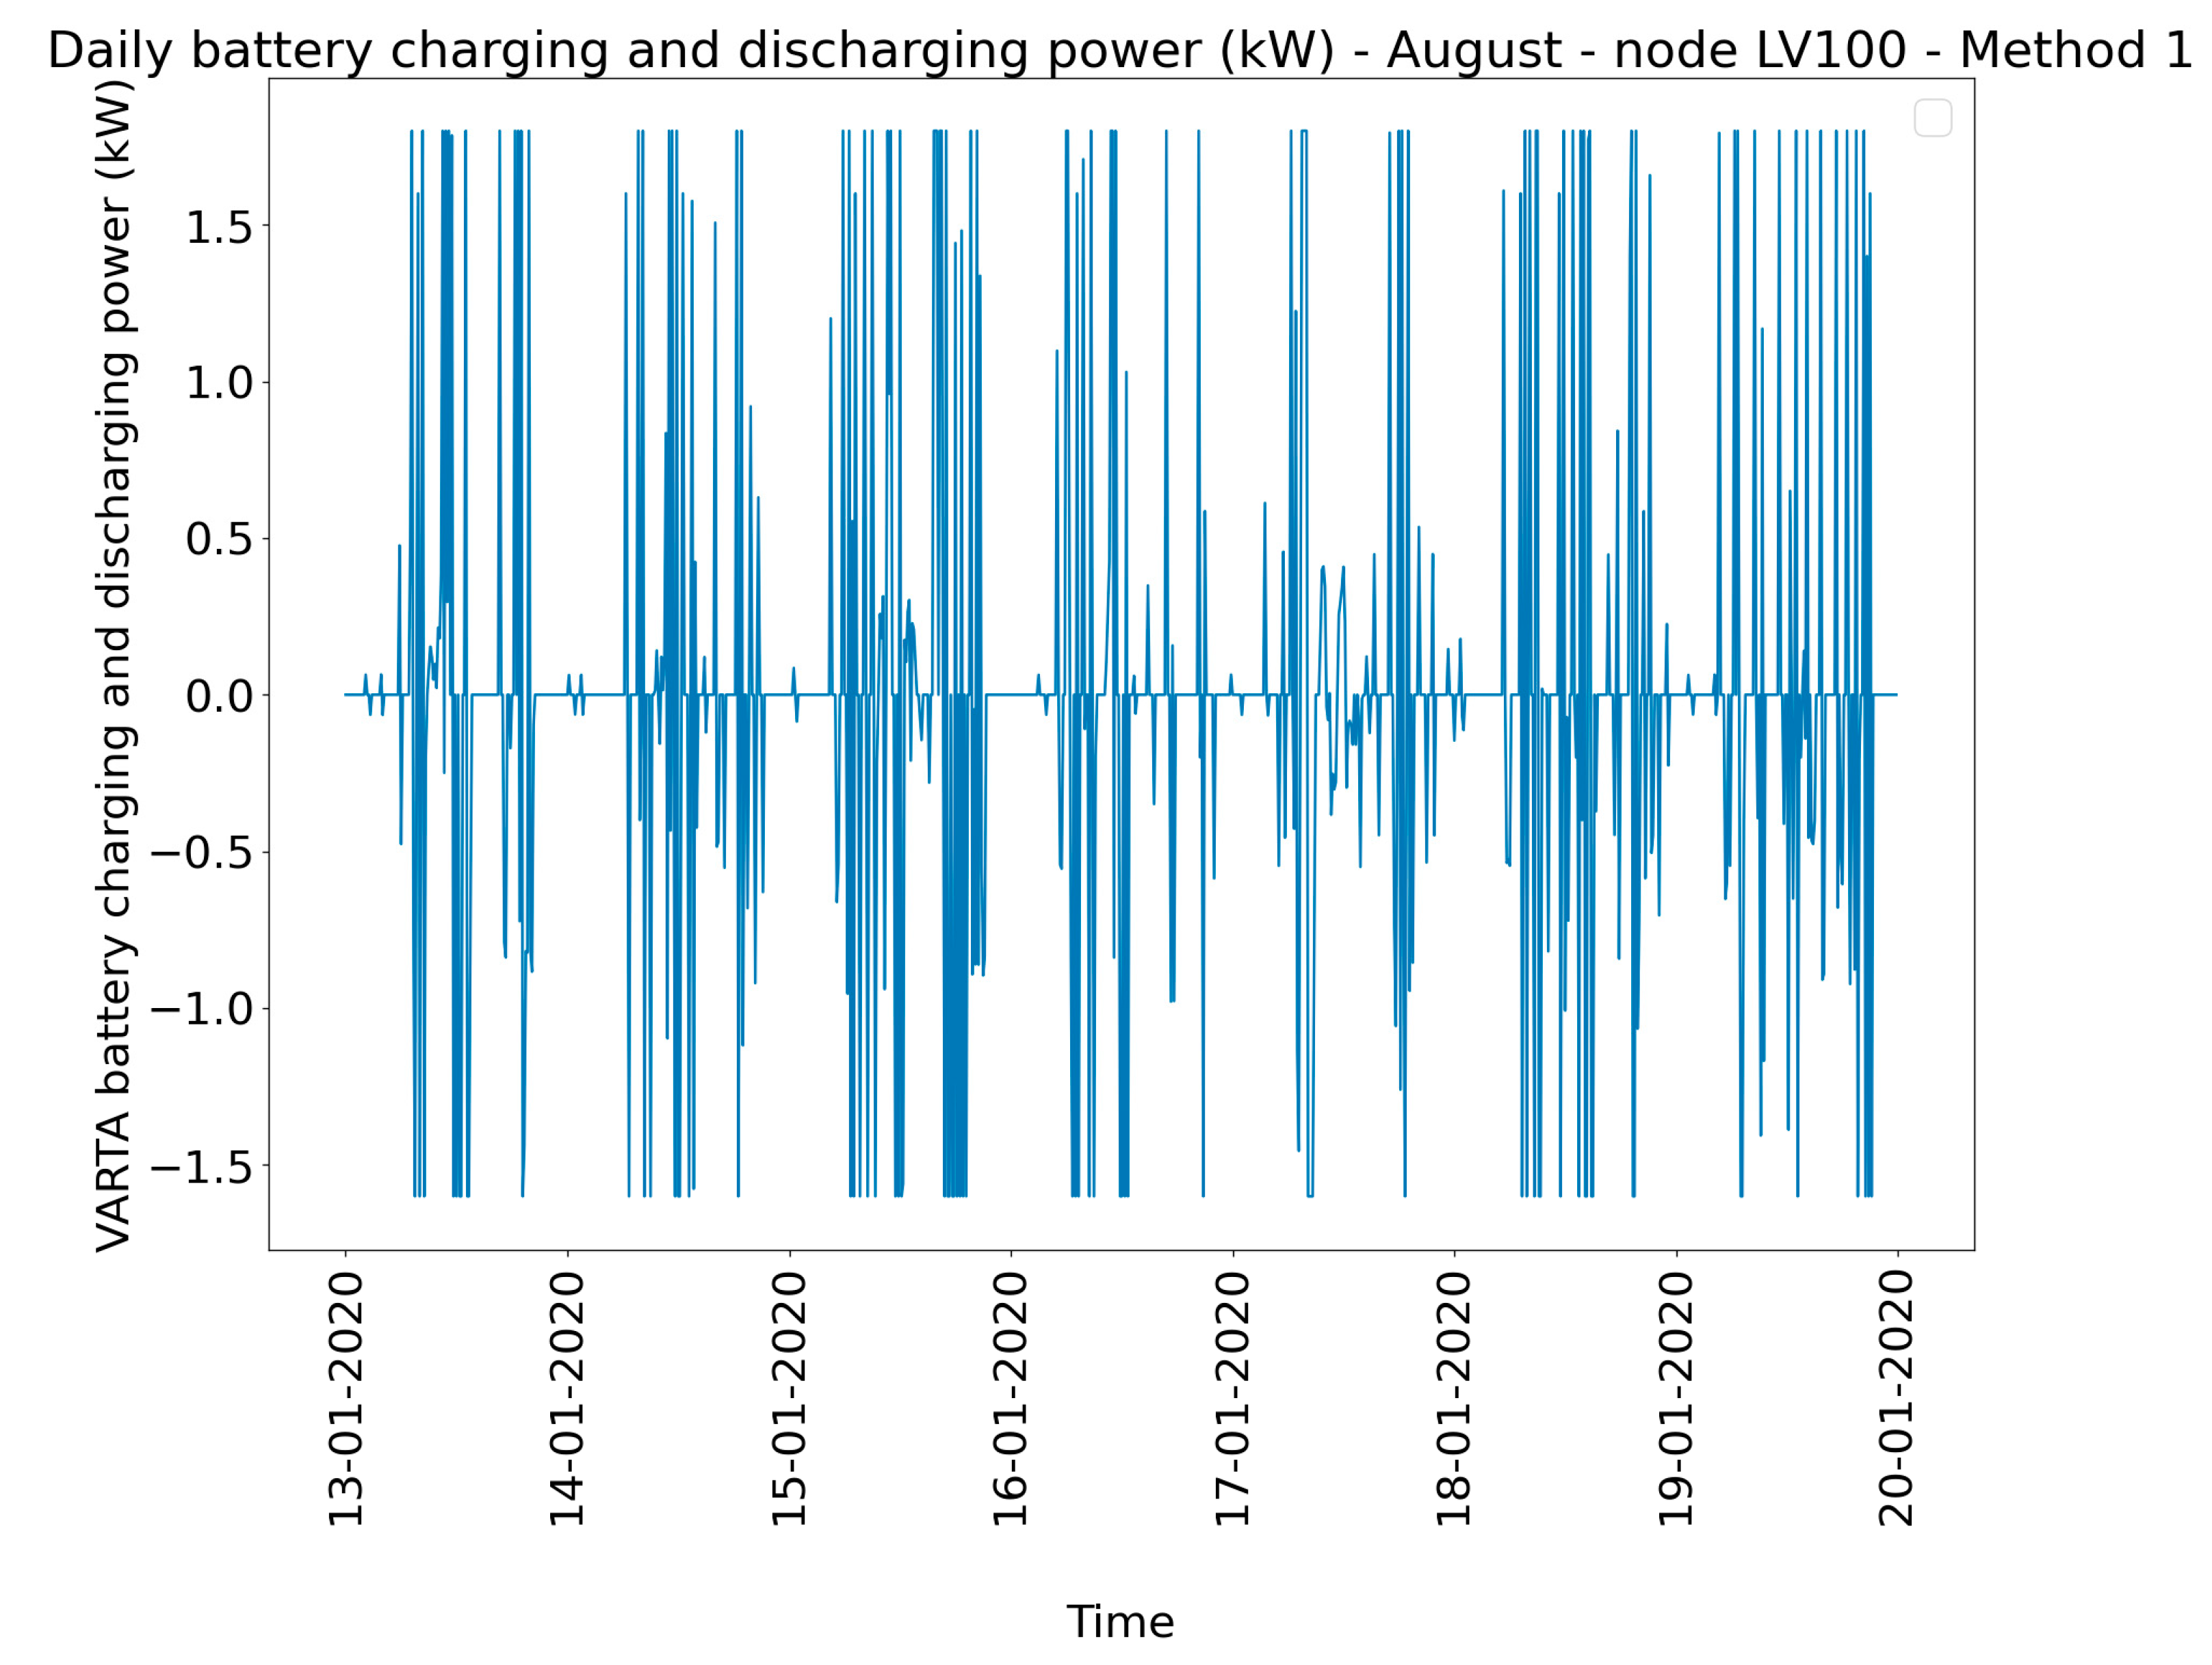
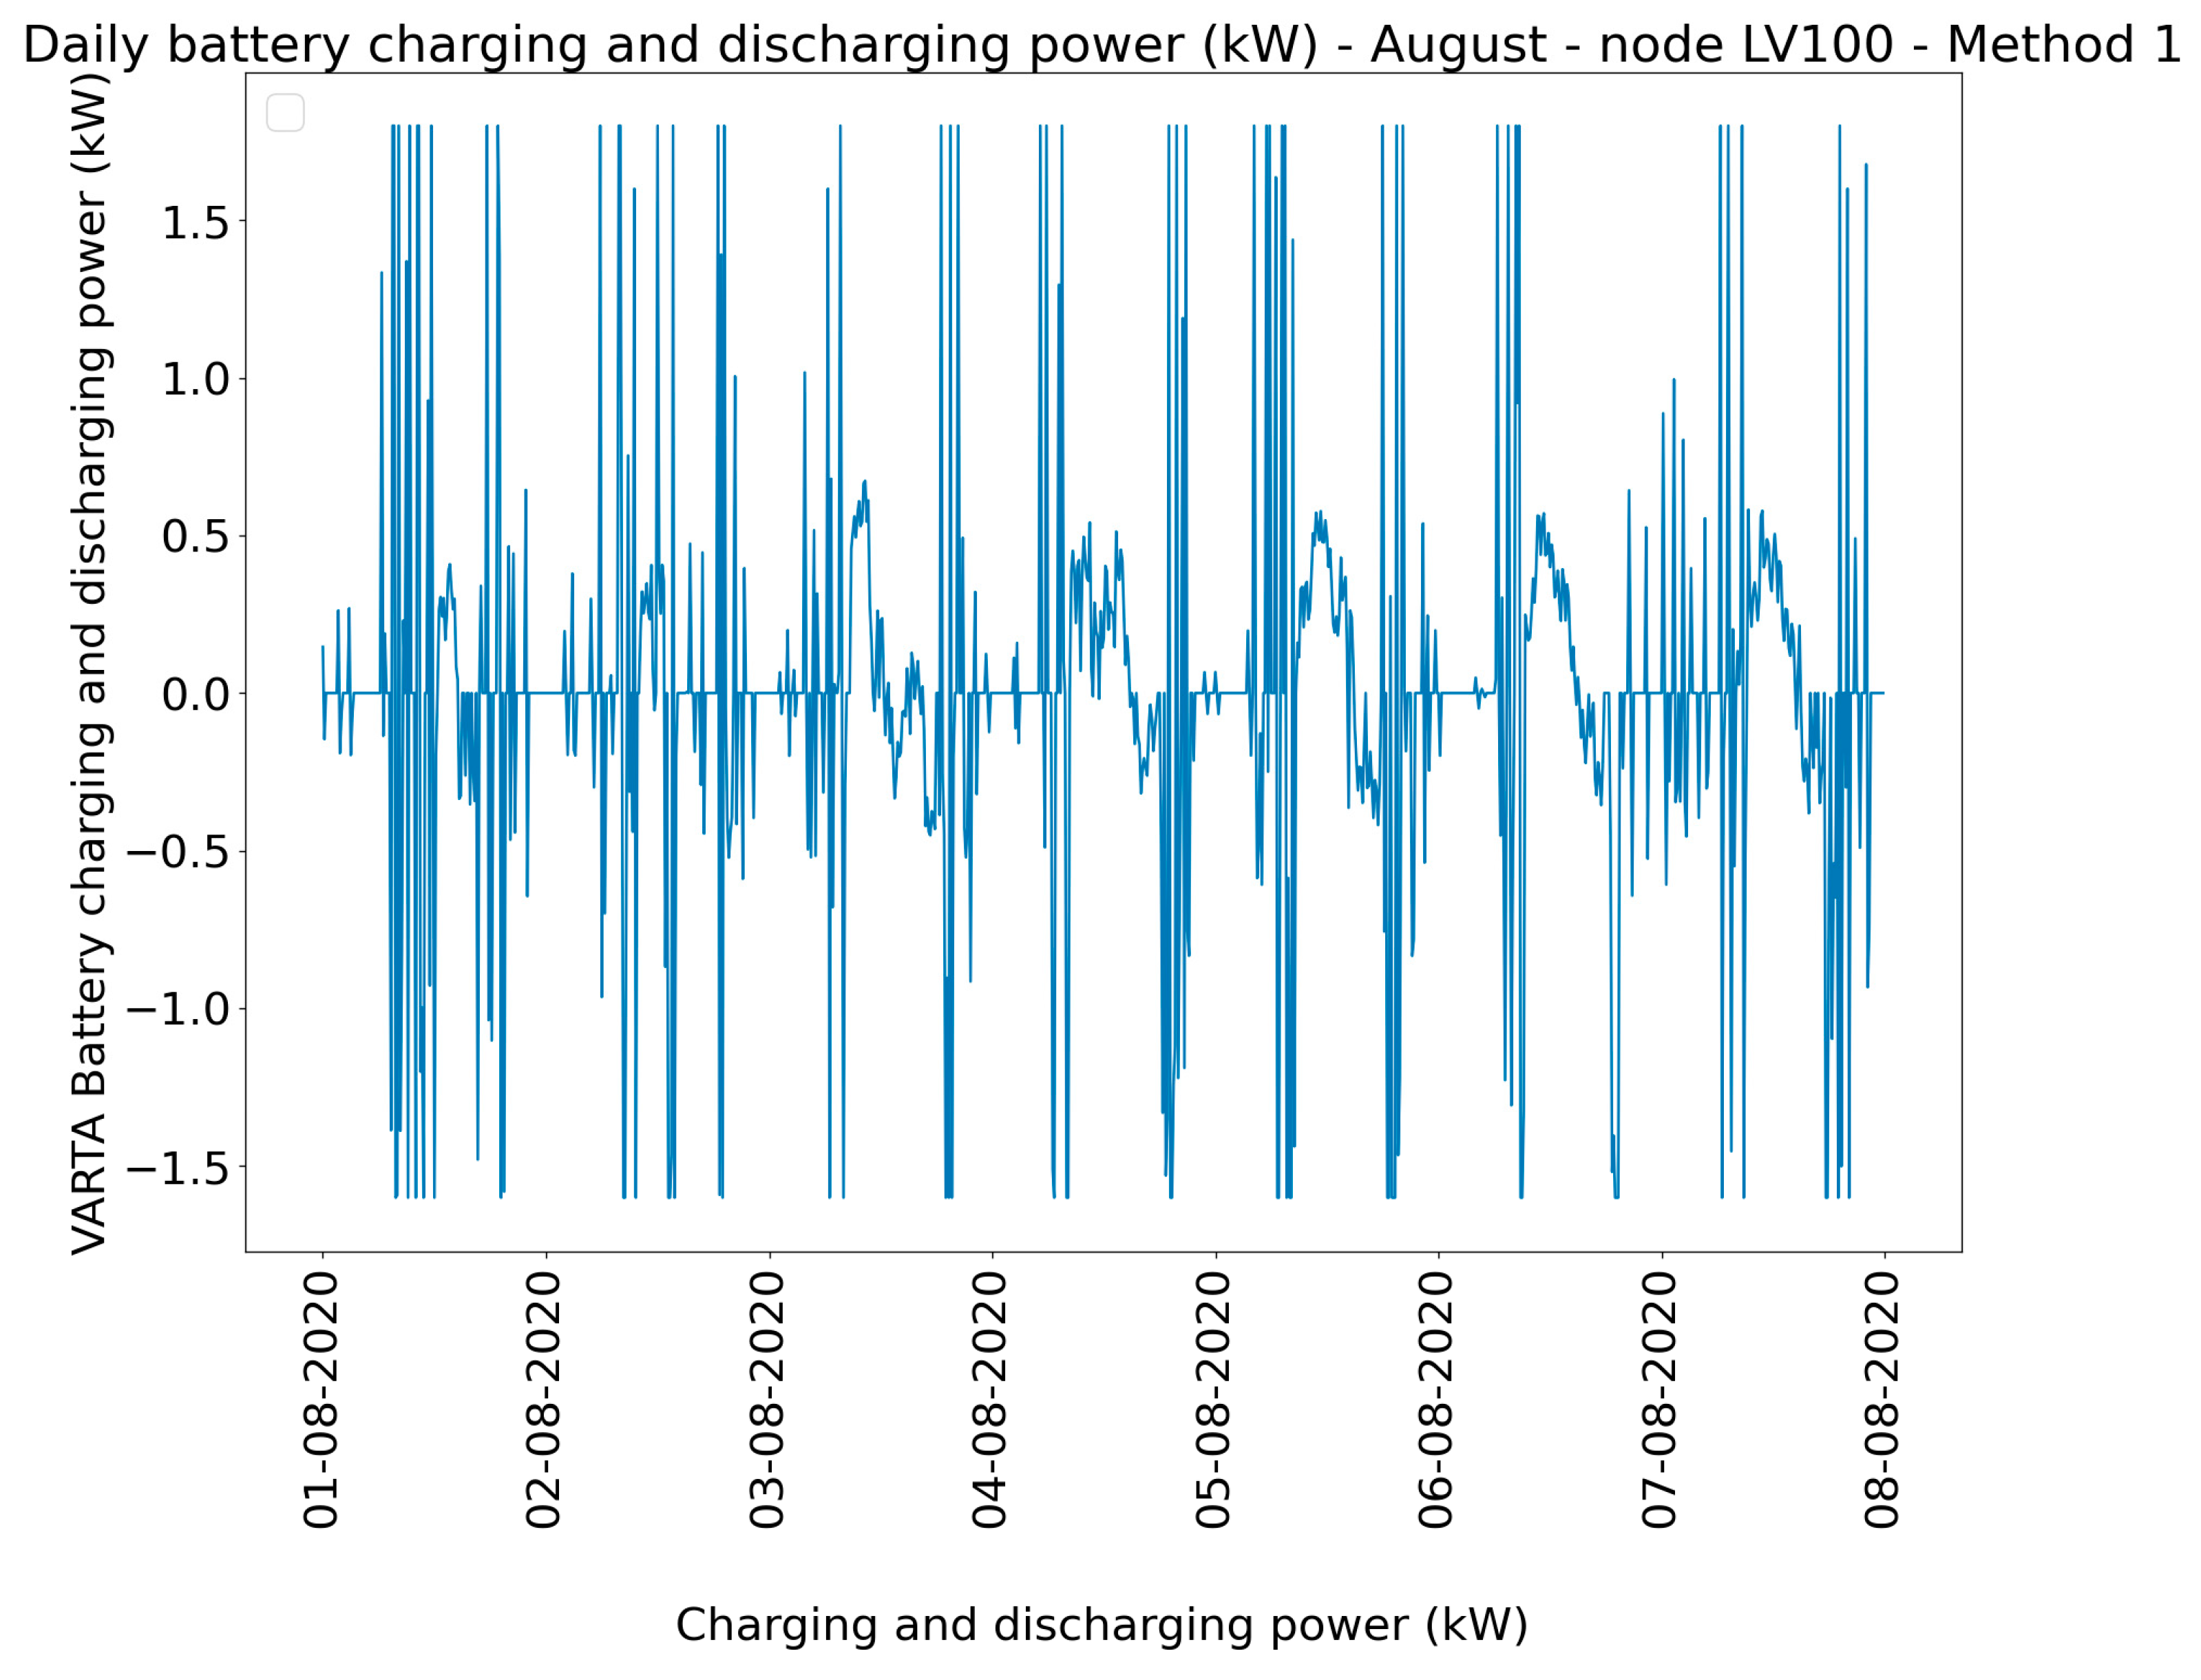
Figure A5 and Figure A6 show the charging and the discharging power of the battery storage in the node LV100, when the battery is modelled with the logic of self-sufficiency (Method 1).
Figure A5.
VARTA battery charging and discharging curve—January—Method 1.

Figure A6.
VARTA battery charging and discharging curve—August—Method 1.

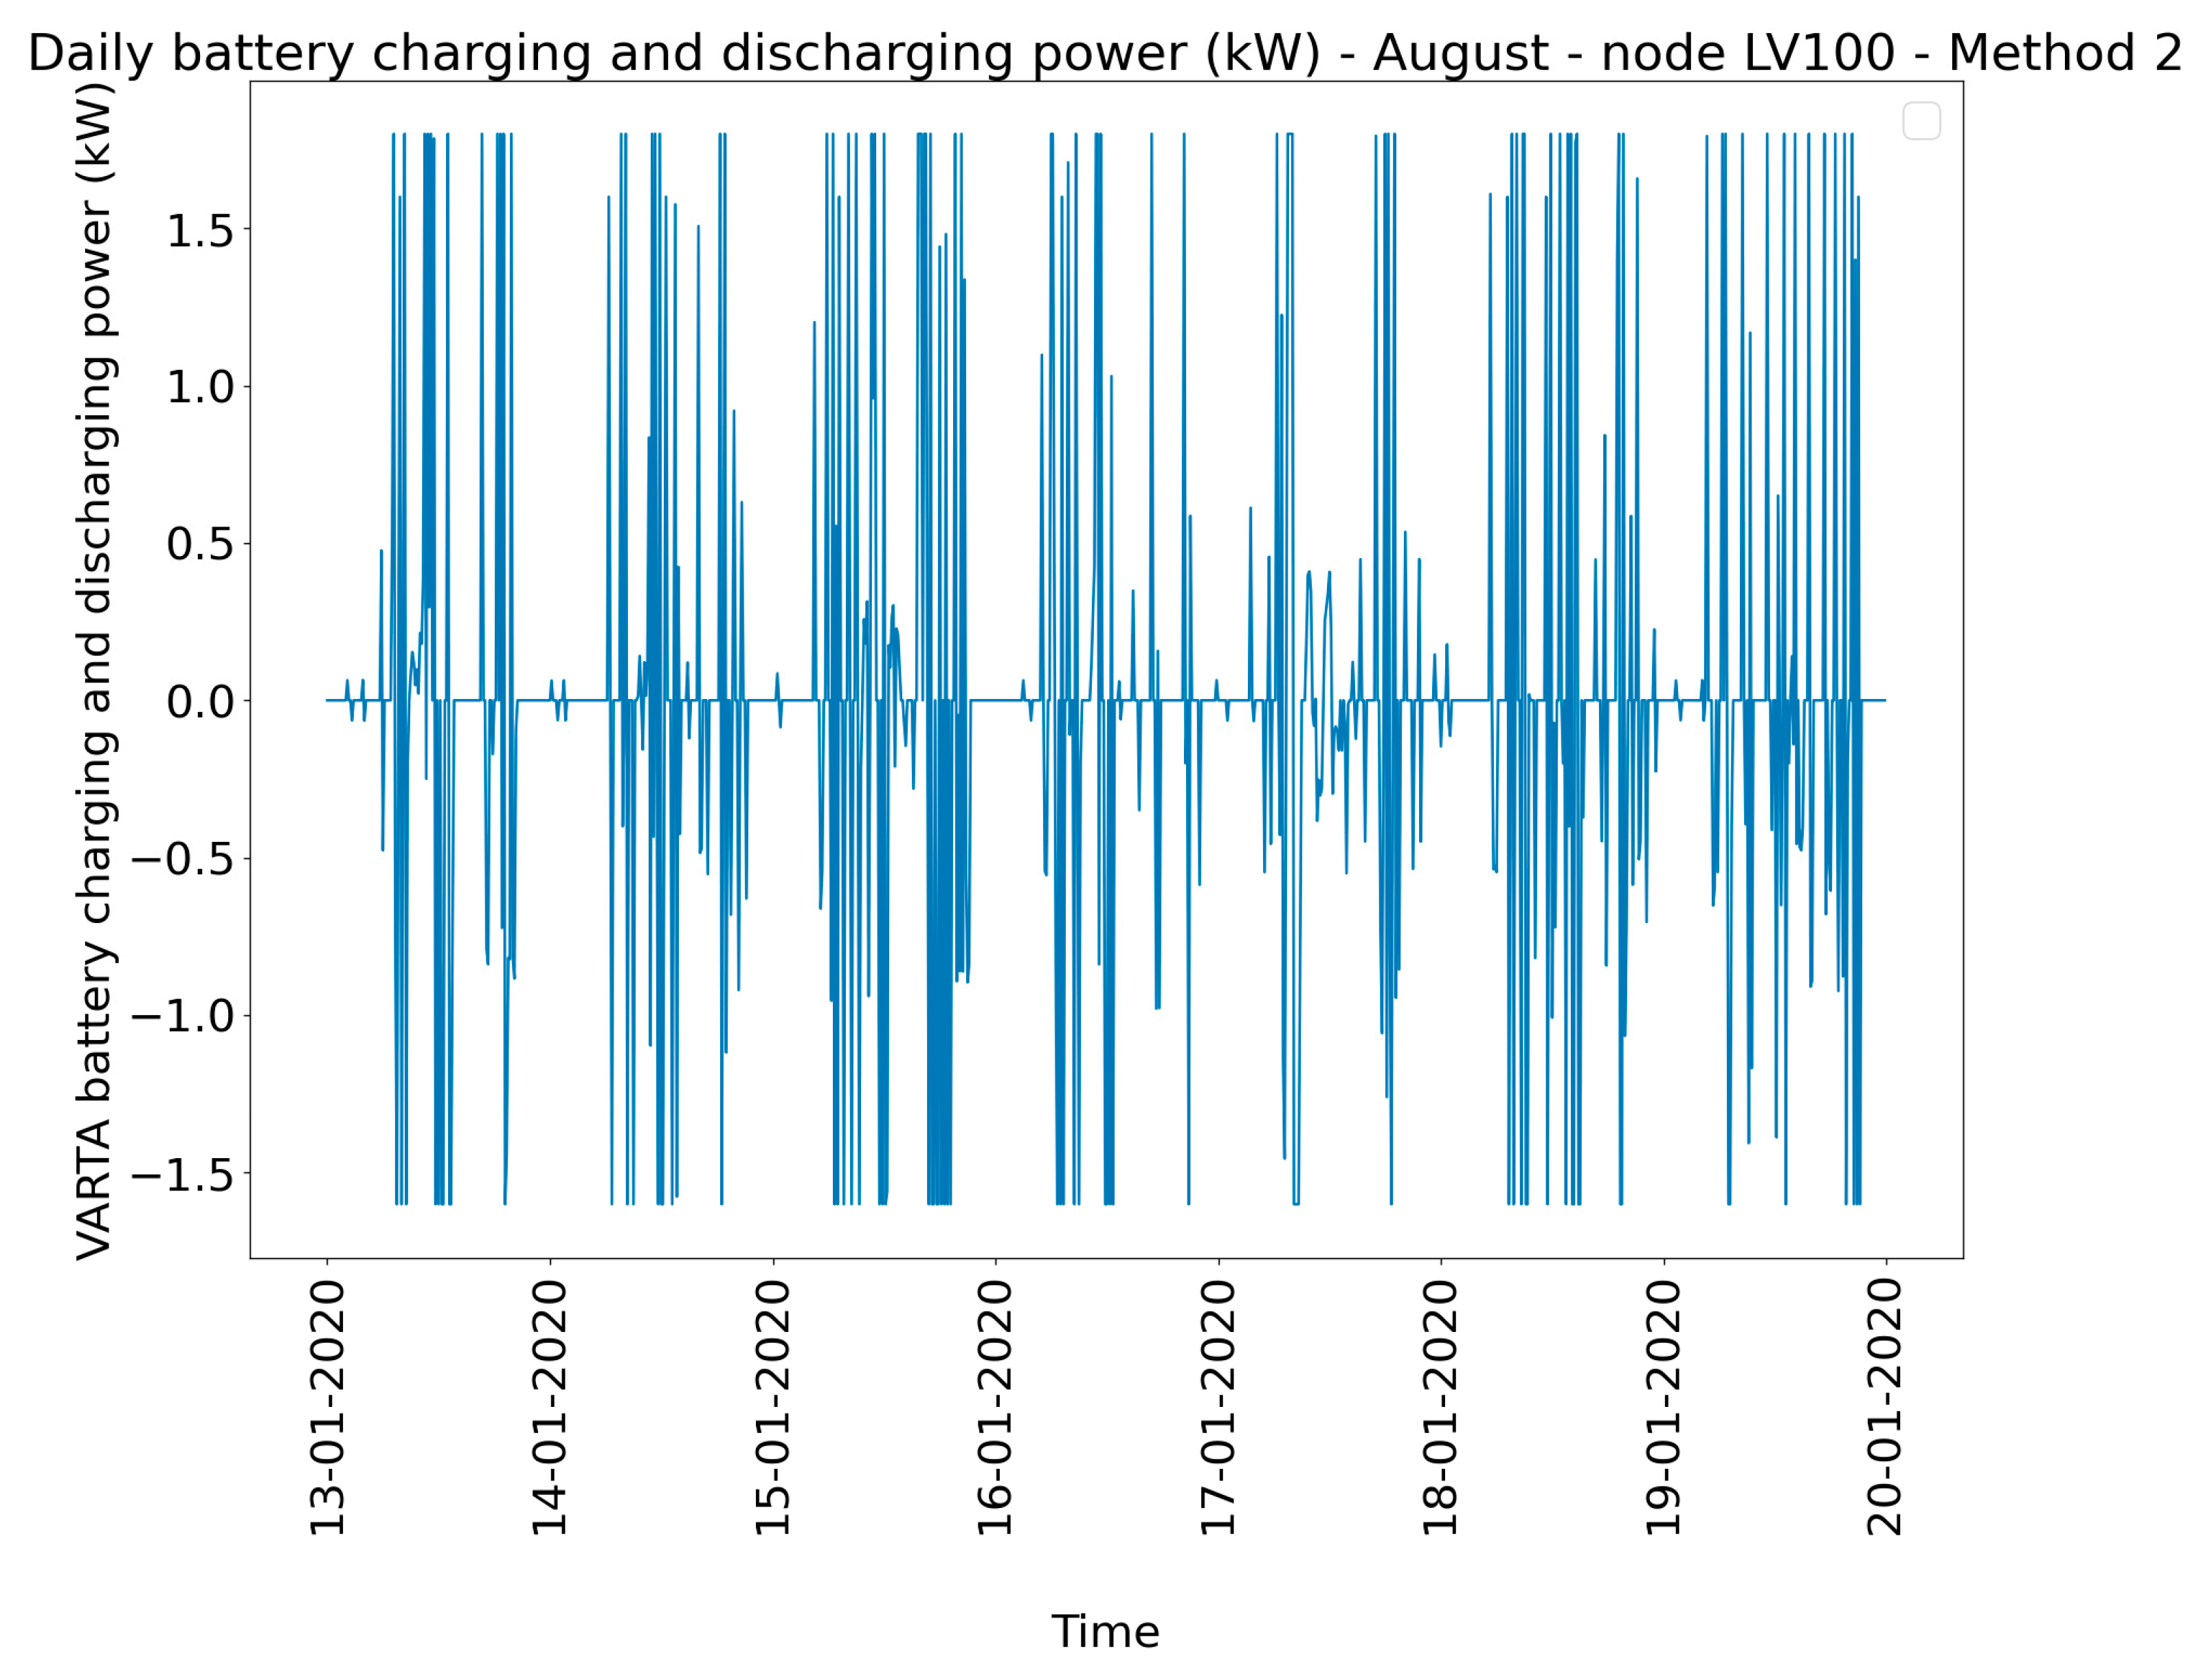
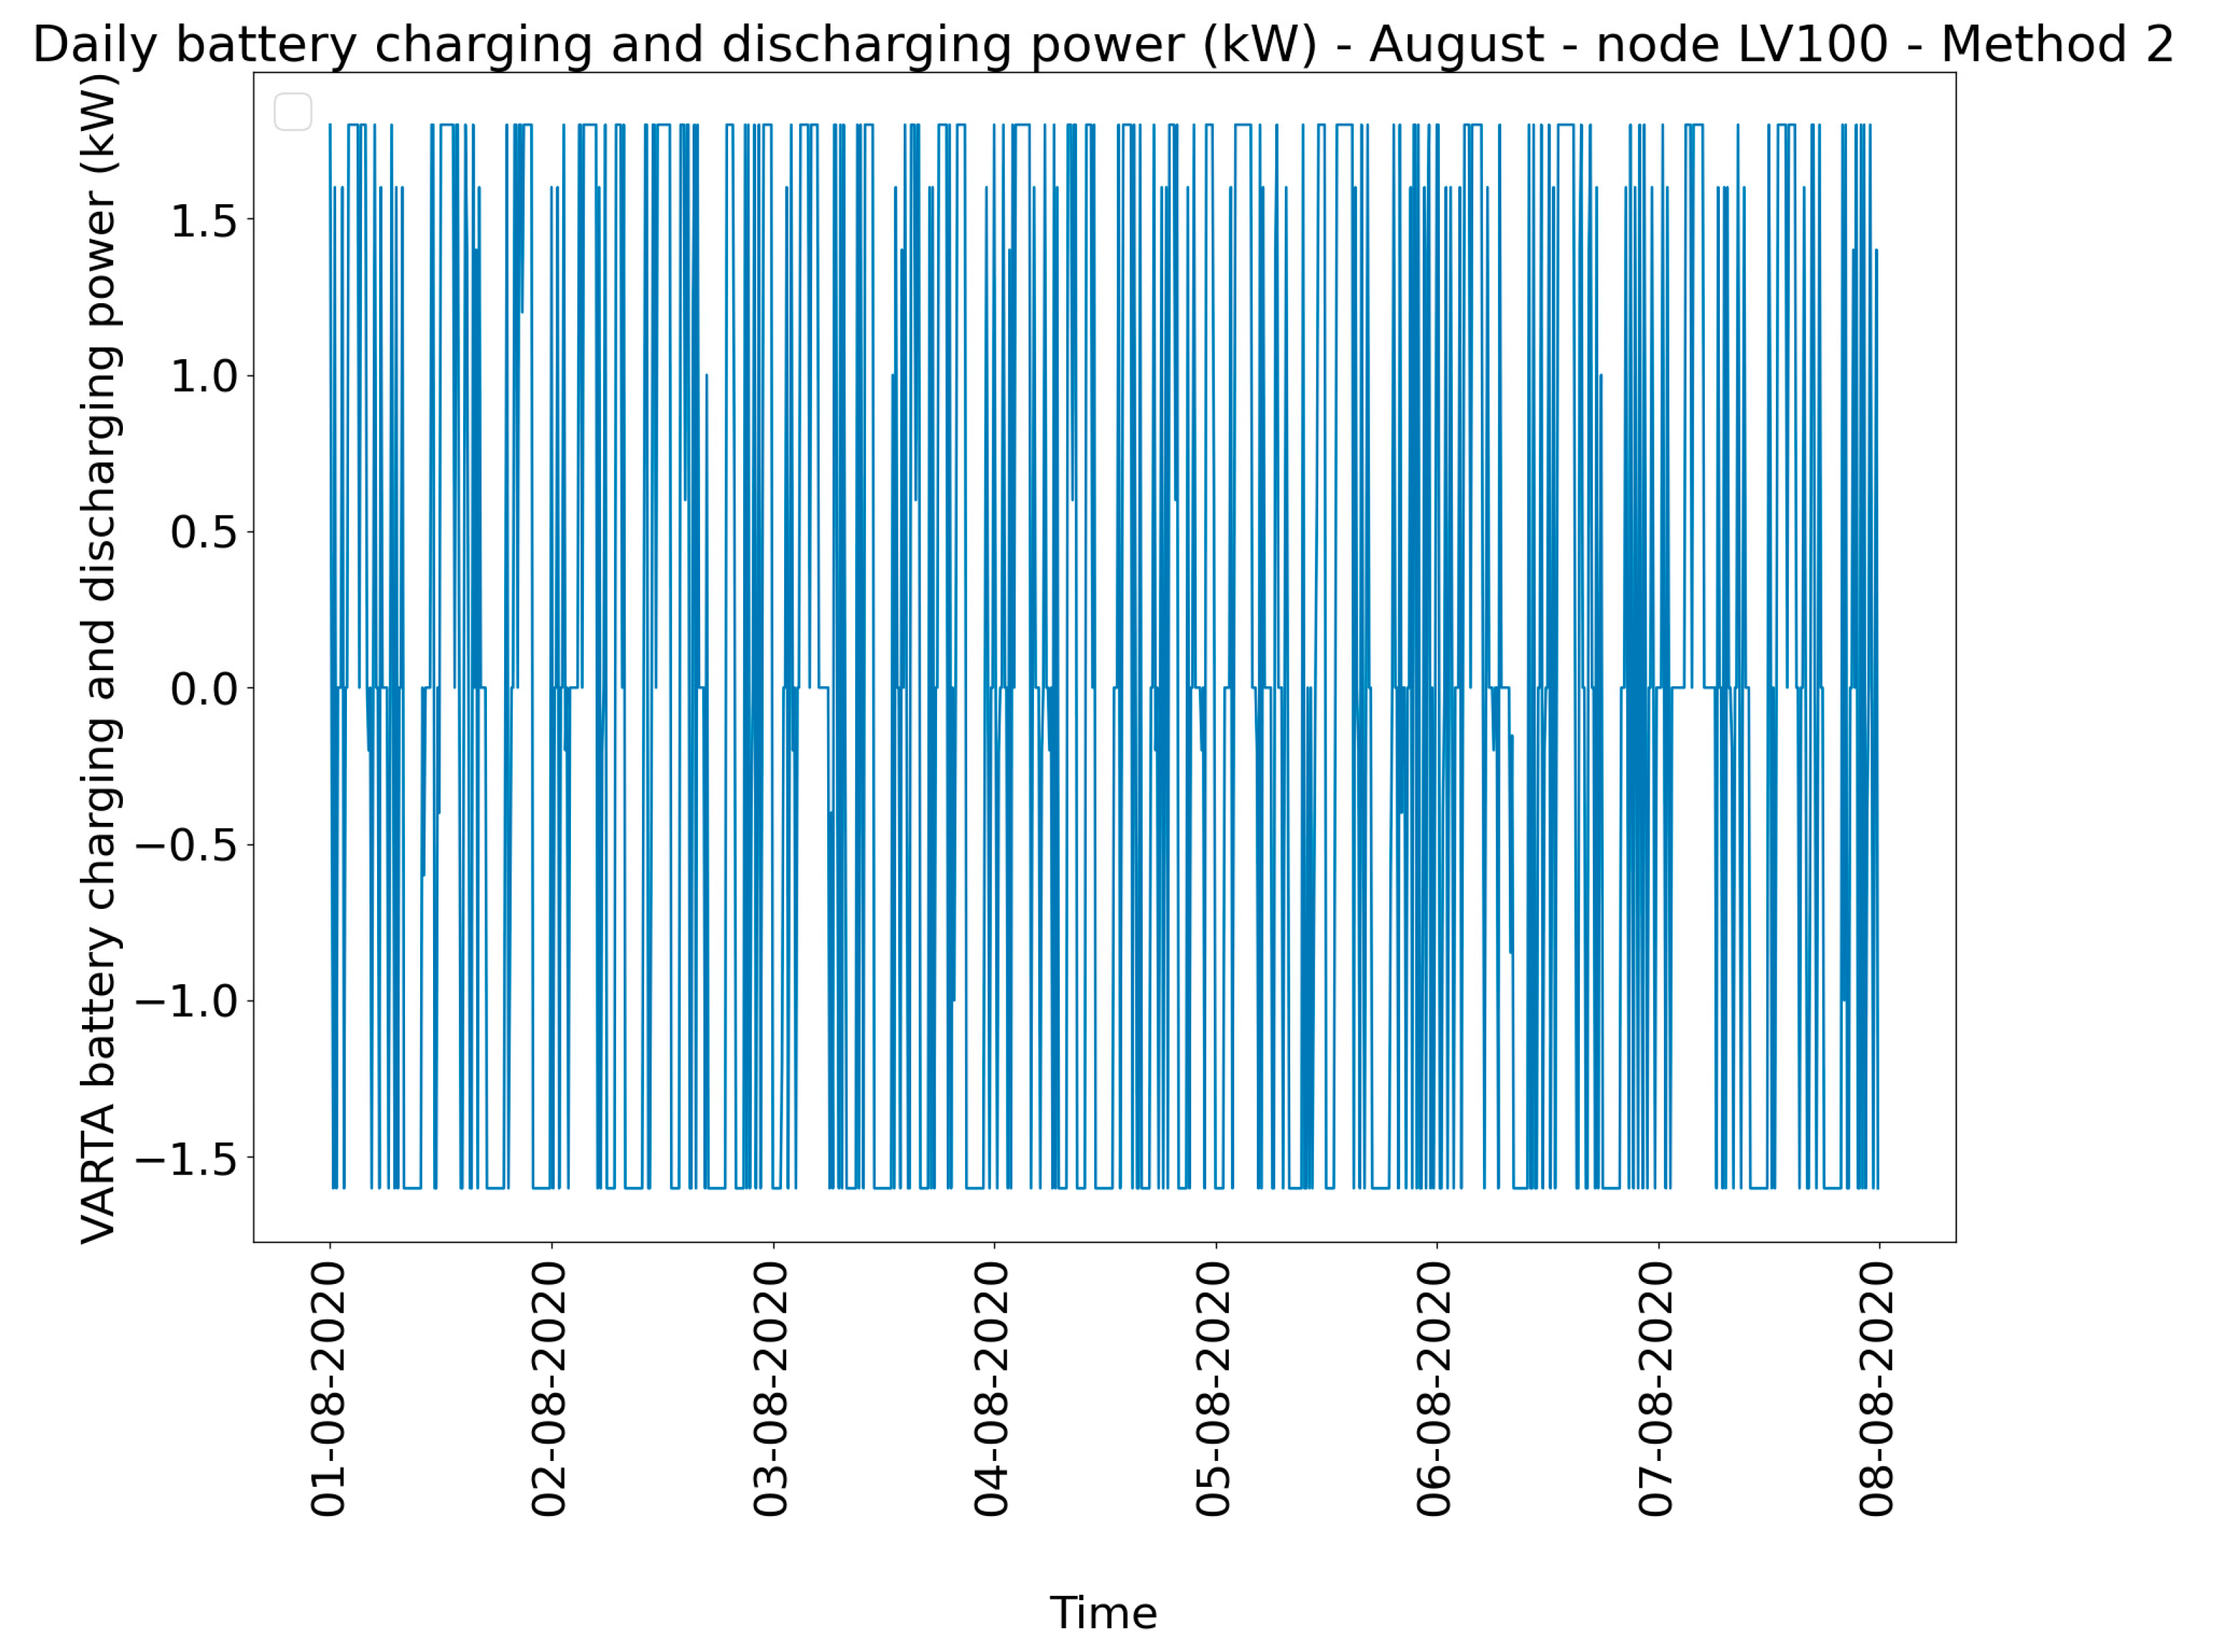
Figure A7 and Figure A8 show the charging and the discharging power of the battery storage in the node LV100, when the battery is modelled as the end-users are active DA market participants (Method 2).
Figure A7.
VARTA battery charging and discharging curve—January—Method 2.

Figure A8.
VARTA battery charging and discharging curve—August—Method 2.


Table A1.
EV charging power in January.
| Time | EV Charging Power (kW) | ||||||
|---|---|---|---|---|---|---|---|
| 13-01-20 | 14-01-20 | 15-01-20 | 16-01-20 | 17-01-20 | 18-01-20 | 19-01-20 | |
| 0:00–0:10 | 3.6 | 0 | 0 | 3.6 | 0 | 0 | 0 |
| 0:10–0:20 | 3.6 | 0 | 0 | 3.6 | 0 | 0 | 0.72 |
| 0:20–0:50 | 3.6 | 0 | 0 | 3.6 | 0 | 0 | 0 |
| 1:00–1:50 | 3.6 | 0 | 0 | 3.6 | 0 | 0 | 3.6 |
| 2:00–2:10 | 3.6 | 0 | 3.6 | 3.6 | 3.6 | 3.6 | 3.6 |
| 2:10–2:20 | 3.6 | 0 | 3.6 | 3.6 | 0 | 3.6 | 3.6 |
| 2:20–2:30 | 3.6 | 0 | 3.6 | 3.6 | 3.6 | 3.6 | 3.6 |
| 2:30–2:40 | 3.6 | 0 | 3.6 | 3.6 | 0 | 3.6 | 3.6 |
| 2:40–2:50 | 3.6 | 0 | 0.48 | 3.6 | 1.2 | 1.92 | 3.6 |
| 2:50–3:00 | 3.6 | 0 | 3.6 | 3.6 | 0 | 0 | 3.6 |
| 3:00–3:30 | 3.6 | 0 | 3.6 | 3.6 | 3.6 | 3.6 | 3.6 |
| 3:30–3:40 | 3.6 | 3.6 | 3.6 | 3.6 | 3.6 | 3.6 | 3.6 |
| 3:40–3:50 | 3.6 | 1.68 | 3.6 | 3.6 | 3.6 | 3.6 | 3.6 |
| 3:50–4:00 | 3.6 | 3.6 | 3.6 | 3.6 | 3.6 | 3.6 | 3.6 |
| 4:00–4:20 | 3.6 | 0 | 3.6 | 3.6 | 3.6 | 3.6 | 3.6 |
| 4:20–4:30 | 3.6 | 3.6 | 3.6 | 3.6 | 3.6 | 3.6 | 3.6 |
| 4:30–4:40 | 3.6 | 0 | 3.6 | 3.6 | 3.6 | 3.6 | 3.6 |
| 4:40–5:00 | 3.6 | 3.6 | 3.6 | 3.6 | 3.6 | 3.6 | 3.6 |
| 5:00–5:20 | 0 | 0 | 0 | 0 | 0 | 0 | 0 |
| 5:20–5:30 | 0 | 0 | 0 | 1.68 | 0 | 0 | 0 |
| 5:30–5:40 | 0 | 0 | 0 | 3.6 | 0 | 0 | 0 |
| 23:00–23:50 | 0 | 0 | 0 | 3.6 | 0 | 0 | 3.6 |
Table A2.
EV charging power in August.
| Time | EV Charging Power (kW) | ||||||
|---|---|---|---|---|---|---|---|
| 01-08-20 | 02-08-20 | 03-08-20 | 04-08-20 | 05-08-20 | 06-08-20 | 07-08-20 | |
| 0:00–0:10 | 0 | 0 | 0 | 3.6 | 0 | 0 | 3.6 |
| 0:10–0:30 | 0 | 0 | 0 | 3.6 | 0 | 0 | 0 |
| 0:30–0:40 | 0 | 0 | 0 | 3.6 | 0 | 0 | 0.72 |
| 0:40–1:00 | 0 | 0 | 0 | 3.6 | 0 | 0 | 0 |
| 1:00–2:00 | 3.6 | 0 | 0 | 3.6 | 0 | 0 | 3.6 |
| 2:00–2:40 | 3.6 | 0 | 3.6 | 3.6 | 0 | 3.6 | 3.6 |
| 2:40–2:50 | 3.6 | 0 | 0.48 | 3.6 | 0 | 3.6 | 3.6 |
| 2:50–3:00 | 3.6 | 0 | 3.6 | 3.6 | 0 | 3.6 | 3.6 |
| 3:00–4:00 | 3.6 | 0 | 3.6 | 3.6 | 3.6 | 3.6 | 3.6 |
| 4:00–4:10 | 3.6 | 1.68 | 3.6 | 3.6 | 3.6 | 3.6 | 3.6 |
| 4:10–4:30 | 3.6 | 0 | 3.6 | 3.6 | 3.6 | 3.6 | 3.6 |
| 4:30–4:40 | 3.6 | 0 | 3.6 | 3.6 | 3.6 | 0 | 3.6 |
| 4:40–4:50 | 3.6 | 0 | 3.6 | 3.6 | 3.6 | 3.6 | 3.6 |
| 4:50–5:00 | 3.6 | 0 | 3.6 | 3.6 | 3.6 | 1.32 | 3.6 |
| 5:00–5:10 | 3.6 | 3.6 | 0 | 3.6 | 0 | 0 | 3.6 |
| 5:10–5:30 | 3.6 | 3.6 | 0 | 3.6 | 3.6 | 0 | 3.6 |
| 5:30–5:40 | 3.6 | 3.6 | 0 | 3.6 | 1.2 | 0 | 3.6 |
| 5:40–5:50 | 3.6 | 3.6 | 0 | 3.6 | 0 | 0 | 3.6 |
| 23:00–23:10 | 3.6 | 0 | 0 | 1.68 | 0 | 0 | 0 |
| 23:10–23:30 | 0 | 0 | 0 | 3.6 | 0 | 0 | 0 |
References
- The European Green Deal. Available online: https://eur-lex.europa.eu/resource.html?uri=cellar:b828d165-1c22-11ea-8c1f-01aa75ed71a1.0002.02/DOC_1&format=PDF (accessed on 5 October 2020).
- 2030 Climate & Energy Framework. Available online: https://ec.europa.eu/clima/policies/strategies/2030_en (accessed on 5 October 2020).
- 2050 Long-Term Strategy. Available online: https://ec.europa.eu/clima/policies/strategies/2050_en (accessed on 5 October 2020).
- Jäger-Waldau, A. PV Status Report 2019; Publications Office of the European Union: Luxembourg, 2019. [Google Scholar]
- Electricity Storage and Renewables: Costs and Markets to 2030 Electricity Storage and Renewables: Costs and Markets to 2030; International Renewable Energy Agency: Abu Dhabi, UAE, 2017; ISBN 978-92-9260-038-9.
- Gutierrez-Lagos, L.; Ochoa, L.F. OPF-Based CVR Operation in PV-Rich MV-LV Distribution Networks. IEEE Trans. Power Syst. 2019, 34, 2778–2789. [Google Scholar] [CrossRef] [Green Version]
- Hashemi, S.; Østergaard, J. Methods and strategies for overvoltage prevention in low voltage distribution systems with PV. IET Renew. Power Gener. 2017, 11, 205–214. [Google Scholar] [CrossRef] [Green Version]
- Watson, J.D.; Watson, N.R.; Santos-Martin, D.; Wood, A.R.; Lemon, S.; Miller, A.J.V. Impact of solar photovoltaics on the low-voltage distribution network in New Zealand. IET Gener. Transm. Distrib. 2016, 10, 1–9. [Google Scholar] [CrossRef]
- Franco, J.F.; Procopiou, A.T.; Quirós-Tortós, J.; Ochoa, L.F. Advanced control of OLTC-enabled LV networks with PV systems and EVs. IET Gener. Transm. Distrib. 2019, 13, 2967–2975. [Google Scholar] [CrossRef]
- Haque, A.N.M.M.; Rahman, M.T.; Nguyen, P.H.; Bliek, F.W. Smart curtailment for congestion management in LV distribution network. IEEE Gen. Meet. Power Energy Soc. 2016. [Google Scholar] [CrossRef]
- Quirós-Tortós, J.; Ochoa, L.; Butler, T. How electric vehicles and the grid work together: Lessons learned from one of the largest electric vehicle trials in the world. IEEE Power Energy Mag. 2018, 16, 64–76. [Google Scholar] [CrossRef]
- Srivastava, A.; Steen, D.; Tuan, L.A.; Carlson, O. A congestion forecast framework for distribution systems with high penetration of PVs and PEVs. In Proceedings of the IEEE Milan PowerTech, Milan, Italy, 23–27 June 2019; pp. 1–6. [Google Scholar]
- Petrou, K.; Ochoa, L.F.; Procopiou, A.T.; Theunissen, J.; Bridge, J.; Langstaff, T.; Lintern, K. Limitations of Residential Storage in PV-Rich Distribution Networks: An Australian Case Study. IEEE Power Energy Soc. Gen. Meet. 2018. [Google Scholar] [CrossRef]
- Procopiou, A.T.; Petrou, K.; Ochoa, L.F.; Langstaff, T.; Theunissen, J. Adaptive decentralized control of residential storage in pv-rich mv-lv networks. IEEE Trans. Power Syst. 2019, 34, 2378–2389. [Google Scholar] [CrossRef]
- Procopiou, A.T.; Ochoa, L.F. Adaptive asset congestion management in PV-rich LV networks. In Proceedings of the IEEE Milan PowerTech, Milan, Italy, 23–27 June 2019. [Google Scholar]
- Miller, W.; Liu, A.; Amin, Z.; Wagner, A. Power quality and rooftop-photovoltaic households: An examination of measured data at point of customer connection. Sustainability 2018, 10, 1224. [Google Scholar] [CrossRef] [Green Version]
- De Silva, H.H.H.; Jayamaha, D.K.J.S.; Lidula, N.W.A. Power Quality Issues Due to High Penetration of Rooftop Solar PV in Low Voltage Distribution Networks: A Case Study. In Proceedings of the 14th IEEE International Conference on Industrial and Information Systems, Peradeniya, Sri Lanka, 18–20 December 2019; pp. 395–400. [Google Scholar] [CrossRef]
- Niitsoo, J.; Jarkovoi, M.; Taklaja, P.; Klüss, J.; Palu, I. Power Quality Issues Concerning Photovoltaic Generation in Distribution Grids. Smart Grid Renew. Energy 2015, 6, 148–163. [Google Scholar] [CrossRef] [Green Version]
- Schlabbach, J.; Gross, A. Harmonic current emission of photovoltaic inverters. In Proceedings of the 5th International Conference on European Electricity Market, Leuven, Belgium, 4–8 April 2016. [Google Scholar]
- Das, C.K.; Bass, O.; Kothapalli, G.; Mahmoud, T.S.; Habibi, D. Overview of energy storage systems in distribution networks: Placement, sizing, operation, and power quality. Renew. Sustain. Energy Rev. 2018, 91, 1205–1230. [Google Scholar] [CrossRef]
- Tadjine, M.; Allaoui, T.; Belabbas, B.; Denai, M. Power quality enhancement in hybrid photovoltaic-battery system based on three-level inverter associated with DC bus voltage control. J. Power Technol. 2017, 97, 272–282. [Google Scholar]
- Monteiro, V.; Gonçalves, H.; Afonso, J.L. Impact of electric vehicles on power quality in a Smart Grid context. In Proceedings of the 11th International Conference on Electrical Power Quality and Utilisation, Lisbon, Portugal, 17–19 October 2011; pp. 660–665. [Google Scholar]
- Al Essa, M.J.M. Power Quality of Electrical Distribution Systems Considering PVs, EVs and DSM. J. Control. Autom. Electr. Syst. 2020. [Google Scholar] [CrossRef]
- Brinkel, N.B.G.; Gerritsma, M.K.; AlSkaif, T.A.; Lampropoulos, I.; van Voorden, A.M.; Fidder, H.A.; van Sark, W.G.J.H.M. Impact of rapid PV fluctuations on power quality in the low-voltage grid and mitigation strategies using electric vehicles. Int. J. Electr. Power Energy Syst. 2020, 118, 105741. [Google Scholar] [CrossRef]
- Rusinaru, D.; Manescu, L.G.; Ciontu, M.; Alba, M. Three-phase load flow analysis of the unbalanced distribution networks. In Proceedings of the 2016 International Conference on Applied and Theoretical Electricity, Craiova, Romania, 6–8 October 2016; pp. 1–5. [Google Scholar]
- Kharrazi, A.; Sreeram, V.; Mishra, Y. Assessment of voltage unbalance due to single phase rooftop photovoltaic panels in residential low voltage distribution network: A study on a real LV network in Western Australia. In Proceedings of the 2017 Australasian Universities Power Engineering Conference, Melbourne, Australia, 19–22 November 2017; pp. 1–6. [Google Scholar] [CrossRef] [Green Version]
- Markiewicz, H.; Klajn, A. Voltage Disturbances—Standard EN 50160; European Copper Institute: Brussels, Belgium, 2006; p. 17. [Google Scholar]
- International Electrotechnical Commission (IEC). IEC 61000-3-13 2015.
- Rezvani, F.; Mozafari, B.; Faghihi, F. Power quality analysis for Photovoltaic system considering unbalanced voltage. Indian J. Sci. Technol. 2015, 8. [Google Scholar] [CrossRef]
- Lucas, A. Single-phase PV power injection limit due to voltage unbalances applied to an urban reference network using real-time simulation. Appl. Sci. 2018, 8, 1333. [Google Scholar] [CrossRef] [Green Version]
- Plummer, I. Asymmetry in Distribution Systems: Causes, Harmful Effects and Remedies. Master’s Thesis, Louisiana State University, Baton Rouge, LA, USA, 2011. [Google Scholar]
- Chua, K.H.; Lim, Y.S.; Wong, J.; Taylor, P.; Morris, E.; Morris, S. Voltage Unbalance Mitigation in Low Voltage Distribution Networks with Photovoltaic Systems. J. Electron. Sci. Technol. 2012, 10, 1–6. [Google Scholar] [CrossRef] [Green Version]
- Lopes, M.G.; Trindade, F.C.L.; Ochoa, L.F. Phase-to-Phase Connection of PV Systems in Brazilian LV Networks: Modelling and Impacts. In Proceedings of the 2019 IEEE PES Innovative Smart Grid Technologies Conference—Latin America, Gramado, Brazil, 15–18 September 2019; pp. 1–6. [Google Scholar]
- Nour, A.M.M.; Hatata, A.Y.; Helal, A.A.; El-Saadawi, M.M. Rooftop PV systems with distributed batteries for voltage unbalance mitigation in low voltage radial feeders. J. Renew. Sustain. Energy 2018, 10. [Google Scholar] [CrossRef]
- Safitri, N.; Shahnia, F.; Masoum, M.A.S. Coordination of single-phase rooftop pvs in unbalanced three-phase residential feeders for voltage profiles improvement. Aust. J. Electr. Electron. Eng. 2016, 13, 77–90. [Google Scholar] [CrossRef]
- Grigoraş, G.; Neagu, B.C.; Gavrilaş, M.; Triştiu, I.; Bulac, C. Optimal phase load balancing in low voltage distribution networks using a smart meter data-based algorithm. Mathematics 2020, 8, 549. [Google Scholar] [CrossRef] [Green Version]
- Ochoa, L.F.; Ciric, R.M.; Padilha-Feltrin, A.; Harrison, G.P. Evaluation of distribution system losses due to load unbalance. In Proceedings of the 15th Power Systems Computation Conference 2005, Liege, Belgium, 22–26 August 2005. [Google Scholar]
- Procopiou, A.T.; Jazaeri, J.; Petrou, K.; Liu, M.; Ochoa, L.F.; Langstaff, T.; Harding, J.; Theunissen, J. On the role of integrated MV-LV network modelling in DER studies. In Proceedings of the CIRED Workshop, Berlin, Germany, 22–23 September 2020; pp. 1–5. [Google Scholar]
- Quirós-Tortós, J.; Valverde, G.; Argüello, A.; Ochoa, L.N. Geo-Information Is Power: Using Geographical Information Systems to Assess Rooftop Photovoltaics in Costa Rica. IEEE Power Energy Mag. 2017, 15, 48–56. [Google Scholar] [CrossRef]
- Custodio, G.; Trindade, F.C.L.; Petrou, K.; Ochoa, L.F. An Advanced GIS-based Tool for the Analysis of Future Distribution Networks. In Proceedings of the 2019 IEEE PES Innovative Smart Grid Technologies Conference—Latin America, Gramado, Brazil, 15–18 September 2019. [Google Scholar]
- LoadProfileGenerator. Available online: https://www.loadprofilegenerator.de/ (accessed on 14 October 2020).
- Weniger, J.; Tjaden, T.; Quaschning, V. Sizing of residential PV battery systems. Energy Procedia 2014, 46, 78–87. [Google Scholar] [CrossRef] [Green Version]
- Azuatalam, D.; Paridari, K.; Ma, Y.; Förstl, M.; Chapman, A.C.; Verbič, G. Energy management of small-scale PV-battery systems: A systematic review considering practical implementation, computational requirements, quality of input data and battery degradation. Renew. Sustain. Energy Rev. 2019, 112. [Google Scholar] [CrossRef] [Green Version]
- Petrou, K.; Liu, M.Z.; Procopiou, A.T.; Ochoa, L.F.; Theunissen, J.; Harding, J. Managing residential prosumers using operating envelopes: An Australian case study. In Proceedings of the CIRED Workshop, Berlin, Germany, 22–23 September 2020; pp. 1–6. [Google Scholar]
- VARTA Pulse/Pulse Neo 130. Available online: https://www.varta-storage.com/fileadmin/varta_storage/downloads/products/energy/varta-pulse/Datasheet_VARTA_pulse_en_17.pdf (accessed on 15 October 2020).
- Powerwall.Tesla Other Europe. Available online: https://www.tesla.com/en_eu/powerwall?redirect=no (accessed on 15 October 2020).
- Entso-e Day-Ahead Prices. Available online: https://transparency.entsoe.eu/transmission-domain/r2/dayAheadPrices/show (accessed on 15 October 2020).
- Nissan Leaf Price and Specifications—EV Database. Available online: https://ev-database.org/car/1106/Nissan-Leaf (accessed on 21 October 2020).
- Croatian Grid Code—Distribution Network. Available online: https://narodne-novine.nn.hr/clanci/sluzbeni/2018_08_74_1539.html (accessed on 23 October 2020).
Figure 1.
Modelled LV distribution network.

Figure 2.
VUF (%)—Case 1; Share 1–Share 4; January, August.

Figure 3.
VUF > 2%—Case 1; Share 1–Share 4; January, August.

Figure 4.
VUF (%)—Case 2; Share 1–Share 4; January, August.

Figure 5.
VUF > 2%—Case 2; Share 1–Share 4; January, August.

Figure 6.
VUF (%)—Case 3; Share 1–Share 4; January, August.

Figure 7.
VUF > 2%—Case 3; Share 1–Share 4; January, August.

Figure 8.
VUF (%)—Case 4; Share 1–Share 4; January, August.

Figure 9.
VUF > 2%—Case 4; Share 1–Share 4; January, August.

Figure 10.
Minimum and maximum voltage magnitude—Case 4.

Table 1.
Transformer’s parameters in the observed LV network.
| U1 (kV) | U2 (kV) | ukr1 (%) | ukr0 (%) | Sn (MVA) | PFe (KW) |
|---|---|---|---|---|---|
| 10 | 0.4 | 3.86 | 3.86 | 630 | 0.9 |
Table 2.
Nodes in the observed network.
| Nodes | Type |
|---|---|
| TS MV | Substation MV Busbar (10 kV) |
| TS | Substation LV Busbar (0.4 kV) |
| LV1–LV103 | End-user’s node (0.4 kV) |
| KRO1–KRO15 | Electric switch cabinet (0.4 kV) |
Publisher’s Note: MDPI stays neutral with regard to jurisdictional claims in published maps and institutional affiliations. |
© 2020 by the authors. Licensee MDPI, Basel, Switzerland. This article is an open access article distributed under the terms and conditions of the Creative Commons Attribution (CC BY) license (http://creativecommons.org/licenses/by/4.0/).
Share and Cite
MDPI and ACS Style
Antić, T.; Capuder, T.; Bolfek, M. A Comprehensive Analysis of the Voltage Unbalance Factor in PV and EV Rich Non-Synthetic Low Voltage Distribution Networks. Energies 2021, 14, 117. https://doi.org/10.3390/en14010117
AMA Style
Antić T, Capuder T, Bolfek M. A Comprehensive Analysis of the Voltage Unbalance Factor in PV and EV Rich Non-Synthetic Low Voltage Distribution Networks. Energies. 2021; 14(1):117. https://doi.org/10.3390/en14010117
Chicago/Turabian StyleAntić, Tomislav, Tomislav Capuder, and Martin Bolfek. 2021. "A Comprehensive Analysis of the Voltage Unbalance Factor in PV and EV Rich Non-Synthetic Low Voltage Distribution Networks" Energies 14, no. 1: 117. https://doi.org/10.3390/en14010117
Note that from the first issue of 2016, this journal uses article numbers instead of page numbers. See further details here.