Article

The Immediate Impacts of COVID-19 on European Electricity Systems: A First Assessment and Lessons Learned

1
Department of Energy, Politecnico di Torino, 10129 Torino, Italy
2
European Commission, Joint Research Centre (JRC), 1755 Petten, The Netherlands
3
European Commission, Joint Research Centre (JRC), 21027 Ispra, Italy
*
Author to whom correspondence should be addressed.
Energies 2021, 14(1), 96; https://doi.org/10.3390/en14010096
Submission received: 13 November 2020 / Revised: 14 December 2020 / Accepted: 21 December 2020 / Published: 26 December 2020

Abstract

:
The worldwide spread of the COVID-19 pandemic in 2020 forced most countries to intervene with policies and actions—including lockdowns, social-distancing and smart working measures—aimed at mitigating the health system and socio-economic disruption risks. The electricity sector was impacted as well, with performance largely reflecting the changes in the industrial and commercial sectors operations and in the social behavior patterns. The most immediate consequences concerned the power demand profiles, the generation mix composition and the electricity price trends. As a matter of fact, the electricity sectors experienced a foretaste of the future, with higher renewable energy penetration and concerns for security of supply. This paper presents a systemic approach toward assessing the impacts of the COVID-19 pandemic on the power sector. This is aimed at supporting decision making—particularly for policy makers, regulators, and system operators—by quantifying shorter term effects and identifying longer term impacts of the pandemic waves on the power system. Various metrics are defined in different areas—system operation, security, and electricity markets—to quantify those impacts. The methodology is finally applied to the European power system to produce a comparative assessment of the effects of the lockdown in the European context.

1. Introduction

The World Health Organization (WHO) first reported a cluster of unknown origin cases of pneumonia on December 31, 2019 in Wuhan, China. The new coronavirus disease was named 2019-nCoV, and commonly referred to as COVID-19 as from February 11, 2020. The first case of novel coronavirus outside China was confirmed in Thailand on January 13, 2020 and in the US on January 20, 2020, from that time on spreading rapidly through Japan, South Korea, Iran, Europe, and Australia. The novel coronavirus started to spike for the first time in Europe with cases in Italy on February 21, 2020 and a week later in Spain, on March 3, 2020. COVID-19 was declared a worldwide pandemic on March 11, 2020, given the concerns both about the alarming levels of spread and severity, and about the inaction in some countries [1]. Several countries imposed quarantines and restrictions to prevent further spread of the pandemic and to avoid the collapse of their health system, under pressure due to the increasing number of people admitted in intensive care. China was the first to deploy such measures, quarantining Wuhan and the rest of Hubei province starting from January 23, 2020, involving more than 760 million people. Italy declared nationwide lockdown on March 9, 2020, followed by Spain, France, and the UK (March 23). On March 25, 2020 nearly one third of the world population was on lockdown, later reaching 4.2 billion people as of April 28th.
The international emergency due to the spread of COVID-19 and the implemented procedures for its containment had an important impact on the whole economy, sociality, habits, and activities [2]. Millions of people were quarantined in their homes, a great majority working remotely, and students followed their classes online. Traditionally, changes in the productive and social behaviors have direct effects on the electrical power system performance [3]. Inevitably the COVID-19 pandemic and the relative adopted restraining measures, affecting behaviors and activities, influenced the power system in many respects [4].
Several studies and analyses started exploring the COVID-19 impact on the power sector, both in the shorter and longer terms, nonetheless capturing the overall systemic consequences requires accurate data and an adequate assessment framework [5].
As with what happened during the 2008–2009 subprime financial crisis, also the 2019–2020 events led to significant power sector investments downsizing, generation mix shifting (with greater resort to conventional technologies in the former case and renewable generation in the latter) and supply chains disruptions [6,7]. Nonetheless, electricity markets reacted quite differently, with the more remarkable effects—starting from the day-ahead prices fall—being recorded during the COVID-19 crisis.
From the demand point of view, in the USA, a reduction in the electricity consumption across all US markets was observed, and it was correlated with the rise in the number of COVID-19 cases, the size of the stay at home population, and the mobility in the retail sector. In April and May, the demand decreased ranging from −4.44% to −10.71% [8]. In Canada, a similar reduction occurred: in Ontario the electricity demand decreased by about 10% and by 5% in Alberta, British Columbia, and New Brunswick [9]. The descendent trend was similar in Europe. The quarterly analysis released by ENEA (Agenzia nazionale per le nuove tecnologie, l’energia e lo sviluppo economico sostenibile) showed the dramatic energy demand reduction in Italy, around −7% in the first three months of 2020 compared to the same period of 2019, altogether for oil, gas, and electricity. The impact on CO2 emissions, market prices and transport sector were also investigated [10]. The ENEA analysis was extended to April 2020 and reported in [11]. The Industry Technical Support Leadership Committee of the IEEE Power and Energy Society published a report on the first response of the power industry on the pandemic [12], in which health, technical and business impacts were analysed, as well as the approaches followed by utilities and system operators to manage the new scenarios due to the COVID-19 pandemic. The change in social habits resulted in demand power profile modifications, and the decrease of industrial production lowered the electricity consumption [13,14]. A direct impact was observable in the alteration of demand in terms of both absolute values and temporal arrangement, affecting both energy consumption and power profiles. Besides this direct impact, indirect effects were related to the market prices and the generation mix [15,16,17]. One example was the increase in the share of renewable energy source (RES), which has led to market price reduction and increased concerns in terms of system security [18,19,20]. The impacts were different for each country, based on the electricity system’s structure (generation mix, share of distributed energy sources, etc.) and the social and economic context. Other studies highlighted also non-technical factors. For instance, EPRI carried out an extensive analysis of EU, US and China, focusing mainly on the human resource management by the electric utilities under the pandemic [21]. Many analyses have not investigated weather variations, which could significantly contribute to load variations given the correlation with the power profiles [22]. Such effects should be examined before assessing the impact of COVID-19 on demand changes, granting that the shock on the power sector is undeniable. Weather effects are usually modeled by expressing the load as a linear regression of meteorological factors such as temperature, wind speed, humidity, etc. Although the extremely wide variety of required weather variables, studies have shown that a few basic meteorological factors usually account for the weather-dependent load and temperature [23]. Some institutions created websites to track the COVID-19 lockdown effects. In [24] an electricity tracker was implemented to compare differences in electricity consumption between 2020 and 2019, with an overview of what is occurring across Europe, with data updated daily as new information emerges.
This paper describes the immediate COVID-19 impacts on the power systems and markets across Europe with a focus on the most affected countries, from the beginning of March 2020 until June 2020. The direct effect of the pandemic on the electricity demand are studied, and different situations that arose in the EU through are compared a set of metrics. Then the indirect impacts are discussed both on power systems, under a technical perspective related to operations and security, and on electricity markets, focusing on the Europe-wide Day Ahead Market (DAM) price, given that most of the electricity exchanges in organized markets take place in the day-ahead timeframe. By comparing the responses and the performance of several European power systems, lessons and recommendations are extrapolated to make them more resilient to future pandemics and/or comparable disrupting events. Section 2 provides the conceptual framework for the analysis which is applied in Section 3 to assess and compare the impacts across the EU. Section 4 concludes the paper, summarizing key findings and future developments.

2. Analyzing the Effects of Pandemic on Electricity Systems

The COVID-19-related lockdown measures significantly affected the electricity demand and the generation mix, as the increase in the residential consumption could not compensate the drastic reductions in industrial, commercial, and tertiary activities. The demand drop depended on the measures adopted, their severity and duration. The share of Renewable Energy Sources (RES) on the generation mix raised, while the fossil generation fell down. According to the International Energy Agency, the reduction in the demand will affect the whole 2020, with 5% and 10% yearly reductions in different regions [7].
The direct and measurable impacts of the pandemic on electricity systems are displayed in the evolution of the electricity demand. The demand variation can be measured both in terms of power profile and energy consumption. This variation is evaluated comparing power profiles with corresponding past periods without pandemics using a set of metrics able to quantitatively capture the variation.
The immediate indirect effects are related to (1) the technical operation of electricity systems and (2) electricity markets. On the technical side, the change in demand led to a change in the energy mix, with higher shares of RES that imply lower inertia and more problematic frequency stability and issues in voltage regulation. In addition, the power interchanges among the Member States were affected due to the need to keep each national system feasible and secure with a minimum number of traditional generators.

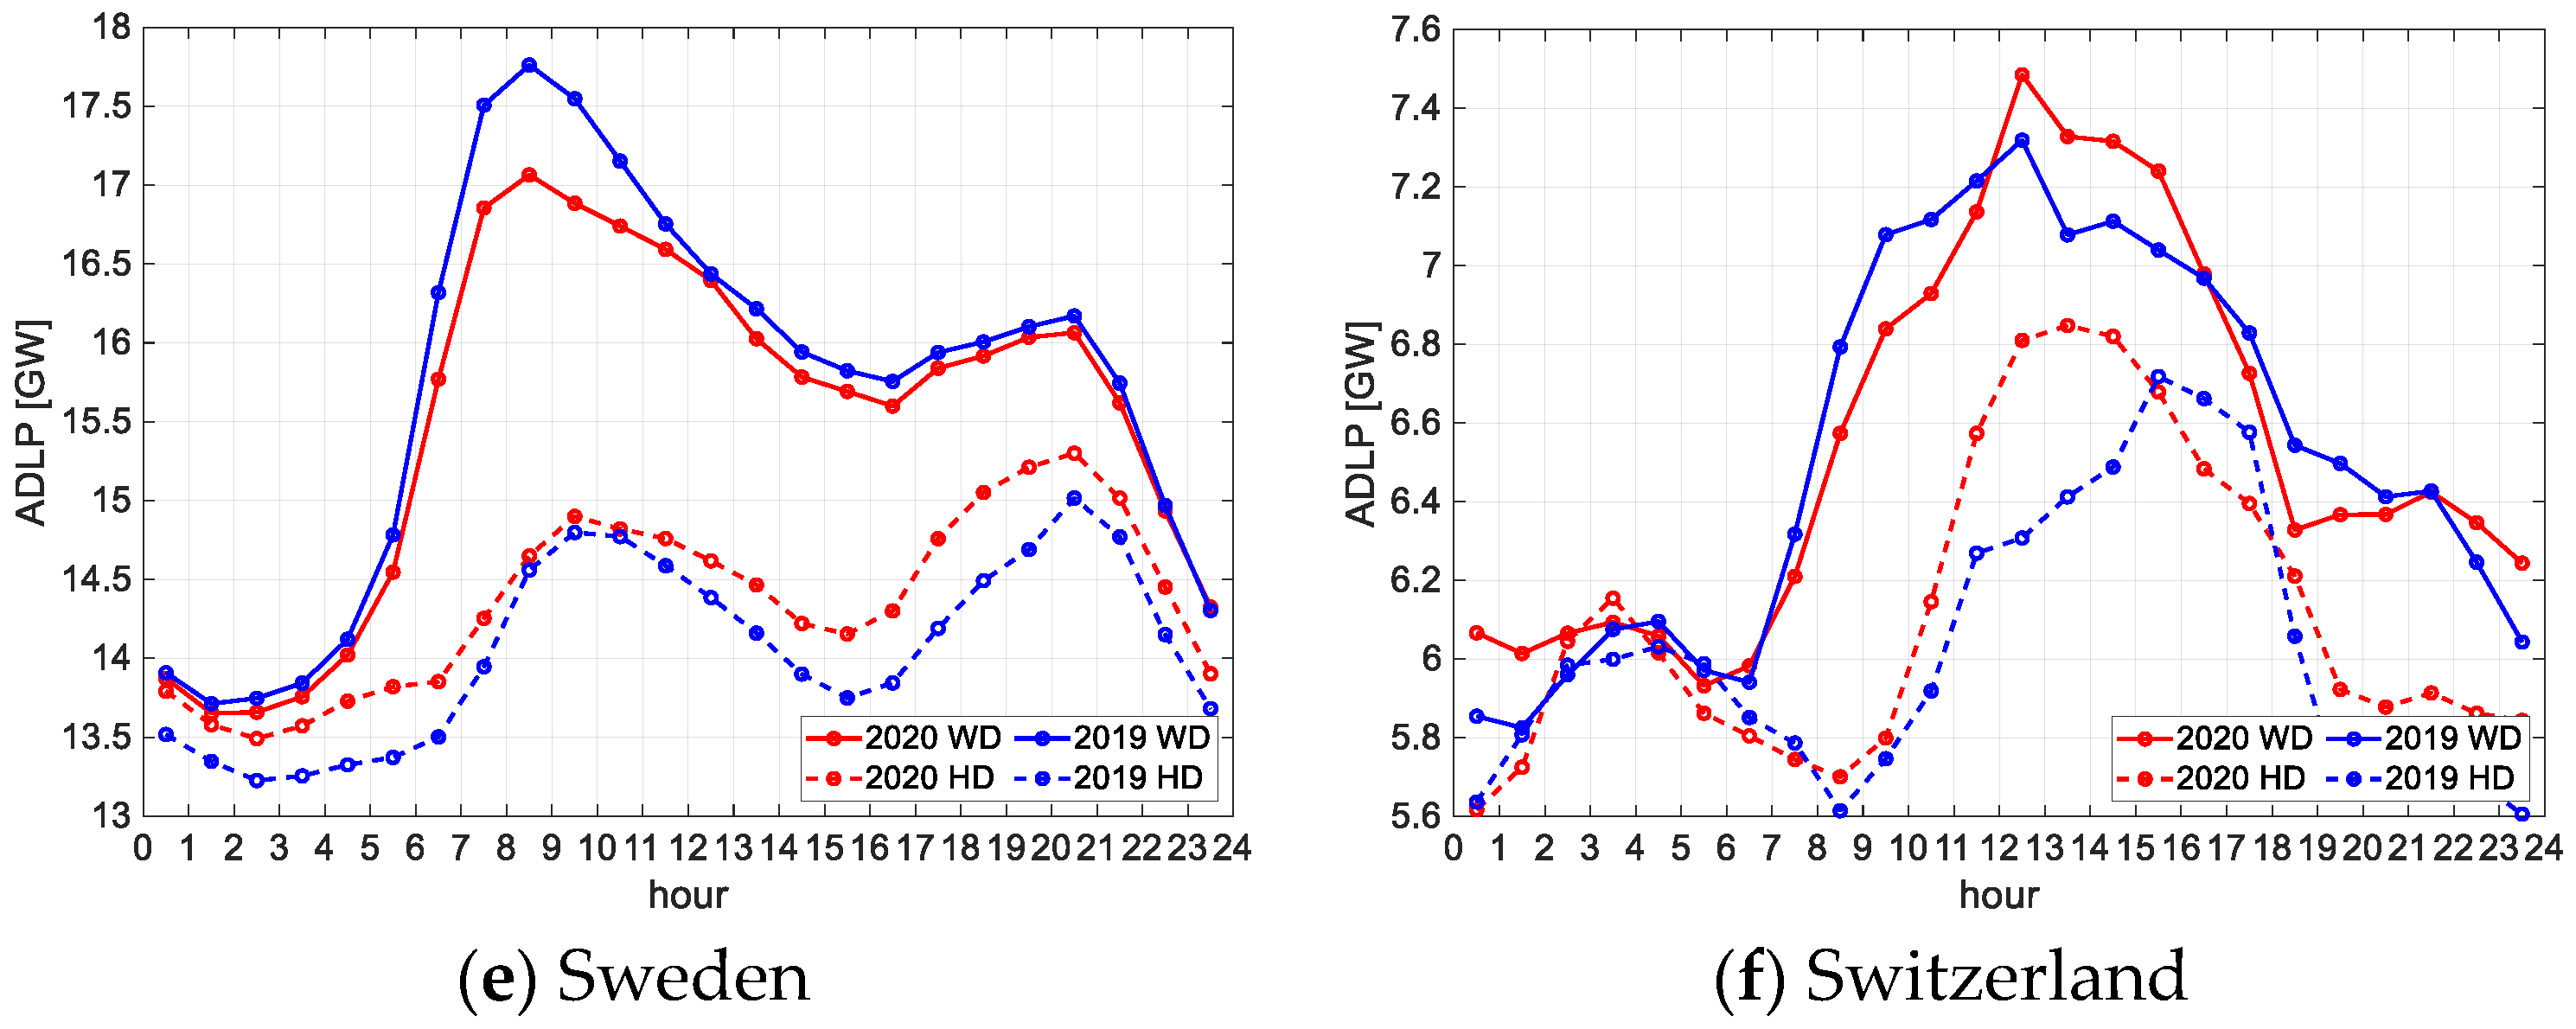
2.1. Direct Impact on Demand

Different metrics are defined to evaluate the impact on power demand and profile under pandemic. First, the demand trend is analyzed considering the time lag of the pandemic among different countries. The energy demand variation ( D v a r ) in the year y N of pandemic with the previous year y N 1 is reported in percentage as:
D v a r = D y N D y N 1 D y N 1 · 100
where D y N and D y N 1 are the total demand in the examined timeframe of the year y N and y N 1 . The demand is plotted with calendar adjustment between the years y N and y N 1 . The ratio D y N ( h ) / D y N 1 ( h ) is computed per each calendar-adjusted time step h and plotted as a duration curve. The maximum ( P m a x ) , minimum ( P m i n ) and average ( P a v e ) power demanded and the load factor ( ζ ) , defined as the ratio between P a v e and P m a x , are evaluated and compared among the year y N of pandemic with the previous year y N 1 in the examined timeframe.
The temperature effect on the demand variation is analyzed for a selected number of countries. The temperature of air two meters above the surface of land, sea or inland waters, is taken from Copernicus Land Monitoring Service 2020, by the European Environment Agency [25]. Figure 1 shows a typical correlation between the values of temperature and energy demand. It is possible to see the demand increase in full winter and summer, where lower and higher temperatures impose the need for more electricity, respectively for heating and cooling. In the mid-season instead, a variation of 1°C of temperature affects less the demand.
Given the demand temperature dependency in the form
E ( T ) = a   T 3 + b   T 2 + c   T + d
the weather effect can be evaluated using the following equations:
Δ E = d E d T ( T 20 ) · ( T 20 T 19 )
Δ E w % = ( E 20 Δ E E 19 ) E 19 · 100
where T 19 and T 20 are the temperature in 2019 and 2020, E 19 and E 20 are the energy demand in 2019 and 2020 respectively, Δ E and Δ E w are the demand variation without and with weather correction.
The load shape in function of time gives information on the effect of the measures applied to contain the pandemic. Energy consumption gradually changes over short (seasonally) and long (years, tens of years) timeframes. However, sudden changes in the social and productive habits can yield to unexpected demand shape variations. It is important then to identify some useful parameters for a comprehensive load shape analysis. Traditionally, load shapes can be characterized by their maximum, minimum, and average values, which vary considering working days and holidays. The typical load shape has two main peaks, one in the morning and the second in the evening. During holidays, the evening peak is usually more pronounced than the morning peak, while the opposite occurs during working days. The difference of magnitude between the two peaks follows the same pattern. The morning and evening ramps have usually higher slope in working days than in holidays. In this paper, the working day (WD) and holiday (HD) Average Daily Load Profile (ADLP) are evaluated. The ADLP is the defined as the mean load for each step during the days in a selected timeframe. The metrics deployed to identify the difference between the load profiles during the pandemic and the same period of last year are:
  • Maximum (ADLPmax), minimum (ADLPmin) and mean (ADLPave).
  • Peak Value (PV), defined as the maximum value of the ADLP, which could be a Morning Peak (MP), defined as the maximum value of the ADLP between 6 h and 15 h, or an Evening Peak (EP), defined as the maximum value of the ADLP between 18 h and 0 h.
  • Peak Time (PT), defined as the hour at which the PV occurs.
  • Peak difference (ΔP), defined as the difference between MP and EP.
  • Morning ramp (MR), defined as:
    M R = M P M B T M P T M B
    where MB is the Morning Base, i.e., the minimum value of the ADLP between 0 h and the time at which the MP occurs.
  • Evening ramp (ER), defined as:
    E R = E P E B T E P T E B
    where EB is the Evening Base, i.e., the minimum value of the ADLP between 15 h and the time at which the EP occurs.
A graphic representation of the metrics is depicted in Figure 2.

2.2. Indirect Impact: System Operation

Modern societies are fully dependent on electricity and maintaining security of supply is crucial for COVID-19 response and recovery. In the context of generation from renewable sources, comprising geothermal, hydroelectric, photovoltaic, wind and biomass, photovoltaic and wind are referred to as non-conventional generation, opposed to thermoelectric and hydroelectric conventional generation. The non-conventional generation poses some challenges to system security, as it is characterized by uncertainty in the generated power, making difficult both its control and forecasting. In addition to not contributing to the system inertia, the unconventional generation also implicates a reduction of the short-circuit power and of the frequency and voltage regulation capabilities. An assessment of the possible effects on the operation and security of the measures following the spread of COVID-19 pandemic can be carried out using the following indicators:
  • Electricity generation from RES (TWh) and its share over the total demand;
  • Electricity generation from fossil (TWh) sources and its share over the total demand;
  • Electricity generation from conventional/non-conventional units (TWh);
  • Non-conventional penetration index σ , defined as the share of non-conventional generation compared to the total generation (sum of conventional and non-conventional).

2.3. Indirect Impact: Electricity Markets

The immediate impact of the COVID-19 pandemic on electricity markets is analyzed in terms of price drop in the day-ahead market (DAM). A set of metrics is defined to evaluate the impact on volumes and prices in the DAM. The first indicator is the load-weighted weekly moving average of the hourly wholesale price in each bidding zone ( D A M p h ) ¯ , defined as:
D A M p h ¯ = i = 1 N C D A M p h i D F h i i = 1 N C D F h i
where D A M p h i is the DAM price for the bidding zone i, D F h i is the demand forecasted and N C is the number of considered countries.
This indicator is used to single out the effect of the pandemic on wholesale prices (€/MWh) trend per bidding zone for several years before the year y N of pandemic to establish a baseline for comparison. Other metrics used to investigate the dynamics of the electricity market include:
  • the variation of the load weighted weekly moving average of DAM prices in each bidding zone D A M p v a r   [€/MWh] in the year y N of pandemic with the previous year y N 1 in percentage as:
    D A M p v a r = D A M p y N D A M p y N 1 D A M p y N 1 · 100
  • The minimum DAM price D A M p m i n   [€/MWh], defined as the minimum price reached in the DAM in the selected timeframe.
  • The number of hours with negative prices (where they are allowed) N h n e g .
  • The DAM volumes in [GWh], defined as the total load for all the bidding zones for the year 2020 w.r.t the previous years.
  • Time series decomposition of zonal time series of prices. The goal is to capture the different components of the average DAM price time series; each series is processed using a simple decomposition method for showing three components: the trend (weekly moving average), the seasonal component repeating weekly, and the random component. Adding the three components up, the time series of DAM prices in each zone is obtained.
In this context, the term “seasonal” carries a different meaning than in the previous sections of the research presented: in the statistical decomposition of the zonal DAM prices the term indicates the part of the zonal prices trend that repeats over each week, and that should be subtracted from the observations to identify the real trend.

3. Pan-European Impacts of Pandemics

A comparative analysis is conducted at the EU level considering 27 Member States. The metrics introduced in Section 2 are evaluated for each Member State. The load data of the EU countries are taken from the ENTSO-E Transparency Platform [26].

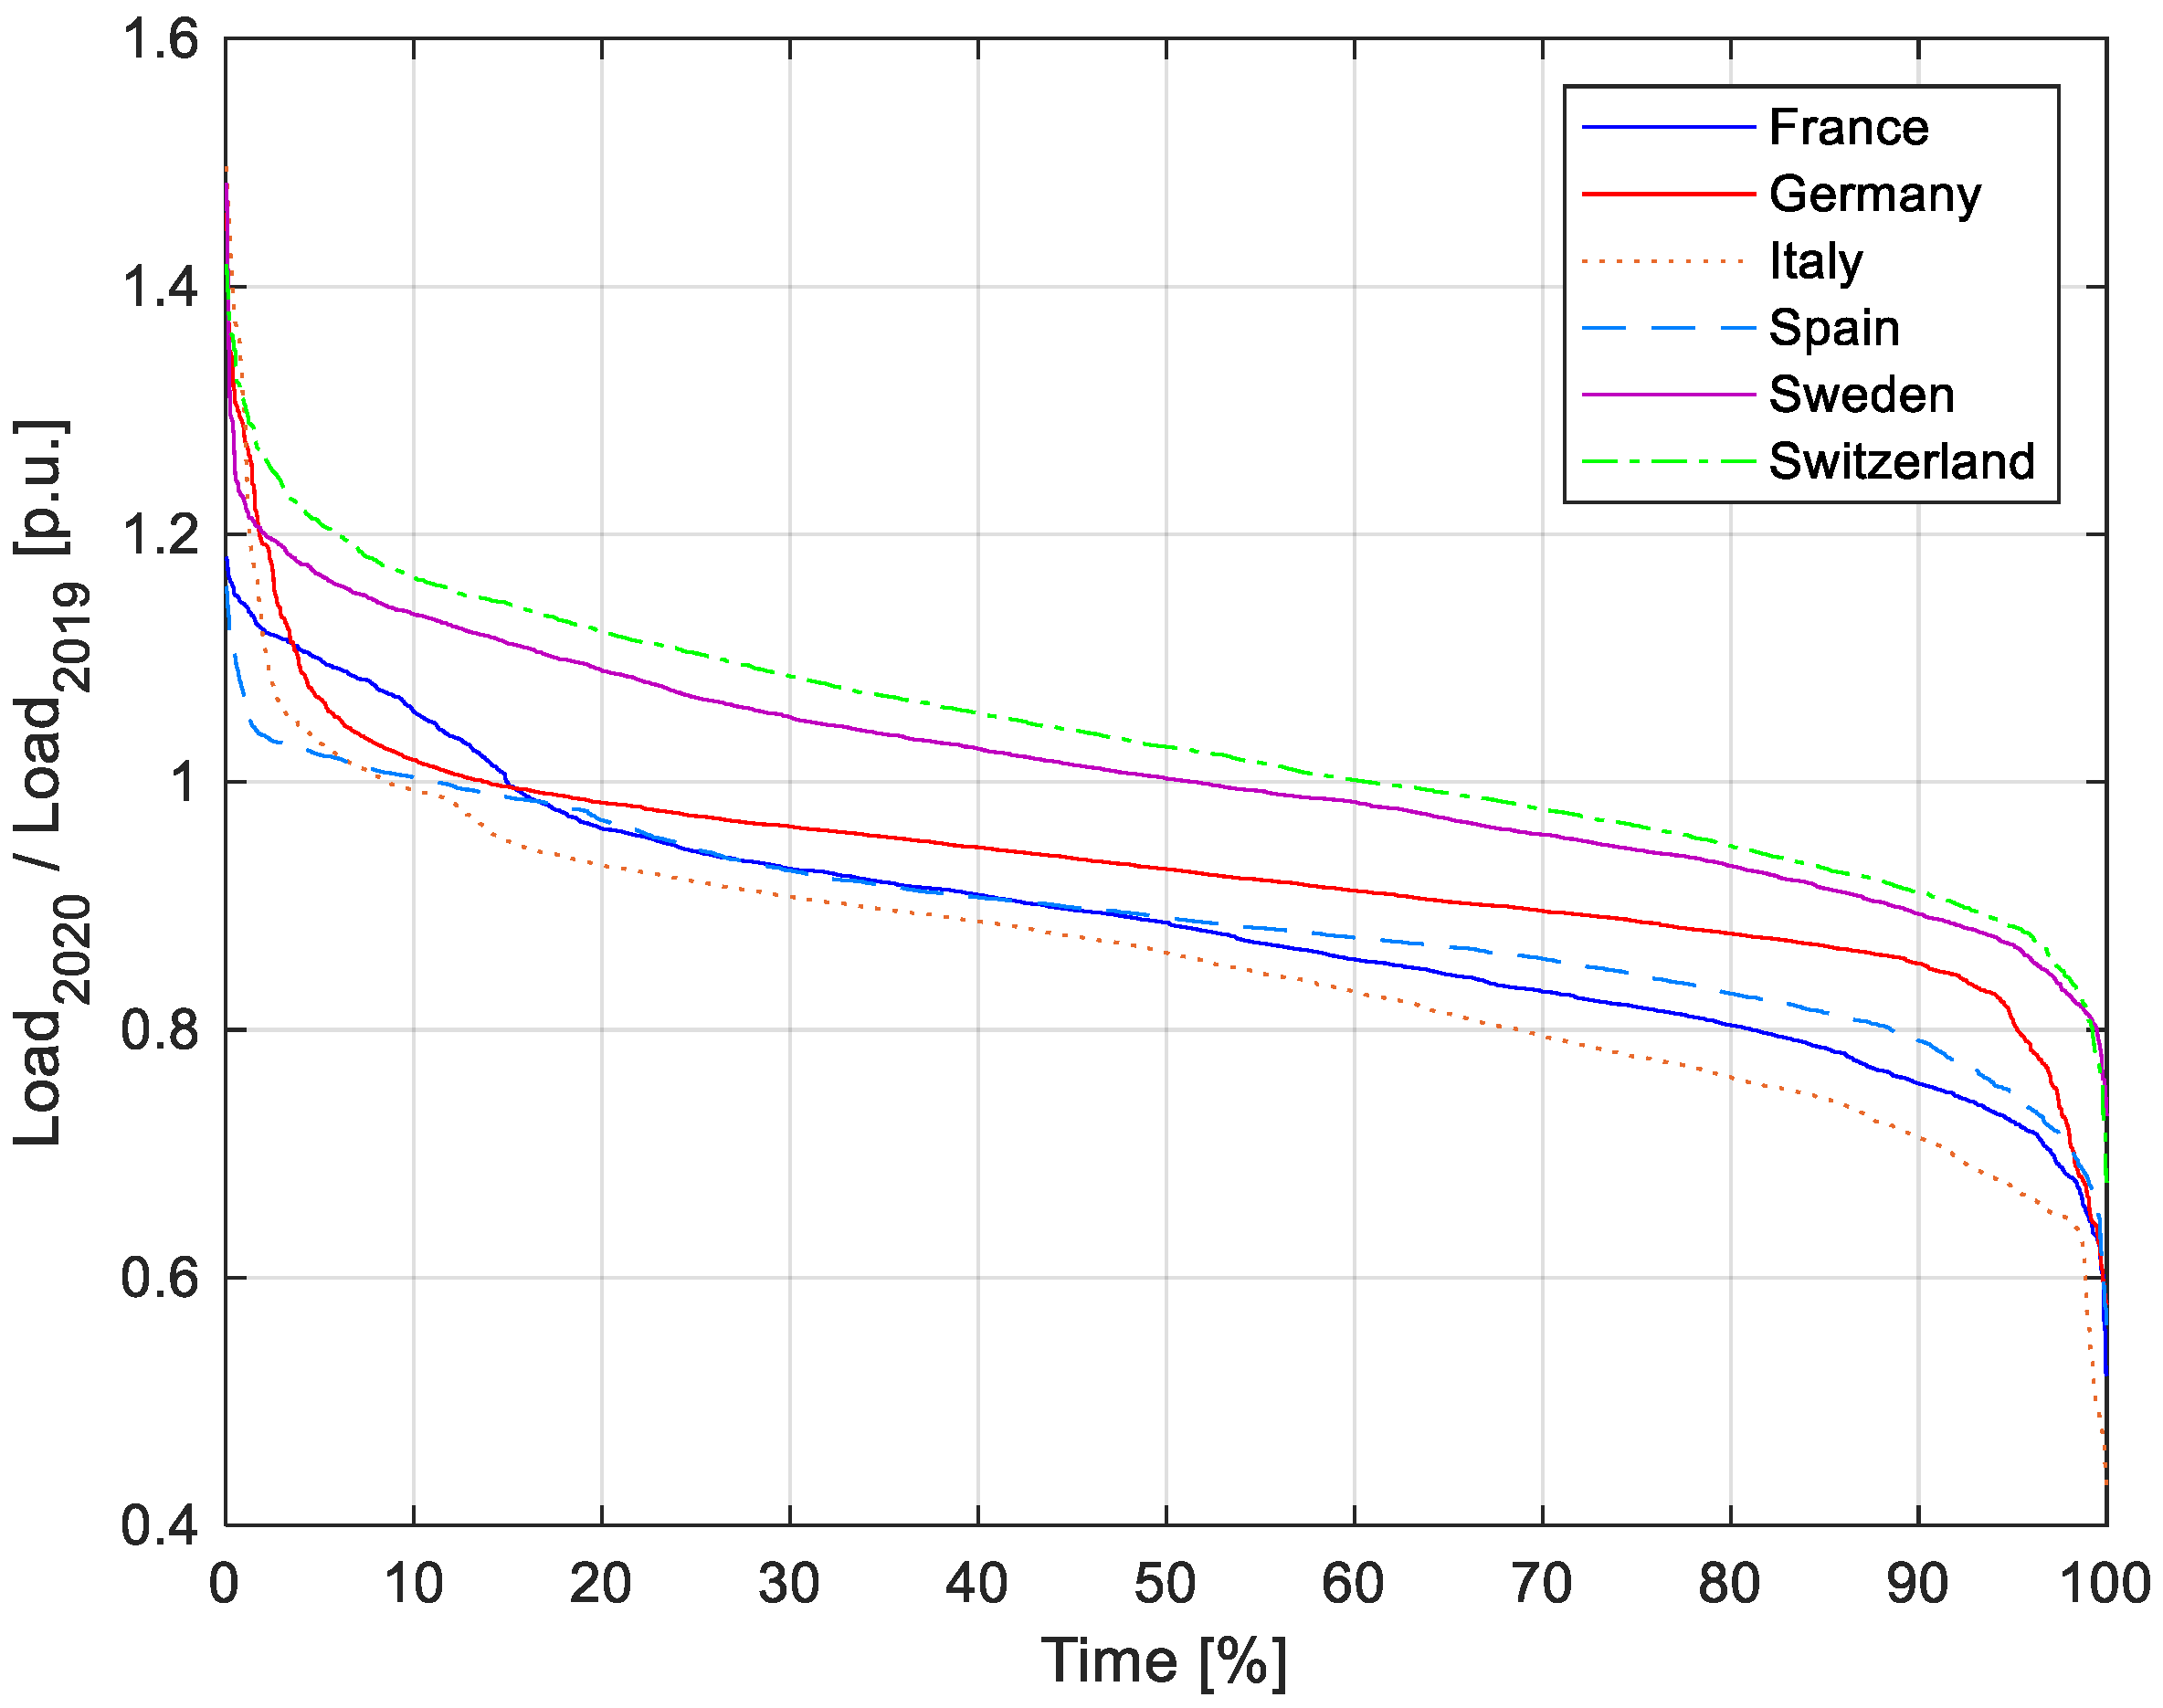
3.1. Power Profiles and Demand under Pandemic

The electricity demand for the month of April 2020 (as the month affected by the much stricter lockdown) is compared with the same period of 2019 for the European countries with available public data (Table A1 in Appendix A). In April 2020, the consumption for EU countries was 181 TWh, compared to 207 TWh in April 2019; therefore, the power consumption in the EU dropped of around 26 TWh, around −12.6%. Italy was the first country hit first and hard by the lockdown measures and started to constrain movements already at the end of February in the Northern areas. In April, the demand started to fall significantly and demand reduced by −20.9% compared to April 2019, as measures became stricter with the extended industrial stop. The other largest demand reduction happened in France (−18.9%), Spain (−16.9%), UK (−15.2%), Belgium (−13.3%), The Netherlands (−12.0%) among the countries with monthly energy demand higher than 5 TWh. On the other side, a light reduction or even an increase in the demand was noticed in countries which did not imposed very strict lockdowns and where the industrial production was kept on. This is the case of the Nordic countries, Norway (+5.3%), Sweden (−0.3%), Finland (−0.9%), and Switzerland (+0.3). These results look in line with the demand reduction that occurred in other countries, such as USA and Canada, in the same time period, where the lockdown measures were in general less stringent and the demand variation ranged from around −4% to −10% [8,9]. In Figure 3 the calendar-adjusted load profile for a selected number of countries is depicted, starting from the first Monday of March to the last Sunday of May of 2020, and comparing it with the analogous days of 2019. The dashed lines in Figure 3 indicate the interpolation curve to highlight the demand trend.
The temperature effect on the load variation is analysed for the countries characterized by the larger demand reduction. For Italy, the temperature corrected demand reduction in April 2020 moves from −20.9% to −21.2%, for Spain from 16.9% to −16.2% and for Germany from −8.3% to −8.0%, while for France changes from to −18.9% to −11.6%, due to the higher temperature variation (+2.5°C average in 2020 compared to 2019).
Figure 4 shows the ratio between the 2020 and 2019 electrical demands in the period from the first Monday of March to the last Sunday of May for a selected number of countries, plotted as a duration curve. The curves represent the time-percentage in which the ratio D 2020 / D 2019 was equal or higher than the corresponding value on the y-axis. Italy was the country where the demand reduction was higher (the minimum value of the ratio is equal to 0.43 p.u.) and longer in time (for around 90% of time, the ratio is lower than 1). Vice-versa, Sweden and Switzerland had a ratio greater than 1 for more than 50% of the time due to the mild measures adopted to avoid the widespread of the virus.
The metrics used for the evaluation of the ADLP are reported in Table A2 in Appendix A, comparing working days and holidays in the month of April 2019 vs 2020. For the EU countries most affected by the lockdown, the ADLP has been very different from usual. The gap between the morning and evening peak lifted in 2020 compared to 2019. The working days of 2020 are very similar to the weekends of 2019. The working day ADLPmax shifted in time, from morning to evening for Italy, The Netherlands, Slovenia, Luxembourg, the UK, and to lunch time for France, Austria, Belgium, Bosnia, the Czech Republic, Slovakia, Lithuania, and Greece. For all the other countries, the peak time did not change. The working day ADLPmax diminished for almost all the countries, with reductions higher than 15% for Luxembourg (−24%), Italy (−18%), France (−17%), Spain (−15%), Belgium (−15%) and Bosnia (−15%). This trend makes the working day ADLP quite similar to the holiday ADLP of April 2019, both in terms of timing, values and ramps. In the case of strict lockdown, the morning and evening ramps (MR, ER) are less steep on working days in 2020, compared with the holidays in 2019 (MR −45% for Italy and −48% for France in WD). The reason is probably that loads had been distributed over longer periods due to the smart working practices. During holidays in 2020, ADLP presents lower slopes as regards 2019. In the context of high production from photovoltaic, the evening ramps are noteworthy, as they are accentuated by the simultaneous increase in residential load. Nevertheless, some countries saw noticeable reduction in power values but not in ramps, as Germany (−7% in ADLPmax, −5% in MR), so they have similar shapes but reduced values. For countries without strict lockdown, the ADLPmax lightly increased from April 2019 to 2020, as in the case of Switzerland (+2%), Montenegro (+3%) and Norway (+1%).
In summary, the behavior of the ADLP in the case of strict lockdown exhibited working days in 2020 very similar to holidays in 2019, and holidays in 2020 with lower values and ramps compared to holidays in 2019.
Figure 5 represents the ADLP for a selected number of countries. It is noticeable the drastic changes in the ADLP for Italy, Spain and France, in terms of timing, peak values and ramps. The changes are less evident for Germany, Sweden and Switzerland, which kept the same ADLP shape and in the latter case with similar values.

3.2. Operational Issues

The issues raised in the power system operation are analyzed using the metrics described in Section 2.2 for the months of April 2019 and 2020. The calculated values are reported in Table A3 in Appendix A. Conventional generation decreased in all countries, except Bosnia, North Macedonia, Norway, and Finland. The greatest fall was in Germany (−28.7%), followed by the UK (−25.4%), Italy (−18.3%), Belgium (−16.4%), France (−15.0%), Poland (−14.1%), and Spain (−10.7%) considering the countries with demand higher than 5 TWh. Among such countries, only Norway (+24.8%) and Finland (+1.3%) saw an increase of conventional generation. This translated into a high share of non-conventional generation, except for Spain (−11.1%) and UK (−0.8%). Figure 6 compares the coverage of national electricity demand by source for the month of April 2019 and 2020 for Italy and Spain. In Italy, the fossil generation decreased from 10 TWh to 8 TWh (43% of the total share in April 2020) while in Spain from 13 TWh to 12 TWh (24% of the total share in April 2020).
The blue dashed lines in Figure 6 represent the hour with the highest value for σ   (respectively for Italy 47% and for Spain 54% for April 2019, 51% and 63% for April 2020). The hour with the highest penetration of RES (respectively for Italy 73% and for Spain 65% for April 2019, 89% and 97% for April 2020) is marked in red. The difference between σ and the RES penetration lies in the presence of the conventional generation, basically hydro. In terms of security, the instantaneous penetration of non-conventional generation σ is preeminent, as it indicates the share of non-predictable and non-programmable sources.
A preliminary assessment of the possible effects on security following the spread of the COVID-19 pandemic is carried out with reference to the non-conventional penetration index σ. The σ index is calculated hourly for the months of March and April in 2019 and 2020 and its duration curve is reported in Figure 7. While in the March 2019 and 2020 comparison there is no noticeable difference in the maximum values for all the selected countries (expect for Switzerland), an increase in the non-conventional penetration index is visible in April 2020 compared to the same month of the last year. The increase is not as dramatic as one would have expected from the situation post pandemic. For Italy the maximum value grows from 0.47 to 0.52 in April, while for France from 0.26 to 0.30, for Germany from 0.71 to 0.75, for Spain from 0.54 to 0.63. However, all countries had higher values in April 2020 compared to 2019 for more than 60% of the month, except Spain.
The analyses of the power system operational issues in the months immediately after the COVID-19 crisis have been helping the policy decision makers to identify and implement good practices to address pandemic risks in the energy sector [27].

3.3. Electricity Market

Lockdown measures adopted in most European countries to fight back the COVID-19 pandemic took a significant toll on European power markets. Historical time series of day-ahead spot prices are analyzed for the first half of the year (from January 1st to June 30th) from year 2015 until 2020, to compare the 2020 expected price drop to comparable prices in the previous years. The analyzed time series start in 2015 as this year marks the launch of the EUPhemia combined market clearing at the European level and also the entry into force the legislative basis for European cross-border electricity day-ahead market exchanges (the Regulation on Capacity Allocation and Congestion Management).
The metrics described in Section 2.3 to evaluate the immediate impact of the COVID-19 pandemic on the electricity markets are applied on the pan-European day-ahead market (DAM). Data have been gathered thanks to the European Power Exchanges, provided directly or through Platts® database to the European Commission—Joint Research Centre. Data for the forecasted day-ahead load per bidding zone have been collected through the ENTSO-E Transparency Platform when available, and in the few cases when the data were not available actual load per hour has been used instead.
First, the effect of the pandemic on wholesale European prices (€/MWh) trend is single out for the last five years before the 2020 using the load-weighted weekly moving average ( D A M p h ) ¯ . Figure 8 shows that since mid-March the prices for 2020 decreased more than the previous years, even compared to the 2016 characterized by lower oil price [28]. This finds a quite exact concurrence with the time (mid-March) when widespread lock-down measures have been adopted almost everywhere throughout Europe. Prices in the pan-European DAM started to recover their pace only since the beginning of June 2020, with the almost total release of lock-down measures.
The stark contrast of price dynamics in 2020 w.r.t previous years is even clearer looking at the box plots in Figure 9, which depicts the cumulated observations during each year. On each box, the central mark indicates the median, and the bottom and top edges of the box indicate the 25th and 75th percentiles, respectively. The whiskers extend to the most extreme data points not considered outliers, and the outliers are plotted individually.
From Figure 9, it is possible to infer how deeply the pandemic has hit electricity markets in Europe: prices have plummeted in the first six months of 2020 w.r.t previous years, pointing to the fact that the sharp decrease in demand has been directly translated into lower market prices in the DAM. In comparison, another high impact event on energy investments/supply chains such as the 2008–2009 socio-economic crisis (triggered by the subprime mortagage issuance) did not cause a clear impact on day-ahead electricity prices [29].
In general, there have been big reductions in the DAM prices for all analyzed countries and for the considered months in 2020 compared to the same months in 2019. In detail the average reduction in prices in March 2020 for all analyzed countries has been –44% compared to the same month in 2019. In April 2020, the average prices have reduced even further by –60% compared to April 2019 and by –57% in May 2020 compared to May 2019. The largest reductions in DAM prices can be seen in the Nordic countries (Sweden and Norway) with Norwegian prices in April 2020 reduced by –89% compared to April 2019.
For a more complete analysis of the impact of COVID-19 on the electricity markets, the values of the metrics described in Section 2.3 are reported in Table A4 in Appendix A.
Finally, time series decomposition of zonal time series of prices has been used to zoom in on a few selected countries as shown in Figure 10. Decomposition charts are provided for each of the few selected countries: Italy, France, Germany, Spain, Switzerland, and Sweden. For the sake of brevity, only the bidding zone n.1 is reported for Sweden.
The analysis of Figure 10 clearly shows the trend of electricity spot prices over the first weeks of 2020 for the selected countries, separating each time series into its trend component (T), its seasonal (set as weekly and marked as S) component and a “random” part (R). Starting from the end of February, when the pandemic struck throughout Europe, the day-ahead price has decreased in many of the analyzed countries. The minimum value of the respective trends for many of the represented countries occurred around mid-April. Switzerland, for which data are available only for the first 13 weeks of 2020, shows already an all-time low in week 13 since the start of year 2020. The trend decomposition per country underlines that the impact on the electricity market was similar whether a country adopted a strict lockdown or not.

4. Conclusions

The COVID-19 spread and the consequent socio-economic and health prevention and protection measures have impacted all the energy and electrical systems. The most immediate effects regarded the power consumption levels, the generation mix structure and the electricity market price. The European countries adopted different mitigation and protection strategies: a first group implemented more stringent containment measures (e.g., Italy, France, Germany) whereas others followed lighter approaches (e.g., Sweden and Switzerland). In the former group, due to the modification of social habits and the closure of factories, electrical energy consumption decreased by about 15% compared to the previous years and changes in the load profile could be observed. In the latter group, no significant changes in the consumption occurred.
In general, the risks for the system are greater in the case of demand increase, a situation in which there may be a lack of redundancy in the generation and greater stress on the infrastructure. From the point of view of system operation, the decrease of the electricity demand resulted in a reduction of the conventional dispatched power for countries where a severe lockdown was imposed. This led to an increment of RES generation over the total one. An increase of the non-conventional generation amplifies the operational challenges and the need for regulation capabilities in terms of keeping frequency stability and procuring resources for the voltage regulation. The impact on the electrical market is twofold: on one side, the load reduction eliminated the need for the most expensive conventional power to balance the demand in the day-ahead market, resulting into lower electricity market prices. On the other side, the transmission system operators had to promptly dispatch conventional units, whose services are acquired from the ancillary service market, leading to an increase of the cost for ancillary services.
The long-term effects of the COVID-19 crisis not only depend on the persistence of the pandemic but also of the associated economic recession. When compared with the 2008 subprime-induced economic crisis, while both events severely affected the power sector investments—due to financial difficulties and weak demand—the consequences on the generation mix operations and the market functioning showed peculiar differences. As a matter of fact, the power generation mix after 2008 recorded a shift from low-carbon to (at that time, less capital-intensive) conventional technologies, contrarily to what happened in the 2020 power generation structure, where renewables supplied a larger share of electricity demand. Electricity markets also reacted differently, with the most evident consequences (i.e., lower day-ahead prices) noted during the COVID-19 crisis. Even if low-carbon investment prices dramatically decreased over the last decade, currently shrinking electricity prices and emission allowance prices could result in a weaker business case also for renewable energy solutions.
The analyses of the power system performance during the COVID-19 crisis are helping policy decision makers to identify good practices for risk-preparedness in the power sector. Furthermore, the assessment of the system and market dynamics (beginning from the lower day-ahead prices and the higher shares of renewable electricity generation) can aid policy makers and regulators to devise the appropriate market schemes to govern energy systems pervasively penetrated by low-carbon technologies. Future work will concentrate on the impact on the ancillary services markets and the techno-economic and policy implications on energy security, following the current evolution of the pandemic and the related containment measures.
In conclusion, with Europe willing to bring carbon emissions down to net-zero within 2050, power from renewables cannot but steadily grow. Consequently, recurring analyses on the shorter- and longer term effects of high impact events such as a pandemic, socio-economic crisis, extreme climate events or cyber-attacks will remain essential to support decision makers in designing the resilient, climate-neutral power system of the future.

Author Contributions

Conceptualization, E.B., C.M.; methodology, C.M., P.C and S.V.; software, C.M., P.C. and S.V.; validation, E.B., M.M. and G.F.; formal analysis, C.M., G.A. and M.P.-B.; investigation, M.P.-B.; resources, C.M and M.P.-B.; data curation, C.M., P.C. and S.V.; writing—original draft preparation, C.M., G.A. and S.V.; writing—review and editing, E.B., M.M. and G.F.; supervision, E.B. All authors have read and agreed to the published version of the manuscript.

Funding

This research received no external funding.

Conflicts of Interest

The authors declare no conflict of interest.

Appendix A

Table A1. Energy consumption, energy demand variation ( D v a r ) , maximum ( P m a x ) , minimum ( P m i n ) and average ( P a v e ) power demanded, and the load factor ( ζ ) for some European countries, April 2019–2020 (in blue the EU countries).
Country D 2019
[TWh]
D 2020
[TWh]
D v a r
[%]
P m a x
[GW]
P m i n
[GW]
P a v e
[GW]
ζ
[pu]
‘19‘20‘19‘20‘19‘20‘19‘20
Italy22.0417.44−20.9%42.932.817.615.330.624.20.710.74
France37.6730.56−18.9%69.257.435.731.152.342.40.760.74
Spain19.5716.27−16.9%34.628.518.816.627.222.60.790.79
Germany39.2636.00−8.3%69.966.833.333.554.550.00.780.75
Sweden10.9410.91−0.3%20.619.911.111.815.215.10.740.76
Ireland2.402.16−9.9%4.43.92.32.23.33.00.760.77
Switzerland4.604.62+0.3%8.28.94.74.86.46.40.780.72
Portugal3.983.51−12.0%7.36.83.53.25.54.90.760.71
Austria4.884.36−10.7%8.57.84.54.26.86.10.790.78
Belgium6.815.90−13.3%11.810.16.96.19.58.20.800.82
Bosnia1.000.85−14.9%1.83.20.80.81.41.20.750.37
Croatia1.371.19−13.3%2.52.31.21.11.91.70.770.71
Czech Republic5.334.73−11.3%9.38.75.14.77.46.60.790.75
Denmark2.592.64+1.9%4.84.82.52.73.63.70.750.77
Hungary3.423.07−10.3%5.85.43.23.04.74.30.820.78
Luxemburg0.310.26−17.4%0.80.50.10.20.40.40.560.70
North Macedonia0.520.48−6.4%1.01.20.30.10.70.70.720.57
Montenegro0.240.25+4.6%0.40.50.20.20.30.40.770.71
The Netherlands8.977.89−12.0%15.814.19.17.712.511.00.790.78
Norway10.4410.99+5.3%19.518.910.712.614.515.30.750.81
Poland13.4112.09−9.8%23.220.911.410.818.616.80.800.80
Serbia3.072.97−3.3%5.45.62.62.64.34.10.790.74
Slovakia2.312.03−12.0%3.93.52.32.03.22.80.830.80
Slovenia1.060.88−16.7%2.31.70.90.81.51.20.630.72
Bulgaria2.962.77−6.2%5.25.61.82.44.13.90.790.69
Cyprus0.210.16−23.6%0.60.50.30.20.40.30.630.57
Estonia0.650.64−1.8%1.21.10.60.70.90.90.740.78
Finland6.656.59−0.9%11.010.67.57.79.29.10.840.86
Greece3.883.40−12.5%7.16.93.33.05.44.70.760.69
Latvia0.580.55−4.2%1.11.00.50.50.80.80.730.75
Lithuania0.970.88−9.7%1.71.60.90.91.31.20.780.75
Romania4.794.09−14.6%8.17.54.54.16.75.70.820.76
UK24.9321.14−15.2%47.641.81.915.134.629.40.730.70
Table A2. Load profile analysis for some European countries, April 2019–2020 (in blue the EU countries).
Country Peak TimeADLPmaxΔPeaksADLPaveMRER
201920202019202020192020201920202019202020192020
ItalyWD92038.4831.650.622.4332.4425.782.621.451.210.85
HD202031.2527.222.664.9925.9720.591.180.641.171.51
FranceWD91259.9149.864.732.7953.7743.902.921.520.590.94
HD231253.7844.150.420.3048.8739.041.181.361.431.24
SpainWD121332.0127.260.210.2128.1823.251.240.960.991.24
HD212128.3025.201.090.4624.6021.041.060.911.001.08
GermanyWD111166.1861.865.136.0157.4752.682.422.300.170.21
HD111152.8350.222.242.5347.0243.751.561.610.661.14
SwedenWD8817.7617.061.591.0015.6915.490.580.490.080.08
HD202015.0215.300.220.4014.0514.360.220.200.280.18
IrelandWD18183.933.650.010.103.423.070.110.090.010.10
HD12183.533.450.030.103.122.880.130.080.070.10
SwitzerlandWD12127.327.490.490.766.536.540.140.22−0.22−0.22
HD15136.726.850.140.456.016.120.160.09−0.23−0.24
PortugalWD20206.726.050.220.345.765.060.290.210.290.23
HD20205.795.410.290.274.944.410.230.310.270.31
AustriaWD8118.157.180.380.247.16.380.550.250.110.18
HD11206.615.920.20.175.925.280.20.150.10.17
BelgiumWD91110.89.190.530.119.758.450.470.260.080.27
HD11209.448.280.230.118.737.610.230.170.10.18
BosniaWD20141.591.350.030.031.381.180.050.040.060.05
HD20121.681.390.090.041.41.190.080.050.060.07
CroatiaWD20202.362.080.140.11.951.710.10.080.120.13
HD20202.161.860.090.081.791.520.080.080.130.13
Czech RepublicWD9128.557.810.420.617.76.880.370.230.10.13
HD11117.546.670.430.276.655.840.170.160.10.17
DenmarkWD10104.364.380.190.123.723.790.190.18−0.1−0.1
HD18183.723.930.040.093.273.360.060.070.040.09
HungaryWD20205.475.030.220.354.894.420.330.250.110.15
HD20204.964.580.20.514.393.870.140.10.150.2
LuxembourgWD12200.550.420.020.020.460.370.040.010.020.01
HD1200.530.380.040.030.380.330.020.010.030.02
North MacedoniaWD22220.870.820.0400.730.690.030.030.020.03
HD20200.820.750.070.010.670.620.030.030.050.04
MontenegroWD20200.40.410.030.020.340.360.020.020.020.02
HD20200.40.40.020.020.330.340.020.020.020.02
The NetherlandsWD82014.312.80.160.412.911.40.760.490.050.22
HD212112.811.80.851.4511.3100.130.60.210.36
NorwayWD8816.516.61.460.9114.815.40.50.440.070.07
HD101114.515.70.230.1713.8150.220.180.140.05
PolandWD202021.919.90.280.1919.517.70.680.670.780.54
HD202018.416.80.270.9316.614.80.610.50.550.63
SerbiaWD20205.064.920.330.354.324.190.240.210.230.24
HD20204.884.690.330.314.143.950.190.220.260.24
SlovakiaWD9113.633.260.030.053.312.930.150.10.060.08
HD11113.342.930.120.062.972.580.090.080.080.1
SloveniaWD8201.751.5100.071.541.290.120.080.050.08
HD20201.491.30.030.151.31.070.040.030.060.08
BulgariaWD20204.854.480.150.064.183.920.280.220.20.16
HD20204.534.290.220.153.913.70.180.160.160.16
CyprusWD20200.550.480.110.130.410.340.020.010.040.04
HD20200.50.460.120.140.370.310.010.010.040.05
EstoniaWD991.11.050.10.080.940.920.060.050.010.01
HD21210.910.930.030.060.810.830.030.020.020.02
FinlandWD89109.720.470.219.429.260.30.210.050.04
HD22229.349.380.390.378.828.880.080.040.090.07
GreeceWD21126.465.760.270.025.484.790.250.270.240.3
HD21126.225.570.240.095.214.570.220.250.260.25
LatviaWD91010.950.110.110.830.80.070.050.010.01
HD10210.830.800.030.730.70.030.020.020.01
LithuaniaWD9111.621.470.140.131.391.260.10.060.020.02
HD10211.381.270.010.021.241.120.050.040.020.02
RomaniaWD20217.746.680.230.356.845.820.30.230.250.2
HD21217.066.260.570.716.195.350.130.130.210.22
UKWD111841.436.10.950.2335.630.12.191.040.741.36
HD121836.834.40.152.932.327.71.511.320.641.86
Table A3. Generation mix across Europe, April 2019–2020 (in blue the EU countries).
CountryRES [TWh]Fossil [TWh]Conv [TWh]Non-Conv [TWh]% RES% Fossilσ
20192020201920202019202020192020201920202019202020192020
Italy7.288.0310.217.4916.5713.533.213.4833%46%46%43%16%20%
France8.289.032.180.6338.6732.863.343.5422%30%6%2%8%10%
Spain8.148.685.843.8312.9511.575.705.0742%53%30%24%31%30%
Germany20.0821.0216.369.3228.1620.0814.2015.1651%58%42%26%34%43%
Sweden6.758.830.000.0011.5410.821.272.4462%81%0%0%10%18%
Ireland0.840.241.010.641.090.670.760.2235%11%42%30%41%25%
Switzerland1.341.300.000.003.593.140.050.1829%28%0%0%1%5%
Portugal2.342.621.490.572.602.221.270.9959%75%37%16%33%31%
Austria4.693.750.610.394.323.530.990.6396%86%12%9%19%15%
Belgium1.241.631.611.185.974.990.911.1518%28%24%20%13%19%
Bosnia0.460.220.510.840.961.050.010.0146%26%52%99%1%1%
CroatiaN/AN/AN/AN/AN/AN/AN/AN/AN/AN/AN/AN/AN/AN/A
Czech Republic1.021.043.232.435.894.740.540.5619%22%61%51%8%10%
Denmark1.551.710.540.420.960.771.141.3760%65%21%16%54%64%
Hungary0.190.380.720.612.242.160.080.256%12%21%20%3%10%
LuxemburgN/AN/AN/AN/AN/AN/AN/AN/AN/AN/AN/AN/AN/AN/A
North Macedonia0.050.080.170.190.220.270.000.0110%16%34%40%2%2%
Montenegro0.100.060.000.010.080.050.020.0340%24%0%6%17%36%
The Netherlands0.330.384.223.506.926.200.330.384%5%47%44%5%6%
Norway9.6412.290.260.269.5511.920.350.6592%112%2%2%4%5%
Poland1.581.709.968.5510.358.891.201.3612%14%74%71%10%13%
Serbia0.900.681.901.862.812.550.000.0029%23%62%63%0%0%
Slovakia0.570.460.350.332.021.970.100.1125%23%15%16%5%5%
Slovenia0.420.360.280.221.181.040.020.0340%41%27%25%2%3%
Bulgaria0.500.741.571.293.382.760.200.2717%27%53%47%6%9%
Cyprus0.020.010.290.160.290.160.020.016%8%101%100%6%7%
Estonia0.110.140.450.110.520.170.040.0916%22%69%17%8%34%
Finland2.002.350.970.864.524.580.480.6130%36%15%13%10%12%
Greece0.700.941.971.491.971.490.700.9418%28%51%44%26%39%
Latvia0.350.270.090.060.490.360.010.0161%48%15%10%2%3%
Lithuania0.240.270.030.040.160.180.130.1525%31%3%5%44%45%
Romania2.171.961.621.024.023.200.750.8045%48%34%25%16%20%
UK6.656.9010.056.3516.1412.035.125.0827%33%40%30%24%30%
Table A4. Total revenues, average and minimum prices, volumes, number of hours with negative prices and variations in the day-ahead market. Data corresponding to Sweden, Norway, Denmark, and Italy are presented disaggregated in their bidding zones. For the current EU Bidding Zone configuration, please refer to [30].
Market ZoneTotal Revenues [M€]Average Price [€/MWh]Total Volumes [TWh]Minimum Price [€/MWh]Number of Hours with Negative PricesRate of Change in DA PricesRate of Change in Total RevenuesRate of Change in Volumes
2019202020192020201920202019202020192020
SE198.620.337.97.92.62.50.120.8600−79.2%−79.4%−0.8%
SE2158.832.837.97.94.14.10.120.8600−79.2%−79.3%−0.5%
SE3848.2271.937.911.921.921.80.120.8600−68.7%−67.9%−0.4%
SE4238.293.738.514.66.16.10.120.8600−62.1%−60.7%1.3%
FI856.7415.640.419.920.920.4−19.90.900−50.8%−51.5%−2.5%
DK1186.687.536.716.35.05.2−19.9−55.85962−55.5%−53.1%3.7%
DK2125.661.737.918.83.23.215.12−42.74855−50.3%−50.9%−2.1%
NO1348.561.141.06.78.48.815.120.6900−83.7%−82.5%4.7%
NO2357.558.540.96.68.78.615.120.6900−83.8%−83.6%−0.8%
NO3287.652.740.77.07.07.415.120.6900−82.8%−81.7%4.9%
NO4215.240.940.47.55.35.415.120.8600−81.5%−81.0%1.7%
NO5178.729.440.67.24.44.115.120.8600−82.4%−83.5%−7.4%
EE93.654.541.524.32.22.10.120.9400−41.6%−41.8%−2.9%
LV79.344.642.624.01.81.70.120.9400−43.6%−43.8%−3.5%
LT130.472.542.523.93.02.80.120.9400−43.7%−44.4%−4.2%
AT571.9303.136.220.215.414.2−59.78−77.74273−44.4%−47.0%−7.8%
BE822.2362.337.818.121.319.3−31.62−1152086−52.2%−55.9%−9.6%
DE-LU4273.42352.935.119.1118.9117.9−83.01−83.973117−45.7%−44.9%−0.9%
FR4278.21913.336.417.4115.3102.0−12.27−75.81666−52.1%−55.3%−11.5%
NL964.0502.640.520.523.423.50.1−79.2061−49.4%−47.9%0.5%
ITCN411.4170.652.426.37.66.26.27000−49.7%−58.5%−19.5%
ITCS560.1262.251.527.010.79.30000−47.5%−53.2%−12.6%
ITNorth2138.3888.752.225.739.732.66.27000−50.8%−58.4%−18.0%
ITSardinia105.251.150.926.22.01.90000−48.4%−51.4%−8.4%
ITSicilia257.7110.459.627.64.23.80000−53.8%−57.2%−7.6%
ITSouth296.5148.848.826.76.05.40000−45.3%−49.8%−9.7%
ES2999.61236.249.222.360.353.73.521.0200−54.7%−58.8%−10.9%
PT610.5262.249.522.412.211.451.0200−54.8%−57.0%−6.8%
IE393.7237.949.228.68.07.9−7−41.12497−41.8%−39.6%−1.0%
CH588.4318.437.520.115.515.4−22.72−59.61063−46.4%−45.9%−0.6%
SI142.676.242.124.83.32.9−20.23−23.52316−41.1%−46.6%−11.1%
SK272.7145.836.821.17.36.6−25−652983−42.8%−46.5%−9.0%
RS410.8255.042.226.39.59.47.430.9300−37.7%−37.9%−2.0%
PL2233.5492.951.636.342.439.4011.3900−29.7%−77.9%−7.3%
RO628.0376.941.527.214.713.30000−44.6%−40.0%−9.2%
GB3520.51964.749.029.668.862.70−44.2051−28.5%−44.2%−8.8%
CZ608.4332.736.320.916.415.1−25−652986−42.3%−45.3%−7.9%
HR185.2102.442.225.34.23.9−20.23−23.52316−40.1%−44.7%−9.2%
BG367.7228.539.425.59.08.60000−35.3%−37.9%−4.9%
GR756.2408.262.735.511.911.10000−43.3%−46.0%−6.7%
HU468.2263.442.726.210.79.60.02−8.1204−38.6%−43.7%−9.7%

References

  1. World Health Organization. Timeline of WHO’s Response to COVID-19. Available online: https://www.who.int/news/item/29-06-2020-covidtimeline (accessed on 30 June 2020).
  2. Mofijur, M.; Fattah, I.R.; Alam, M.A.; Islam, A.S.; Ong, H.C.; Rahman, S.A.; Najafi, G.; Ahmed, S.; Uddin, M.A.; Mahlia, T. Impact of COVID-19 on the social, economic, environmental and energy domains: Lessons learnt from a global pandemic. Sustain. Prod. Consum. 2020, 26, 343–359. [Google Scholar] [CrossRef] [PubMed]
  3. Zhong, H.; Tan, Z.; He, Y.; Xie, L.; Kang, C. Implications of COVID-19 for the electricity industry: A comprehensive review. CSEE J. Power Energy Syst. 2020, 6, 489–495. [Google Scholar]
  4. Lu, Y.; Zhou, R.; Wang, J. Analysis of power generation and load change under the influence of lockdown based on COVID-19 epidemic. In Proceedings of the 2020 AEIT International Annual Conference, Catania, Italy, 23–25 September 2020. [Google Scholar] [CrossRef]
  5. Alhajeri, H.M.; Almutairi, A.; Alenezi, A.; Alshammari, F. Energy demand in the state of Kuwait during the covid-19 pandemic: Technical, economic, and environmental perspectives. Energies 2020, 13, 4370. [Google Scholar] [CrossRef]
  6. IEA. World Energy Outlook 2009 Edition; IEA: Paris, France, 2009. [Google Scholar]
  7. IEA. Global Energy Review. Available online: https://www.iea.org/reports/global-energy-review-2020 (accessed on 10 May 2020).
  8. Ruan, G.; Wu, D.; Zheng, X.; Zhong, H.; Kang, C.; Dahleh, M.A.; Sivaranjani, S.; Xie, L. A cross-domain approach to analyzing the short-run impact of COVID-19 on the US electricity sector. Joule 2020, 4, 2322–2337. [Google Scholar] [CrossRef] [PubMed]
  9. Leach, A.; Rivers, N.; Shaffer, B. Canadian electricity markets during the COVID-19 pandemic: An initial assessment. Canadian Public Policy 2020, 46, 145–159. [Google Scholar] [CrossRef]
  10. ENEA. Quarterly Analysis of the Italian Energy System. Available online: https://www.enea.it/it/seguici/pubblicazioni/pdf-sistema-energetico-italiano/01-analisi-trimestrale-2020.pdf. (accessed on 15 May 2020).
  11. Gracceva, F.; Bompard, E.; Baldissara, B.; Corgnati, S.; Mosca, C.; Zini, A. COVID-19 e sistema energetico Italiano: Una prima valutazione. Energia 2020, 2, 26–31. [Google Scholar]
  12. IEEE PES. Sharing Knowledge on Electrical Energy Industry’s First Response to COVID-19. Available online: https://resourcecenter.ieee-pes.org/publications/white-papers/PES_TP_COVID19_050120.html (accessed on 12 May 2020).
  13. Snow, S.; Bean, R.; Glencross, M.; Horrocks, N. Drivers behind residential electricity demand fluctuations due to COVID-19 restrictions. Energies 2020, 13, 5738. [Google Scholar] [CrossRef]
  14. Abu-Rayash, A.; Dincer, I. Analysis of the electricity demand trends amidst the COVID-19 coronavirus pandemic. Energy Res. Soc. Sci. 2020, 68, 101682. [Google Scholar] [CrossRef] [PubMed]
  15. Andrade, J.V.; Salles, R.S.; Silva, M.N.; Bonatto, B.D. Falling consumption and demand for electricity in South Africa-a blessing and a curse. In Proceedings of the 2020 IEEE PES/IAS PowerAfrica, Nairobi, Kenya, 25–28 August 2020. [Google Scholar] [CrossRef]
  16. Carmon, D.; Navon, A.; Machlev, R.; Belikov, J.; Levron, Y. Readiness of small energy markets and electric power grids to global health crises: Lessons from the COVID-19 pandemic. IEEE Access 2020, 8, 127234–127243. [Google Scholar] [CrossRef]
  17. Ghiani, E.; Galici, M.; Mureddu, M.; Pilo, F. Impact on electricity consumption and market pricing of energy and ancillary services during pandemic of COVID-19 in Italy. Energies 2020, 13, 3357. [Google Scholar] [CrossRef]
  18. Mosca, C.; Colella, P.; Bompard, E.; Yan, Z. Techno-economic impacts of COVID-19 pandemic on the italian electricity system. In Proceedings of the 2020 AEIT International Annual Conference, Catania, Italy, 23–25 September 2020. [Google Scholar] [CrossRef]
  19. Werth, A.; Gravino, P.; Prevedello, G. Impact analysis of COVID-19 responses on energy grid dynamics in Europe. Appl. Energy 2020, 281, 116045. [Google Scholar] [CrossRef] [PubMed]
  20. Clair, E. Looking at COVID-19 Crisis from the EU Electricity Wholesale Market; FSR, 2020; European University Institute: Fiesole, Italy, 2020. [Google Scholar]
  21. EPRI. COVID-19 Bulk System Impacts. Available online: https://www.epri.com/research/products/3002018602 (accessed on 13 April 2020).
  22. CIGRE. System Operations Impact of COVID-19: European Perspective. Available online: https://www.cigre.org/article/GB/system-operations-impact-of-covid-19-european-perspective (accessed on 5 June 2020).
  23. Soliman, S.A.H.; Al-Kandari, A.M. Electrical Load Forecasting: Modeling and Model Construction; Elsevier: Oxford, UK, 2010. [Google Scholar]
  24. McWilliams, B.; Zachmann, G. Bruegel Electricity Tracker of COVID-19 Lockdown Effects. Available online: https://www.bruegel.org/2020/03/covid-19-crisiselectricity-demand-as-a-real-time-indicator (accessed on 30 April 2020).
  25. EEA. Copernicus Land Monitoring Service. 2020. Available online: https://land.copernicus.eu/ (accessed on 15 May 2020).
  26. ENTSO-E. ENTSO-E Transparency Platform. Available online: https://transparency.entsoe.eu/dashboard/show (accessed on 15 May 2020).
  27. European Commission. Energy Security: Good Practices to Address Pandemic Risks; Commission Staff Working Document. SWD, 104 Final; European Commission: Brussels, Belgium, 2020. [Google Scholar]
  28. ACER; CEER. Annual Report on the Results of Monitoring the Internal Electricity and Gas Markets in 2016, Electricity Wholesale Markets Volume. Available online: https://www.acer.europa.eu/Official_documents/Publications/ACER%20Market%20Monitoring%20Report%202016%20%20Document%20histo/ACER%20Market%20Monitoring%20Report%202016%20-%20ELECTRICITY%20AND%20GAR%20RETAIL%20MARKETS%20-%20Original.pdf (accessed on 15 June 2020).
  29. Hauser, P.; Anke, C.-P.; López, J.G.; Möst, D.; Scharf, H.; Schönheit, D.; Schreiber, S. The Impact of the COVID-19 Crisis on Energy Prices in Comparison to the 2008 Financial Crisis. In IAEE Energy Forum/Covid-19 Issue 2020; IAEE: New York, NY, USA, 2020. [Google Scholar]
  30. ENTSO-E. Bidding Zone Configuration Technical Report. 2018. Available online: https://eepublicdownloads.entsoe.eu/clean-documents/events/2018/BZ_report/20181015_BZ_TR_FINAL.pdf (accessed on 30 June 2020).
Figure 1. Typical correlation between temperature and energy demand.
Energies 14 00096 g001
Figure 2. Average daily load profile (ADLP) characterization.
Energies 14 00096 g002
Figure 3. Weekly power profile during pandemic for selected countries.
Energies 14 00096 g003aEnergies 14 00096 g003b
Figure 4. Duration curve of the ratio between the 2020 and 2019 power demand for a selected number of countries.
Energies 14 00096 g004
Figure 5. ADLP for the selected countries.
Energies 14 00096 g005aEnergies 14 00096 g005b
Figure 6. Load coverage by source for two selected countries.
Energies 14 00096 g006
Figure 7. Duration curves of non-conventional penetration index for a selected number of countries.
Energies 14 00096 g007
Figure 8. Pan-European load-weighted moving average of all bidding zones.
Energies 14 00096 g008
Figure 9. Load-weighted weekly moving pan-European averages of the DAM prices across the selected years.
Energies 14 00096 g009
Figure 10. Decomposition of additive time series [€/MWh], first 27 weeks of 2020 (T = Trend, S = Seasonal, R = Random).
Energies 14 00096 g010
Publisher’s Note: MDPI stays neutral with regard to jurisdictional claims in published maps and institutional affiliations.

