
Investigation of Survival/Hazard Rate of Natural Ester Treated with Al2O3 Nanoparticle for Power Transformer Liquid Dielectric


Department of Electrical, Computer and Telecommunications Engineering, Faculty of Engineering and Technology, Botswana International University of Science and Technology, Private Bag 16, Palapye Plot 10071, Botswana
*
Author to whom correspondence should be addressed.
Energies 2021, 14(5), 1510; https://doi.org/10.3390/en14051510
Submission received: 10 February 2021
/
Revised: 26 February 2021
/
Accepted: 1 March 2021
/
Published: 9 March 2021
(This article belongs to the Special Issue High Voltage Insulating Materials-Current State and Prospects)
Abstract
:Increasing usage of petroleum-based insulating oils in electrical apparatus has led to increase in pollution and, at the same time, the oils adversely affect the life of electrical apparatus. This increases the demand of Mineral Oil (MO), which is on the verge of extinction and leads to conducting tests on natural esters. This work discusses dielectric endurance of Marula Oil (MRO), a natural ester modified using Conductive Nano Particle (CNP) to replace petroleum-based dielectric oils for power transformer applications. The Al2O3 is a CNP that has a melting point of 2072 °C and a low charge relaxation time that allows time to quench free electrons during electrical discharge. Al2O3 is blended with the MRO and Mineral Oil (MO) in different concentrations. The measured dielectric properties are transformed into mathematical equations using the Lagrange interpolation polynomial functions and compared with the predicted values either using Gaussian or Fourier distribution functions. Addition of Al2O3 indicates that 0.75 g/L in MRO has an 80% survival rate and 20% hazard rate compared to MO which has 50% survival rate and 50% hazard rate. Considering the measured or interpolated values and the predicted values, they are used to identify the MRO and MO’s optimum concentration produces better results. The test result confirms the enhancement of the breakdown voltage up to 64%, kinematic viscosity is lowered by up to 40% at 110 °C, and flash/fire points of MRO after Al2O3 treatment enhanced to 14% and 23%. Hence the endurance of Al2O3 in MRO proves to be effective against electrical, physical and thermal stress.
1. Introduction
The power transformer (PT) is vulnerable and is the most expensive power system network equipment. It provides functions such as stepping up and stepping down the voltage between electrical power generating stations. The PT works at 100% load for 24 h throughout the day whereas the distribution transformer works at 50% or 70% of the full load [1]. Increase in the power demand across the world is persistent and it is expected to be double in the forthcoming years as per the predicted data of International Energy Associations [2]. This demand has caused the rise in PT numbers in the power system network. The report released by allied market research indicates that countries in the Asia-Pacific (APAC) are the biggest market for the future transformer industries [3]. Here, a projected growth of USD 3 million is expected by 2025, which almost strikes a peak of 6.9% Compound Annual Growth Rate (CAGR) from the year 2020 [4]. This growth is brought about by the huge demand for power, rapid urbanization, and PT’s replacement. The report published by the Allied Market Research estimated that the consumption of MO in 2014 was nearly 1437.8 million litres [5]. It further predicted that MO’s sale was to reach 3.4 billion United States dollar by 2020 which represents a 6.3% increase from 2015. Upon extrapolating the data with the same growth rate up to 2030, the consumption of MO will be 2815.56 million litres. MO will dominate the insulating oil market up to the year 2025. Even though there are several alternatives to MO in the market, bio-based insulating fluids have their shortcomings on the dielectric properties [6]. Insulating oil is an integral part of the power utility with applications in power and distribution transformers, power cables, bushings, and circuit breakers. Natural ester proves to be a suitable candidate with higher moisture tolerance than MO [7]. The use of mineral oil in the transformer as a coolant and insulator is well documented [8,9]. MO’s availability is limited since it is extracted from a non-renewable source. Its lack of biodegradability has also led to a debate regarding its usage in recent times [10]. Mineral oil is a fossil fuel (crude oil) made up of hydrocarbons and compounds which are refined through a distillation process by boiling and refining for suitable use in transformers [11]. Numerous oils, like paraffin, naphtha, aromatic, to name a few, are used in various ratios and components [12,13,14]. Silicones are inert synthetic liquids, known as polydimethylsiloxane, are thermally stable with a composition exhibiting electrical properties like mineral oils with a similar structure as the methyl organic group [15,16]. High molecular coolants, either natural or synthetic are classified by National Electric Code (NEC) as less inflammable with a fire-point below 300 °C [5]. Synthetics are generally polymerized olefins popularly known as polyalphaolefins or PAOs. Both silicones and high molecular coolants are comparable in performance with MO. However, they differ in their temperature endurance, viscosity, and pour point [16,17].
Esters are alternatives to the mineral oils and are generally either synthesized chemically from organic precursors or natural oils [18,19,20]. Researchers further added alternative insulating fluids from natural esters, food-grade synthetic (Butylated Hydroxy Toluene (BHT), Butylated Hydroxy Anisole (BHA), Propyl Gallate (P.G.)), natural antioxidants (α, β-Tocopherols (αT, βT)) and synergists (Citric Acid (C.A.), Ascorbic Acid (A.A.), Rosemary extracts (R.A.)) which contribute significantly [21]. Among the several synthetic esters, Pentaerythritol, a polyol, is found to have suitable dielectric properties, good thermal stability, low-temperature tolerance and more biodegradable as compared to mineral oils [22,23]. Natural esters compose of chemically stable fatty acids with high viscosity [24]. The commercialization of vegetable oil as coolant resulted from significant research to find a suitable, fully biodegradable insulating medium. The use of vegetable oil as biodegradable, moisture absorbent, coolant and insulator in transformers started as a research project as early as the 1990s. Vegetable oils are known to be highly biodegradable (>95%), less toxic, high flash and fire points (>300 °C) as compared to mineral oils [24]. Vegetable oils possess very high moisture and viscosity than MO. Vegetable oil is not stable like MO when subjected to temperature stresses.
The process of extracting vegetable oil starts with the process of seeding. The seeds are refined, bleached, and deodorized to form pure vegetable oils. The first step is to refine the oil using alkaline refinement to remove fatty acids, followed by bleaching to eliminate the coloring materials and the deodorization. The volatile and odoriferous materials are removed by using vacuum steam distillation at high temperatures [25]. Vegetable oils such as sunflower, rice bran, rapeseed, palm, coconut, and soybean, have been studied extensively on their dielectric nature for transformer insulation and cooling. Natural oil age monitoring in the transformers should be based on various dielectric properties such as dielectric strength, dissipation factors, acidity, dissipation factor [5,17]. The degradation rate of vegetable oil can be compared to that of mineral oil. The relationship between hottest spot temperature and long-term operations for both mineral oil and vegetable oil-based transformer are determined under medium voltages.
The work discusses statistical approach to understand the performance of the insulating fluid that is normally required when the field testing is complicated. Such analysis is meaningful in performing reliability analysis to determine the time to failure. Moreover, the statistical analysis helps to realize the temperament of insulating fluid under accelerated heating conditions. This approach used in the research is simple and it derives mathematical equations using interpolation function, which helps the power engineer to recognize the actual condition of the insulating oil without the need to test the oil at field conditions. The functions are used to derive the bath-tub curves used in the reliability analysis, but in our case, we focus on the response of oils to nanoparticle and their stability to accelerated ageing.
2. Key Materials of Research
2.1. Marula Oil (MRO)
Marula or Sclerocarya birrea is a drought-resistant plant species, found in Southern Africa, Botswana. The tree can grow a diameter of 2 m and produces fruits [26]. The nuts are crushed to produce MRO, which has alcohol content range from 1% to 7% [27]. The oil contains amino acids, fatty acids, oleic and linoleic, flavonoids, catechins, and procyanidin and high amounts of antioxidants [27]. Oleic acid in MRO has a melting point of 360 °C, which helps the antioxidants to resist high-temperature stress. MRO naturally contains oleic acid, which shows high temperament against temperature stress. In addition, the oil contains vitamin-E (tocopherol), which naturally inhibits free electrons during the discharge phenomena [24]. Natural esters containing antioxidants helps to prevent formation of valence electrons during electron avalanche. Thus, natural ester retards ionization delays breakdown in oil. On the other hand, the procyanidin in the oil acts as an excellent antioxidant and inhibits reactive oxygen, thereby preventing the oil from ionization.
2.2. Conductive Nanoparticle (CNP)
The theory of nanoscience has its application as a drug carrier in various fields of engineering and health. These nano-sized particles (10 nm) are highly stable, and it is complicated to predict their physio-chemical characteristics. The application of CNP in the transformer liquid dielectric starts with the nanoparticle’s ability to capture free electrons during the discharge or streamer application [28]. Discharge or streamer is initiated by the ionization; a process by which valence electrons are separated from shells and start bridging a conductive path between electrodes. This establishes a short-circuited path in liquid dielectric and results in dielectric breakdown [21,24]. The CNP traps the fast-moving electrons during the discharge mechanism and slows the process either by neutralizing or slowing down the ionization. This increases the breakdown strength of the liquid dielectric and reduces ageing. Unlike magnetic and semi-conductive nanoparticles, CNP is influenced by the direction of the electric field. This leads to CNP coming into action whenever there exists a strong field between the two electrodes [29]. Al2O3 shows very low charge relaxation time, metal chelation, and electron scavenging properties. This retards free electrons that are responsible for electron avalanche, reducing energy density of avalanche chain. It is also known that CNP improves the breakdown voltage at a concentration of 0.5 g/L in the host fluid as mentioned by Raymon et al. [28]. Al2O3 possesses amphoteric structure and it does not react with water in the presence of Natural Esters. Since Al2O3 is slower to saturate in water, it is used for adsorption purification of oils as adsorbent to capture hydrocarbon impurities from the air. The effect of Al2O3 has been well utilized in this study to understand the behavior in MRO and MO, and its suitability as an additive in liquid dielectric coolant for the transformer.
3. Dielectric Behavior of Host Fluids
MRO and inhibited MO are collected from Botswana and India, respectively. Both MRO and MO are considered as host fluids, and their dielectric characteristics are measured as per IEC (International Electrotechnical Commission) [30] and ASTM (American Society for Testing and Materials) International [31,32,33,34] standards and presented in Table 1.
The dielectric characteristics like breakdown voltage, kinematic viscosity and flash/fire point are considered in the statistical study. These parameters are much likely to influence other parameters of the liquid dielectric; hence, it is necessary to investigate the behavior analytically. The analysis involves the estimation of survival rate and hazard rate by populating the data points of the dielectric characteristics of base fluids as density and cumulative probability distributions.
Experimental Procedure of the Investigated Dielectric Properties
The study makes use of the dielectric parameters such as breakdown voltage, kinematic viscosity, flash point, fire point to validate them with hazard function and survival function. Breakdown voltage of the liquid dielectric is defined as the maximum withstand voltage capacity of the liquid dielectric under standard room temperature and pressure. Usually, the breakdown voltage is measured by filling the measuring cup (test cup) with 500 mL of the liquid, spherical electrodes fully submerged in the liquid. Gap spacing between electrodes is 2.5 mm and 50 Hz ac test voltage is increased using the control knob at a rate of 2 kV/s until breakdown. The voltage is recorded as breakdown voltage of the sample. Between the successive measurements, a 2 min relaxation time is given, and the test cup is inspected for the carbon formation, then the oil is slowly stirred to avoid formation of bubbles. The test is repeated according to IEC 60156 standards and measurements are recorded [30]. Similarly, the kinematic viscosity is measured using a Redwood viscometer. Kinematic viscosity is defined as the shear stress of the liquid against its flow. The test cup of the Redwood viscometer is filled with the liquid and placed on the water bath, which is heated using the electric heater. The liquid temperature is measured using the thermometer setup and the orifice is controlled manually to drain the oil to a vessel placed under the viscometer. The time of flow is measured using the stopwatch and kinematic viscosity is calculated by considering the pipette and burette constants according to ASTM D445 standards [32]. On the other hand, the fire point and flash point are measured using the Pensky–Martens closed cup apparatus according to ASTM D93 standards [33]. The test cup is filled with the oil and placed in a water bath then heated using an electric heater. The temperature of the liquid is measured using a thermometer and flame is introduced to a small opening in the top surface of the test cup. At some temperature, the liquid begins producing vapour that can be a combustible source when oxygen is introduced to the source in the presence of a fire source. This phenomenon is termed as flash point (smoke point). Likewise, when the combustion becomes continuous for at least 5 s, it is called as fire point (ignition point). Although there are no direct connections between the dielectric properties, they can be individually affected by factors like concentration of the nanoparticles or temperature, which is used to describe the changes in the dielectric properties.
4. Assessment of Breakdown Voltage of Host Fluids
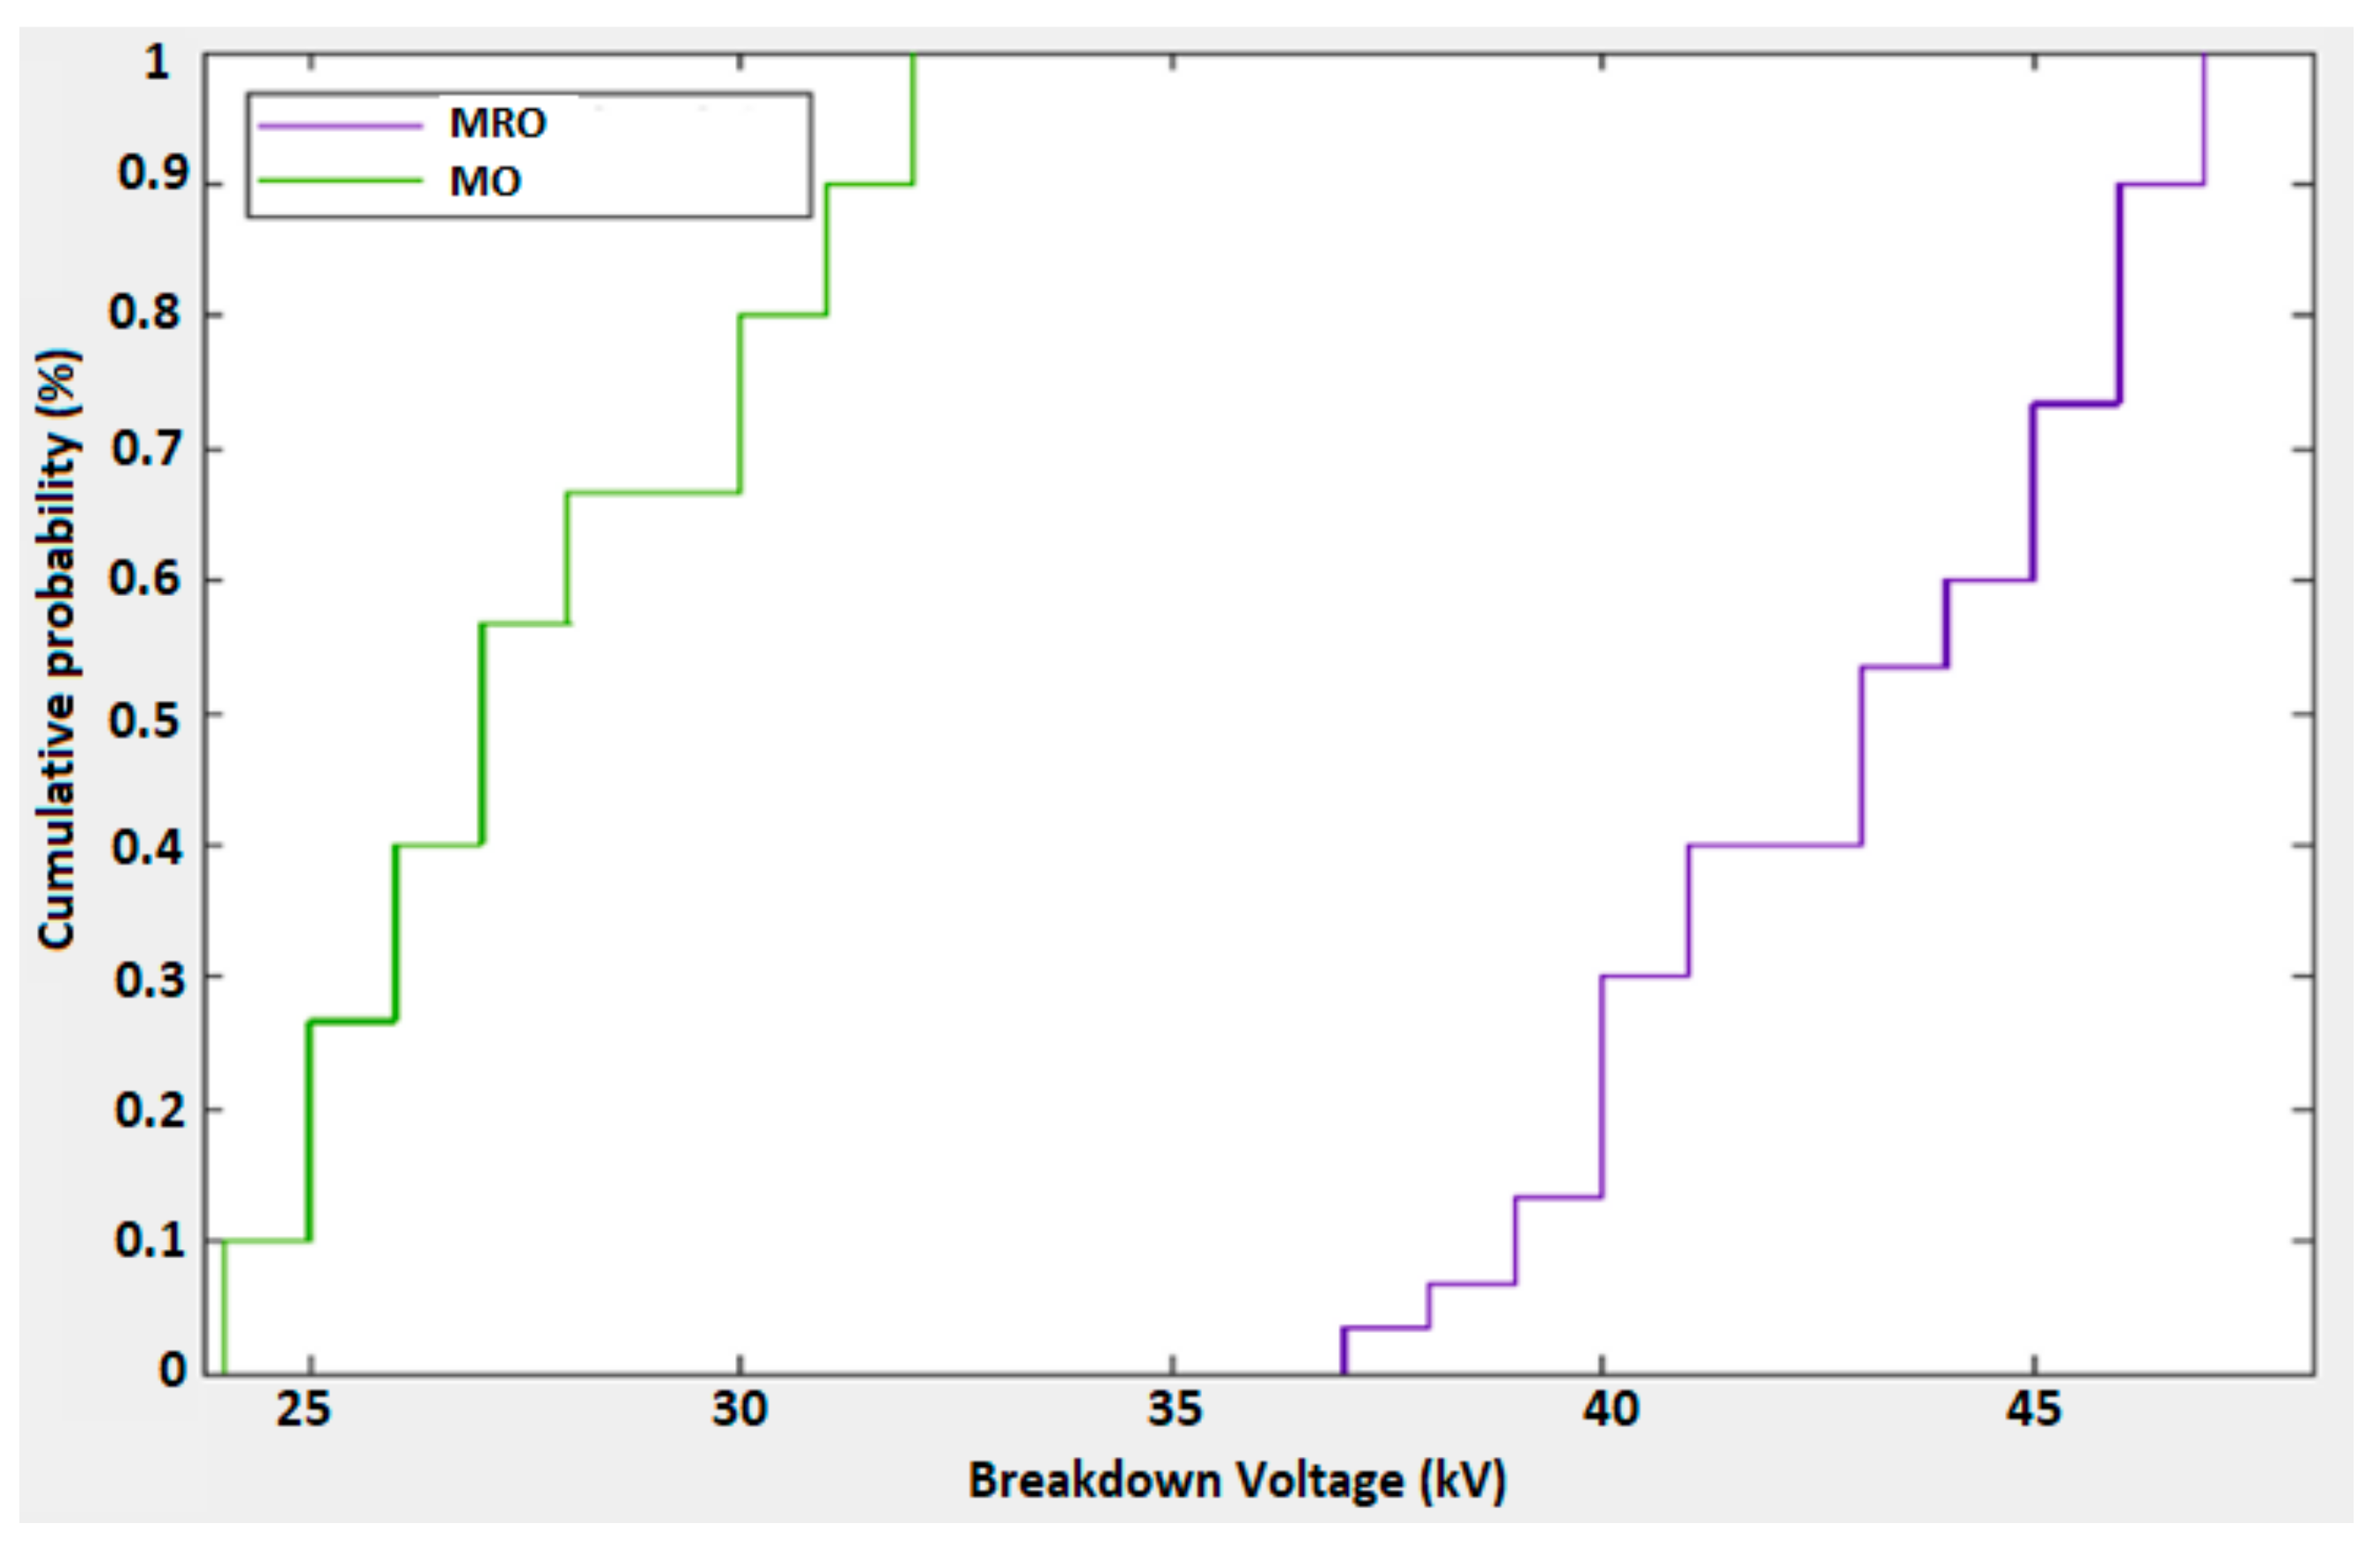
The dielectric breakdown voltage of MRO and MO is distributed as a density plot shown in Figure 1. Readings were taken two times a day for 30 successive days. During this period, the samples are stored in a dark container to protect the fluid from photo oxidation and dust particles. Density plot is a continuous plot of variables that are random in space. The breakdown strength of MRO is higher than that of MO, with MRO showing a wider range of breakdown voltage as compared to MO. MRO’s breakdown voltage limits are from 36 kV to 47 kV while MO falls between 22 kV and 33 kV. The maximum strength of MRO breakdown voltage lies between 45 kV to 47 kV. On the other hand, MO shows endurance between 22 kV to 25 kV and 30 kV to 33 kV. This indicates that most of the breakdown strength’s measured values lie within these indicated regions for both MRO and MO. Breakdown endurance is due to the presence of CNP that retards free electrons detached from valence shell and then reduces the energy density of the electron chain between electrodes. Figure 2 illustrates the cumulative probability of random breakdown voltage of MRO and MO that occur at different voltage instances (sequential events). The sequential events are independent of each other, and it is critical not to have two events occur simultaneously [35].
A wider range of breakdown voltage of the MRO indicates that it experiences a lesser effect on the successive breakdown events. The density plot also shows a quick recovery between breakdown events. Such recovery is due to the presence of natural antioxidants in MRO. Hence, it is hypothetical and practical to conclude that MRO has a lesser propensity to electrical stress. Reliability analysis such as survival function and hazard function are used in this study to understand and compare the endurance of the liquid dielectrics. Survival function determines the number of data points that survive over time or in other words the data points that fail in the expected duration of time. Survival function is determined using the Kaplan–Meier function. A simple way to calculate the distribution of the survival function is through a hypothesis which evaluates the risk over a constant time i.e., λ(t) = λ. From the expression of distribution function; F(t) = 1 − exp(−λt), the survival function is; S(t) = exp(−λt), can be expressed as S(t) = 1 − F(t). Likewise, hazard function indicates the rate at which the data points experience hazard over time or in other words it is the likelihood or frequency of failure per unit time. The above survival and hazard functions are used to determine the reliability of the liquid dielectric. Such mathematical analysis is therefore essential to realize the bathtub function of the liquid dielectric. When the distribution becomes exponential, the hazard function becomes; λ(t) = F(t)/S(t) [36]. According to Figure 3, the proportion of MRO surviving 40 kV is 70%. On the other hand, 80% of the time MO survives only 26 kV and 20% of the time it survives 30 kV. MRO shows 50% survivalat 44 kVwhile MO is at 28 kV. This indicates that MRO has a superior survival rate than MO. From Figure 4, at 50% cumulative hazard, MRO is less likely to fail until it reaches a breakdown voltage of 45 kV. It is also evident that MO experiences a 50% hazard at 32 kV and above voltages. Both λ(t) and H(x) from Figure 3 and Figure 4 shows some data exceeding the confidence bounds of MO. This clearly indicates that MRO is likely to follow the upper survival bounds. Most of the time, it is less likely to fail above 40 kV. Here, the Weibull parameters are obtained from the generated Figure 3 and Figure 4 with a shape parameter “K > 1”. This shows the rate of failure increases with time as ageing goes on with time. Similarly, the scale parameter “λ” is assumed to be greater than “0” to spread the distribution evenly.
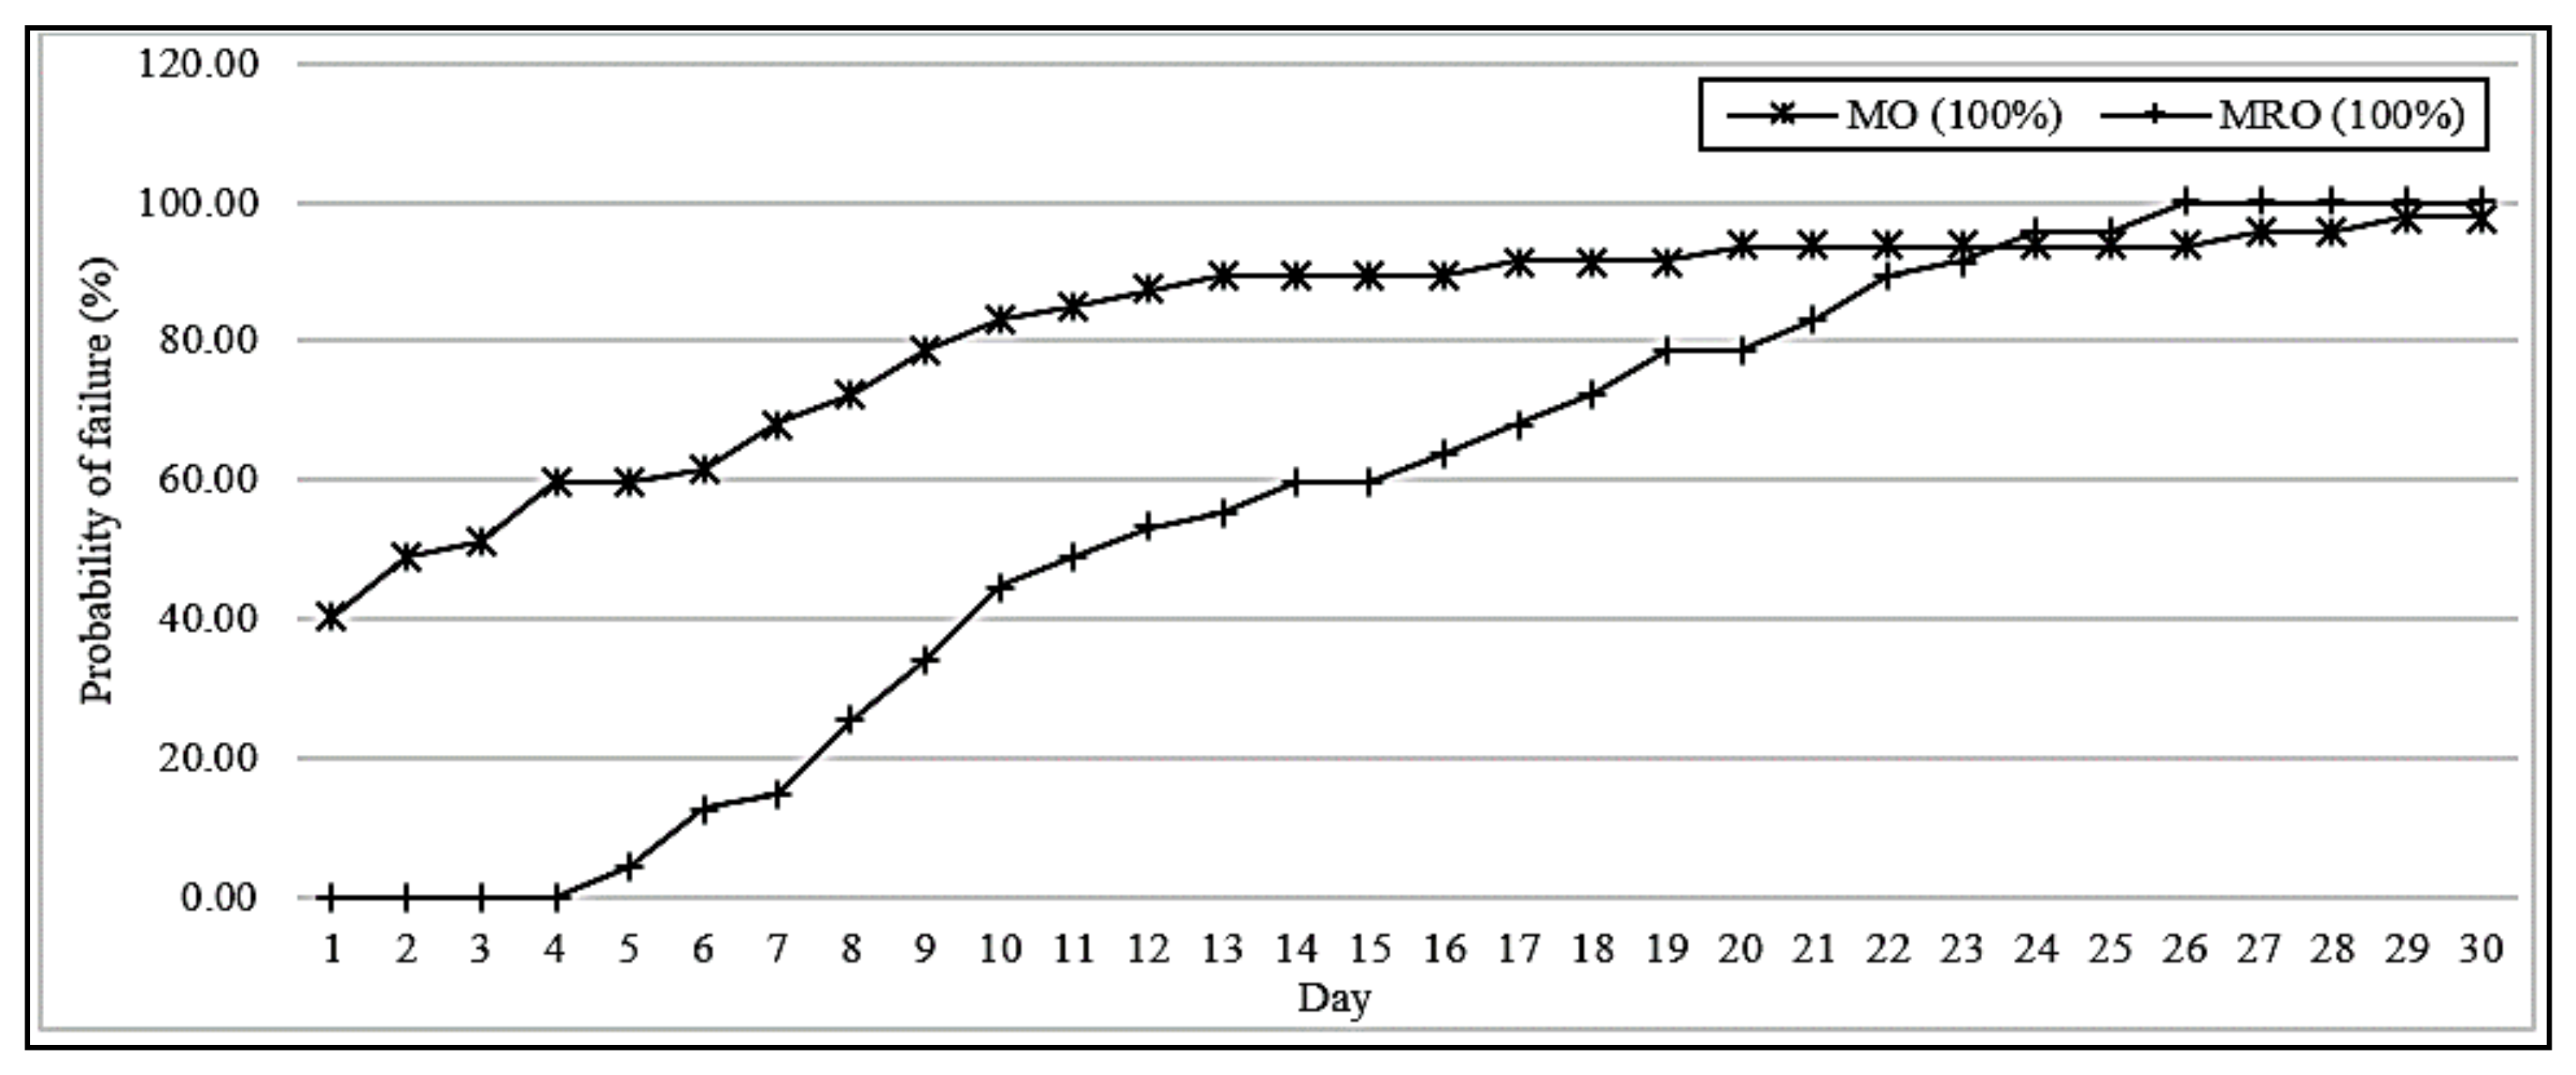
Figure 5 shows the failure probability of MRO and MO for 30 days from the breakdown voltage tests as per IEC standard [30]. The probability of failure of the dielectric fluid is the ability of the fluid to show a constant breakdown strength during successive testing. The probability of failure is measured at the breakdown voltages of MRO (47 kV) and MO (32 kV). Typically, MRO shows no changes upto 5 days, while MO shows 40% probability to breakdown from day 1 of testing. By day 15, MO has 87% breakdown probability which is a 47% rise from day 1 while MRO has a 60% rise for the same period. There is an inflexion point on day 23, where MRO shows the same rate of failure as MO. MO has shown slower growth in failure rate even though its probability of failure was initially 40% higher than that of MRO. This indicates that electrical stress has a greater impact on MRO than MO from the inflexion point on day 23. In this case, MRO needs enhancement by adding a CNP such as Al2O3.
5. Preparation of the Nanofluids
The nanofluids are prepared by amalgamation of MRO and MO with nano sized Al2O3 in different concentrations from 0.1 g/L to 2 g/L with concentration increase interval of 0.25 g/L. They are heated up to 100 °C and treated in an ultrasonication bath with 30 kHz as mixing frequency. The oil moisture is removed during the heating process. The nanofluid is collected in a closed container after the procedure and kept at room temperature out of reach of sunlight to avoid ultraviolet and photo oxidation. The nanofluid prepared using MRO shows a fine dispersion of Al2O3 since it contains oleic acid which naturally allows the additive to float in the host fluid. Comparatively, the MO-based nanofluid shows agglomeration after 5 h and needs repeated dispersion using the ultrasonication bath.
5.1. Nanoparticle Impact on the Breakdown Voltage
The impact of nanoparticle on the breakdown voltage of MRO and MO is presented for varying concentrations starting from 0.1 g/L, and 0.25 g/L increment upto 2 g/L. The addition of Al2O3 has resulted in improved breakdown voltage of the host fluids as seen from Table 2.
There is a constant rise in the breakdown voltage when Al2O3 is added from the concentration of 0.1 g/L to 0.75 g/L and it begins to decline after further additions of Al2O3. This variation is seen from Table 2 where the highest enhancement of breakdown voltage is measured at 0.75 g/L with 26.6% for MRO and with 31.2% for MO. A composite cross-section of liquid-nanoparticle helps to reduce the random nature of breakdown of fluid by energy reduction achieved by field grading. This implies that breakdown is an extreme-value process. For further additions of Al2O3 at 1.75 g/L, enhancement is lost for MRO, showing a decline of 4.4% from the host’s original value. A similar behaviour is measured for MO at 2 g/L with a 6.7% decline. Both oils do not experience a major stochastic change in the breakdown voltage with the addition of CNP. % enhancement from Table 2 indicates that addition of nanoparticles increases the electron trapping density of the liquid when an ac breakdown voltage is applied between the electrodes. The increase in the kinematic viscosity by the addition of CNP above 0.75 g/L distracts the capture cross-section of the liquid molecules. As a result, the mean free path is very short for breakdown to occur, which gradually decreases breakdown voltage after 0.75 g/L concentration of CNP. A polynomial interpolation function is developed by considering the breakdown voltage of MRO and MO with the concentration of the Al2O3. The Lagrange interpolation polynomial is found for a given set of different breakdown voltage readings. The polynomial function P(x) is calculated for points ‘xj’ which is given in Equations (1) and (2).
The Lagrange Interpolation helps to find the polynomial which takes certain values at arbitrary points. When more data points are used for developing a polynomial function, greater data turbulence is observed between data points. The breakdown voltage data is used to develop a mathematical function by concentrating on four limits for reducing the polynomial and data turbulence order. Equations (3) and (4) represent the Lagrange polynomial interpolation functions of MRO and MO, respectively, as calculated for the breakdown voltage variations for the addition of Al2O3. Here, U(x) is breakdown voltage at the instant and U is the maximum withstand capacity of oil. The generated generalized form of polynomial function for MRO and MO is given in Equation (5). Equation (5) is then used to estimate arbitrary values of the breakdown voltage of the host fluids transformed using the nanoparticle.
A Gaussian function shown in Equation (6) is a function for predicting arbitrary real constants. It is a probability density function that calculates the value of the distribution function for the specified concentrations between a range. Here, the concentration is a random value “x”, which is usually distributed as seen from Figure 6a,b. Though the data points are typically distributed, from Table 3, the measured maximum breakdown voltage is higher than the predicted voltages. The predicted values face deviation of 0.82 kV and 0.24 kV for MRO and MO, respectively, with low root mean square error (RMSE). This shows that there is no data disorder for the confidence interval of 95%. Lagrange interpolation is useful in finding arbitrary points and the development of the mathematical functions. At 95% confidence, a maximum conformity (R2) is achieved in Lagrange interpolation polynomial function. Another reason for using the Lagrange interpolation polynomial is that for a given set of points (with no two values equal), the function assumes the lowest degree at each value the corresponding value. This helps the functions to coincide with each other at each point. Other interpolation functions seem to be not fitting well with the arbitrary points.
Assessment of Survival and Hazard Functions of Breakdown Voltage
The density plot of the breakdown voltage for the fluids with varying concentrations of Al2O3 is presented in Figure 7a,b. From Figure 7a, the frequency of breakdown voltage for MRO is highest when 0.75 g/L of the nanoparticle is added, and density (%) begins to rise for the breakdown voltage from 59 to 67 kV.
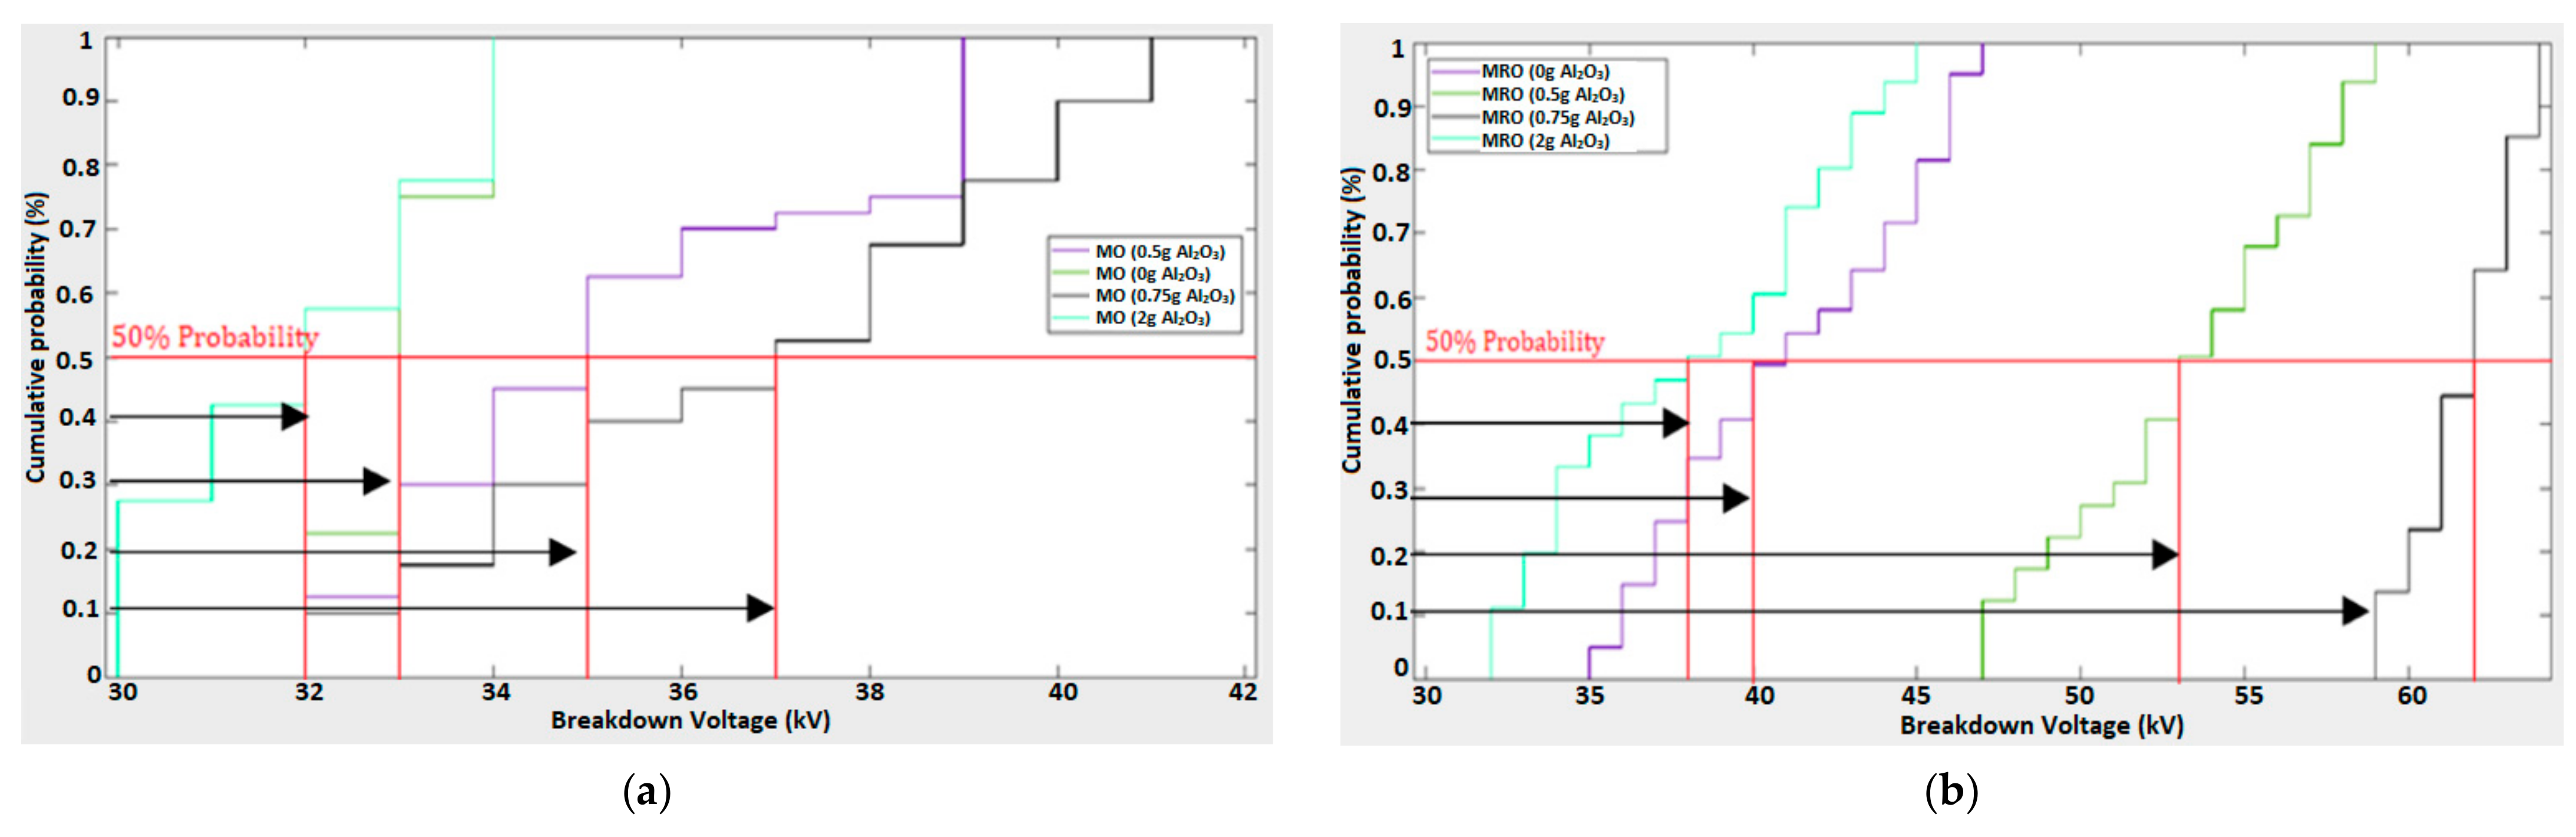
Similarly, without the addition of nanoparticles MRO has the lowest density of 10% with a range of 33 to 47 kV while a maximum of 6% density is observed for the 0.5 g/L addition with a range of 45 to 60 kV. The least density is obtained with 2 g/L addition for the range of 32 to 45 kV. This explains that MRO’s breakdown voltage with the addition of 0.75 g/L Al2O3 has the highest density. The MO’s highest density from Figure 7b is observed at 0 g/L, showing the breakdown voltage range of 32 to 34 kV. Unlike MRO, MO shows a wider density range for the concentration of 0.75 g/L of Al2O3, covering the range 30 to 42 kV with less than 15% probability that can be seen from Figure 8a,b. Like in MRO, the addition of 0.75 g/L of Al2O3 in MO shows a reduction in the dielectric breakdown voltage. At 50% of cumulative probability, MRO’s data points with 0 g/L Al2O3 are likely to fail at 40 kV, showing a wider range from Figure 8a compared to MO observed from Figure 8b. Similarly, MO’s breakdown voltage is 32 kV for 2 g/L, which is very close to the 30 kV for the 0 g/L concentration. At 0.5 g of Al2O3, MRO shows higher strength. A maximum of 62 kV obtained within the range of 59 to 62 kV, breakdown is evident with the addition of 0.75 g/L Al2O3, which shows a narrow probability for MRO. For the 0.75 g concentration, MO shows 37 kV to 42 kV with 50% cumulative probability as seen from Figure 8b, below which the MO is very likely to fail. At 0.75 g/L, MRO shows a 26.56% breakdown voltage rise from Table 3 compared to the MO’s breakdown voltage. Above 0.75 g/L concentration of Al2O3, the fluids’ breakdown voltage begins to decrease.
The cumulative hazard function for the breakdown voltage of MRO and MO under varying concentrations of Al2O3 is presented in Figure 9a,b. There are two to three outbounds of the cumulative hazard as seen in Figure 9a for Al2O3 concentrations of 0 g/L, 0.5 g/L, and 0.75 g/L. For the 2 g/L concentration as seen from Figure 9a,b, with both overreaching upper and lower limits of Weibull distribution, the hazard rate is 70%. The data for MRO at 0.5 and 0.75 g/L concentrations has closely followed the Weibull distribution as shown in Figure 9a.
Moreover, 0.75 g/L addition shows a narrow distribution which is less likely to survive than the other concentrations. In the event of cumulative breakdown voltage, the hazard rate for MO is higher as seen in Figure 9b for the 2 g/L Al2O3 concentration. Only in the 0.5 g/L and 0.75 g/L concentrations of Al2O3 the hazard functions follow the Weibull distribution with wider extremities out of the 95% confidence limit. It is also observed that the survivors of MRO are higher than those of MO from Figure 10a,b. The data of MO is completely out of the 95% confidence limits for 0 g/L and 2 g/L concentrations of Al2O3. From observation, it can be concluded that the wider the range of the survivor breakdown voltage, the lesser the probability of survival as can be seen from Figure 9b and Figure 10b. However, the trend is narrow for MRO, especially for the 0.75 g concentration, which shows the highest data survival from Figure 9a and Figure 10a.
5.2. Nanoparticle Impact on Kinematic Viscosity
The kinematic viscosity of MRO and MO for the various concentrations of Al2O3 and temperature is studied and presented in Table 4. The kinematic viscosity of MRO and MO is measured at temperatures of 0 °C, 30 °C, 60 °C, 90 °C, and 110 °C while increasing the concentration of Al2O3 to assess the molecular relaxation of the fluid at the same time. The results show a promising reduction in kinematic viscosity at 0.75 g/L for all temperatures with a reduction of 40% at 0 °C, 66% at 30 °C, 54% at 60 °C, 66% 90 °C, and 62% at 110 °C for MRO. The interpolation polynomial function for the kinematic viscosity under varying temperatures is shown in Equations (7)–(11). Here, V(x) is kinematic viscosity at the instant and V is the actual measured kinematic viscosity. The generalized interpolation function for the kinematic viscosity under various temperatures is presented in Equation (12).
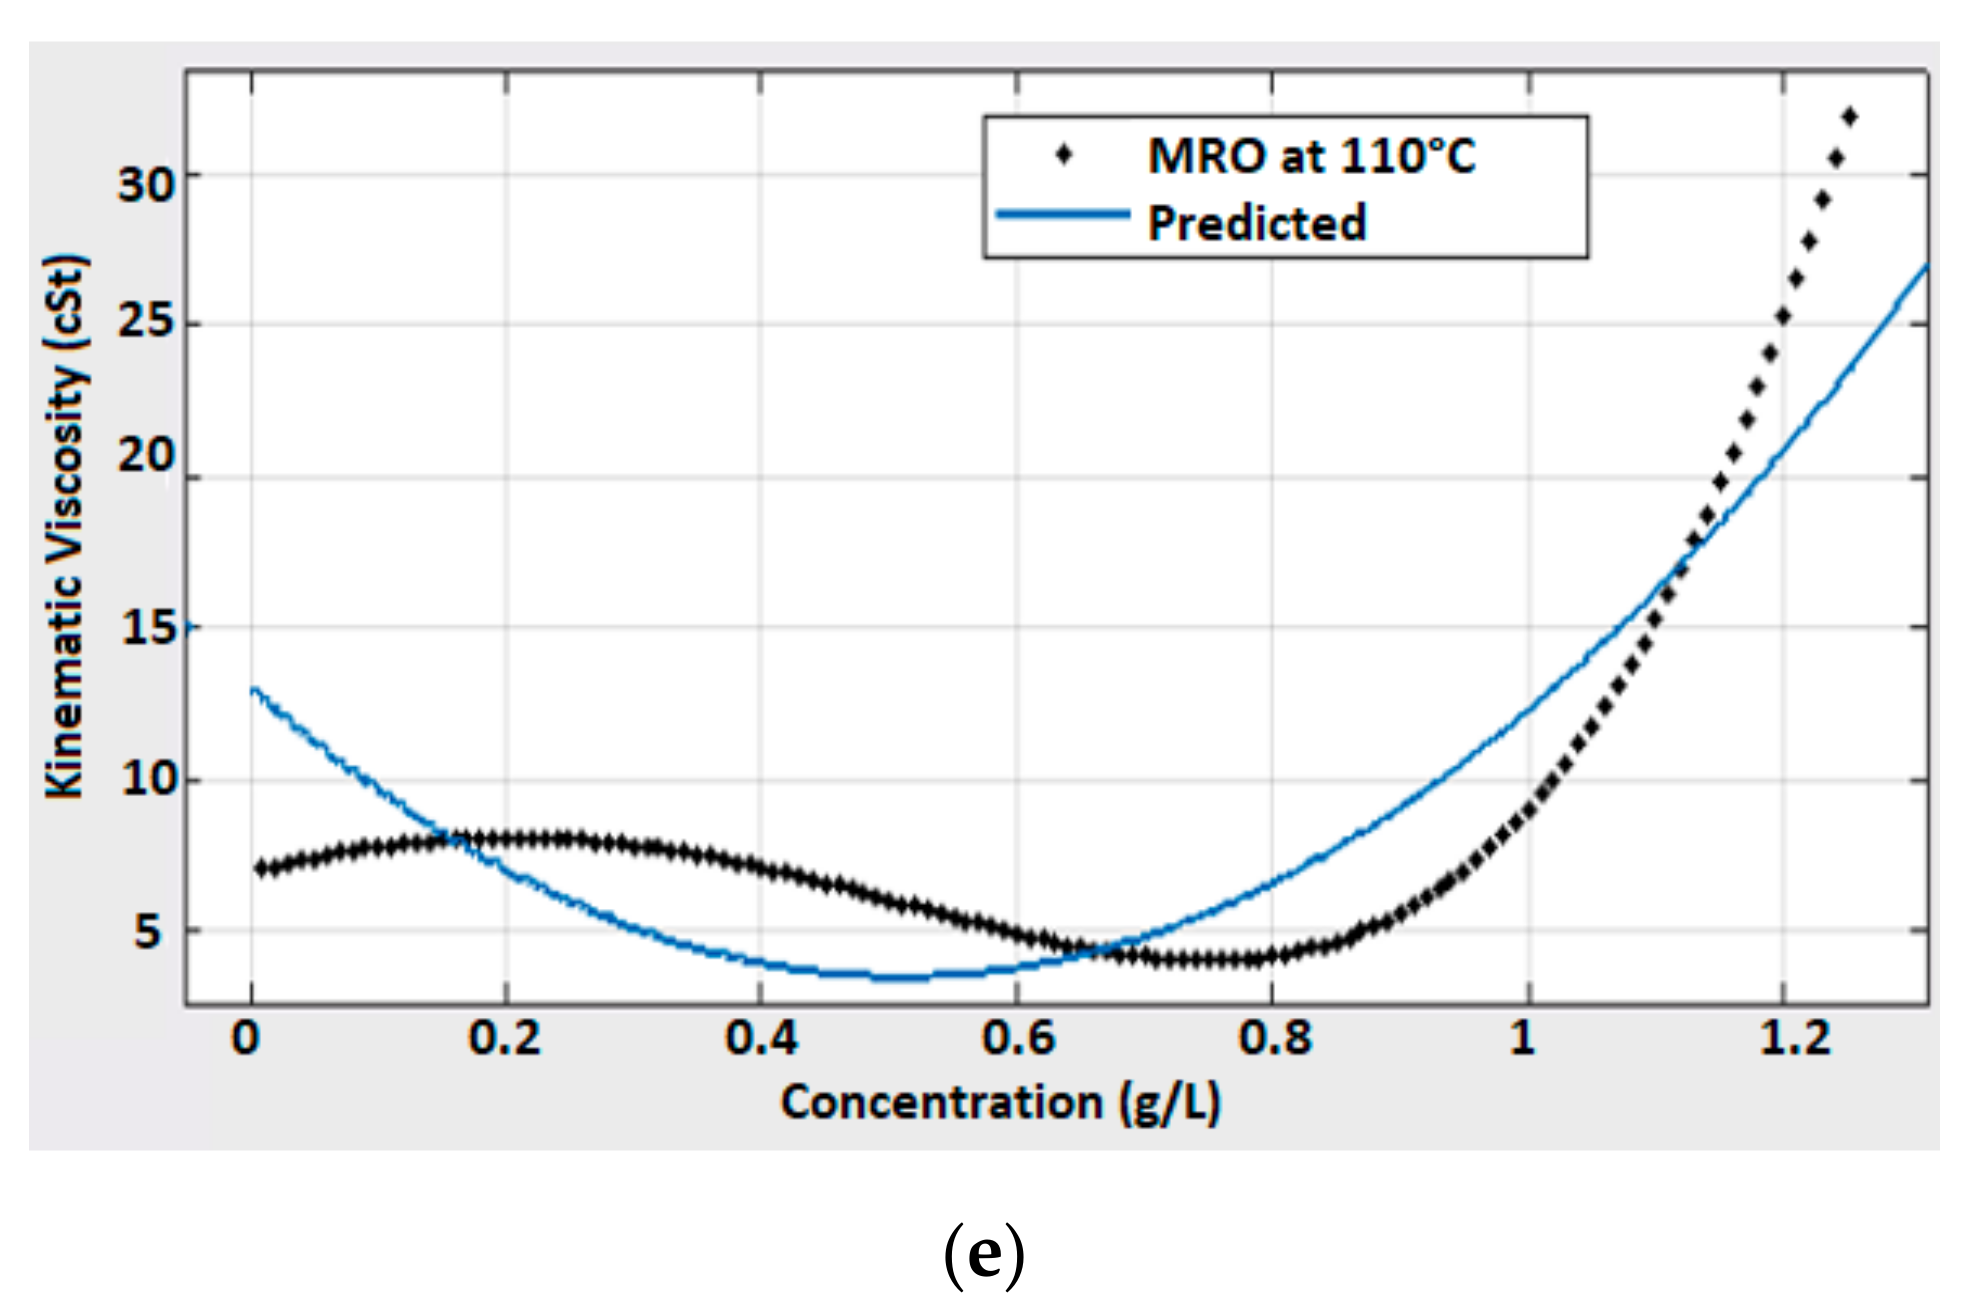
The concentration at which the kinematic viscosity changes with temperature is estimated using Fourier distribution with Equation (13) and its parameters are presented in Table 5. The interpolation function is used to determine the arbitrary points between the concentrations of Al2O3. The data is used to determine the Fourier distribution through which the predicted curve is generated. The measured and predicted distribution of MRO’s kinematic viscosity is presented in Figure 11a–e.
The dispersion of the nanoparticle is well examined up to a concentration of 0.75 g/L Al2O3. Above 0.75 g/L, MRO begins to show viscosity rise. The dispersion of nanoparticles in the host fluid never agglomerate due to the presence of oleic acid [37,38] in MRO. The presence of oleic acid acts as surface coating for the CNP and reduces the density in liquid. Moreover, the surface coating protects the CNP from thermal stresses and releases CNP at the time of ionization process. Both low and high temperatures affect the viscosity of MRO. The negative sign (from Table 5) in the decrement clearly shows that viscosity reduction is significant when compared to the host fluid at 0 or 0.1 g/L concentration of Al2O3. The positive sign indicates the increment or saturation effect compared to the host viscosity at 0 or 0.1 g/L concentration of Al2O3. No change can be seen in MRO’s sample with 2 g/L concentration of Al2O3 where the viscosity is already saturated. At 0.75 g/L of Al2O3, the curve shows good conformity with the host fluid.
A similar effect from Table 6 can be seen in MO with an impressive reduction at 0.75 g/L at all temperatures with the drop of 46.67% at 0 °C, 53.85% at 30 °C, 50% at 60 °C, 42.86% at 90 °C, and 75% at 110 °C. Unlike MRO, MO shows saturation at all temperatures above 0.75 g/L concentration of Al2O3. The interpolation polynomial function for various temperatures is presented in Equations (14)–(18). Here the trend shows better conformity (R2) than in MRO, with a low RMSE. The generalized interpolation function for the kinematic viscosity under various temperatures is presented in Equation (19). The predicted curve is generated using the Fourier distribution given in Equation (20), and its parameters are presented in Table 7. Comparison of measured and predicted curves for MO is presented in Figure 12a–e.
Assessment of Survival and Hazard Functions of Kinematic Viscosity
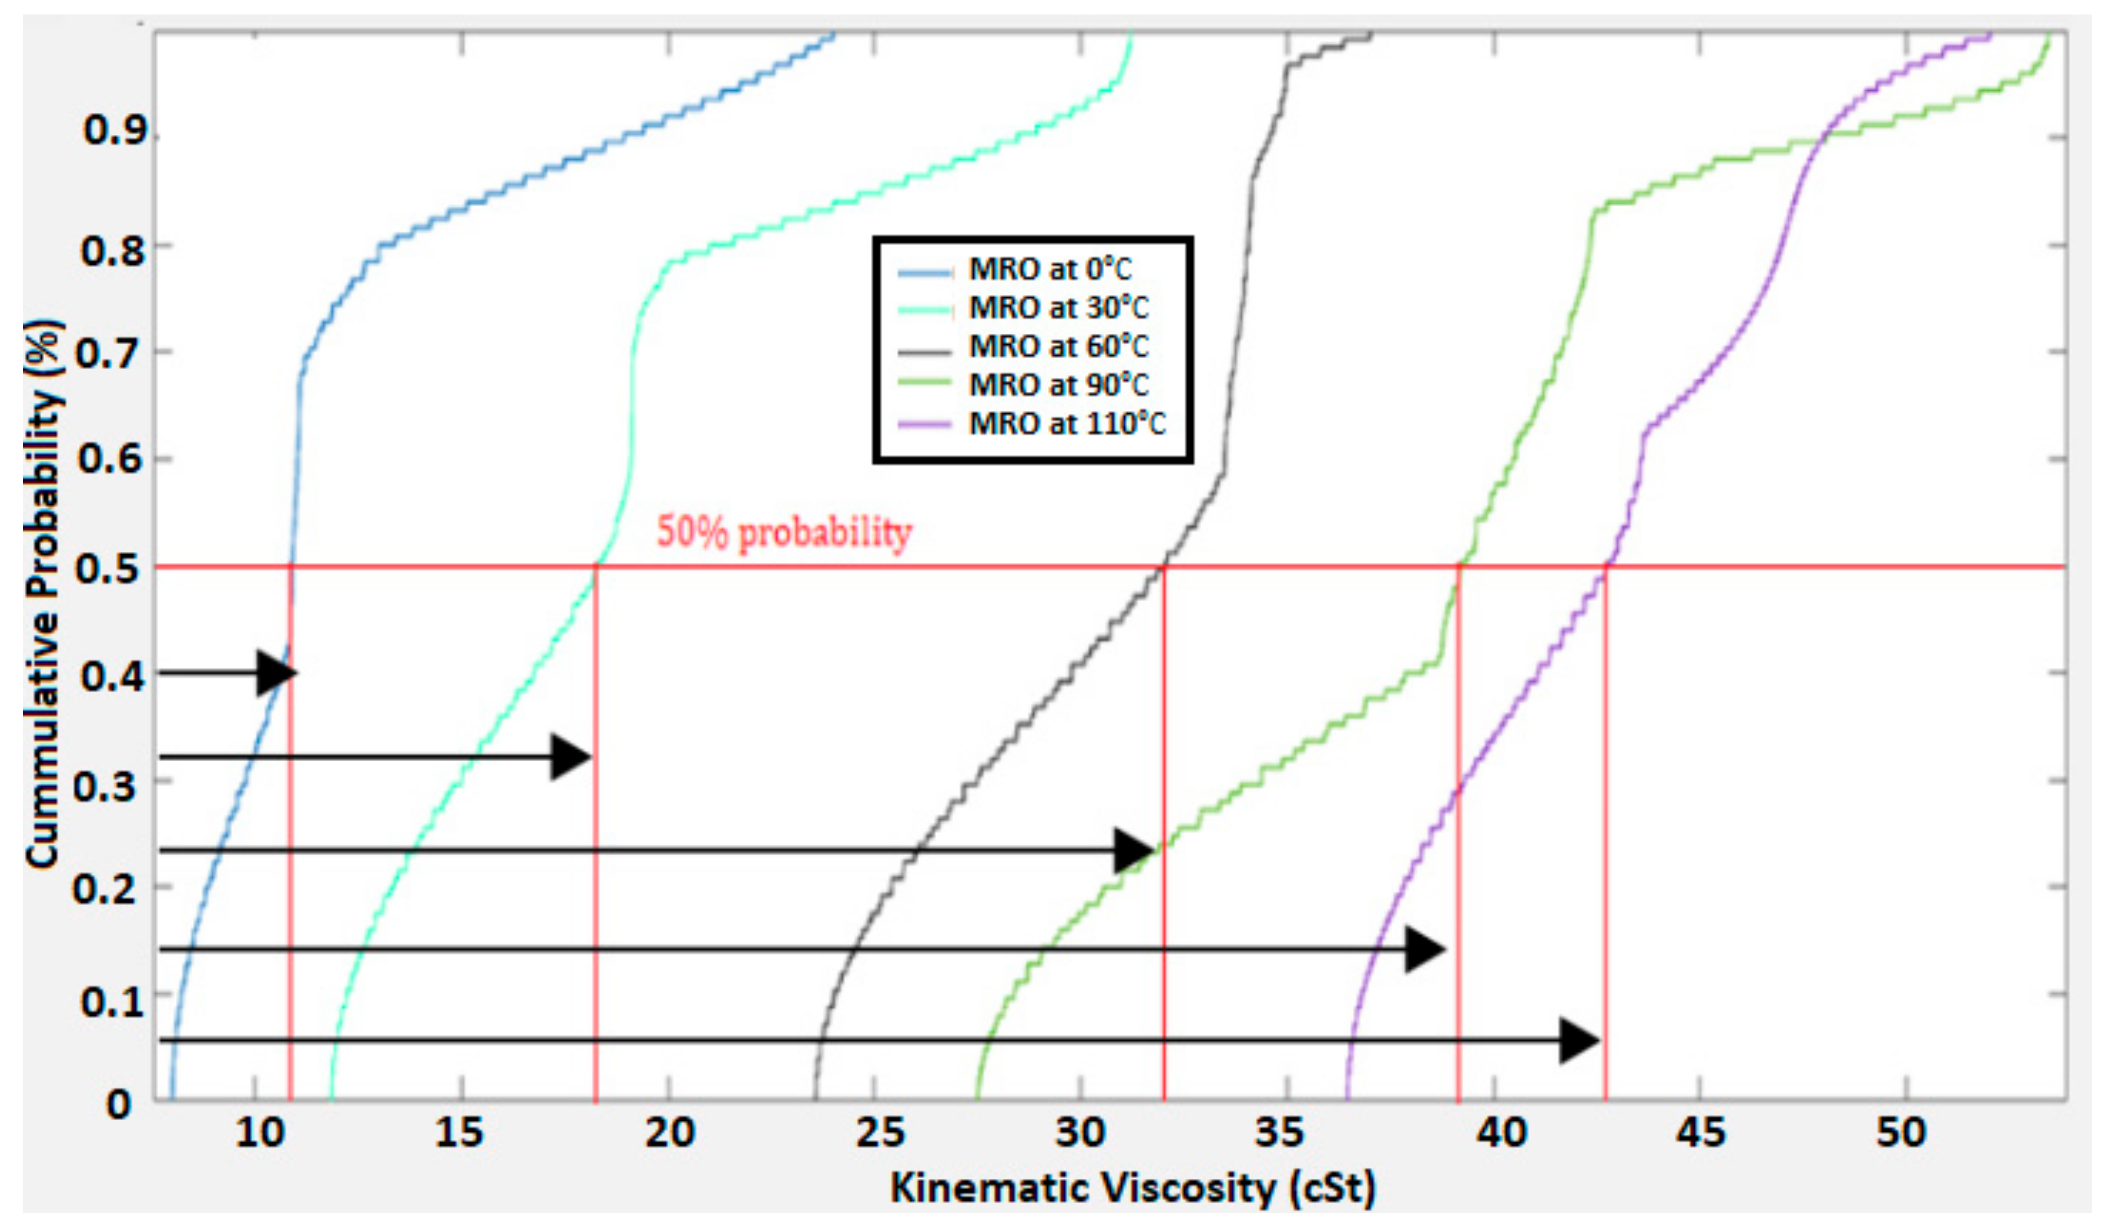
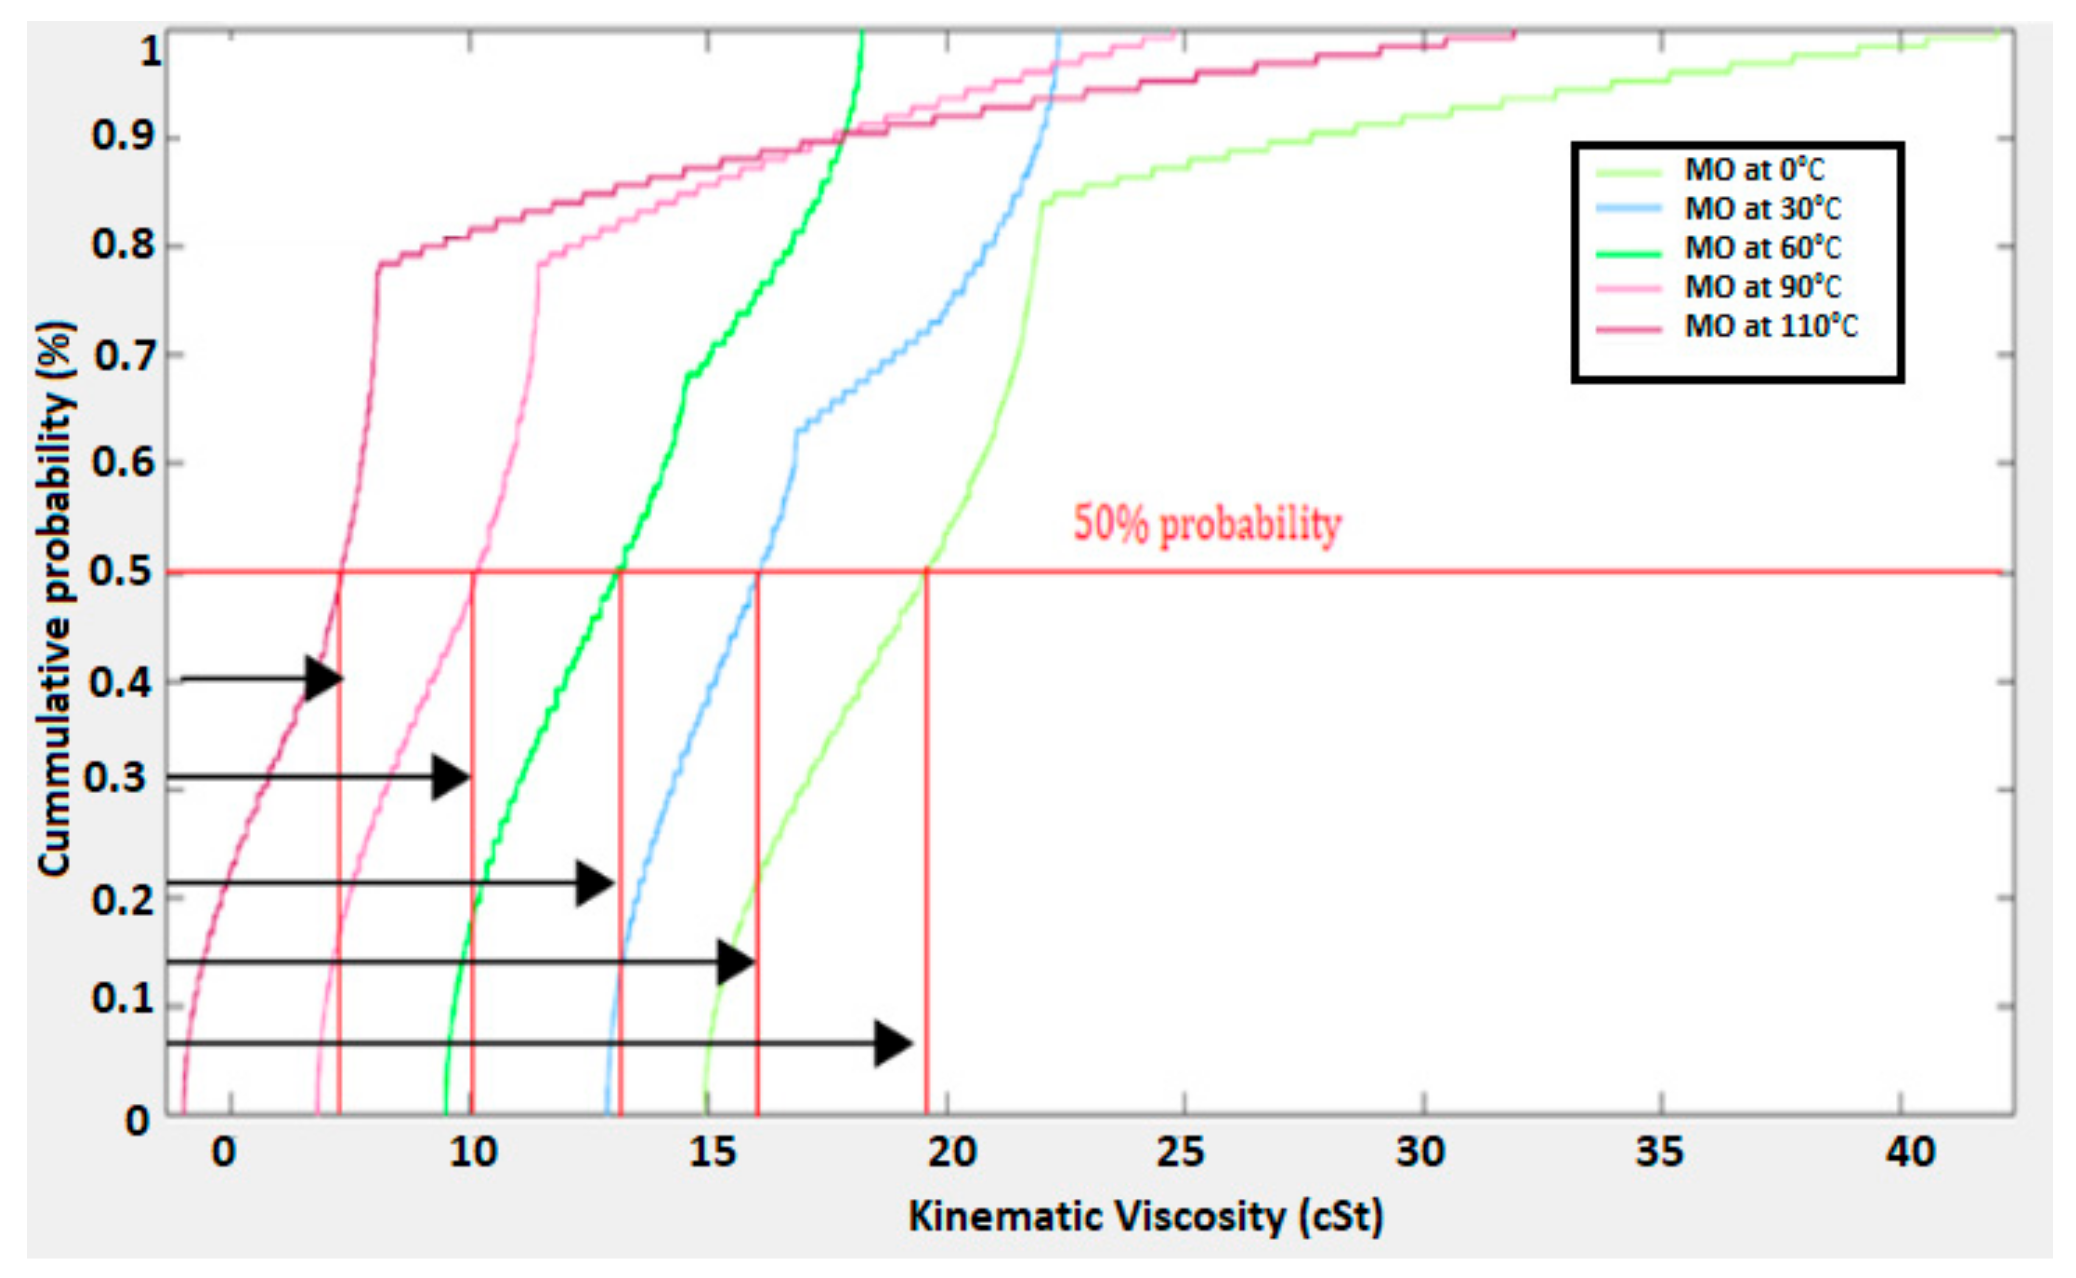
The density plots from Figure 13 and Figure 14 show the temperature effect on MRO and MO’s kinematic viscosity at various concentrations of Al2O3. The concentration of data points of viscosity at high temperatures for MRO is populated within the range of less than 25 cSt while MO has a wider range up to 32 cSt. It can be seen that at concentration of 1 g/L of Al2O3, the viscosity of MO increases by 22% from the host fluid viscosity value. From Figure 15 and Figure 16, the cumulative probability of MRO and MO at various concentrations of Al2O3 indicates that above 50% probability the temperature has reduced the viscosity of the fluids. There exists inverse relationship between temperature and oil’s viscosity according to the above results and results of [21,24]. According to that, when temperature increases, the viscosity begins to reduce. Moreover, temperature rise increases the volume of the oil and reduces consumption of oil in transformers. It can also be observed that at 50% probability, MRO and MO at 110 °C have a viscosity less than 11 cSt and 7 cSt, respectively.
It is evident from Figure 15 and Figure 16 that molecular relaxation is highly effective in MRO than MO. At a temperature of 90 °C from Figure 15, the kinematic viscosity begins to shift from 23 cSt at 60 °C to 12 cSt, which is not realized in MO. Moreover, both Figure 15 and Figure 16 show saturation of viscosity above the 70% probability with a much steeper increase than the previous curve or inflexion points. The MO’s saturation in Figure 16 supports the argument that irrespective of temperature, the concentration of Al2O3 begins to increase the viscosity followed by agglomeration.
However, viscosity of MRO from Figure 15 shows similar behavior to that in MO, with slower saturation above the 0.75 g/L concentration of Al2O3. The survival function of MRO and MO’s kinematic viscosity is shown by the data quantile or inverse cumulative survival rate as seen from Figure 17, Figure 18, Figure 19, Figure 20, Figure 21 and Figure 22. MRO and MO have a better survival rate at different temperatures within an 80% probability from Figure 19 and Figure 20.
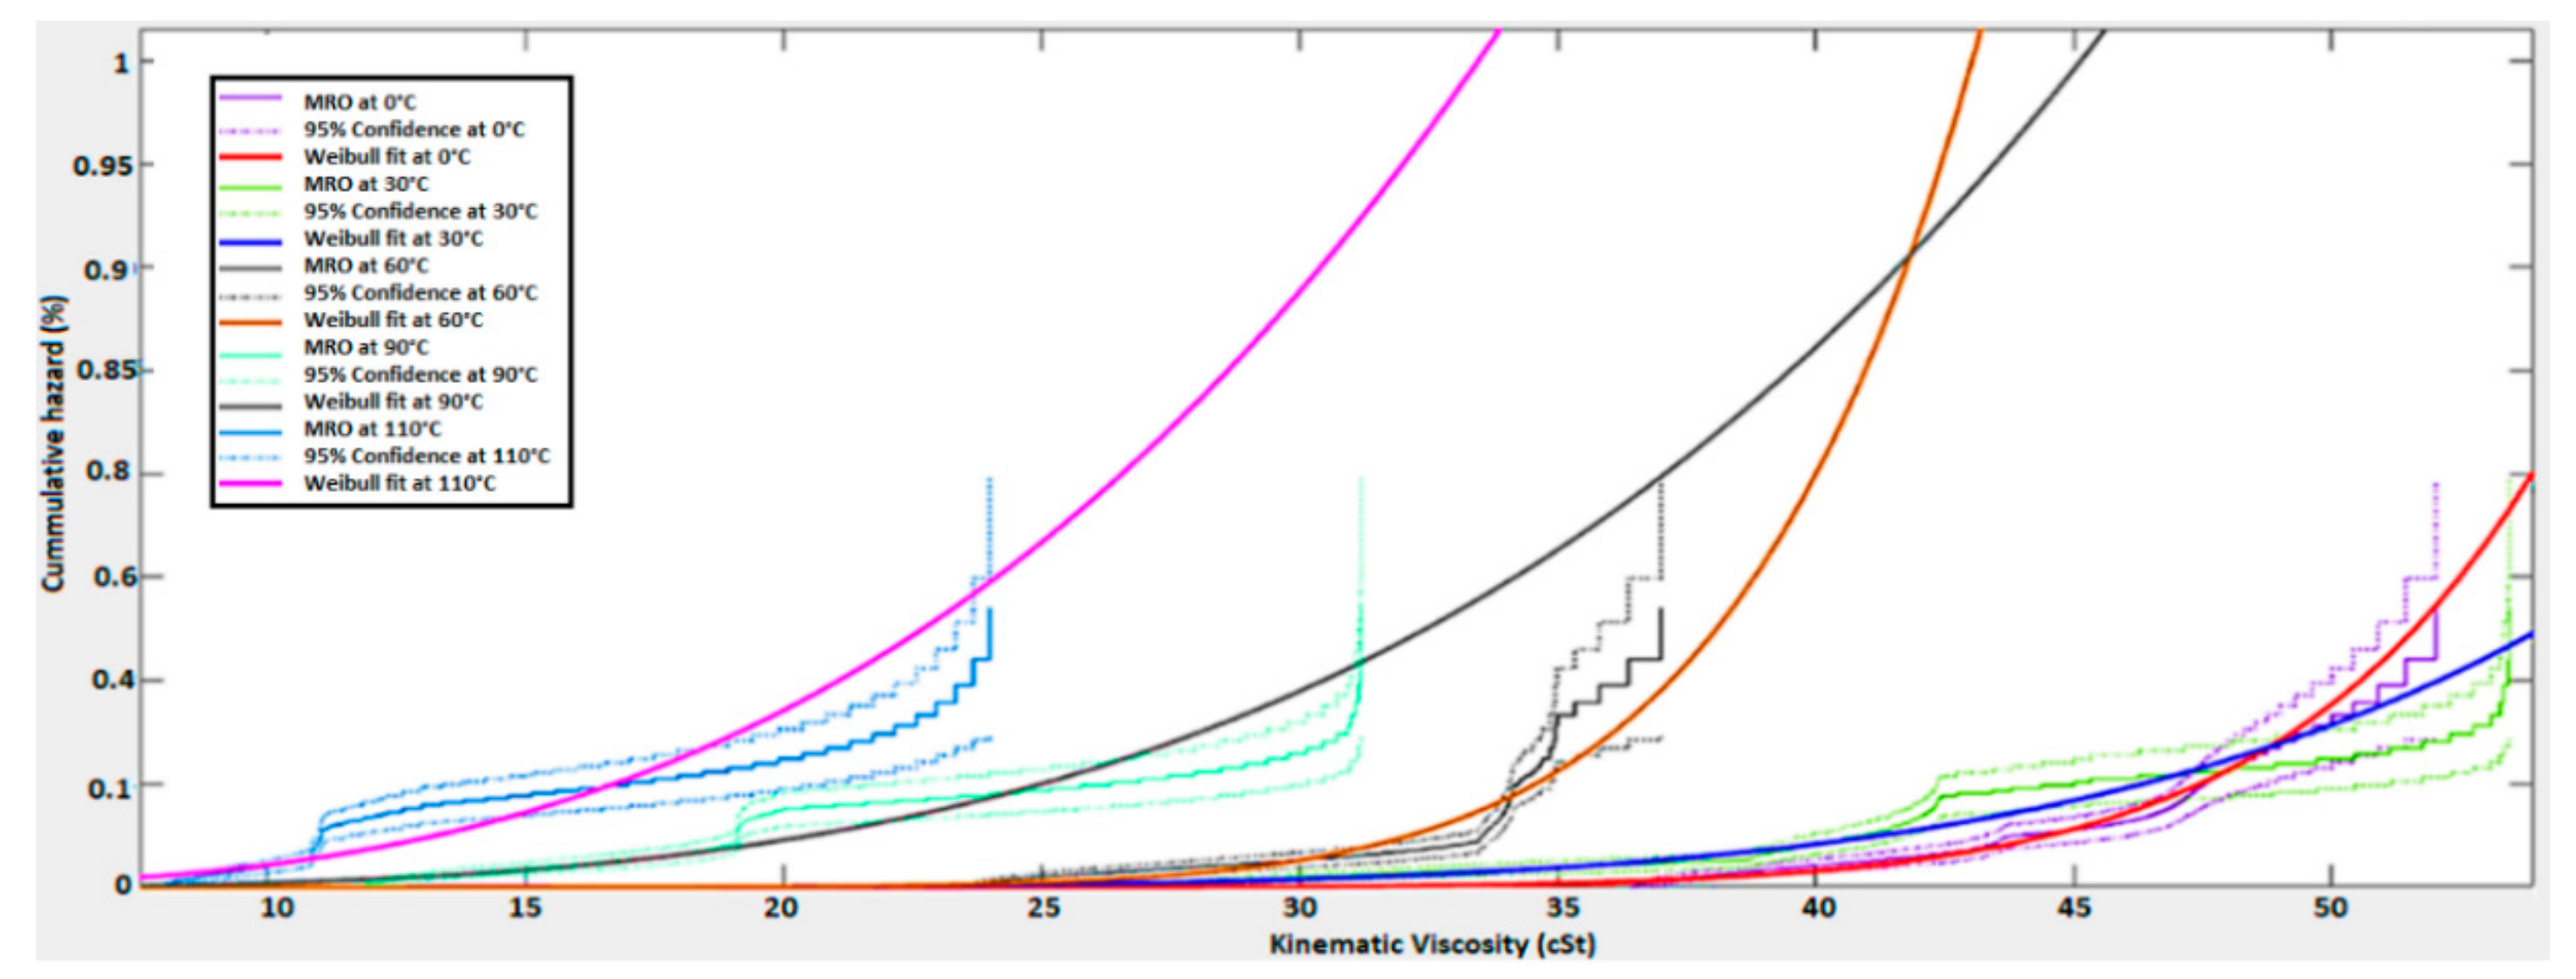
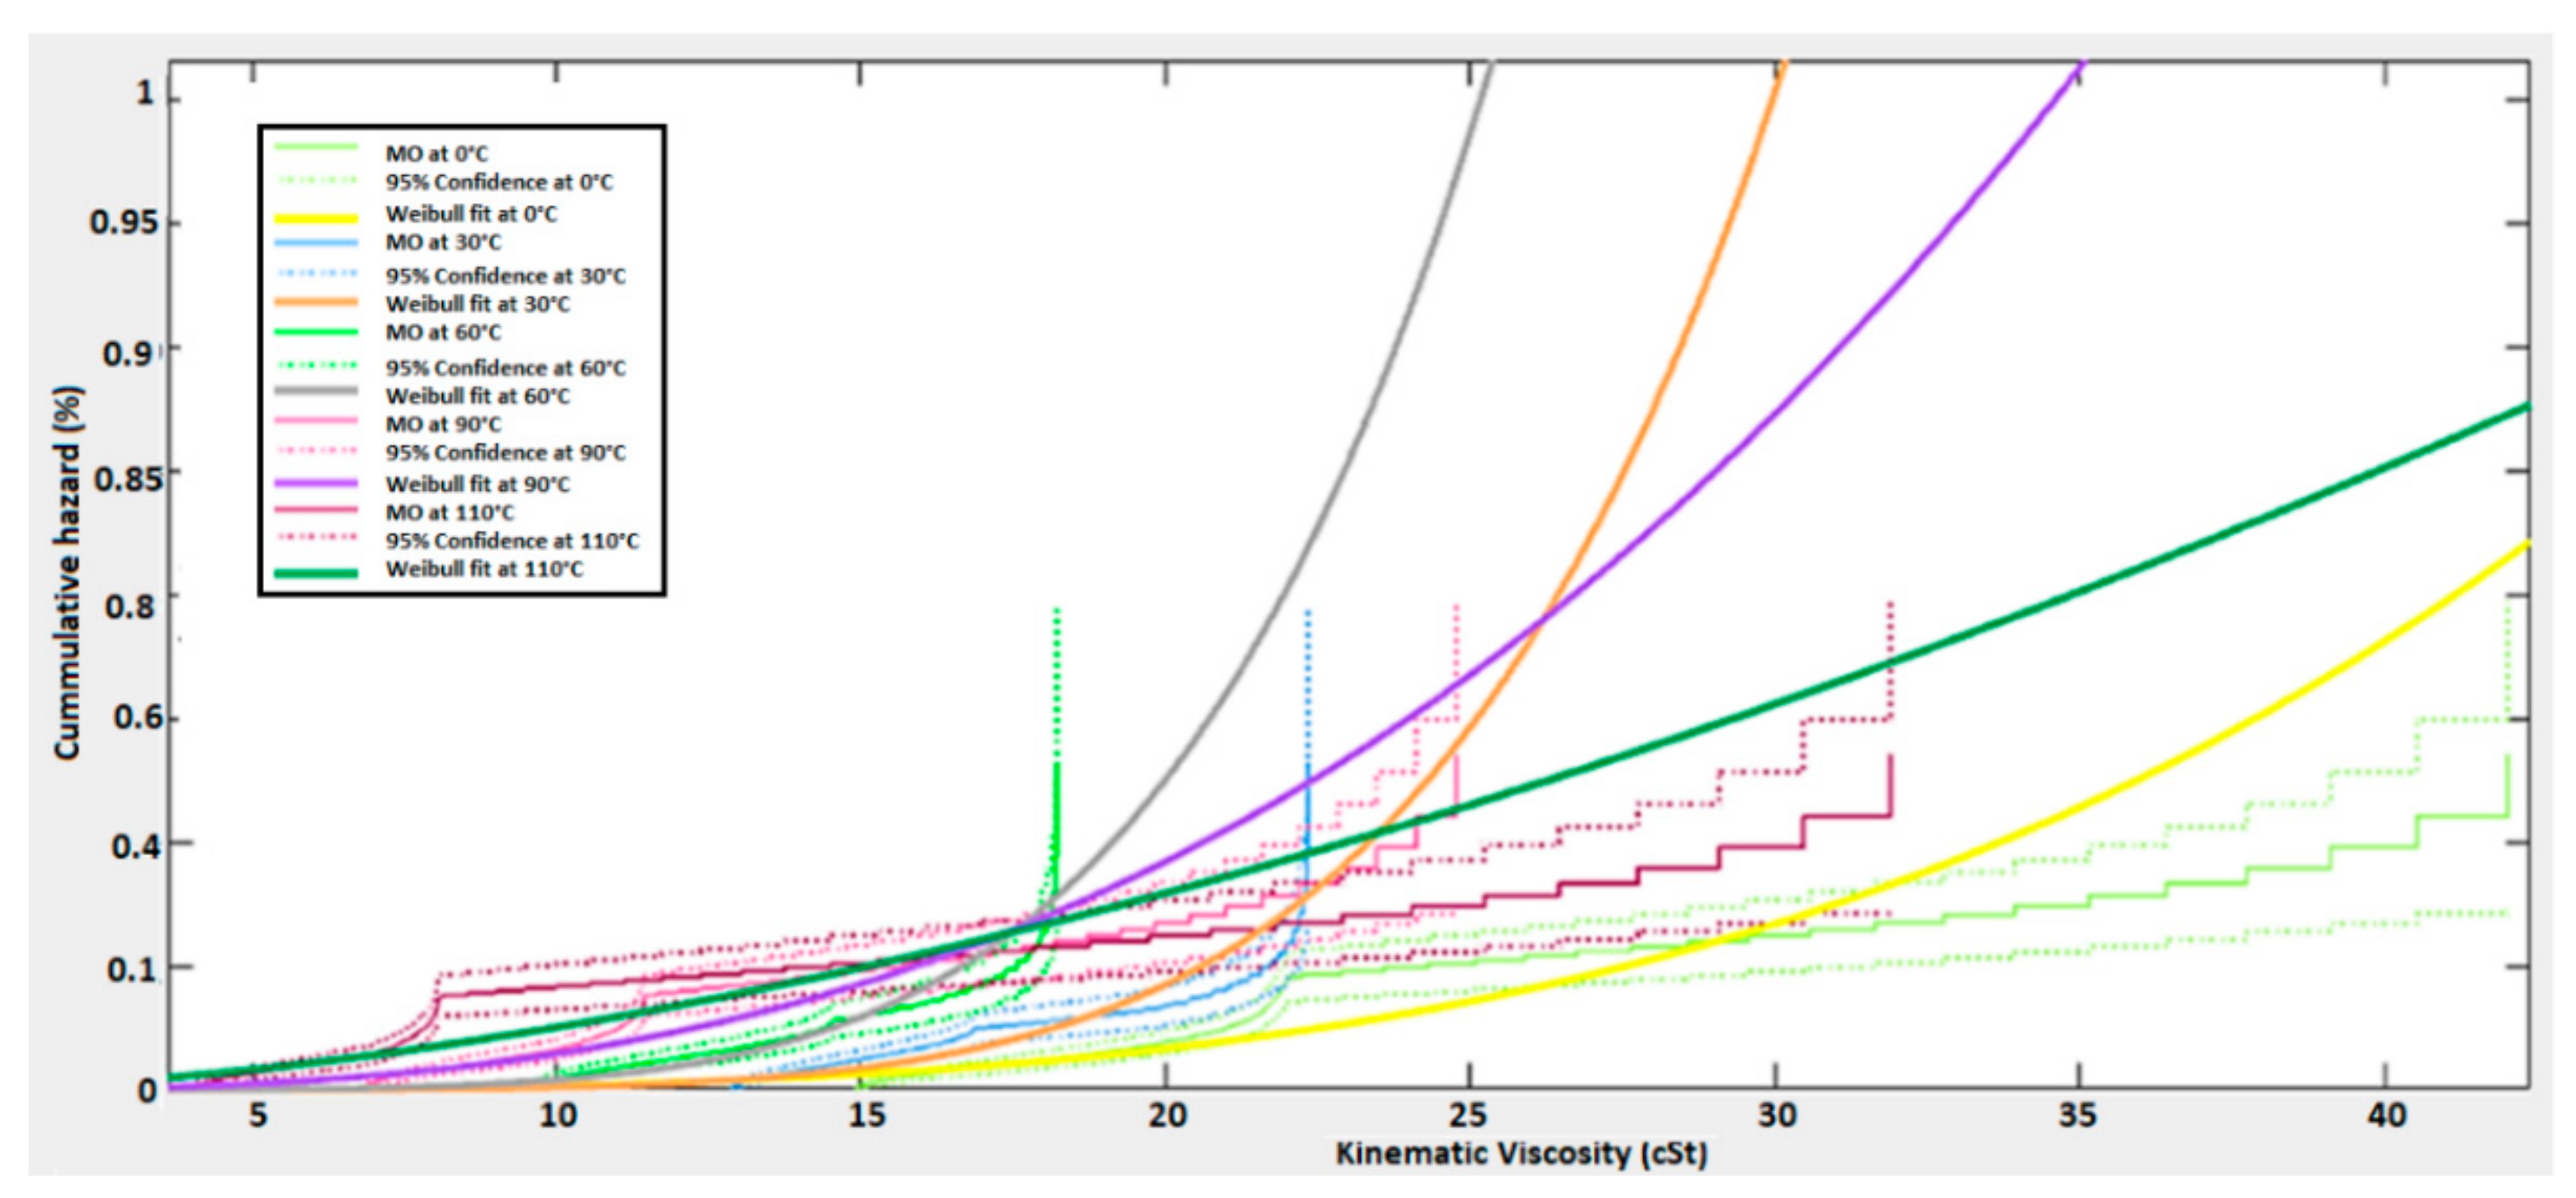
The nanoparticle concentration effect on kinematic viscosity reverses after 0.75 g/L in MO as seen from Figure 20 with a 20% probability. However, the impact on MRO from Figure 18 is slower and shows that at 30 °C MRO experiences saturation at 0 °C with 20% probability. Whenever a steeper rate is observed from Figure 19 and Figure 20, there is less survival within the 95% confidence bounds, which is a risk for both MRO and MO. There is more significant data turbulence in the steeper curve with insufficient proximity to the Weibull curve, which is higher for MO as seen in Figure 22 than MRO in Figure 23. The cumulative hazard, on the other hand, supports the conclusion devised from the survival rate of MRO and MO. From Figure 21 and Figure 22, 20% of the data points experience hazards whenever the saturation starts. It is also desirable to maintain a minimum concentration of Al2O3 to avoid agglomeration and thermal conductivity alteration that results in local hot spots.
5.3. Nanoparticle Impact on Flash Point and Fire Point
MRO and MO’s thermal characteristics are well discussed by calculating the absolute difference and relative difference between the flash and fire points. At various concentrations of Al2O3 in MRO and MO, the flash and fire points are modified as seen from Table 8. Al2O3 is an excellent heat conduction additive that significantly alters the fluids thermal characteristics. Although Al2O3 increases the viscosity of the fluids above 0.75 g/L concentration, it also affects the flash and fire points. The addition of nanoparticles increases the viscosity and reduces thermal conduction. Even though viscosity decreases with an increase in temperature, it increases above 0.75 g/L addition, resulting in a rise in thermal conduction. Effectively, this leads to a drop-in flash and fire points above 0.75 g/L concentration. Comparing the absolute and relative difference of MRO and MO’s flash and fire points from Table 8, there is a significant absolute and relative difference of 34 °C and 12.41% observed for MRO. MRO absolute difference is almost four times higher than MO. On the other hand, MO has shown 8 °C and 4.79%, which need rapid extinction whenever smoke is identified. The drop is well predictable in MO as it shows clear evidence of the temperature drop below the base values of flash point and fire point. It is also evident to have a minimum of 7 to 10% relative difference between the flash and fire points reported by Raymon et al. [5]. The Lagrange interpolation polynomial function for flash point and fire point for MRO and MO is presented in Equations (21)–(24). Here, FLP(x) and FRP(x) is fire point and flash point measured at the instant. The generalized Lagrange function and Fourier function (predicted) for the varying concentration of Al2O3 is given in Equations (25) and (26). The parameter for Fourier function is presented in Table 9. The graphs obtained using Lagrange and Fourier functions shown in Figure 23a–d show lower data deviation for MRO and higher data deviation for MO, which is a clear indication that the actual parameter is closely predicted with a deviation of ±3 °C and ±0.2 g Al2O3 concentration.
Assessment of Survival and Hazard Functions of Flash Point and Fire Point
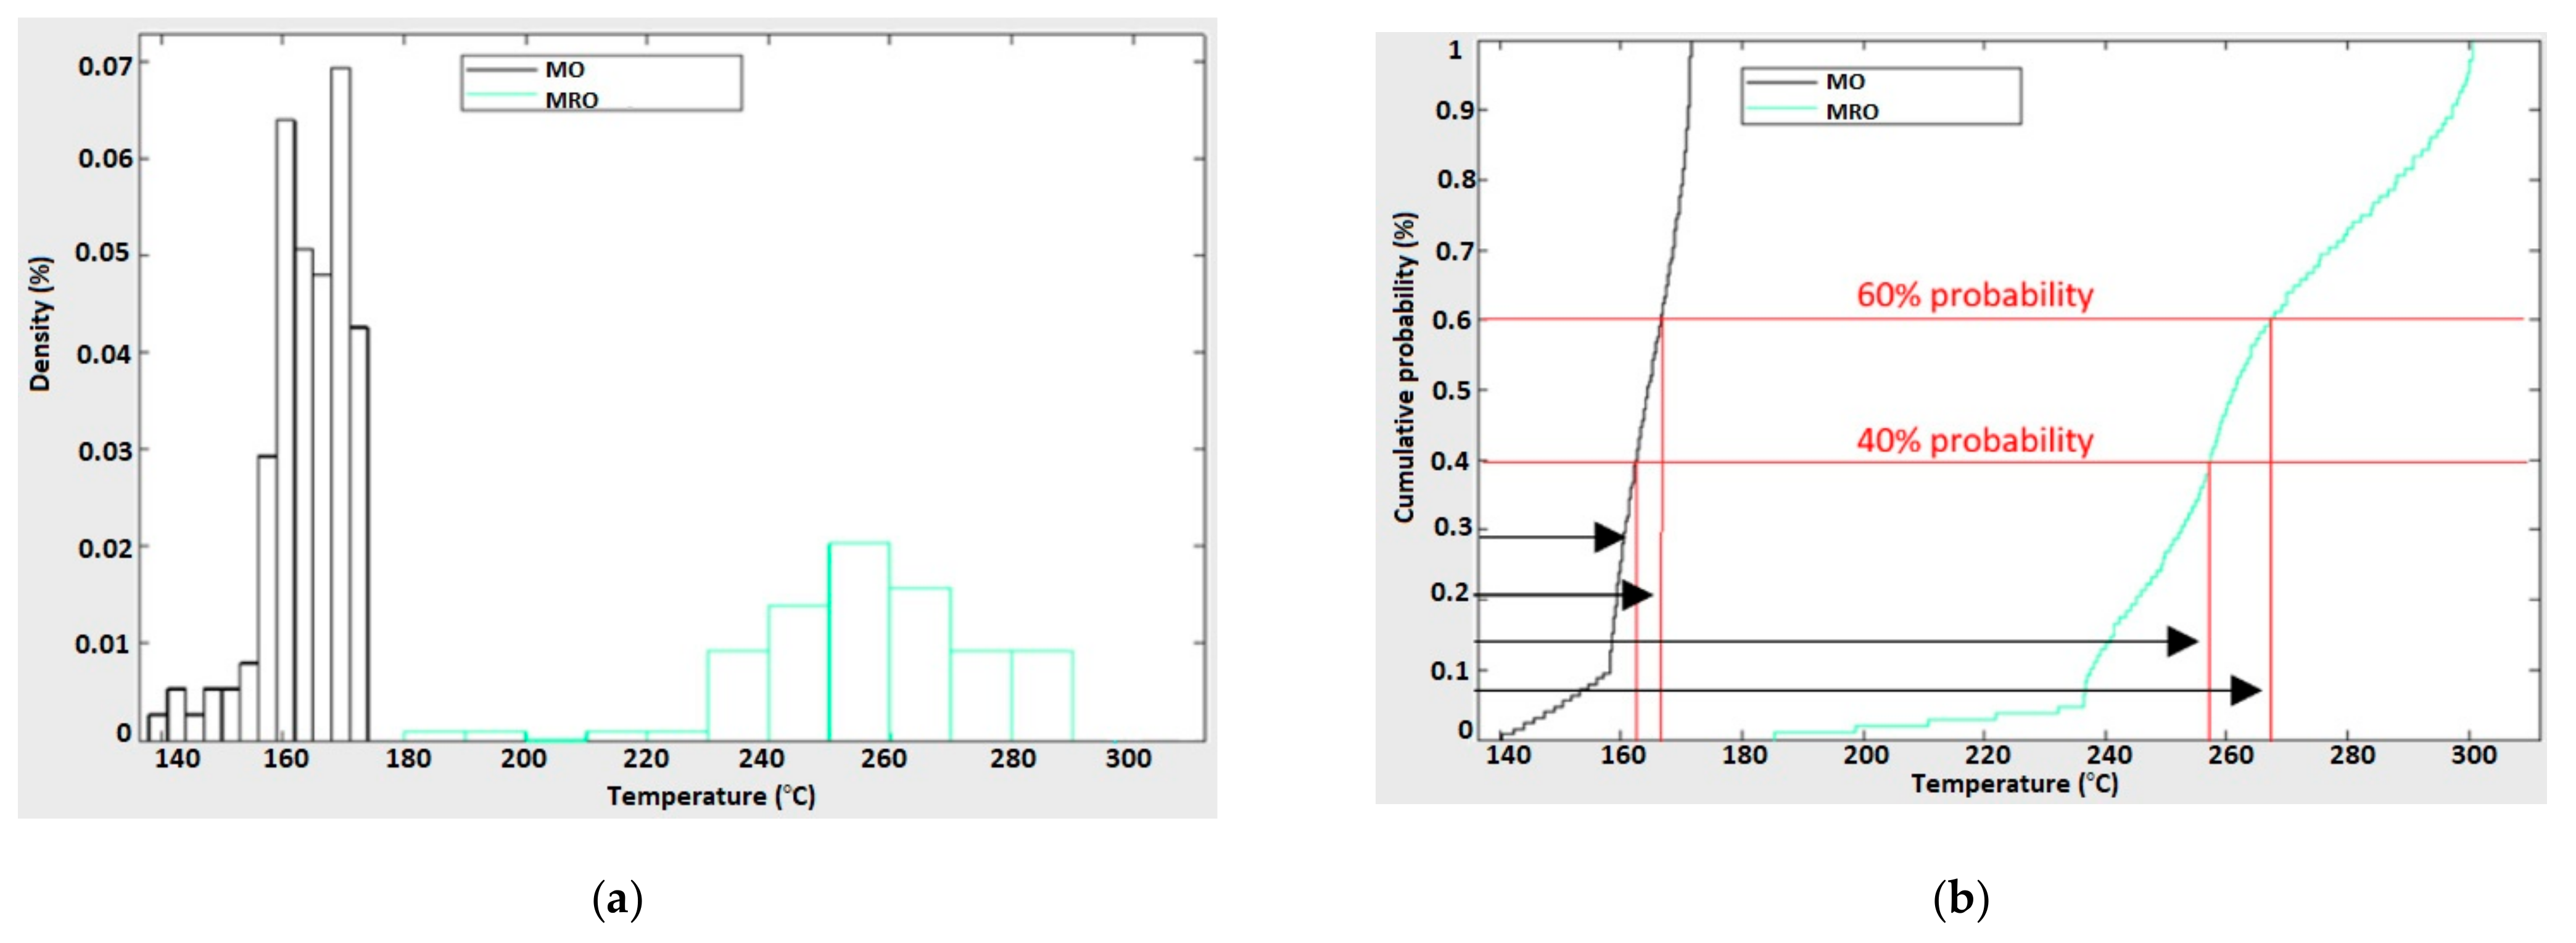
The density (%) and cumulative curves for the flash point and fire point of MRO and MO are presented in Figure 24a,b and Figure 25a,b. From Figure 25a, MRO has the highest data traces covering 230 to 291 °C, which is 58% higher than MO as seen in Figure 25a. The density of MO shows the highest residues in the range 150 to 163 °C from Figure 24a. Figure 25b shows that its probability to maintain 160 °C flash points is only 40%. MRO is likely to keep 240 °C with a probability of 40%, which is almost an 80 °C difference to ensure the safety of solid transformer insulation and core components. Figure 25b shows that MRO’s fire point within the 40 to 60% probability range is nearly 258 to 268 °C. Similarly, for MO at 40 to 60% probability, the range is between 158 to 160 °C. This in particular shows that the temperature difference between the flash point and fire point of MRO and MO is 10 °C and 2 °C, respectively, which indicates that MRO is comparatively safer than MO.
Therefore, the determination of survival and hazard for the flash point is adequate to discuss because the relative percentage between the flash point and fire point is already discussed. The survival rate and cumulative hazard rate of MRO and MO’s flash point characteristics are presented in Figure 26a,b. At 50% probability, the data points of fire point of MO leading to survival is 159 °C and MRO is 242 °C. At 90% probability, MO begins to show a poor survival rate and increased hazard, while MRO shows less hazard rate. Moving from the 50% to 90% probability, MO can survive at a maximum of 140 °C. On the other hand, MRO shows survival of up to 222 °C. There is a difference in the temperature drop from 50% probability to 90% probability observed for MO and MRO which is 19 °C and 20 °C, respectively. The decline is mainly due to the concentration rise of Al2O3 above 0.75 g/L, thereby affecting saturation in the fluid’s dielectric properties.
6. Conclusions
The results of statistical analysis shows the treatment of natural esters like Marula oil with Al2O3 enhances the oil’s electrical, physical, and thermal characteristics. The survival function and hazard function enable analysis of the host fluids’ dielectric properties treated with Al2O3, as well as the electron scavenging properties of Al2O3. An oil’s stability is accessed by subjecting the oil to accelerated heating, it also shows the temperament of the oil after accelerated ageing. At the same time, it helps to derive mathematical function that actually fits the linear relationship of the parameter, which are then used for prediction of the future events using the supervised and unsupervised methods. The rate of increase in breakdown voltage at 0.75 g/L concentration of Al2O3 shows the Al2O3 nature helps to capture the free electrons generated during the inception of ionization. The addition of CNP is effective at electron trapping, reducing the mean free path between the two electrons. The increase in the valence electron trap density particularly with the CNP is moreover reduced with a small concentration (0.75 g/L) of Al2O3 than the higher concentration. Thus, the addition of Al2O3 delays ionization and improves the breakdown voltage of the MRO. The presence of oleic acid in MRO ensures a fine dispersion without the need to coat the CNP with oleic acid and at the same time improves the dielectric breakdown voltage of the insulating fluid. MRO treated with CNP is thermally stable and show endurance for an extended time. A higher absolute and relative difference is seen in MRO than MO. This indicates that the fluid possesses high heat resistance and immunity to temperature stress. The statistical reliability analysis helps to do reliability analysis (time to failure) and enables one to evaluate the lifetime behavior of the insulating oil when subjected to ageing. According to the observations recorded for the different samples, MO become no longer useful and loses its endurance. Such modeling is normally required when actual testing is complicated or impractical. The addition of Al2O3 to MRO acts as a superior nano-ester insulating fluid and it will perform well in actual transformer conditions. The superior nano-ester insulating fluid can serve various power apparatus like circuit breakers, reactors, capacitors, and cables. Thus, maintaining the life of the equipment for an extended period without the risk of failure.
Author Contributions
Conceptualization, R.A.R., A.Y.; methodology, R.A.R.; data curation, R.A.R.; writing—original draft, R.A.R.; writing-review and editing, R.A.R., A.Y., M.M.; validation. R.A.R., A.Y., M.M.; data curation, R.S.; writing—review and editing, R.S. All authors have read and agreed to the published version of the manuscript.
Funding
The APC was funded by Botswana International University of Science and Technology (BIUST), Private Bag 16, Palapye, Botswana through the GRAND REF: DVC/RDI/2/1/7 V(57) and PROJECT CODE: S00299.
Conflicts of Interest
The authors declare no conflict of interest.
Nomenclature
MRO—Marula Oil; MO—Mineral Oil; CNP—Conductive Nanoparticle; PT—Power Transformer; APAC—Asia-Pacific, CAGR—Compound Annual Growth Rate; NEC—National Electric Code; PAO—Polyalphaolefins; BHT—Butylated Hydroxy Toluene; BHA—Butylated Hydroxy Anisole, P.G.—Propyl Gallate; αT—Alpha Tocopherol; β-T—Beta Tocopherol; C.A.—Citric Acid; A.A.—Ascorbic Acid; R.A.—Rosemary extracts; Al2O3—Aluminium-III-Oxide; g/L—grams per Litre; IEC—International Electrotechnical Commission; ASTM—American Society for Testing and Materials; kV/s—kilo Volts per Second; mm—millimeter; Hz—Hertz; mL—milli Litre; kV—kilo Volts; W/m-K—Watts per meter Kelvin; ppm—parts per million; mgKOH//g—milligrams of Potassium Hydroxide per gram; %—Percentage; R2—Conformity; RMSE—Root Mean Square Error; cSt—Centistokes; °C—degree Celsius; Temp—Temperature.
References
- Bakrutheen, M.; Raymon, A.; Pakianathan, P.S.; Rajamani, M.P.E.; Karthik, R. Enhancement of Critical Characteristics of Aged Transformer Oil using Regenerative Additives. Aust. J. Electron. Electron. Eng. 2014, 11, 77–86. [Google Scholar] [CrossRef]
- IEA. 2019. Available online: https://www.iea.org/reports/world-energy-outlook-2019 (accessed on 26 November 2019).
- WICZ. 2020. Available online: http://www.wicz.com/story/42539724/global-transformers-market-size-and-share-by-industry-demand-worldwide-research-leading-players-updates-emerging-trends-investment-opportunities-andrevenueexpectationtill2025 (accessed on 25 August 2020).
- Іnduѕtrу Ѕеgmеnt Оutlook, Маrkеt Аѕѕеssment. Available online: https://www.alliedmarketresearch.com/transformer-oil-market (accessed on 25 August 2020).
- Raymon, A.; Ravi, S.; Abid, Y.; Modisa, M. Enhancement of dielectric properties of Baobab Oil and Mongongo Oil using cost-effective additive for power transformer insulating fluids. Environ. Technol. Innov. 2020, 20, 1–13. [Google Scholar]
- Rafiq, M.; Shafique, M.; Azam, A.; Ateeq, M.; Ahmad Khan, I.; Hussain, A. Sustainable, renewable and environmental-friendly insulation systems for high voltages applications. Molecules 2020, 25, 3901. [Google Scholar] [CrossRef] [PubMed]
- Raymon, A.; Ravi, S.; Abid, Y.; Modisa, M. An overview of potential liquid insulation in power transformer. J. Energy Convers. 2020, 8, 126–140. [Google Scholar]
- Kumar, S.S.; Iruthayarajan, M.W.; Bakrutheen, M. Analysis of vegetable liquid insulating medium for applications in high voltage transformers. In Proceedings of the International Conference on Science Engineering and Management Research (ICSEMR), Chennai, India, 27–27 November 2015. [Google Scholar]
- Suhaimi, S.N.; Rahman, A.R.; Din, M.F.M.; Hassan, M.Z.; Ishak, M.T.; Jusoh MT, B. A review on oil-based nanofluid as next generation insulation for transformer application. J. Nanomater. 2020, 2020, 1–17. [Google Scholar] [CrossRef]
- Harlow, J.H. Electric Power Transformer Engineering, 3rd ed.; CRC Press: London, UK, 2012; pp. 1–693. [Google Scholar]
- Boris, H.; Gockenbach, E.; Dolata, B. Ester fluids as alternative for mineral based transformer. In Proceedings of the IEEE International Conference on Dielectric Liquids, Virginia Beach, VA, USA, 18–21 October 2009. [Google Scholar]
- Raymon, A.; Ravi, S.; Abid, Y.; Modisa, M. Performance evaluation of natural esters and dielectric correlation assessment using artificial neural network (ANN). J. Adv. Dielectr. 2020, 10, 1–10. [Google Scholar]
- Hernandez-Herrera, H.; Jorge, I.S.-O.; Mejia-Taboada, M.; Jacome, A.D.; Torregroza-Rosas, M. Natural Ester Fluids Applications in Transformers as a Sustainable Dielectric and Coolant. Proc. AIP Conf. 2019, 2123, 020049. [Google Scholar] [CrossRef]
- Ab Ghani, S.; Muhamad, N.A.; Noorden, Z.A.; Zainuddin, H.; Abu Bakar, N.; Talib, M.A. Methods for improving the workability of natural ester insulating oils in power transformer applications: A review. Electr. Power Syst. Res. 2018, 163, 655–667. [Google Scholar] [CrossRef]
- Cristian, O.; Cristina, M.; Félix, O.; Fernando, D.; Alfredo, O. Titania nanofluids based on natural ester: Cooling and insulation properties assessment. Nanomaterial 2020, 10, 603. [Google Scholar]
- Ayalew, Z.; Kobayashi, K.; Matsumoto, S.; Kato, M. Dissolved Gas Analysis (DGA) of Arc Discharge Fault in Transformer Insulation Oils (Ester and Mineral Oils). In Proceedings of the 2018 IEEE Electrical Insulation Conference, San Antonio, TX, USA, 17–20 June 2018. [Google Scholar]
- Rouabeh, J.; M’barki, L.; Hammami, A.; Jallouli, I.; Driss, A. Studies of different types of insulating oils and their mixtures as an alternative to mineral oil for cooling power transformers. Heliyon 2019, 5, 1–15. [Google Scholar] [CrossRef] [PubMed] [Green Version]
- Chandrasekar, S.; Montanari, G. Analysis of partial discharge characteristics of natural esters as dielectric fluid for electric power apparatus applications. IEEE Trans. Dielectr. Electr. Insul. 2014, 1251–1259. [Google Scholar] [CrossRef]
- Rafiq, M.; Lv, Y.Z.; Ma, K.B.; Wang, W.; Li, C.R.; Wang, Q. Use of vegetable oils as transformer oils—A review. Renew. Sustain. Energy Rev. 2015, 52, 308–324. [Google Scholar] [CrossRef]
- Abdelmalik, A.A.; Fothergill, J.C.; Dodd, S.J.; Abbott, A.P.; Harris, R.C. Effect of Side Chains on the Dielectric Properties of Alkyl Esters Derived from Palm Kernel Oil. In Proceedings of the 2011 IEEE International Conference on Dielectric Liquids, Trondheim, Norway, 26–30 June 2011. [Google Scholar]
- Raymon, A.; Samuel Packianathan, P.; Rajamani, M.P.E.; Karthik, R. Enhancing the critical characteristics of natural esters with antioxidants for power transformer applications. IEEE Trans. Dielectr. Electr. Insul. 2013, 20, 899–912. [Google Scholar] [CrossRef]
- Jeong, J.I.; An, J.S.; Huh, C.S. Accelerated aging effects of mineral and vegetable transformer oils on medium voltage power transformers. IEEE Trans. Dielectr. Electr. Insul. 2012, 19, 156–161. [Google Scholar] [CrossRef]
- Raymon, A.; Ravi, S.; Abid, Y.; Modisa, M. Comparison of ageing characteristics of superior insulating fluids with mineral oil for power transformer application. IEEE Access 2020, 8, 141111–141122. [Google Scholar]
- Raymon, A.; Karthik, R. Reclaiming aged transformer oil with activated bentonite and enhancing reclaimed and fresh transformer oils with antioxidants. IEEE Trans. Dielectr. Electr. Insul. 2015, 22, 548–555. [Google Scholar] [CrossRef]
- Dudrow, F.A. Deodorization of edible oil. J. Am. Oil Chem. Soc. 1983, 60, 272–274. [Google Scholar] [CrossRef]
- Marula Production Guidelines. Available online: https://www.ethicalsuppliers.co.za/wp-content/uploads/2017/09/Marula-production-guidelines.pdf (accessed on 8 September 2020).
- Sclerocarya_Birrea. Available online: https://en.wikipedia.org/wiki/Sclerocarya_birrea (accessed on 10 September 2020).
- Raymon, A.; Sakthibalan, S.; Cinthal, C.; Subramaniaraja, R.; Yuvaraj, M. Enhancement and comparison of nano-ester insulating fluids. IEEE Trans. Dielectr. Electr. Insul. 2016, 23, 892–900. [Google Scholar] [CrossRef]
- Nerusu, N.; Narasimha Rao, K.V. Performance of nanoparticles (Al2O3) combined with mineral based lubricating oil in refrigeration and air-conditioning systems: A review. J. Adv. Res. Dyn. Control Syst. 2018, 10, 1741–1760. [Google Scholar]
- IEC. Insulating Liquids—Determination of the Breakdown Voltage at Power Frequency–Test Method, 3rd ed.; Standard IEC60156; IEC: Geneva, Switzerland, 2003. [Google Scholar]
- IEC. Standard Test Method for Determination of Water by Coulometric Karl Fischer Titration; Standard IEC60814; IEC: Geneva, Switzerland, 1994. [Google Scholar]
- IEC. Standard Test Method for Kinematic Viscosity of Transparent and Opaque Liquids (and Calculation of Dynamic Viscosity); Standard ASTM D445; IEC: Geneva, Switzerland, 2011. [Google Scholar]
- IEC. Standard Test Methods for Flash Point by Pensky-Martens Closed Cup Tester; Standard ASTM D93; IEC: Geneva, Switzerland, 2012. [Google Scholar]
- IEC. Standard Test Method for Acid and Base Number by Color Indicator Titration; Standard ASTM D974; IEC: Geneva, Switzerland, 2014. [Google Scholar]
- The Idea of a Probability Density Function. Available online: http://mathinsight.org/probability_density_function_idea (accessed on 15 November 2020).
- Sheldon Ross, M. Introduction to Probability and Statistics for Engineers and Scientists, 6th ed.; Academic Press: London, UK, 2020; pp. 1–687. [Google Scholar]
- Rajňák, M.; Kurimský, J.; Cimbala, R.; Čonka, Z.; Bartko, P.; Šuga, M.; Paulovičová, K.; Tóthová, J.; Karpets, M.; Kopčanský, P.; et al. Statistical analysis of AC dielectric breakdown in transformer oil-based magnetic nanofluids. J. Mol. Liq. 2020, 309. [Google Scholar] [CrossRef]
- Víctor, A.P.; García, B.; Carlos Burgos, J.; Ricardo, A. Enhancing transformer liquid insulation with nanodielectric fluids: State of the art and future trends. In Proceedings of the Advanced Research Workshop on Transformers, La Toja Island, Spain, 3–5 October 2016. [Google Scholar]
Figure 1.
Showing the different ranges of breakdown voltage at which, the MRO and MO have its % density.
Figure 1.
Showing the different ranges of breakdown voltage at which, the MRO and MO have its % density.

Figure 2.
Cumulative probability of breakdown instances of MRO showing wider range and MO showing linear range.
Figure 2.
Cumulative probability of breakdown instances of MRO showing wider range and MO showing linear range.

Figure 3.
Survival function showing the cumulative distribution of MRO and MO, for any positive number “T” surviving over the time “t”.
Figure 3.
Survival function showing the cumulative distribution of MRO and MO, for any positive number “T” surviving over the time “t”.

Figure 4.
Cumulative hazard of MRO and MO showing the integral of hazard function H(x) = −ln(1 − f(x)) which shows the probability of failure at time x has given survival until time x.
Figure 4.
Cumulative hazard of MRO and MO showing the integral of hazard function H(x) = −ln(1 − f(x)) which shows the probability of failure at time x has given survival until time x.

Figure 5.
Showing the endurance of breakdown voltage and probability of failure of MRO and MO for 30 days.
Figure 5.
Showing the endurance of breakdown voltage and probability of failure of MRO and MO for 30 days.

Figure 6.
Measured breakdown voltage distribution using Lagrange polynomial function is compared with the predicted breakdown voltage distribution using Gaussian function. (a) MRO, (b) MO.
Figure 6.
Measured breakdown voltage distribution using Lagrange polynomial function is compared with the predicted breakdown voltage distribution using Gaussian function. (a) MRO, (b) MO.

Figure 7.
% Density function of the breakdown voltage in different concentration of the Al2O3, (a) MRO, (b) MO.
Figure 7.
% Density function of the breakdown voltage in different concentration of the Al2O3, (a) MRO, (b) MO.

Figure 8.
Breakdown voltage density function in different concentration of the Al2O3, (a) MO, (b) MRO.
Figure 8.
Breakdown voltage density function in different concentration of the Al2O3, (a) MO, (b) MRO.

Figure 9.
Cumulative breakdown voltage hazard function in different concentration of the Al2O3 with Weibull fit showing the 95% confidence, (a) MRO, (b) MO.
Figure 9.
Cumulative breakdown voltage hazard function in different concentration of the Al2O3 with Weibull fit showing the 95% confidence, (a) MRO, (b) MO.

Figure 10.
Survivor breakdown voltage function in different concentration of the Al2O3 with Weibull fit showing the 95% confidence, (a) MRO, (b) MO.
Figure 10.
Survivor breakdown voltage function in different concentration of the Al2O3 with Weibull fit showing the 95% confidence, (a) MRO, (b) MO.


Figure 11.
Comparison of measured and predicted kinematic viscosity of MRO using Lagrange polynomial interpolation function and Fourier distribution function. The predicted value showing deviation of ±2 cSt and 0.6 ± 0.2 g/L from the measured value, (a) at 0 °C, (b) 30 °C, (c) 60 °C, (d) 90 °C, (e) 110 °C.


Figure 12.
Comparison of measured and predicted kinematic viscosity of MO using Lagrange polynomial interpolation function and Fourier distribution function. The predicted value showing deviation of ±1 cSt and 0.6 ± 0.2 g/L from the measured value, (a) at 0 °C, (b) 30 °C, (c) 60 °C, (d) 90 °C, (e) 110 °C.


Figure 13.
Distribution of kinematic viscosity of MRO as % density function.

Figure 14.
Distribution of kinematic viscosity of MO as % density function.

Figure 15.
Cumulative probability density function of MRO showing variation of kinematic viscosity in different temperature level.
Figure 15.
Cumulative probability density function of MRO showing variation of kinematic viscosity in different temperature level.

Figure 16.
Cumulative probability density function of MO showing variation of kinematic viscosity in different temperature level.
Figure 16.
Cumulative probability density function of MO showing variation of kinematic viscosity in different temperature level.

Figure 17.
Inverse cumulative probability of MRO showing the probability of data items with different survival rate.
Figure 17.
Inverse cumulative probability of MRO showing the probability of data items with different survival rate.

Figure 18.
Inverse cumulative probability of MO showing the probability of data items with different survival rate.
Figure 18.
Inverse cumulative probability of MO showing the probability of data items with different survival rate.

Figure 19.
Kinematic viscosity survival function of MRO showing the confidence of 95% fitted to the Weibull.
Figure 19.
Kinematic viscosity survival function of MRO showing the confidence of 95% fitted to the Weibull.

Figure 20.
Kinematic viscosity survival function of MO showing the confidence of 95% fitted to the Weibull.
Figure 20.
Kinematic viscosity survival function of MO showing the confidence of 95% fitted to the Weibull.

Figure 21.
Cumulative hazard of MRO showing the data points of kinematic viscosity under varying concentration of Al2O3 in different temperature levels.
Figure 21.
Cumulative hazard of MRO showing the data points of kinematic viscosity under varying concentration of Al2O3 in different temperature levels.

Figure 22.
Cumulative hazard of MO showing the data points of kinematic viscosity under varying concentration of Al2O3 in different temperature levels.
Figure 22.
Cumulative hazard of MO showing the data points of kinematic viscosity under varying concentration of Al2O3 in different temperature levels.

Figure 23.
Comparison of measured and predicted flash point and fire point of MRO and MO using Lagrange polynomial interpolation function and Fourier distribution function. The predicted value showing deviation of ±3 °C and ±0.2 g from the measured value, (a) flash point of MRO, (b) fire point of MRO, (c) flash point of MO, (d) fire point of MO.

Figure 24.
Distribution of data point of flash points of MRO and MO, (a) showing the % density plot, (b) showing the cumulative probability with survival rate between the range of 40–60% probability.
Figure 24.
Distribution of data point of flash points of MRO and MO, (a) showing the % density plot, (b) showing the cumulative probability with survival rate between the range of 40–60% probability.

Figure 25.
Flash point of MRO and MO with (a) survival, (b) hazard function with 95% confidence interval fitted to the Weibull.
Figure 25.
Flash point of MRO and MO with (a) survival, (b) hazard function with 95% confidence interval fitted to the Weibull.

Figure 26.
Flash point of MRO and MO with (a) survival, (b) hazard function with 95% confidence interval fitted to the Weibull.
Figure 26.
Flash point of MRO and MO with (a) survival, (b) hazard function with 95% confidence interval fitted to the Weibull.


Table 1.
Dielectric characteristics of host fluids.
| Host Fluids | Breakdown Voltage (KV) | Kinematic Viscosity (cSt) | Pour Point (°C) | Flash Point (°C) | Fire Point (°C) | Thermal Conductivity (W/m-K) | Moisture Content (ppm) | Acidity (mg KOH/g) |
|---|---|---|---|---|---|---|---|---|
| MRO | 47 | 52 | −23 | 225 | 237 | 0.182 | 84.237 | 0.020 |
| MO | 32 | 23 | −17 | 153 | 158 | 0.130 | <9.561 | 0.010 |
Table 2.
Enhancement of Host Fluids using Al2O3 Nanoparticle.
| Concentration of Al2O3 (g/L) | Breakdown Voltage of MRO (kV) | % Enhanced | Breakdown Voltage of MO (kV) | % Enhanced |
|---|---|---|---|---|
| 0 | 47 | 0 | 32 | 0 |
| 0.1 | 51 | 7.84 | 34 | 5.88 |
| 0.25 | 54 | 12.96 | 37 | 13.51 |
| 0.5 | 59 | 20.34 | 39 | 17.95 |
| 0.75 | 64 | 26.56 | 42 | 31.91 |
| 1 | 60 | 21.67 | 40 | 27.27 |
| 1.25 | 58 | 18.97 | 38 | 21.95 |
| 1.5 | 54 | 12.96 | 33 | 20.00 |
| 1.75 | 45 | −4.44 | 31 | 11.11 |
| 2 | 39 | −20.51 | 30 | −6.67 |
Table 3.
Variation of Gaussian prediction of the breakdown voltage of MRO and MO with 95% confidence bound with conformity more than 98%.
Table 3.
Variation of Gaussian prediction of the breakdown voltage of MRO and MO with 95% confidence bound with conformity more than 98%.
| Oil | Confidence | R2 | RMSE | Max Measured (kV) | Max Predicted (kV) | Deviation (kV) |
|---|---|---|---|---|---|---|
| MRO | 95% | 0.98 | 0.97 | 65.94 | 65.12 | 0.82 |
| MO | 95% | 0.98 | 0.61 | 44.52 | 44.28 | 0.24 |
Table 4.
Variation of kinematic viscosity (cSt) of MRO under the influence of Al2O3 concentration and Temperature with 95% confidence.
Table 4.
Variation of kinematic viscosity (cSt) of MRO under the influence of Al2O3 concentration and Temperature with 95% confidence.
| Conc (g/L) | Temperature | Goodness of Fit | ||||||||||
|---|---|---|---|---|---|---|---|---|---|---|---|---|
| 0 °C | % Decrement | 30 °C | % Decrement | 60 °C | % Decrement | 90 °C | % Decrement | 110 °C | % Decrement | |||
| R2 | RMSE | |||||||||||
| 0.1 | 52 | 0 | 45 | 0 | 37 | 0 | 20 | 0 | 13 | 0 | 0.99 | 2.227 |
| 0.25 | 47 | −10.64 | 41 | −9.76 | 34 | −8.82 | 19 | −5.26 | 11 | −18.18 | 0.98 | 2.166 |
| 0.5 | 43 | −20.93 | 39 | −15.38 | 31 | −19.35 | 15 | −33.33 | 10 | −30.00 | 0.99 | 1.839 |
| 0.75 | 37 | −40.54 | 27 | −66.67 | 24 | −54.17 | 12 | −66.67 | 8 | −62.50 | 0.96 | 2.964 |
| 2 | 39 | −3317.33 | 31 | −45.16 | 28 | −32.14 | 21 | 4.76 | 13 | 0 | 0.92 | 2.685 |
Table 5.
Factors associated with Fourier distribution for MRO with 95% confidence.
| Oil and Temperature | a0 | a1 | b1 | w | R2 |
|---|---|---|---|---|---|
| MRO 0 °C | 43.22 | 5.499 | 2.257 | 4.291 | 0.9628 |
| MRO 30 °C | 37.21 | −2.851 | 8.326 | 6.61 | 0.7669 |
| MRO 60 °C | 30.03 | 1.862 | 5.246 | 5.615 | 0.9176 |
| MRO 90 °C | 5.391 × 10⁸ | −5.391 × 10⁸ | 1.113 × 10⁵ | −0.0003764 | 0.8396 |
| MRO 110 °C | 6.027 × 10⁷ | −6.027 × 10⁷ | 2.871 × 10⁴ | −0.0009218 | 0.8421 |
Table 6.
Variation of kinematic viscosity (cSt) of MO under the influence of Al2O3 concentration and temperature with 95% confidence.
Table 6.
Variation of kinematic viscosity (cSt) of MO under the influence of Al2O3 concentration and temperature with 95% confidence.
| Conc (g/L) | Temperature | Goodness of Fit | ||||||||||
|---|---|---|---|---|---|---|---|---|---|---|---|---|
| 0 °C | % Decrement | 30 °C | % Decrement | 60 °C | % Decrement | 90 °C | % Decrement | 110 °C | % Decrement | |||
| R2 | RMSE | |||||||||||
| 0.1 | 22 | 0 | 20 | 0 | 15 | 0 | 10 | 0 | 7 | 0 | 0.99 | 0.21 |
| 0.25 | 21 | −4.76 | 21 | 4.76 | 17 | 11.76 | 11 | 9.09 | 8 | 12.50 | 0.99 | 0.30 |
| 0.5 | 18 | −22.22 | 15 | −33.33 | 11 | −36.36 | 8 | −25.00 | 6 | −16.67 | 0.99 | 0.23 |
| 0.75 | 15 | −46.67 | 13 | −53.85 | 10 | −50.00 | 7 | −42.86 | 4 | −75.00 | 0.99 | 0.51 |
| 2 | 19 | −15.79 | 16 | −25.00 | 14 | −7.14 | 12 | 16.67 | 9 | 22.22 | 0.97 | 0.76 |
Table 7.
Factors associated with Fourier distribution for MO with 95% confidence.
| Oil and Temperature | a0 | a1 | b1 | w | R2 |
|---|---|---|---|---|---|
| MO 0 °C | 3.6 × 10⁸ | −3.6 × 10⁸ | 9.4 × 10⁴ | −0.0 | 0.73 |
| MO 30 °C | 17.2 | 4.1 | 1.9 | 4.8 | 0.97 |
| MO 60 °C | 13.4 | 3.0 | 2.7 | 5.6 | 0.97 |
| MO 90 °C | 1.1 × 10⁶ | −1.1 × 10⁶ | 4.3 | −0.0 | 0.85 |
| MO 110 °C | 3.5 × 10⁷ | −3.5 × 10⁷ | −2.5 × 10⁴ | 0.0 | 0.77 |
Table 8.
Flash and fire points of MRO and MO under various concentration of Al2O3.
| Concentration of Al2O3 (g/L) | MRO | MO | ||||||
|---|---|---|---|---|---|---|---|---|
| Flash Point (°C) | Fire Point(°C) | Absolute Difference | Relative Difference | Flash Point (°C) | Fire Point (°C) | Absolute Difference | Relative Difference | |
| 0 | 225 | 237 | 12 | 5.19 | 153 | 158 | 5 | 3.22 |
| 0.1 | 225 | 240 | 15 | 6.45 | 152 | 159 | 7 | 4.50 |
| 0.25 | 231 | 252 | 21 | 8.70 | 155 | 161 | 6 | 3.80 |
| 0.5 | 239 | 263 | 24 | 9.56 | 159 | 166 | 7 | 4.31 |
| 0.75 | 257 | 291 | 34 | 12.41 | 163 | 171 | 8 | 4.79 |
| 1 | 254 | 264 | 10 | 3.86 | 161 | 168 | 7 | 4.26 |
| 1.25 | 246 | 258 | 12 | 4.76 | 154 | 161 | 7 | 4.44 |
| 1.5 | 241 | 248 | 7 | 2.86 | 148 | 154 | 6 | 3.97 |
| 1.75 | 237 | 241 | 4 | 1.67 | 143 | 148 | 5 | 3.44 |
| 2 | 231 | 234 | 3 | 1.29 | 136 | 140 | 4 | 2.90 |
Table 9.
Factors associated with the predicted Fourier distribution function of MRO with 95% confidence.
Table 9.
Factors associated with the predicted Fourier distribution function of MRO with 95% confidence.
| Parameter | a0 | a1 | b1 | w | R2 |
|---|---|---|---|---|---|
| MRO Flash Point | 241.6 | −11.2 | −11.9 | 4.8 | 0.82 |
| MRO Fire Point | 263.7 | −14.2 | −20.7 | 5.6 | 0.60 |
| MO Flash Point | −2.226 × 10⁹ | 2.26 × 10⁹ | 3.421 × 10⁵ | 0 | 0.63 |
| MO Fire Point | 164.2 | −5.6 | −5.242 | 5.3 | 0.70 |
Publisher’s Note: MDPI stays neutral with regard to jurisdictional claims in published maps and institutional affiliations. |
© 2021 by the authors. Licensee MDPI, Basel, Switzerland. This article is an open access article distributed under the terms and conditions of the Creative Commons Attribution (CC BY) license (http://creativecommons.org/licenses/by/4.0/).
Share and Cite
MDPI and ACS Style
Raj, R.A.; Samikannu, R.; Yahya, A.; Mosalaosi, M. Investigation of Survival/Hazard Rate of Natural Ester Treated with Al2O3 Nanoparticle for Power Transformer Liquid Dielectric. Energies 2021, 14, 1510. https://doi.org/10.3390/en14051510
AMA Style
Raj RA, Samikannu R, Yahya A, Mosalaosi M. Investigation of Survival/Hazard Rate of Natural Ester Treated with Al2O3 Nanoparticle for Power Transformer Liquid Dielectric. Energies. 2021; 14(5):1510. https://doi.org/10.3390/en14051510
Chicago/Turabian StyleRaj, Raymon Antony, Ravi Samikannu, Abid Yahya, and Modisa Mosalaosi. 2021. "Investigation of Survival/Hazard Rate of Natural Ester Treated with Al2O3 Nanoparticle for Power Transformer Liquid Dielectric" Energies 14, no. 5: 1510. https://doi.org/10.3390/en14051510
Note that from the first issue of 2016, this journal uses article numbers instead of page numbers. See further details here.