
Effect of LCA Data Sources on GBRS Reference Values: The Envelope of an Italian Passive House

Institute of Sustainability in Civil Engineering (INaB), RWTH Aachen University, Mies-van-der-Rohe-Str. 1, 52074 Aachen, Germany
Energies 2021, 14(7), 1883; https://doi.org/10.3390/en14071883
Submission received: 18 January 2021
/
Revised: 17 March 2021
/
Accepted: 19 March 2021
/
Published: 29 March 2021
(This article belongs to the Special Issue Life Cycle Assessment of Sustainable Energy System)
Abstract
:Scientific literature provides evidence that mitigating the effects of a building’s operation does not in itself ensure an overall improvement in its environmental performance. A Life Cycle Assessment (LCA) plays a key role in gauging the overall environmental performance of a building although several authors argue that the lack of LCA threshold values makes it difficult to compare design options or measure whether reduced impact targets are achieved. This has led the Green Building Rating Systems (GBRS) to include the LCA within their evaluation criteria and, in like Active House (AH), establish threshold values of the main impact categories to quantify the level of performance achieved. Since the reliability of the data sources is a crucial issue for applying the LCA method, the effectiveness of their implementation within the GBRS also strictly depends on the origin of the impact values. To quantify the extent to which the source affects the impacts calculated by the LCA threshold value in AH, the present study compared the outcomes of two assessments carried out in parallel using two different data sources: AH–LCA evaluation tool v.1.6 and the Environmental Product Declaration (EPD). A Passive House (PH)-compliant, small residential building was selected as a case study, as this is a standard that excels in ultra-low-energy performance. Moreover, given the crucial role that the envelope plays in the PH standard, the analysis was undertaken on the envelope of a PH-compliant building located in Northern Italy. To stress the influence of embedded effects in a Passive House, the assessment focused on the production and end-of-life stages of building materials. The comparison showed a relevant difference between the two scenarios for all the environmental indicators: e.g., deviations of 10% for Global Warming Potential, 20% for Acidification Potential and Eutrophication Potential, and 40–50% for Renewable Primary Energy.
1. Introduction
1.1. Background
The built environment is one of the key areas in which we must improve in order to move towards the target of limiting the global temperature rise to 1.5 °C, as required by the Paris Agreement. In fact, in Europe, about 19% of all energy-related GHG and 36% of CO2 emissions come from the building sector [1]. As a result, increasing energy efficiency in the building operation phase is considered one of the first issues to be addressed by governments. Indeed, a key pillar of the European Union (EU) climate and energy strategy is the reduction in energy demand by adopting energy efficiency policies to create buildings with high energy performance levels and very low energy consumption (e.g., Passive House target) [2]. Passive house is considered one of the most stringent energy performance standards and a suitable strategy for switching to a low carbon economy by 2050.
However, the resulting improved operational performance often entails the use of an increasing number of materials, components, equipment and higher-performance devices. This in turn increases demand for energy-intensive devices, which leads to a subsequent rise in the use of primary resources and emissions compared to the traditional devices they replaced [3].
While a building’s operational phase is often identified in the literature as a predominant component in its overall energy–environment balance, several scientific studies have recently revised this assumption. In fact, they show that the lower the energy requirement of a building when in use, the greater the global impact of the energy contribution of material purchases, component production and assembly phases [4,5]. High energy-efficient buildings, such as those that comply with the nearly Zero Energy Building (nZEB) or Passive House standards, are particularly affected by this trend [6].
In the same direction, a review of life cycle studies has revealed that in a low-energy building, the embodied phase has a deeper impact than the operating energy. More specifically, the work pointed out that in a passive house, the embodied energy ranged between 44% and 56% of the total primary life cycle energy demand [5].
A reliable and realistic environmental assessment must consider not only the effect of a building’s operation but also the “embedded impact” caused by its constituent materials and components to avoid triggering a “rebound” effect, better known as the “Jevons paradox”, according to which improvements made to achieve resource efficiency could increase rather than decrease its consumption [7,8].
Against this background, it is essential to evaluate building performance from a broader perspective than simply energy efficiency. Indeed, in addition to energy, the many building energy codes and certifications developed across the world between 2014 and 2019 have also included environmental-related issues [9].
In line with these regulations, the so-called Green Building Rating System (GBRS) carries out multi-criteria evaluations of a building’s environmental performance according to the schemes to which they belong.
A GBRS is a voluntary certification systems that measures the environmental performance of a building at different stages of its life cycle: from energy needs to water consumption and waste disposal [10]. It expresses a rating as a “score” that summarizes the performance gap between the benchmarks set by the system for a large set of environmental features and the outcome of the assessment performed on the building. The assessment scheme used by most GBRSs includes four main elements: a specific set of environmental categories, a performance measurement scoring system, a weighting system and an output. While all refer to a similar scheme and largely cover the same evaluation areas, each system may differ in several significant respects, especially concerning the specific methods for assessing environmental performance [11].
1.2. LCA Data Source within GBRS
GBRSs are essential for supporting high energy-efficient buildings, such as those that are nZEB or Passive House standard compliant in the path towards full sustainability. In addition, there is also a need to gauge a building’s environmental effect over its life cycle “from cradle to grave”, which an Life Cycle Assessment (LCA) method can do [12,13].
LCAs are, in fact, integrated within several GBRS rating schemes, and are mandatory in some [14,15,16], such as the DGNB (Deutsche Gesellschaft für Nachhaltiges Bauen) [17], BREEAM (Building Research Establishment Environmental Assessment Method) and HQE (Haute Qualité Environnementale) and Active House. Additionally, the Level(s) scheme, the voluntary EU framework of core sustainability indicators, strongly suggests their use [18,19].
Anand et al. [20] assert that LCA integration within GBRS is one of two areas that has led to a jump in publications on the topic from slightly more than 90 articles in 2011 to about 250 in 2015. This also confirms the high potential for integration between the two systems.
Although these rating systems provide good support for the design of ecological buildings, they have disadvantages. One of them is that the comparability is limited due to differences in approach, (e.g., in the scope of the evaluation and the identification of indicators) [21]. Moreover, the lack of a common method means that LCA studies are inconsistent, which undermines the possibility that policy makers will use these studies to set environmental goals for buildings, or that architects and other construction players will position themselves in the market [22].
To assess how far designers can minimize the impacts of newly developed projects and to motivate further reductions, better data and established benchmarks are necessary [23].
At the early stage, benchmarking references give useful feedback on environmental issues during decision-making and at the same time can determine thresholds or reference values for future buildings [24]. In particular, Active House (AH), developed by the Active House Alliance in 2011 and launched as a label in 2016, is considered to be a holistic ranking system that evaluates next-generation sustainable buildings by combining three areas—thermal comfort, energy efficiency and environment impact––and adopts a simple ranking system [25]. Moreover, AH gives great importance to environmental loads based on a LCA, by providing a library of the environmental effects of building materials and equipment and setting benchmarks targets for 6 principal indicators [26].
However, the data provided by the Active House library is generic. Compared to the data that academics and consultancy firms commonly supply to specialized LCA databases (e.g., Ecoinvent centre, PE International, and the European Commission Joint Research Centre), it does not specify the sources or the assumptions and approximations adopted in computing its indicators. Moreover, the data sources from which the information on the effects of building materials and products on the environment is obtained is by far the main factor that affects the reliability of the LCA outcome. This problem has been investigated in literature for several years [27,28,29,30].
To provide more reliable and accurate LCA results, the International Reference Life Cycle Data (ILCD) system guide recommends the use of specific rather than generic data, i.e., data provided by the industry sector through an Environmental Product Declaration (EPD) [31].
1.3. Aim and Scope of the Work
The background context described above leads to the following conclusions. First, the energy balance of a low-energy building like a Passive House, which focuses mainly on operational energy demands, leads to the neglect of relevant elements like Embodied Impacts (EI) thereby significantly influencing the perception of the overall environmental behaviour. Second, a LCA provides an effective means to establish a reliable and realistic balance of a building’s overall environmental impact, and the integration of an LCA in a GBRS provides substantial support for measuring the environmental performance of a building. In addition, the integration of an LCA threshold or reference value in a GBRS represents a valid yardstick to evaluate how efficiently a building’s performance (resource use and effect on the environment) was reached. Nevertheless, LCA results strictly depend on the sources of the product and process emission parameters [35]. A reliable LCA requires robust data sources.
By estimate the effects on GBRS threshold values, this study sought to investigate the extent to which the selection of different LCA data sources influenced the final EI value of a Passive House envelope. For this purpose, AH libraries and the Environmental Product Declarations (EPD) were the two data sources selected for comparison.
The study addressed the envelope of a Passive House standard-compliant small residential building located close to the city of Biella in Northern Italy.
The comparison of the LCA resulting from different data sources was limited to the representative external opaque envelope since it contains a wide combination of structural, insulation and finishing components and plays a crucial role in shaping the energy profile of the building.
The assessment was made by adopting the Active House GBRS since it provides suitable features compared to other GBRSs. Indeed, the AH scheme has a simple evaluation structure that integrates the LCA approach in the assessment of building sustainability [25], and includes reference values for each of the six most common environmental impact indicators. A library of the main indicators is provided for some of the most common building materials, including data related to the production and disposal of each of these materials. However, data related to the transport and maintenance stages is not provided. The contribution of maintenance activities during and beyond the end of the building’s useful life to the environment constitutes an interesting topic on which we wish to work in a future study.
2. Active House Scheme
Active House [26] was developed by the Active House Alliance in 2011, while the label was launched in 2016. AH was chosen for this study due to its simple evaluation structure. Despite the fact that only 17 criteria were used to perform the assessment, AH can be considered a solid and reliable GBRS since it covers all the criteria included in the vast majority of current ratings systems. In addition, an AH assessment can be performed without specialized consultants, thus reducing the time and cost compared to the majority of other rating systems.
The AH assessment criteria are divided into 17 criteria in three main categories: Comfort, Energy and Environment as shown in Table 1. Although it was designed to be particularly suitable for assessing small buildings, AH gives great importance to embodied emissions of materials and components through an LCA- or EPD-based analysis.
The score for each group ranges from 4 (minimum) to 1 (maximum). The results achieved are displayed graphically in a Kiviat diagram called “the radar”, which represents the overall performance of the building. It also makes it easy to compare different scenarios in the design phase, thereby providing a useful tool even for the renovation.
In particular, the criteria established by AH for the “environment” category of the assessment concern the entire life of the building according to the EN 15804 standard, which breaks down the assessment into the following stages:
- Production of building materials,
- Construction processes,
- Operation and maintenance of the building’s construction and fabric,
- End of life of the building’s materials, and
- Transport and site processes (may be omitted).
For this purpose, a library of the main impact indicators for some of the most common building materials was supplied, including data related to the production and end-of-life stages of each of them except for transport and maintenance.
The evaluation was based on Global Warming Potential (GWP), Ozone Depletion Potential (ODP), Acidification Potential (AP), Eutrophication Potential (EP) and Photochemical Oxidation (POCP). In addition, the building’s primary energy consumption was also taken into account.
To perform the rating, Active House set the levels of each indicator as shown in Table 2 below.
3. Materials and Method
The methodology used to conduct the study involved four steps.
- First step: definition of the environmental profile of the envelope of CASAUNICA, adopting the AH library as an LCA data source;
- Second step: progressive enhancement of the thermal insulation levels of external walls, considering their influence on the Passive House performance;
- Third step: estimation of the possible effects on the Embedded Impacts (EI) due to the solutions in stage 2; and
- Fourth step: investigation of how LCA data affected benchmark definition, assuming two different data sources, AH library and EPDs.
3.1. The Case Study: CASAUNICA
A prototype of an innovative high-energy-efficient residential building in Biella, Italy, was selected as a test case for the study. Biella is a city in the northern Piedmont region (45°33′58.68″ north latitude and 8°03′17.96″ east longitude) belonging to climate zone E and having 2.589 degree days according to the climate-zone subdivision in Italian Presidential Decree (DPR) 26/08/1993 n.412.
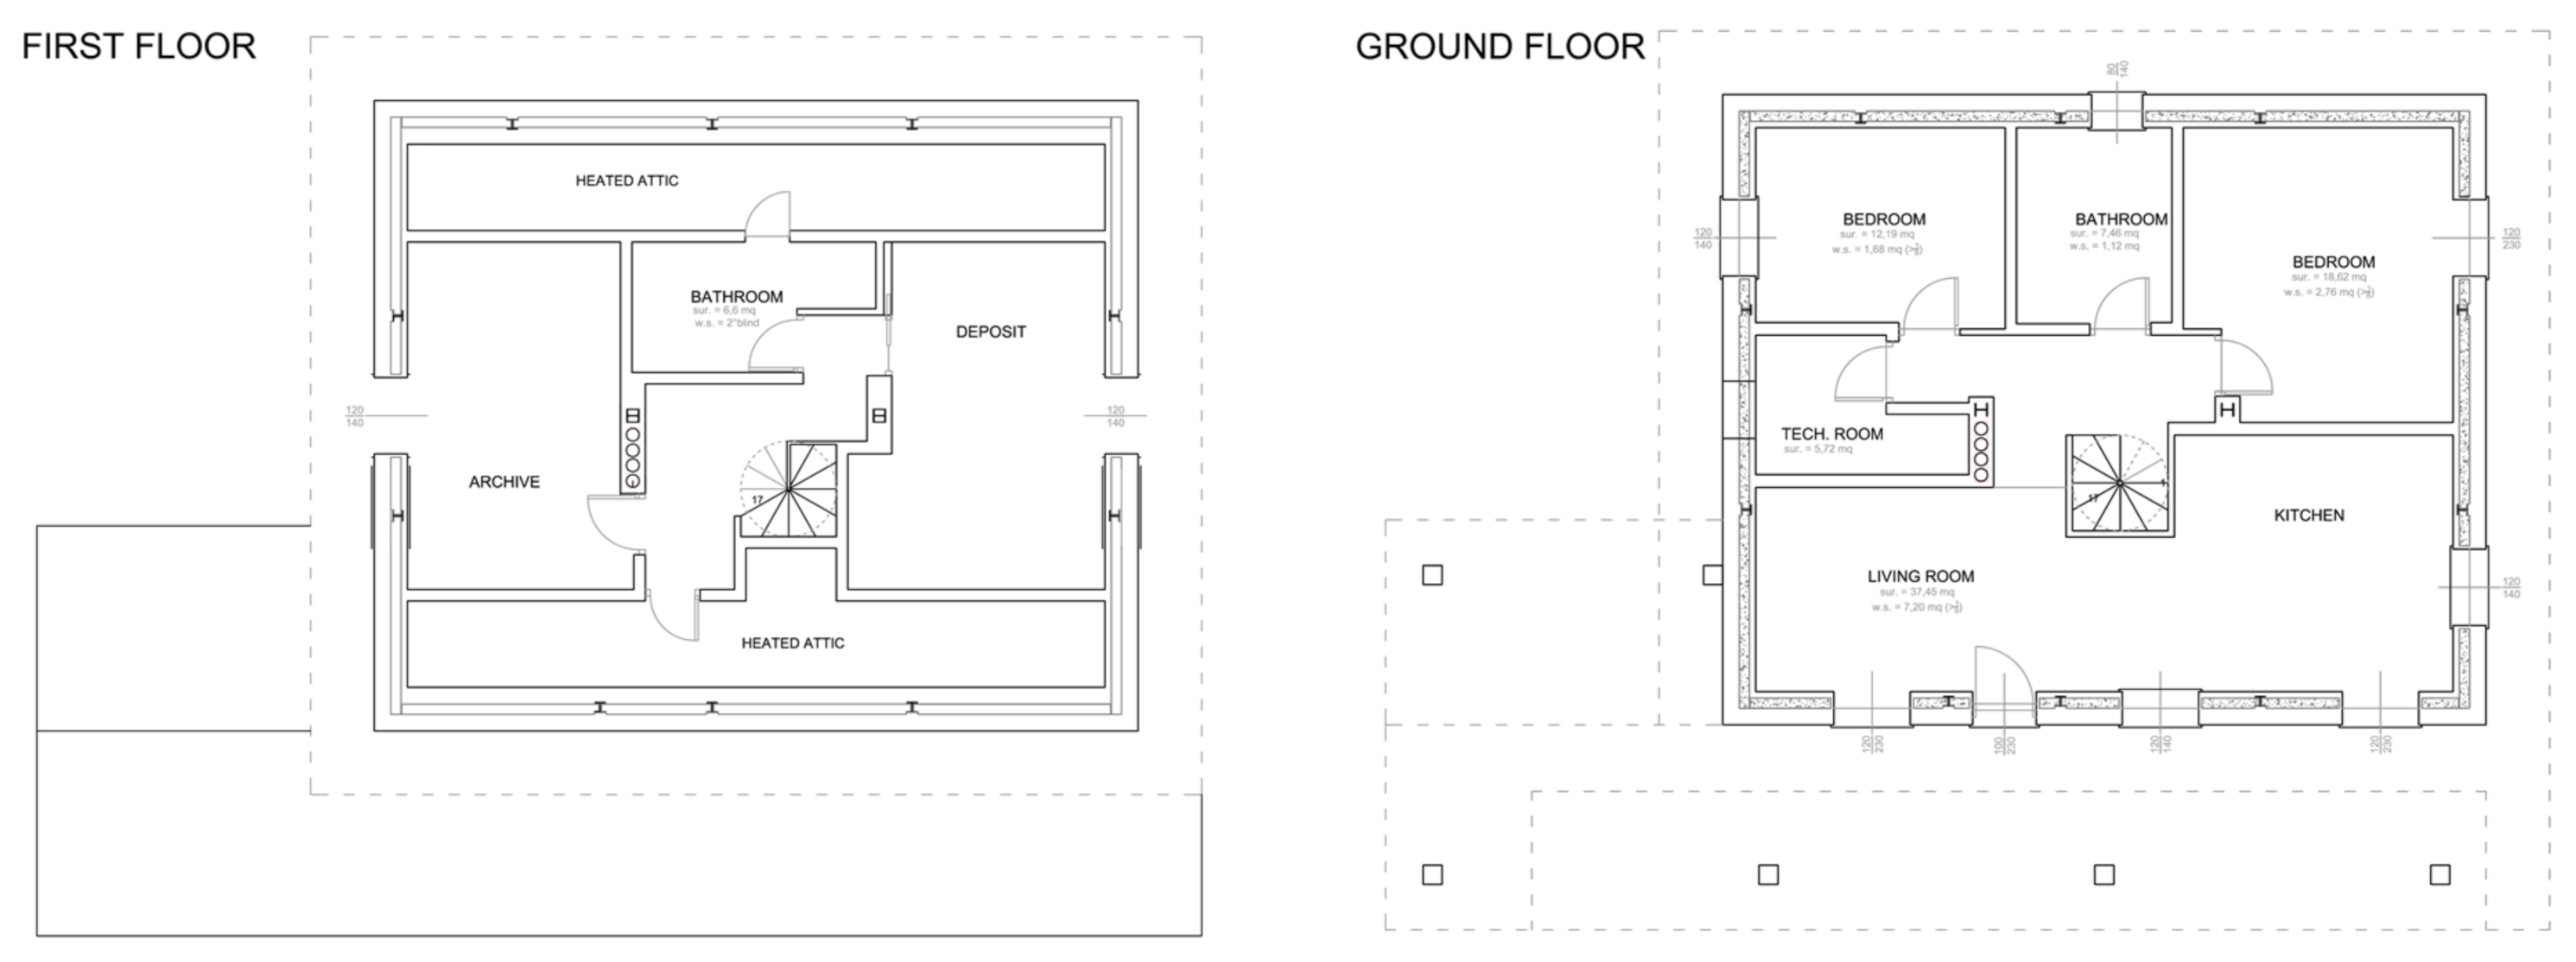
The two-storey “CASAUNICA” building has a total floor area of 190 m2, arranged as shown in Figure 1. The building’s energy requirement (including the main end uses of heating, domestic hot water, cooling, ventilation and lighting) amounts to 13 kWh per year/m2, calculated according to EPBD (Annex A) [36]. In addition to the very effective passive strategies that inspired its design (south-facing main living spaces, efficient envelope and heating recovery ventilation system), CASAUNICA is equipped with PV collectors, which allows the building to use renewable sources to produce more energy than it consumes. A sophisticated home automation system assures energy management and excellent indoor comfort features.
In order to obtain effective thermal insulation, the vertical bearing structure, arranged around the perimeter and comprised of galvanized steel pillars and reinforced concrete plates, is fully coated with 250 mm Expanded Polystyrene (EPS) panels on the outside and by an additional inner EPS/mineral wool/plasterboard sandwich skin. The windows have composite polyurethane/wooden frames and low-emissive, Argon gas-filled triple glazing, which gives a transmittance value (Ug) of 0.4 Wm2 K.
The pitched roof is made of laminated wooden rafters filled with mineral wool (20 cm) and insulated with layers of polyurethane (10 cm) and polyurethane with graphite (10 cm) (Table 3).
The installed equipment includes
- -
- 3.6. kWp CIS photovoltaic flat panels, located on the shed roof (180° south exposures, 25° tilt), which produce about 4400 kWh/year;
- -
- Air–air heat pump for heating, cooling, domestic hot water, dehumidification (summer) and renewal and purification by means of electrostatic filters;
- -
- 180 L water boiler, acting as storage for domestic hot water and as an energy recovery unit for both the exhaust air and the incoming outside air (when appropriate).
3.2. First Stage of the Study: Environmental Profile of CASAUNICA within Active House Protocol
In line with the aim of the study, the environmental profile of the envelope of CASAUNICA was first defined with the AH dataset.
With respect to the principal five life cycle phases defined by the EN 15978––product (A1–A3), construction process (A4–A5), use (B1–B7), end of life (C1–C4) and benefit and loads beyond building life cycle (D)––the assessment was focused on A1–A3, the manufacturing process of the building materials used in the case study’s technical solutions, and on C1–C4. The indicators assessed were Global Warming Potential (GWP), Ozone Depletion Potential (ODP), Acidification Potential (AP), Eutrophication Potential (EP) and Photochemical Oxidation (POCP). In addition, primary energy non-renewable (PENR) and primary energy renewable (PER) kWh were also taken into account. The calculated impact values for the envelope elements are displayed in Table 5 below.
Subsequently, from the impact indicators obtained through the AH libraries (Table 6) was calculated the environmental loads’ scores of the case study in its original configuration (considering Ext. Wall 1 for the outer envelope), as provided by Active House (Table 2). Table 6 reports the scores obtained in each of the 7 categories, expressed in impact unit per m2 of floor area over an estimated service life of 50 years.
Figure 2 gives a further detailed account of the AH score for the “environmental loads” category for the CASAUNICA obtained using the Active House database.
3.3. Second Stage: CASAUNICA Alternative Configurations
Given the relevant role that the envelope had in the PH approach, in particular considering the percentage contribution of the vertical external wall to the total impact values (26.9% of GWP, see Table 5), a second stage of the work concerned a progressive enhancement of the thermal insulation levels of the case study by simulating a further two different configurations for the external vertical wall.
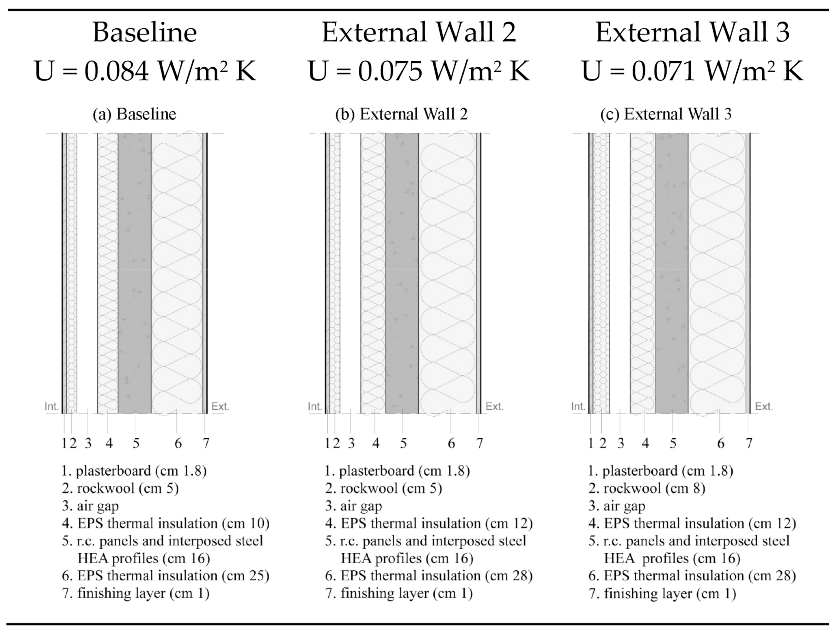
As shown in Figure 3, the three configurations were obtained by modifying the thickness of the insulation layers, assuming that the decrease in the U value of the envelope would bring down the operational energy needs of the building.
The different configurations considered for the external wall have the following U values:
- 0.084 Wm2 K (CASAUNICA standard solution, called Baseline);
- 0.075 Wm2 K (Ext. Wall 2);
- 0.071 Wm2 K (Ext. Wall 3).
The % ratios of the U-value variation are, respectively, −10.7% (Ext. Wall 2 compared to Baseline), −15.5% (Ext. Wall 3 compared to Baseline) and −5.3% (Ext. Wall 3 compared to Ext. Wall 2).
Table 7 illustrates the simulated operating performance (Energy and GHG emissions) of the building, assuming the two additional configurations for the outer envelope.
3.4. Third Stage: EI Effects by Progressive Insulation Enhancement of the External Wall
The third stage of the study aimed at observing how the OE needs of the building influenced the environmental profile of the external walls.
Two increasing stages of CASAUNICA envelope thermal performance were simulated by thickening the insulation layers. The first one (U = 0.075 W/m2 K) improved this by 10.7% compared to the baseline configuration (U = 0.084 W/m2 K).
A further improvement pushed the envelope U value to 0.071 W/m2 K, which is 5.3% more than the previous simulation and +15.5% compared with the CASAUNICA original situation.
3.5. Fourth Stage: How the LCA Data Source Affected the AH Score
Given the relevant role that the data source has on the robustness of the LCA, the final part of the analysis was directed at finding out how the LCA data sources influenced the environmental scores of the AH. As a consequence, a second assessment was carried out by replacing the impact indicators of the materials or products that emerged from the Active House library (Figure 4) with those claimed by manufacturers in the specific Environmental Product Declarations (EPDs). The EPDs collected within this study were those made available by the product manufacturers as a cradle-to-gate LCA (EN 15804 compliant), thus including the compulsory stages A1 to A3 of the environmental assessment but not the further life cycle stages. The indicators taken into account are only common to both data sources.
The values obtained from calculating the environmental performances of the tested configurations are shown in Table 9.
4. Results: Environmental Loads of CASAUNICA by AH Rating
In the first step, the study defined the environmental profile of the outer envelope of the CASAUNICA Passive House in its original configuration (Table 5) through the Active House protocol, in order to verify the related scores as reported in Table 6 and Figure 2. Regarding the environmental loads, the case study showed good results for almost all the Active House benchmarks. In particular, three of the five indicators (ODP, EP and POCP) reached level 1 (the best); however, for GWP and AP the case study reached level 2.
Furthermore, the assessment of the whole envelope (Figure 4) indicated that the opaque walls had a relevant influence on all 5 environmental indicators: EP, 15.3%; AP, 19.3%; GWP, 19.8%; POCP, 22%; and ODP, 29.7%.
In view of this and the aim of exploring the correlation between Operational Energy and Embodied Impacts, the second stage estimated the possible effects on the EI calculation resulting from the improvement in the thermal performance of the external wall by increasing the thickness of the insulation layers. Two different simulated scenarios (−10.7% and −15.5%) revealed that a 10.7% improvement in the thermal performance of the external wall compared to baseline (U = 0.084–0.075 W/m2 K) caused a drop in total primary energy demand (TPED) of only 1.3% while generating an average rise of around 6% in the environmental indexes. While the additional improvement of 15.5% compared to baseline resulted in just ca. 2% of the TPED, it led to an increase from 8.4 to 13.9% of the production stage impacts (Table 10). In line with several authors, this confirmed that an excessive increase in energy efficiency could invalidate the efficiency objectives, thereby generating the overall greatest environmental impacts [15].
Accordingly, it follows that a design vision must strike the optimal balance between operational energy and life cycle impact reduction.
The second part of the assessment addressed two relevant questions: first, the influence of two different data sources (AH library and manufacturer EPDs) on the impact indicators; second, the comparability of those indicators with the threshold values adopted by the AH system. The evaluation considered only the life cycle phases: product and end of life.
First, the environmental indicators were calculated for the three wall configurations using both data sources. This comparative assessment between the environmental indicators obtained from the different data sources did show relevant divergences for three out of four of the impact categories. As displayed in Table 11, the values differ for four out of seven: ODP showed the maximum difference (64.7%) followed by EP (15.6%), GWP (8.6%) and AP (2.6%).
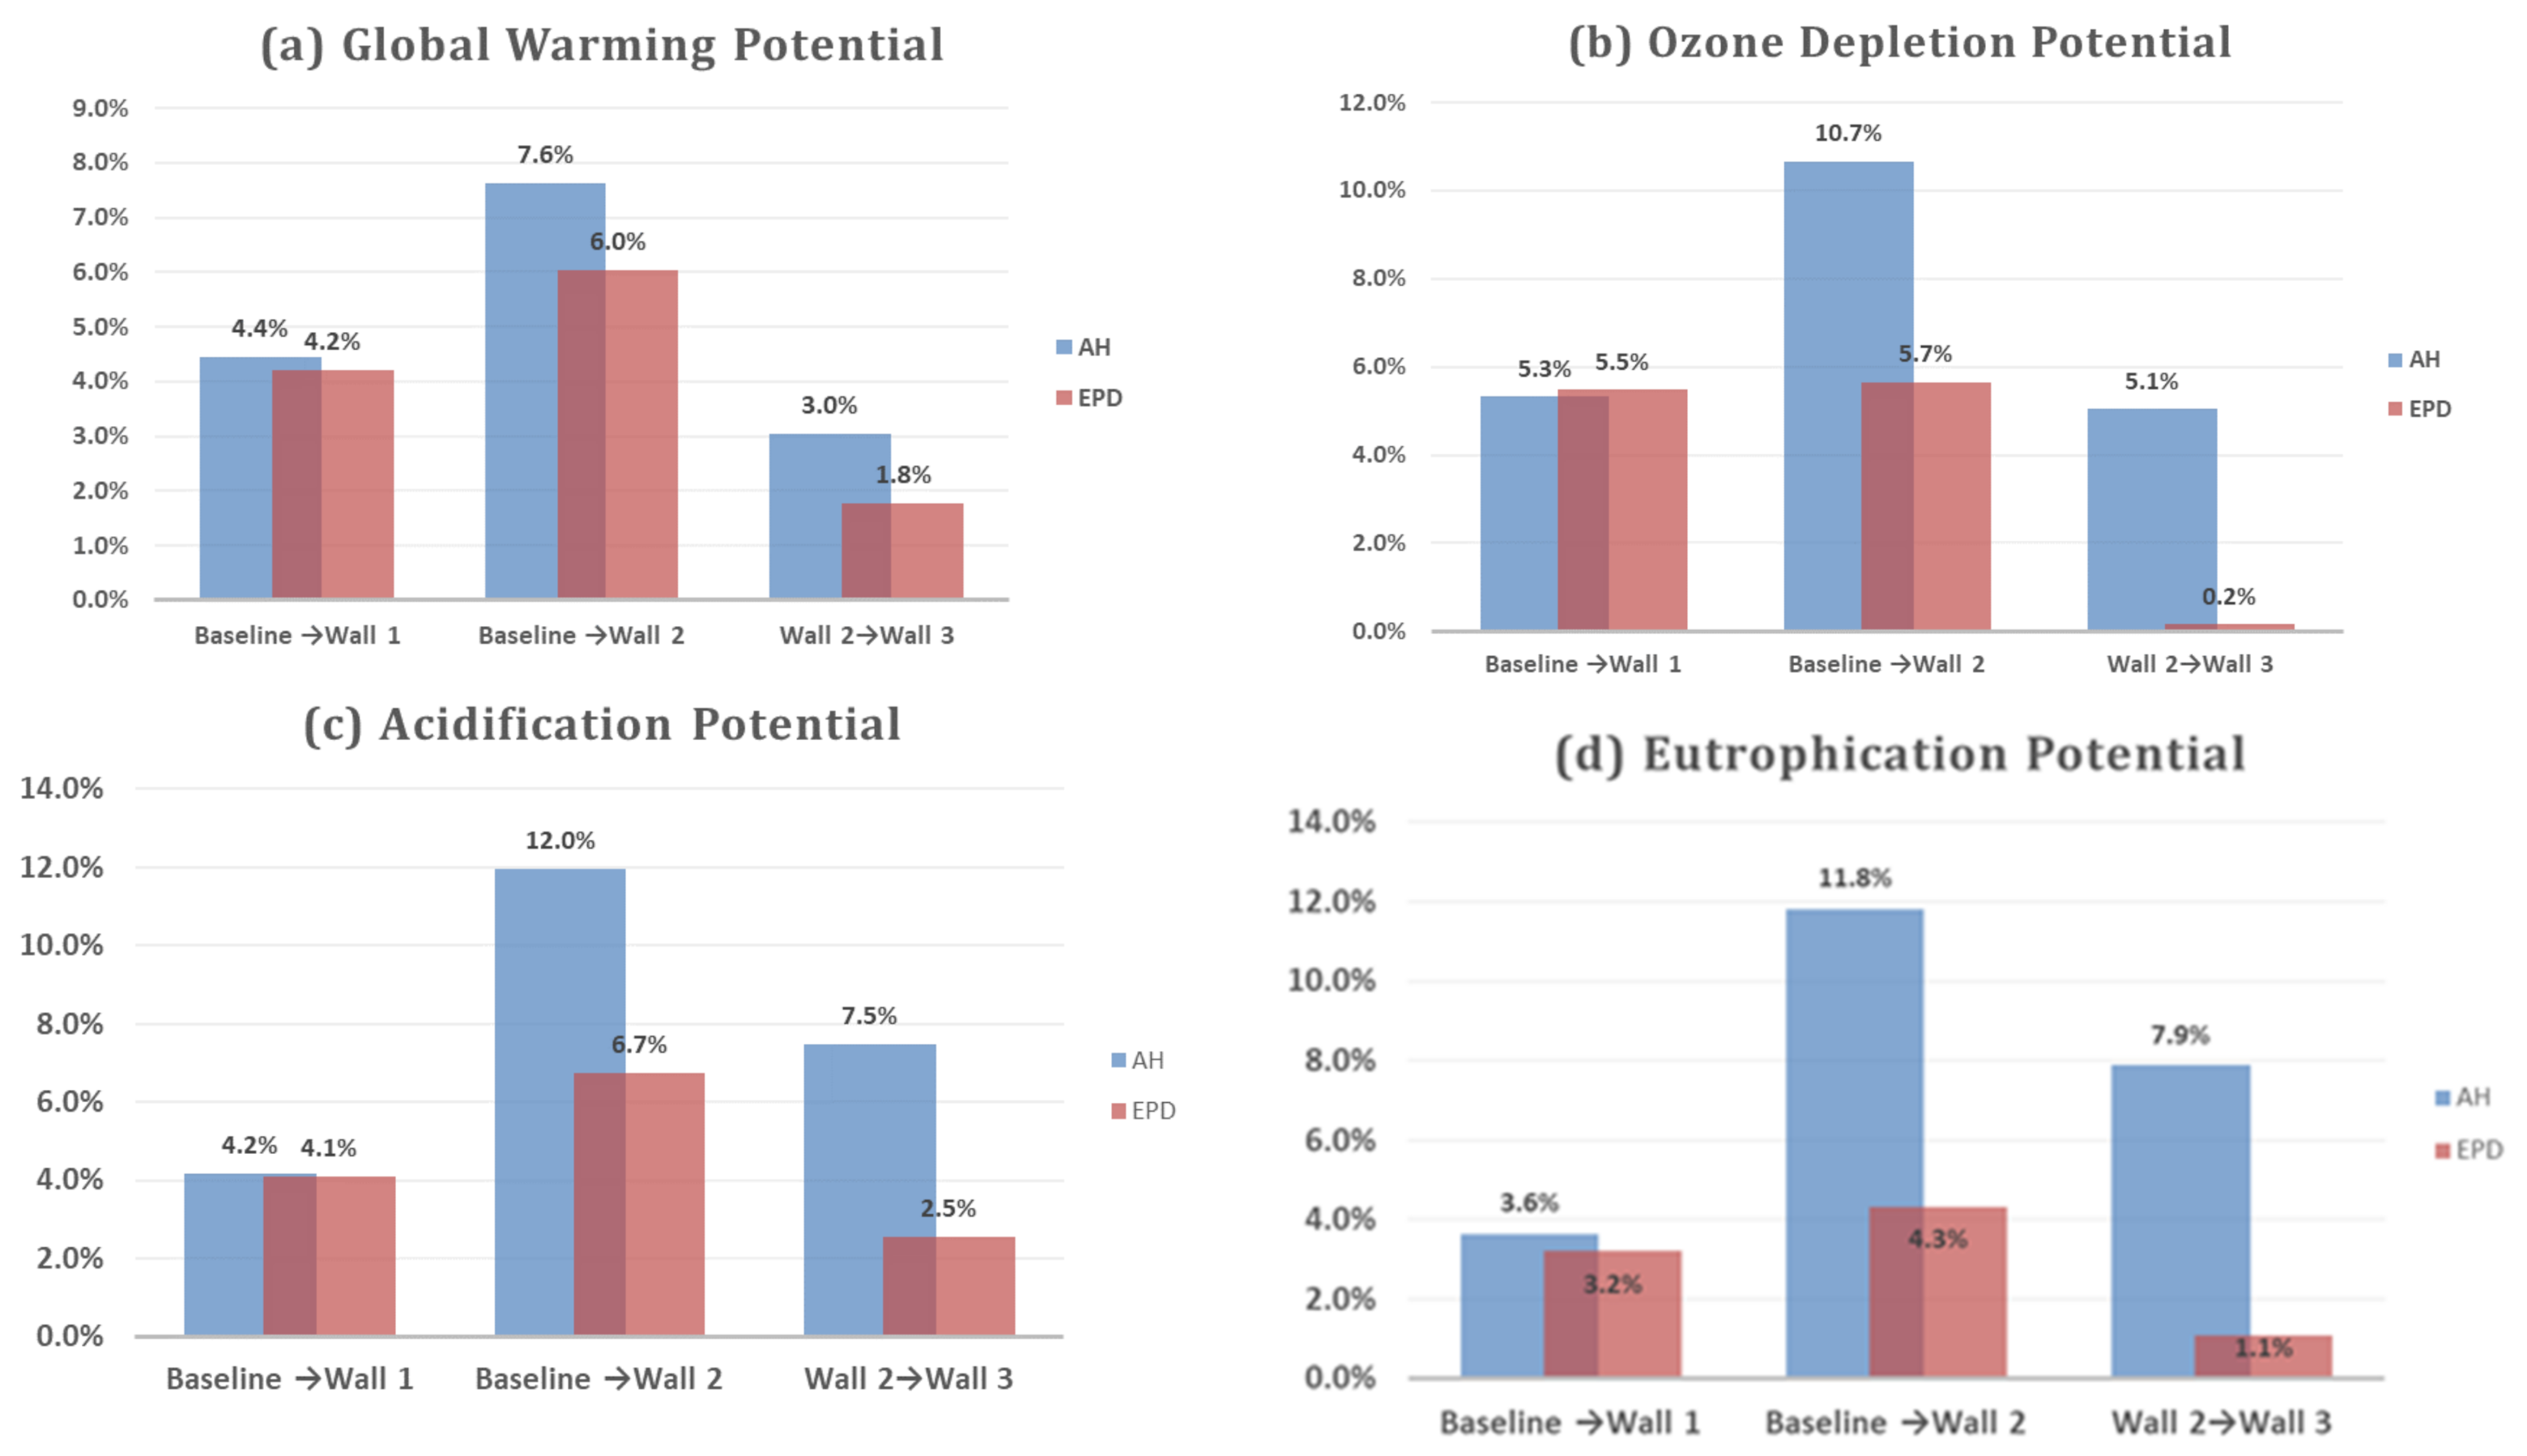
This was followed by a more thorough analysis of how the impact indicators changed with the varying improvement of the thermal performance of the external walls. From the results presented in Figure 5, it is evident that the external walls calculated from the AH library had the greatest impact across all categories. The average rise ranged from a minimum of 3% (GWP) to a maximum of 12% (AP). EPD data gave a minimum of 0.2% (ODP) and a maximum of 6.7% (AP). In particular, an average increase of 5% was reached when using the EPD data, while the environmental indexes jump by about 10% based on the AH library. Specifically, for both the two scenarios, ODP and EP reached Level 1, while GWP and AP reached level 2. The reason for this is that the threshold values adopted by the AH to classify performance levels within the environmental load area were so broad that they did not highlight the discrepancies between the data source indicators.
5. Conclusions
By adopting a life cycle perspective, this study highlighted the weight of embodied environmental impacts generated by materials and components (mainly insulation layers) in an Italian Passive House for progressively lower operational energy levels.
Despite its relevant and increasing weight (especially for high-energy performance buildings), the contribution of these impacts to the building’s environmental balance remains difficult to determine, mainly due to the lack of common procedures in sustainability assessment tools. Taking into account not only the embodied carbon analysis parameters but also all the environmental indicators required by the LCA standard procedure, this study selected Active House, an easy and free GBRS that has a dataset of LCA-based indicators, and applied this method to a significant real case. The outcomes showed how LCA results are influenced by the sources that go into the assessment in sustainable building GBRSs. The assessment of the material-embodied environmental loads, performed using different data sources, led to three findings. First, data for at least four impact indicators (GWP, ODP, EP and AP) provided by Environmental Product Declarations (EPD) appeared to be inconsistent with data taken from a generic cradle-to-gate inventory. Second, generic databases, usually based on specific geographical contexts may not be appropriate and may even diverge from the current LCA application within a GBRS, which relies on generic databases alone. Further investigation into EPD integration within a rating system (RS) appears to be necessary not only to reveal the data source but also to use it for a complete LCA assessment. Third, there were no gaps between different data sources when the overall score was obtained according to the GBRS methodology. For Active House, the approximation adopted by the GBRS to classify the calculated indexes was too large to detect a gap. This made it easier to use the rating system because it allowed faster assessment while keeping an acceptable level of reliability. However, approximation exposed the process to estimation errors, the magnitude of which was not negligible and thus hampered detailed perception of the phenomena.
Regarding the use of specific EPDs instead of generic data within a sustainable building RS, the main challenge concerned identifying proper EPDs for specific products. Despite more manufacturers developing EPDs for their stock, the coverage is still partial and the availability for different types of materials very inhomogeneous. At the same time, it is not usually easy to predict in the initial stages of a building design which materials and products will be employed because different decisions may be made during development. Nevertheless, greater information on these decisions is desirable both to stimulate the market towards fair competition over quality and the sustainability of materials, and to allow more accurate life cycle analyses.
A simple and reliable rating system such as Active House can easily show which aspects of the building require intervention and to what extent the project must lean towards the achievement of the net-zero goal. In addition, this type of outcome makes it easy to spot the relation among different elements in building performances. For example, indoor comfort (air quality and thermal and hygrometric comfort) can be related to the environmental performance of the materials. The same goes for energy performance, which can benefit from a proper and conscious choice of building materials and technical installation devices. Net Zero Energy Buildings should take into account not only the energy efficiency of these materials and devices but also the environmental profiles of the materials with which they are made. Therefore, the application of a method to evaluate both these aspects seems like a good opportunity not only for new projects but also for major renovations.
Finally, future developments should include test replication by applying other GBRSs to confirm the hypothesis through additional evidence and comparison.
The reliability and accuracy of environmental assessments could improve if they were extended to both maintenance and end-of-life phases. This might also improve identification of the embodied energy’s role in energy use compared to that of building operation, thus providing a more realistic energy balance in a building over its entire life.
Funding
This research received no external funding.
Institutional Review Board Statement
Not applicable.
Informed Consent Statement
Not applicable.
Data Availability Statement
The data presented in this study are available on request from the corresponding author.
Acknowledgments
The Author expresses her warm thanks to Paolo Coppa from Coppa Costruzioni, and Engineer Marco Boscolo (†) for their kind and effective support in providing all the detailed information about the CASAUNICA, which was crucial in finalizing this study. In addition, the author is extremely grateful to Ernesto Antonini for his initial involvement in this research.
Conflicts of Interest
The authors declare no conflict of interest.
References
- Piccardo, C.; Dodoo, A.; Gustavsson, L. Retrofitting a building to passive house level: A life cycle carbon balance. Energy Build. 2020, 223, 110135. [Google Scholar] [CrossRef]
- Economidou, M.; Todeschi, V.; Bertoldi, P.; D’Agostino, D.; Zangheri, P.; Castellazzi, L. Review of 50 years of EU energy efficiency policies for buildings. Energy Build. 2020, 225, 110322. [Google Scholar] [CrossRef]
- Palumbo, E. Cap. 5-LCA Approach in Evaluating Embedded Impacts of Building Products within the Energy Balance, in Gaspari, J., Multi-Layered Building Envelope; Edicom Edizioni: Monfalcone, Italy, 2019; ISBN 9788896386682. [Google Scholar]
- Giordano, R.; Serra, V.; Demaria, E.; Duzel, A. Embodied Energy versus Operational Energy in a Nearly Zero Energy Building Case Study. Energy Procedia 2017, 111, 367–376. [Google Scholar] [CrossRef] [Green Version]
- Palumbo, E.; Politi, S.; Ricerca, E. Efficientamento dell’ involucro edilizio: Interazione tra energia inglobata ed energia operativa/Improving building envelope efficiency: Interaction between embedded energy and operational energy. TECHNE J. Technol. Archit. Environ. 2018, 16. [Google Scholar] [CrossRef]
- Chastas, P.; Theodosiou, T.; Bikas, D.; Kontoleon, K. Embodied Energy and Nearly Zero Energy Buildings: A Review in Residential Buildings. Procedia Environ. Sci. 2017, 38, 554–561. [Google Scholar] [CrossRef]
- Jia, J.; Crabtree, J. You get what you ask for. In Driven by Demand: How Energy Gets its Power; Jia, J., Crabtree, J., Eds.; Cambridge University Press: Cambridge, MA, USA, 2015. [Google Scholar]
- Copiello, S. Building energy efficiency: A research branch made of paradoxes. Renew. Sustain. Energy Rev. 2017, 69, 1064–1076. [Google Scholar] [CrossRef]
- IEA World Energy Outlook 2019. IEA: Paris, France. Available online: https://www.iea.org/reports/world-energy-outlook-2019 (accessed on 1 September 2020).
- Doan, D.T.; Ghaffarianhoseini, A.; Naismith, N.; Zhang, T.; Ghaffarianhoseini, A.; Tookey, J. A critical comparison of green building rating systems. Build. Environ. 2017, 123, 243–260. [Google Scholar] [CrossRef]
- Cordero, A.S.; Melgar, S.G.; Márquez, J.M.A. Green building rating systems and the new framework level(s): A critical review of sustainability certification within Europe. Energies 2019, 13, 66. [Google Scholar] [CrossRef] [Green Version]
- Attia, S.; Beltran, L.; Herde, A.; Hensen, J. “Architect friendly”: A comparison of ten different building performance simulation tools. In Proceedings of the 11th International Building Performance Simulation Association Conference and Exhibition, Glasgow, UK, 27–30 July 2009; pp. 204–211. [Google Scholar]
- Attia, S.; Hamdy, M.; Carlucci, S. Assessing Gaps and Needs for Integrating Building Performance Optimization Tools in Net Zero Energy Buildings Design. Energy Build. 2013, 60, 110–124. [Google Scholar] [CrossRef] [Green Version]
- Meneghelli, A. Whole-building embodied carbon of a North American LEED-certified library: Sensitivity analysis of the environmental impact of buildings materials. Build. Environ. 2018, 134, 230–241. [Google Scholar] [CrossRef]
- de Klijn-Chevalerias, M.; Javed, S. The Dutch approach for assessing and reducing environmental impacts of building materials. Build. Environ. 2017, 111, 147–159. [Google Scholar] [CrossRef]
- Politi, S.; Antonini, E. An Expeditious Method for Comparing Sustainable Rating Systems for Residential Buildings. Energy Procedia 2017, 111, 41–50. [Google Scholar] [CrossRef]
- DGNB System. Certificate for Sustainable and Green Building; DGNB GmbH: Stuttgart, Germany, 2019. [Google Scholar]
- Gervasio, H.; Dimova, S. Model for Life Cycle Assessment (LCA) of Buildings; European Commission: Ispra, Italy, 2018. [Google Scholar]
- Dodd, N.; Donatello, S.; Cordella, M. Level(s)—A Common EU Framework of Core Sustainability Indicators for Office and residential Buildings, Part 2: Setting up a Project to Use the Level(s) Common Framework (Publication Version 1.0); European Commission, Joint Research Center: Seville, Spain, 2020; pp. 1–31. [Google Scholar]
- Anand, C.K.; Amor, B. Recent developments, future challenges and new research directions in LCA of buildings: A critical review. Renew. Sustain. Energy Rev. 2017, 67, 408–416. [Google Scholar] [CrossRef]
- Gervasio, H.; Dimova, S.; Pinto, A. Benchmarking the life-cycle environmental performance of buildings. Sustainability 2018, 10, 1454. [Google Scholar] [CrossRef] [Green Version]
- Trigaux, D.; Allacker, K.; Debacker, W. Critical analysis of environmental benchmarks for buildings. In Sustainable Built Environment Conference 2019 (SBE19 Graz); IOP Conference Series: Earth and Environmental Science; IOP Publishing: Bristol, UK, 2019; p. 323. [Google Scholar]
- Simonen, K.; Rodriguez, B.X.; de Wolf, C. Benchmarking the Embodied Carbon of Buildings. Technol. Archit. Des. 2017, 1, 208–218. [Google Scholar] [CrossRef]
- Schlegl, F.; Gantner, J.; Traunspurger, R.; Albrecht, S.; Leistner, P. LCA of buildings in Germany: Proposal for a future benchmark based on existing databases. Energy Build. 2019, 194, 342–350. [Google Scholar] [CrossRef]
- Brambilla, A.; Salvalai, G.; Tonelli, C.; Imperadori, M. Comfort analysis applied to the international standard “Active House”: The case of RhOME, the winning prototype of Solar Decathlon 2014. J. Build. Eng. 2017, 12, 210–218. [Google Scholar] [CrossRef]
- Active House Alliance. Active House—The Specifications. Available online: http://www.activehouse.info/wp-content/uploads/2016/05/activehouse_specifications_2nd_edition.pdf (accessed on 20 March 2021).
- Lasvaux, S.; Habert, G.; Peuportier, B.; Chevalier, J. Comparison of generic and product-specific Life Cycle Assessment databases: Application to construction materials used in building LCA studies. Int. J. Life Cycle Assess. 2015, 20, 1473–1490. [Google Scholar] [CrossRef]
- Passer, A.; Lasvaux, S.; Allacker, K.; de Lathauwer, D.; Spirinckx, C.; Wittstock, B.; Kellenberger, D.; Gschösser, F.; Wall, J.; Wallbaum, H. Environmental product declarations entering the building sector: Critical reflections based on 5 to 10 years experience in different European countries. Int. J. Life Cycle Assess. 2015, 20, 1199–1212. [Google Scholar] [CrossRef] [Green Version]
- Strazza, C.; del Borghi, A.; Magrassi, F.; Gallo, M. Using environmental product declaration as source of data for life cycle assessment: A case study. J. Clean. Prod. 2016, 112, 333–342. [Google Scholar] [CrossRef]
- Emami, N.; Heinonen, J.; Marteinsson, B.; Säynäjoki, A.; Junnonen, J.M.; Laine, J.; Junnila, S. A life cycle assessment of two residential buildings using two different LCA database-software combinations: Recognizing uniformities and inconsistencies. Buildings 2019, 9, 20. [Google Scholar] [CrossRef] [Green Version]
- European Commission—Joint Research Centre—Institute for Environment and Sustainability. International Reference Life Cycle Data System (ILCD) Handbook—General Guide for Life Cycle Assessment—Detailed Guidance; Publications Office of the European Union: Luxembourg, 2010. [Google Scholar]
- ISO. International Organization for Standarization ISO 14020:2000 Environmental Labels and Declarations—General Principles; ISO: Genova, Switzerland, 2000. [Google Scholar]
- ISO. International Organization for Standarization ISO 14025:2006 Environmental Labels and Declarations—Type III Environmental Declarations—Principles and Procedures; ISO: Genova, Switzerland, 2006. [Google Scholar]
- CEN. European Committee for Standardization EN 15804:2012 + A2:2019—Sustainability of construction works—Environmental product declarations—Core rules for the product category of construction products; CEN: Brussels, Belgium, 2019. [Google Scholar]
- Palumbo, E.; Soust-Verdaguer, B.; Llatas, C.; Traverso, M. How to obtain accurate environmental impacts at early design stages in BIM when using environmental product declaration. A method to support decision-making. Sustainability 2020, 12, 6927. [Google Scholar] [CrossRef]
- Vandini, F. Casaunica: La Casa Passiva in Ogni Condizione Climatica, Coppa Costruzioni. Available online: http://www.casaunica.it/wp-content/uploads/2016/11/Estratto-Casaunica.pdf (accessed on 1 March 2021).
Figure 1.
CASAUNICA floor plans.

Figure 2.
The Active House radar® for the “environmental loads” category (envelope only).

Figure 3.
Different configurations for the External Vertical Wall (Baseline 1 (a) is the original configuration, Ext. Wall 2 (b) and 3 (c) are the simulated additional configurations).
Figure 3.
Different configurations for the External Vertical Wall (Baseline 1 (a) is the original configuration, Ext. Wall 2 (b) and 3 (c) are the simulated additional configurations).

Figure 4.
Variation of LCA environmental indicators for the three outer-envelope configurations adopting AH library.
Figure 4.
Variation of LCA environmental indicators for the three outer-envelope configurations adopting AH library.

Figure 5.
Comparison as the percentage among the environmental indicators of the external walls obtained from the two data sources (AH vs. EPD) as thermal performance varies.
Figure 5.
Comparison as the percentage among the environmental indicators of the external walls obtained from the two data sources (AH vs. EPD) as thermal performance varies.


Table 1.
Active House evaluation criteria (source: [26]).
Table 1.
Active House evaluation criteria (source: [26]).
| Principles | Criteria Group | Criteria |
|---|---|---|
| Comfort | Daylight | Daylight Factor |
| Direct Sunlight Available | ||
| Thermal Environment | Maximum Operative temperature | |
| Minimum Operative Temperature | ||
| Indoor Air Quality | Standard Fresh Air Supply | |
| Energy | Energy Demand | Annual Energy Demand |
| Energy Supply | Origin of Energy Supply | |
| Primary Energy Performance | Annual Primary Energy Performance | |
| Environment | Environmental Loads | Building’s Primary Energy Consumption during entire Life Cycle |
| Global Warming Potential (GWP) during Building’s Life Cycle | ||
| Ozone Depletion Potential (ODP) during Building’s Life Cycle | ||
| Photochemical Ozone Creation Potential (POCP) during Building’s Life Cycle | ||
| Acidification Potential (AP) during Building’s Life Cycle | ||
| Eutrophication Potential (EP) during Building’s Life Cycle | ||
| Fresh Water Consumption | Minimization of Fresh Water Consumption during Building’s Use | |
| Sustainable Construction | Recyclable Content | |
| Responsible Sourcing |
Table 2.
Active House classification of Environmental Loads (source: [26]).
Table 2.
Active House classification of Environmental Loads (source: [26]).
| Active House LCA Indicators | Achievable Scores |
|---|---|
| Global warming potential (GWP) during building’s life cycle |
|
| |
| |
| |
| Ozone depletion potential (ODP) during building’s life cycle |
|
| |
| |
| |
| Photochemical ozone creation potential (POCP) during building’s life cycle |
|
| |
| |
| |
| Acidification potential (AP) during building’s life cycle |
|
| |
| |
| |
| Eutrophication potential (EP) during building’s life cycle |
|
| |
| |
|
Table 3.
CASAUNICA building elements stratigraphy.
| Building Components | Layers from Outside to Inside | Thickness d (cm) | |
|---|---|---|---|
| Roof | Roof tiles | - |  |
| Polyurethane with graphite addition | 10 | ||
| Polyurethane | 10 | ||
| Vapour-permeable membrane | - | ||
| Wooden planking | 2.0 | ||
| Laminated timber beams filled with rock wool | 20 | ||
| Plasterboard | 1.8 | ||
| Vertical External Walls | Finishing layer | 1.0 |  |
| EPS thermal insulation | 25 | ||
| R.c. panels and interposed steel HEA profiles | 16 | ||
| EPS thermal insulation | 10 | ||
| Air gap | 10 | ||
| Rockwool | 5.0 | ||
| Plasterboard | 1.8 | ||
| Vertical External Windows | Composite polyurethane/wooden frame Low emissive Argon filled triple glazing | 9.0 0.6-1.2-0.6 -1.2-0.6 |  |
| Slab on-grade | Wood flooring | 4.5 |  |
| Double EPS board | 12 | ||
| Sand | 2.5 | ||
| R.c. slab and welded mesh | 5.0 | ||
| EPS shuttering for concrete | 25 | ||
| Slabs | Wood flooring | 4.5 |  |
| Double EPS board | 3.0 | ||
| Sand | 2.5 | ||
| R.c. slab and welded mesh | 5.0 | ||
| EPS shuttering for concrete | 20 | ||
| Foundation structure | R.c. grade beam | 60 |  |
| EPS thermal insulation | 9.0 |
R.c. = Reinforced concrete; EPS = Expanded polystyrene.
Table 4.
CASAUNICA energy performance (source: [36]).
Table 4.
CASAUNICA energy performance (source: [36]).
| Energy Performance | Passive House Standard (kWh/m2 y) | CASAUNICA (kWh/m2 y) |
|---|---|---|
| Specific energy demand for heating | 15 | 6.08 |
| Specific energy demand for cooling | 15 | 6.68 |
| Total primary energy demand | 120 | 51.84 * |
* considering the contributions from renewable sources (solar photovoltaic and thermal).
Table 5.
Impacts from building elements for the “production” and “end of life” phases according to the Active House library.
Table 5.
Impacts from building elements for the “production” and “end of life” phases according to the Active House library.
| Building Elements | Impact Indicators | ||||||
|---|---|---|---|---|---|---|---|
| PENR | PER | GWP | ODP | AP | EP | POCP | |
| Roof | 1.63 × 10⁵ | 7.50 × 10⁴ | 3.59 × 10³ | 5.25 × 10⁻⁴ | 2.79 × 101 | 3.82 × 10 | 3.86 × 10 |
| Vert. Ext. walls | 2.67 × 10⁵ | 3.67 × 10³ | 1.75 × 10⁴ | 4.46 × 10⁻⁴ | 3.96 × 101 | 4.75 × 10 | 5.07 × 10 |
| Vert. Ext. Windows | 1.33 × 10⁴ | 4.77 × 10² | 7.30 × 10² | 3.16 × 10⁻⁵ | 3.58 × 10 | 7.10 × 10⁻¹ | 2.17 × 10⁻¹ |
| Horizontal lower closing | 6.85 × 10⁵ | 2.92 × 10⁴ | 2.26 × 10⁴ | 8.29 × 10⁻⁴ | 5.23 × 101 | 5.66 × 10 | 8.57 × 10 |
| Slabs | 5.33 × 10⁵ | 2.57 × 10⁴ | 1.76 × 10⁴ | 6.58 × 10⁻⁴ | 4.11 × 101 | 4.48 × 10 | 6.74 × 10 |
| Foundation structure | 2.22 × 10⁴ | 8.46 × 10² | 2.95 × 10³ | 1.13 × 10⁻⁴ | 5.33 × 10 | 6.84 × 10⁻¹ | 6.22 × 10⁻¹ |
| Total (production phase) | 1.68 × 10⁶ | 1.35 × 10⁵ | 6.49 × 10⁴ | 2.60 × 10⁻³ | 1.70 × 10² | 2.01 × 101 | 2.51 × 101 |
| Total (End of life phase) | −5.1 × 10⁵ | −5.4 × 10³ | 2.6 × 10⁴ | −1.1 × 10⁻³ | 3.0 × 101 | 1.1 × 101 | −2.1 × 10 |
Caption: PENR = Primary energy non-renewable [MJ]; PER = Primary energy renewable [MJ]; GWP = Global warming potential [kgCO2 eq]; ODP = Depletion potential of the stratospheric ozone layer [kg R11 eq]; AP = Acidification potential of land and water [kg SO2 eq]; EP = Eutrophication potential [kg PO4 eq]; POCP = Formation potential of tropospheric ozone photochemical oxidants [kg C3H4 eq].
Table 6.
LCA outcomes of the envelope (expressed in m2 of floor area for 50 years) and related Active House scores reached.
Table 6.
LCA outcomes of the envelope (expressed in m2 of floor area for 50 years) and related Active House scores reached.
| IMPACT INDICATORS | ||||||
|---|---|---|---|---|---|---|
| LIFE CYCLE STAGE | GWP | ODP | AP | EP | POCP | |
| Active House Library | Production | 6.80 × 10 | 2.74 × 10⁻⁷ | 1.80 × 10⁻² | 2.12 × 10⁻³ | 2.64 × 10⁻³ |
| End of life | 2.70 × 10 | −1.20 × 10⁻⁷ | 3.20 × 10⁻³ | 1.20 × 10⁻³ | −2.20 × 10⁻⁴ | |
| Total | 9.50 × 10 | 1.50 × 10⁻⁷ | 2.10 × 10⁻² | 3.30 × 10⁻³ | 2.40 × 10⁻³ | |
| Environmental Loads Classification according to AH protocol | Level 2 | Level 1 | Level 2 | Level 1 | Level 1 | |
Caption: GWP = Global warming potential [kgCO2 eq/m2]; ODP = Depletion potential of the stratospheric ozone layer [kg R11 eq/m2]; AP = Acidification potential of land and water [kg SO2 eq/m2]; EP = Eutrophication potential [kg PO4 eq/m2]; POCP = Formation potential of tropospheric ozone photochemical oxidants [kg C3H4 eq/m2].
Table 7.
CASAUNICA energy performance considering alternative outer envelope configurations [36].
Table 7.
CASAUNICA energy performance considering alternative outer envelope configurations [36].
| Operating Performance | Unit | CASAUNICA with Ext. Wall 2 | CASAUNICA with Ext. Wall 3 |
|---|---|---|---|
| Specific energy demand for heating | kWh/m2 y | 5.74 | 5.57 |
| Specific energy demand for cooling | kWh/m2 y | 6.74 | 6.77 |
| Total primary energy demand | kWh/m2 y | 51.5 * | 50.82 * |
* considering the contributions from renewable sources (solar photovoltaic and thermal).
Table 8.
Difference (%) between the LCA environmental indicators of three different configurations of the External Wall with decreasing U value.
Table 8.
Difference (%) between the LCA environmental indicators of three different configurations of the External Wall with decreasing U value.
| Configurations | U Project (W/m2 K) | U Variation (%) | LCA Impact Indicators Variation (%) | ||||||
|---|---|---|---|---|---|---|---|---|---|
| PENR | PER | GW | ODP | AP | EP | POCP | |||
| Baseline > Ext. Wall 1 | 0.084 0.075 | −10.7% | +8.8% | +3.0% | +4.4% | +5.3% | +4.2% | +3.6% | +5.4% |
| Baseline > Ext. Wall 2 | 0.084 0.071 | −15.5% | +11.7% | +10.5% | +7.6% | +10.7% | +12.0% | +11.8% | +8.7% |
| Ext. Wall 1 > Ext. Wall 2 | 0.075 0.071 | −5.33% | +2.6% | +7.3% | +3.0% | +5.1% | +7.5% | +7.9% | +3.1% |
Caption: GWP = Global warming potential [kgCO2 eq/m2]; ODP = Depletion potential of the stratospheric ozone layer [kg R11 eq/m2]; AP = Acidification potential of land and water [kg SO2 eq/m2]; EP = Eutrophication potential [kg PO4 eq/m2]; POCP = Formation potential of tropospheric ozone photochemical oxidants [kg C3H4 eq/m2].
Table 9.
Compared impacts of three different configurations of the External Wall obtained from the AH database (above) and specific product EPDs (below).
Table 9.
Compared impacts of three different configurations of the External Wall obtained from the AH database (above) and specific product EPDs (below).
| Data Sources | Configurations | GWP | ODP | AP | EP | POCP |
|---|---|---|---|---|---|---|
| Active House Library | External Wall 1 (baseline) | 1.84 × 10 | 4.69 × 10⁻⁸ | 4.17 × 10⁻³ | 5.00 × 10⁻⁴ | 5.34 × 10⁻⁴ |
| External Wall 2 | 1.92 × 10 | 4.94 × 10⁻⁸ | 4.35 × 10⁻³ | 5.18 × 10⁻⁴ | 5.63 × 10⁻⁴ | |
| External Wall 3 | 1.98 × 10 | 5.19 × 10⁻⁸ | 4.67 × 10⁻³ | 5.59 × 10⁻⁴ | 5.80 × 10⁻⁴ | |
| EPD | External Wall 1 (baseline) | 1.71 × 10 | 2.90 × 10⁻⁸ | 4.17 × 10⁻³ | 6.09 × 10⁻⁴ | 3.28 × 10⁻³ |
| External Wall 2 | 1.78 × 10 | 3.05 × 10⁻⁸ | 4.34 × 10⁻³ | 6.29 × 10⁻⁴ | 3.64 × 10⁻³ | |
| External Wall 3 | 1.82 × 10 | 3.05 × 10⁻⁸ | 4.45 × 10⁻³ | 6.36 × 10⁻⁴ | 3.65 × 10⁻³ |
Table 10.
Comparison among decreasing U values and its related operational energy drop of the three different wall configurations with the generated environmental indicators.
Table 10.
Comparison among decreasing U values and its related operational energy drop of the three different wall configurations with the generated environmental indicators.
| Configurations | ∆U % | ↓ OE | PENR | PER | GWP | ODP | AP | EP | POCP | Average Imp. Indic. |
|---|---|---|---|---|---|---|---|---|---|---|
| Baseline —Wall 1 | −10.7% | −1.3% | 8.8% | 3.0% | 4.4% | 5.3% | 4.2% | 3.6% | 5.4% | 4.96% |
| Baseline —Wall 2 | −15.5% | −2.0% | 11.7% | 10.5% | 7.6% | 10.7% | 12.0% | 11.8% | 8.7% | 10.43% |
| Wall 2—Wall 3 | −5.3% | −0.6% | 2.6% | 7.3% | 3.0% | 5.1% | 7.5% | 7.9% | 3.1% | 5.21% |
Table 11.
Percentage difference among the environmental indicators obtained from two different data sources (AH and EPD) regarding the materials used for the external wall configurations.
Table 11.
Percentage difference among the environmental indicators obtained from two different data sources (AH and EPD) regarding the materials used for the external wall configurations.
| Configurations | GWP | ODP | AP | EP |
|---|---|---|---|---|
| External Wall 1 (AH vs. EPD) | 7.3% | 62.1% | 0.1% | −18.0% |
| External Wall 2 (AH vs. EPD) | 7.5% | 61.9% | 0.2% | −17.6% |
| External Wall 3 (AH vs. EPD) | 10.8% | 70.1% | 7.7% | −11.2% |
| Average % (AH vs. EPD) | 8.6% | 64.7% | 2.6% | −15.6% |
Publisher’s Note: MDPI stays neutral with regard to jurisdictional claims in published maps and institutional affiliations. |
© 2021 by the author. Licensee MDPI, Basel, Switzerland. This article is an open access article distributed under the terms and conditions of the Creative Commons Attribution (CC BY) license (http://creativecommons.org/licenses/by/4.0/).
Share and Cite
MDPI and ACS Style
Palumbo, E. Effect of LCA Data Sources on GBRS Reference Values: The Envelope of an Italian Passive House. Energies 2021, 14, 1883. https://doi.org/10.3390/en14071883
AMA Style
Palumbo E. Effect of LCA Data Sources on GBRS Reference Values: The Envelope of an Italian Passive House. Energies. 2021; 14(7):1883. https://doi.org/10.3390/en14071883
Chicago/Turabian StylePalumbo, Elisabetta. 2021. "Effect of LCA Data Sources on GBRS Reference Values: The Envelope of an Italian Passive House" Energies 14, no. 7: 1883. https://doi.org/10.3390/en14071883
Note that from the first issue of 2016, this journal uses article numbers instead of page numbers. See further details here.