Preferences for Sweet and Fatty Taste in Children and Their Mothers in Association with Weight Status

 ,
,  , , , and
Abstract
:1. Introduction
2. Materials and Methods
2.1. Participants
2.2. Assessments
2.3. Statistical Analysis
2.4. Ethics
3. Results
4. Discussion
5. Conclusions
Author Contributions
Funding
Conflicts of Interest
References
- Kovesdy, C.B.; Furth, S.L.; Zoccali, C. Obesity and Kidney Disease: Hidden Consequences of the Epidemic. Blood Purif. 2017, 43, 346–354. [Google Scholar] [CrossRef] [Green Version]
- Oliveira, L.C.; Ferrari, G.M.I.; Araújo, T.L.; Matsudo, V. Overweight, obesity, steps, and moderate to vigorous physical activity in children. Revista de SaúdePública 2017, 51, 386. [Google Scholar] [CrossRef] [Green Version]
- Jones, R.E.; Jewell, J.; Saksena, R.; Ramos Salas, X.; Breda, J. Overweight and Obesity in Children under 5 Years: Surveillance Opportunities and Challenges for the WHO European Region. Front. Public Health 2017, 5, 58. [Google Scholar] [CrossRef] [Green Version]
- Stokes, A.; Ni, Y.; Preston, S.H. Prevalence and Trends in Lifetime Obesity in the U.S., 1988–2014. Am. J. Prev. Med. 2017, 53, 567–575. [Google Scholar] [CrossRef] [PubMed] [Green Version]
- Maskarinec, G.; Takata, Y.; Pagano, I.; Carlin, L.; Goodman, M.T.; Le Marchand, L.; Nomura, A.M.; Wilkens, L.R.; Kolonel, L.N. Trends and Dietary Determinants of Overweight and Obesity in a Multiethnic Population. Obesity 2006, 14, 717–726. [Google Scholar] [CrossRef] [PubMed]
- Di Partizio, N.F. Is fat taste ready for primetime? Physiol. Behav. 2014, 136, 145–154. [Google Scholar]
- Loper, H.B.; La Sala, M.; Dotson, C.; Steinle, N. Taste perception, associated hormonal modulation, andnutrient intake. Nutr. Rev. 2015, 73, 83–91. [Google Scholar] [CrossRef] [PubMed] [Green Version]
- Mennella, J.A.; Bobowski, N.K. The sweetness and bitterness of childhood: Insights from basic research on taste preferences. Physiol. Behav. 2015, 152, 502–507. [Google Scholar] [CrossRef] [PubMed] [Green Version]
- Besnard, P.; Passilly-Degrace, P.; Khan, N.A. Taste of Fat: A Sixth Taste Modality? Physiol. Rev. 2016, 96, 151–176. [Google Scholar] [CrossRef] [Green Version]
- Haryono, R.Y.; Sprajcer, R.A.; Keast, R.S.J. Measuring Oral Fatty Acid Thresholds, Fat Perception, Fatty Food Liking, and Papillae Density in Humans. J. Vis. Exp. 2014, 88, 51236. [Google Scholar] [CrossRef] [Green Version]
- Running, C.A.; Craig, B.A.; Mattes, R.D. Oleogustus: The unique taste of fat. Chem. Sens. 2015, 40, 507–516. [Google Scholar] [CrossRef] [PubMed] [Green Version]
- Newman, L.P.; Bolhuis, D.P.; Torres, S.J.; Keast, R.S.J. Dietary Fat Restriction Increases Fat Taste Sensitivity in People with Obesity. Obesity 2016, 24, 324–334. [Google Scholar] [CrossRef] [PubMed] [Green Version]
- Costanzo, A.; Orellana, L.; Nowson, C.; Duesing, K.; Keast, R. Fat Taste Sensitivity Is Associated with Short-Term and Habitual Fat Intake. Nutrients 2017, 9, 781. [Google Scholar] [CrossRef] [PubMed] [Green Version]
- Mennella, J.A.; Jagnow, C.P.; Beauchamp, G.K. Prenatal and postnatal flavor learning by human infants. Pediatrics 2001, 107, E88. [Google Scholar] [CrossRef] [PubMed] [Green Version]
- Schwartz, C.; Scholtens, P.A.; Lalanne, A.; Weenen, H.; Nicklaus, S. Development of healthy eating habits early in life. Review of recent evidence and selected guidelines. Appetite 2011, 57, 796–807. [Google Scholar] [CrossRef] [PubMed]
- Ventura, A.K. Does Breastfeeding Shape Food Preferences? Links to Obesity. Ann. Nutr. Metab. 2017, 70, 8–15. [Google Scholar] [CrossRef]
- Story, M.; Neumark-Sztainer, D.; French, S. Individual and environmental influences on adolescent eating behaviours. J. Am. Diet. Assoc. 2002, 102, 40–51. [Google Scholar] [CrossRef]
- Ritchie, L.; Welk, G.; Styne, D.; Gerstein, D.E.; Crawford, P.B. Family Environment and Pediatric Overweight: What Is a Parent to Do? J. Am. Diet. Assoc. 2005, 105, 70–79. [Google Scholar] [CrossRef]
- Ventura, A.K.; Worobey, J. Early influences on the development of food preferences. Curr. Biol. 2013, 23, R401–R408. [Google Scholar] [CrossRef] [Green Version]
- Drewnowski, A. Taste preferences and food intake. Annu. Rev. Nutr. 1997, 17, 237–253. [Google Scholar] [CrossRef] [Green Version]
- Drewnowski, A.; Henderson, S.A.; Hann, C.S.; Barratt-Fornell, A.; Ruffin, M. Age and food preferences influence dietary intakes of breast care patients. Health Psychol. 1999, 18, 570–578. [Google Scholar] [CrossRef] [PubMed]
- Fisher, J.O.; Birch, L.L. Fat preferences and fat consumption of 3- to 5- year-old children are related to parental adiposity. J. Am. Diet. Assoc. 1995, 95, 7. [Google Scholar] [CrossRef]
- Salbe, A.D.; DelParigi, A.; Pratley, R.E.; Drewnowski, A.; Tataranni, P.A. Taste preferences and body weight changes in an obesity-prone population. Am. J. Clin. Nutr. 2004, 79, 372–378. [Google Scholar] [CrossRef] [PubMed]
- Simchen, U.; Koebnick, C.; Hoyer, S.; Issanchou, S.; Zunft, H.J. Odour and taste sensitivity is associated with body weight and extent of misreporting of body weight. Eur. J. Clin. Nutr. 2006, 60, 698–705. [Google Scholar] [CrossRef] [PubMed]
- Pepino, M.Y.; Finkbeiner, S.; Beauchamp, G.K.; Mennella, J.A. Obese women have lower monosodium glutamate taste sensitivity and prefer higher concentrations than do normal-weight women. Obesity 2010, 18, 959–965. [Google Scholar] [CrossRef] [PubMed] [Green Version]
- Paquet, C.; Dube, L.; Gauvin, L.; Kestens, Y.; Daniel, M. Sense of mastery and metabolic risk: Moderating role of the local fast-food environment. Psychosom. Med. 2010, 72, 324–331. [Google Scholar] [CrossRef]
- Bartoshuk, L.M.; Duffy, V.B.; Hayes, J.E.; Moskowitz, H.R.; Snyder, D.J. Psychophysics of sweet and fat perception in obesity: Problems, solutions and new perspectives. Philos. Trans. R. Soc. Lond. B Biol. Sci. 2006, 361, 1137–1148. [Google Scholar] [CrossRef] [Green Version]
- Wang, Y.; Lobstein, T. Worldwide trends in childhood overweight and obesity. Int. J. Pediatr. Obes. 2006, 1, 11–25. [Google Scholar] [CrossRef]
- Cox, D.N.; Hendrie, G.A.; Carty, D. Sensitivity, hedonics and preferences for basic tastes and fat amongst adults and children of differing weight status: A comprehensive review. Food Qual. Prefer. 2016, 48, 359–367. [Google Scholar] [CrossRef]
- World Health Organization. BMI Classification. Available online: http://apps.who.int/bmi/index.jsp?introPage=intro_3.html (accessed on 26 February 2019).
- Jilani, H.; Peplies, J.; Buchecker, K. On Behalf of the IDEFICS and I.Family Consortia. Assessment of Sensory Taste Perception in Children. In Instruments for Health Surveys in Children and Adolescents; Bammann, K., Lissner, L., Pigeot, I., Ahrens, W., Eds.; Springer: Cham, Switzerland, 2019; pp. 257–275. [Google Scholar]
- Knof, K.; Lanfer, A.; Bildstein, M.O.; Buchecker, K.; Hilz, H. Development of a method to measure sensory perception in children at the European level. Int. J.Obes. 2011, 35, S131–S136. [Google Scholar] [CrossRef] [Green Version]
- Kułaga, Z.; Różdżyńska, A.; Palczewska, I. Percentile charts of height, body mass and body mass index in children and adolescents in Poland—Results of the OLAF study. Stand. Med. 2010, 7, 690–700. [Google Scholar]
- Meisleman, H. The impact of context and environment on consumer food choice. In Understanding Consumers of Food Products; Frewer, L., van Trijp, H., Eds.; Woodhead: Cambridge, UK, 2007; pp. 67–92. [Google Scholar]
- Mennella, J.A.; Pepino, M.Y.; Reed, D.R. Genetic and environmental determinants of bitter perception and sweet preferences. Pediatrics 2005, 115, e216–e222. [Google Scholar] [CrossRef] [Green Version]
- Mennella, J.A.; Finkbeiner, S.; Reed, D.R. The proof is in the pudding: Children prefer lower fat but higher sugar than do mothers. Int. J. Obes. 2012, 36, 1285–1291. [Google Scholar] [CrossRef] [Green Version]
- Lanfer, A.; Knof, K.; Barba, G.; Veidebaum, T.; Papoutsou, S.; de Henauw, S.; Soós, T.; Moreno, L.A.; Ahrens, W.; Lissner, L. Taste preferences in association with dietary habits and weight status in European children: Results from the IDEFICS study. Int. J. Obes. 2012, 36, 27–34. [Google Scholar] [CrossRef] [Green Version]
- Kindleysides, S.; Beck, K.L.; Walsh, D.C.; Henderson, L.; Jayasinghe, S.N.; Golding, M.; Breier, B.H. Fat Sensation: Fatty Acid Taste and Olfaction Sensitivity and the Link with Disinhibited Eating Behaviour. Nutrients 2017, 9, 879. [Google Scholar] [CrossRef] [Green Version]
- Ettinger, L.; Duizer, L.; Caldwell, T. Body fat, sweetness sensitivity, and preference: Determining the relationship. Can. J. Diet. Pract. Res. 2012, 73, 45–48. [Google Scholar] [CrossRef] [PubMed]
- Matsushita, Y.; Mizoue, T.; Takahashi, Y.; Isogawa, A.; Kato, M. Taste preferences and body weight change in Japanese adults: The JPHC Study. Int. J. Obes. 2009, 33, 1191–1197. [Google Scholar] [CrossRef] [PubMed] [Green Version]
- Coldwell, S.; Oswald, T.K.; Reed, D.R. A marker of growth differs between adolescents with high versus low sugar preference. Physiol. Behav. 2009, 96, 574–580. [Google Scholar] [CrossRef] [PubMed] [Green Version]
- Wardle, J.; Carnell, S.; Cooke, L. Parental control over feeding and children’s fruit and vegetable intake: How are they related? J. Am. Diet. Assoc. 2005, 105, 227–232. [Google Scholar] [CrossRef] [PubMed]
- Baker, S.S.; Baker, R.D. Early exposure to dietary sugar and salt. Pediatrics 2015, 135, 550–551. [Google Scholar] [CrossRef] [PubMed] [Green Version]
- Harris, G.; Coulthard, H. Early eating behaviours and food acceptance revisited: Breast feeding and introduction of complementary foods as predictive of food acceptance. Curr. Obes. Rep. 2016, 5, 113–120. [Google Scholar] [CrossRef] [PubMed] [Green Version]
- Yuan, W.L.; Lange, C.; Schwartz, C.; Martin, C.; Chabanet, C.; de Lauzon-Guillain, B.; Nicklaus, S. Infant dietary exposures to sweetness and fattiness increase during the first year of life and are associated with feeding practices. J. Nutr. 2016, 146, 2334–2342. [Google Scholar] [CrossRef] [PubMed] [Green Version]
- Lampure, A.; Castetbon, K.; Deglaire, A.; Schlich, P.; Péneau, S.; Hercberg, S.; Méjean, C. Associations between liking for fat, sweet or salt and obesity risk in French adults: A prospective cohort study. Int. J. Behav. Nutr. Phys. Act. 2016, 13, 74. [Google Scholar] [CrossRef] [PubMed]
- Brekke, H.K.; van Odijk, J.; Ludvigsson, J. Predictors and dietary consequences of frequent intake of high-sugar, low-nutrient foods in 1-year-old children participating in the ABIS study. Br. J. Nutr. 2007, 97, 176–181. [Google Scholar] [CrossRef] [PubMed] [Green Version]
- Nicklaus, S. The Role of Dietary Experience in the Development of Eating Behavior during the First Years of Life. Ann. Nutr. Metab. 2017, 70, 241–245. [Google Scholar] [CrossRef] [Green Version]
- Pepino, M.Y.; Mennella, J.A. Factors contributing to individual differences in sucrose preference. Chem. Sens. 2005, 30, i319–i320. [Google Scholar] [CrossRef]
- Rolland-Cachera, M.F.; Maillot, M.; Deheeger, M.; Souberbielle, J.C.; Peneau, S.; Hercberg, S. Association of nutrition in early life with body fat and serum leptin at adult age. Int. J. Obes. 2013, 37, 1116–1122. [Google Scholar] [CrossRef] [Green Version]
- Kern, D.L.; McPhee, L.; Fisher, J.; Johnson, S.; Birch, L.L. The postingestive consequences of fat condition preferences for flavors associated with high dietary fat. Physiol. Behav. 1993, 54, 71–76. [Google Scholar] [CrossRef]
- Johnson, S.L.; McPhee, L.; Birch, L.L. Conditioned preferences: Young children prefer flavors associated with high dietary fat. Physiol. Behav. 1991, 50, 1245–1251. [Google Scholar] [CrossRef]
- Paroche, M.M.; Samantha, J.; Caton, S.J.; Vereijken, C.M.; Weenen, H.; Houston-Price, C. How Infants and Young Children Learn About Food: A Systematic Review. Front. Psychol. 2017, 8, 1046. [Google Scholar] [CrossRef] [Green Version]
- Fisher, J.O.; Birch, L.L. Eating in the absence of hunger and overweight in girls from 5 to 7 y of age. Am. J. Clin. Nutr. 2002, 76, 226–231. [Google Scholar] [CrossRef] [PubMed] [Green Version]
- Fisher, J.O.; Birch, L.L. Parents’ restrictive feeding practices are associated with young girls’ negative self-evaluation of eating. J. Am. Diet. Assoc. 2000, 100, 1341–1346. [Google Scholar] [CrossRef] [Green Version]
- Tabacchi, G.; Giammanco, S.; La Guardia, M.; Giammanco, M. A review of the literature and a new classification of the early determinants of childhood obesity: from pregnancy to the first years of life. Nutr. Res. 2007, 27, 587–604. [Google Scholar] [CrossRef]
- Vollmer, R.L.; Bartoshuk, L.M. Practices and preferences: Exploring the relationships between food-related parenting practices and child food preferences for high fat and/or sugar foods, fruits, and vegetables. Appetite 2017, 113, 134–140. [Google Scholar] [CrossRef] [PubMed]


| Study Group | Taste Preference Test ** | |||
|---|---|---|---|---|
| Low-Fat | High-Fat | Low-Sweet | High-Sweet | |
| children | 45 (30.0%) | 105 (70.0%) | 75 (50.0%) | 75 (50.0%) |
| mothers | 39 (26.0%) | 111 (76.0%) | 97 (64.7%) | 53 (35.3%) |
| p | 0.532 | 0.009 * | ||
| Taste Preferencein Children | Taste Preference in Mothers ** | |||
|---|---|---|---|---|
| Low-Fat | High-Fat | Low-Sweet | High-Sweet | |
| low-fat | 10 (25.6%) | 35 (31.5%) | − | − |
| high-fat | 29 (74.4%) | 76 (68.5%) | − | − |
| low-sweet | − | − | 54 (55.7%) | 21 (39.6%) |
| high-sweet | − | − | 43 (44.3%) | 32 (60.4%) |
| p-value | 0.4899 | 0.0603 | ||
| Taste Preference Test | Body Mass Classification | Odds Ratio (95% Confidence Interval) | p-Value | |||
|---|---|---|---|---|---|---|
| Normal (Referent) | Overweight + Obese | |||||
| N | % | N | % | |||
| low-fat (c) | 27 | 36.0% | 18 | 24.0% | 1.78 (0.88–3.62) | 0.109 |
| high-fat (c) | 48 | 64.0% | 57 | 76.0% | ||
| low-sweet (c) | 44 | 58.7% | 31 | 41.3% | 2.02 (1.05–3.86) | 0.034 * |
| high-sweet (c) | 31 | 41.3% | 44 | 58.7% | ||
| low-fat (m) | 24 | 29.6% | 15 | 21.7% | 1.52 (0.72–3.19) | 0.272 |
| high-fat (m) | 57 | 70.4% | 54 | 78.3% | ||
| low-sweet (m) | 57 | 70.4% | 40 | 58.0% | 1.72 (0.88–3.38) | 0.113 |
| high-sweet (m) | 24 | 29.6% | 29 | 42.0% | ||
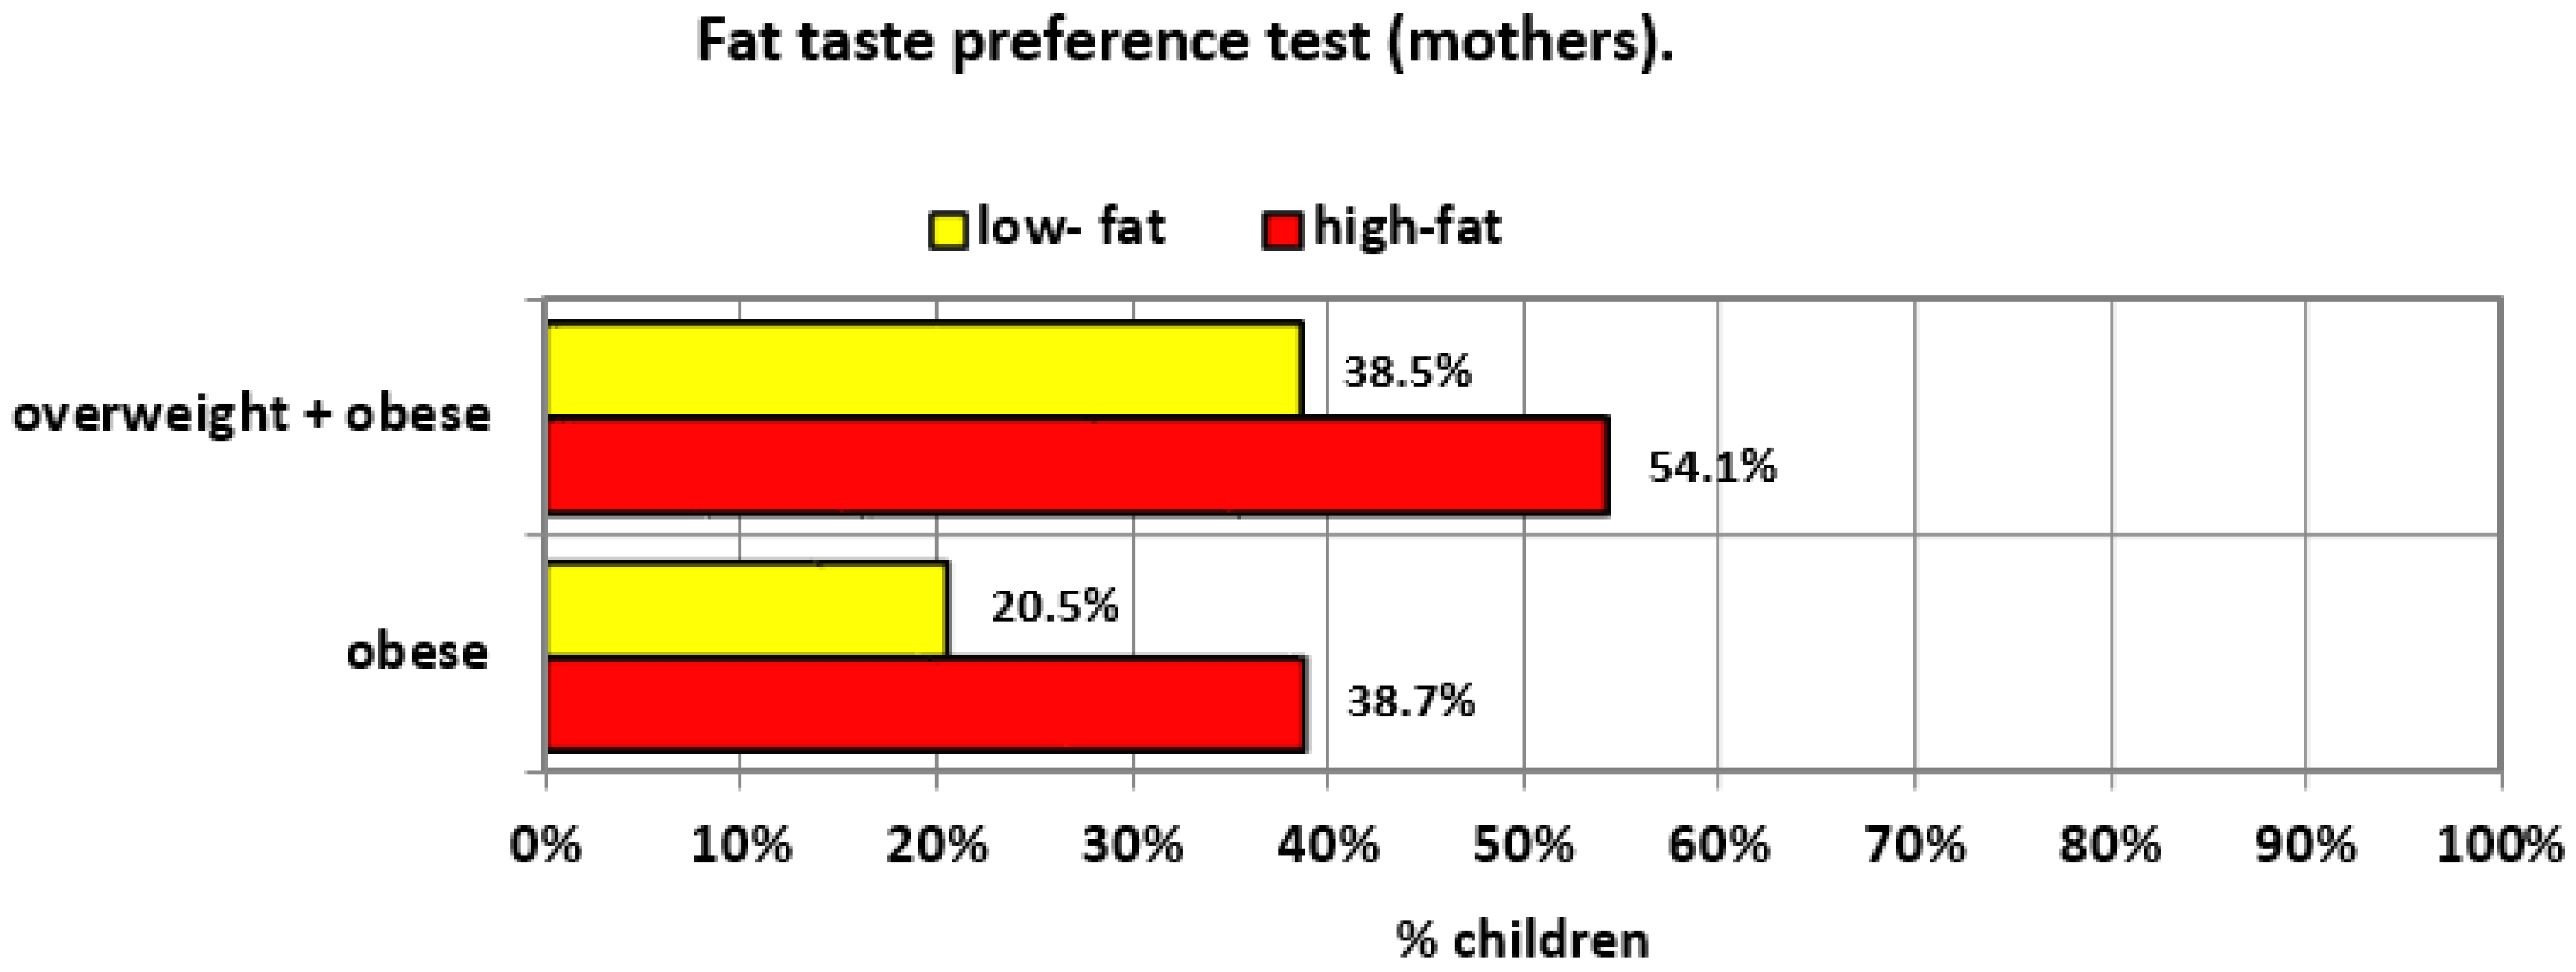
| BMI Class (Children) | Taste Preference Test (Mother) | Mothers’ BMI Class | |||||||||
|---|---|---|---|---|---|---|---|---|---|---|---|
| Low-Fat (Referent) N (%) | High-Fat N (%) | OR (95% CI) | Low-Sweet (Referent) N (%) | High-Sweet N (%) | OR (95% CI) | Normal (Referent) N (%) | Over-Weight N (%) | OR (95% CI) | Obese N (%) | OR (95% CI) | |
| normal | 24 (61.5%) | 51 (45.9%) | 1.88 (0.89–3.97) | 53 (54.6%) | 22 (41.5%) | 1.70 (0.86–3.34) | 59 (72.8%) | 12 (26.1%) | 7.60 (3.35–17.26) | 4 (17.4%) | 12.74 (3.90–41.63) |
| overweight and obesity | 15 (38.5%) | 60 (54.1%) | 44 (45.4%) | 31 (58.5%) | 22 (27.2%) | 34 (73.9%) | 19 (82.6%) | ||||
| p-value | 0.094 | 0.124 | <0.001 * | <0.001 * | |||||||
© 2020 by the authors. Licensee MDPI, Basel, Switzerland. This article is an open access article distributed under the terms and conditions of the Creative Commons Attribution (CC BY) license (http://creativecommons.org/licenses/by/4.0/).
Share and Cite
Sobek, G.; Łuszczki, E.; Dąbrowski, M.; Dereń, K.; Baran, J.; Weres, A.; Mazur, A. Preferences for Sweet and Fatty Taste in Children and Their Mothers in Association with Weight Status. Int. J. Environ. Res. Public Health 2020, 17, 538. https://doi.org/10.3390/ijerph17020538
Sobek G, Łuszczki E, Dąbrowski M, Dereń K, Baran J, Weres A, Mazur A. Preferences for Sweet and Fatty Taste in Children and Their Mothers in Association with Weight Status. International Journal of Environmental Research and Public Health. 2020; 17(2):538. https://doi.org/10.3390/ijerph17020538
Chicago/Turabian StyleSobek, Grzegorz, Edyta Łuszczki, Mariusz Dąbrowski, Katarzyna Dereń, Joanna Baran, Aneta Weres, and Artur Mazur. 2020. "Preferences for Sweet and Fatty Taste in Children and Their Mothers in Association with Weight Status" International Journal of Environmental Research and Public Health 17, no. 2: 538. https://doi.org/10.3390/ijerph17020538