Investigation the Stability of Water in Oil Biofuel Emulsions Using Sunflower Oil


Department of Mechanical, Materials and Manufacturing Engineering, The University of Nottingham, University Park, Nottingham NG7 2RD, UK
*
Author to whom correspondence should be addressed.
ChemEngineering 2020, 4(2), 36; https://doi.org/10.3390/chemengineering4020036
Submission received: 4 May 2020
/
Revised: 30 May 2020
/
Accepted: 4 June 2020
/
Published: 5 June 2020
(This article belongs to the Special Issue Emulsion Process Design)
Abstract
:Targets to reduce CO2 emissions by 75% and NOx emissions by 90% by 2050 in aviation have been set by The Advisory Council for Aviation Research and Innovation in Europe. Sustainable fuels, e.g., emulsified biofuel, have demonstrated promise in reducing emissions and greenhouse gases. The aim of this project is to investigate the stability of a water in oil emulsion using sunflower oil. The primary objective is to achieve an emulsion which is stable for at least 4 days, and the secondary objective is to investigate how altering the emulsification parameter values of the surfactant hydrophilic-lipophilic balance (HLB), energy density and sonotrode depth in an ultrasonication procedure can impact the stability. The stability of each emulsion was measured over a period of 14 days. The main outcome is that two of the 14 emulsions made remained stable for at least 14 days using a surfactant HLB of five, which proved to be the optimum value from those tested. The results also show that, by using the sonotrode in a higher starting position, emulsions achieved a greater stability. Furthermore, over-processing of the emulsion was determined, with the point of over-processing lying between an energy density of 75 and 200 W.s/mL.
1. Introduction
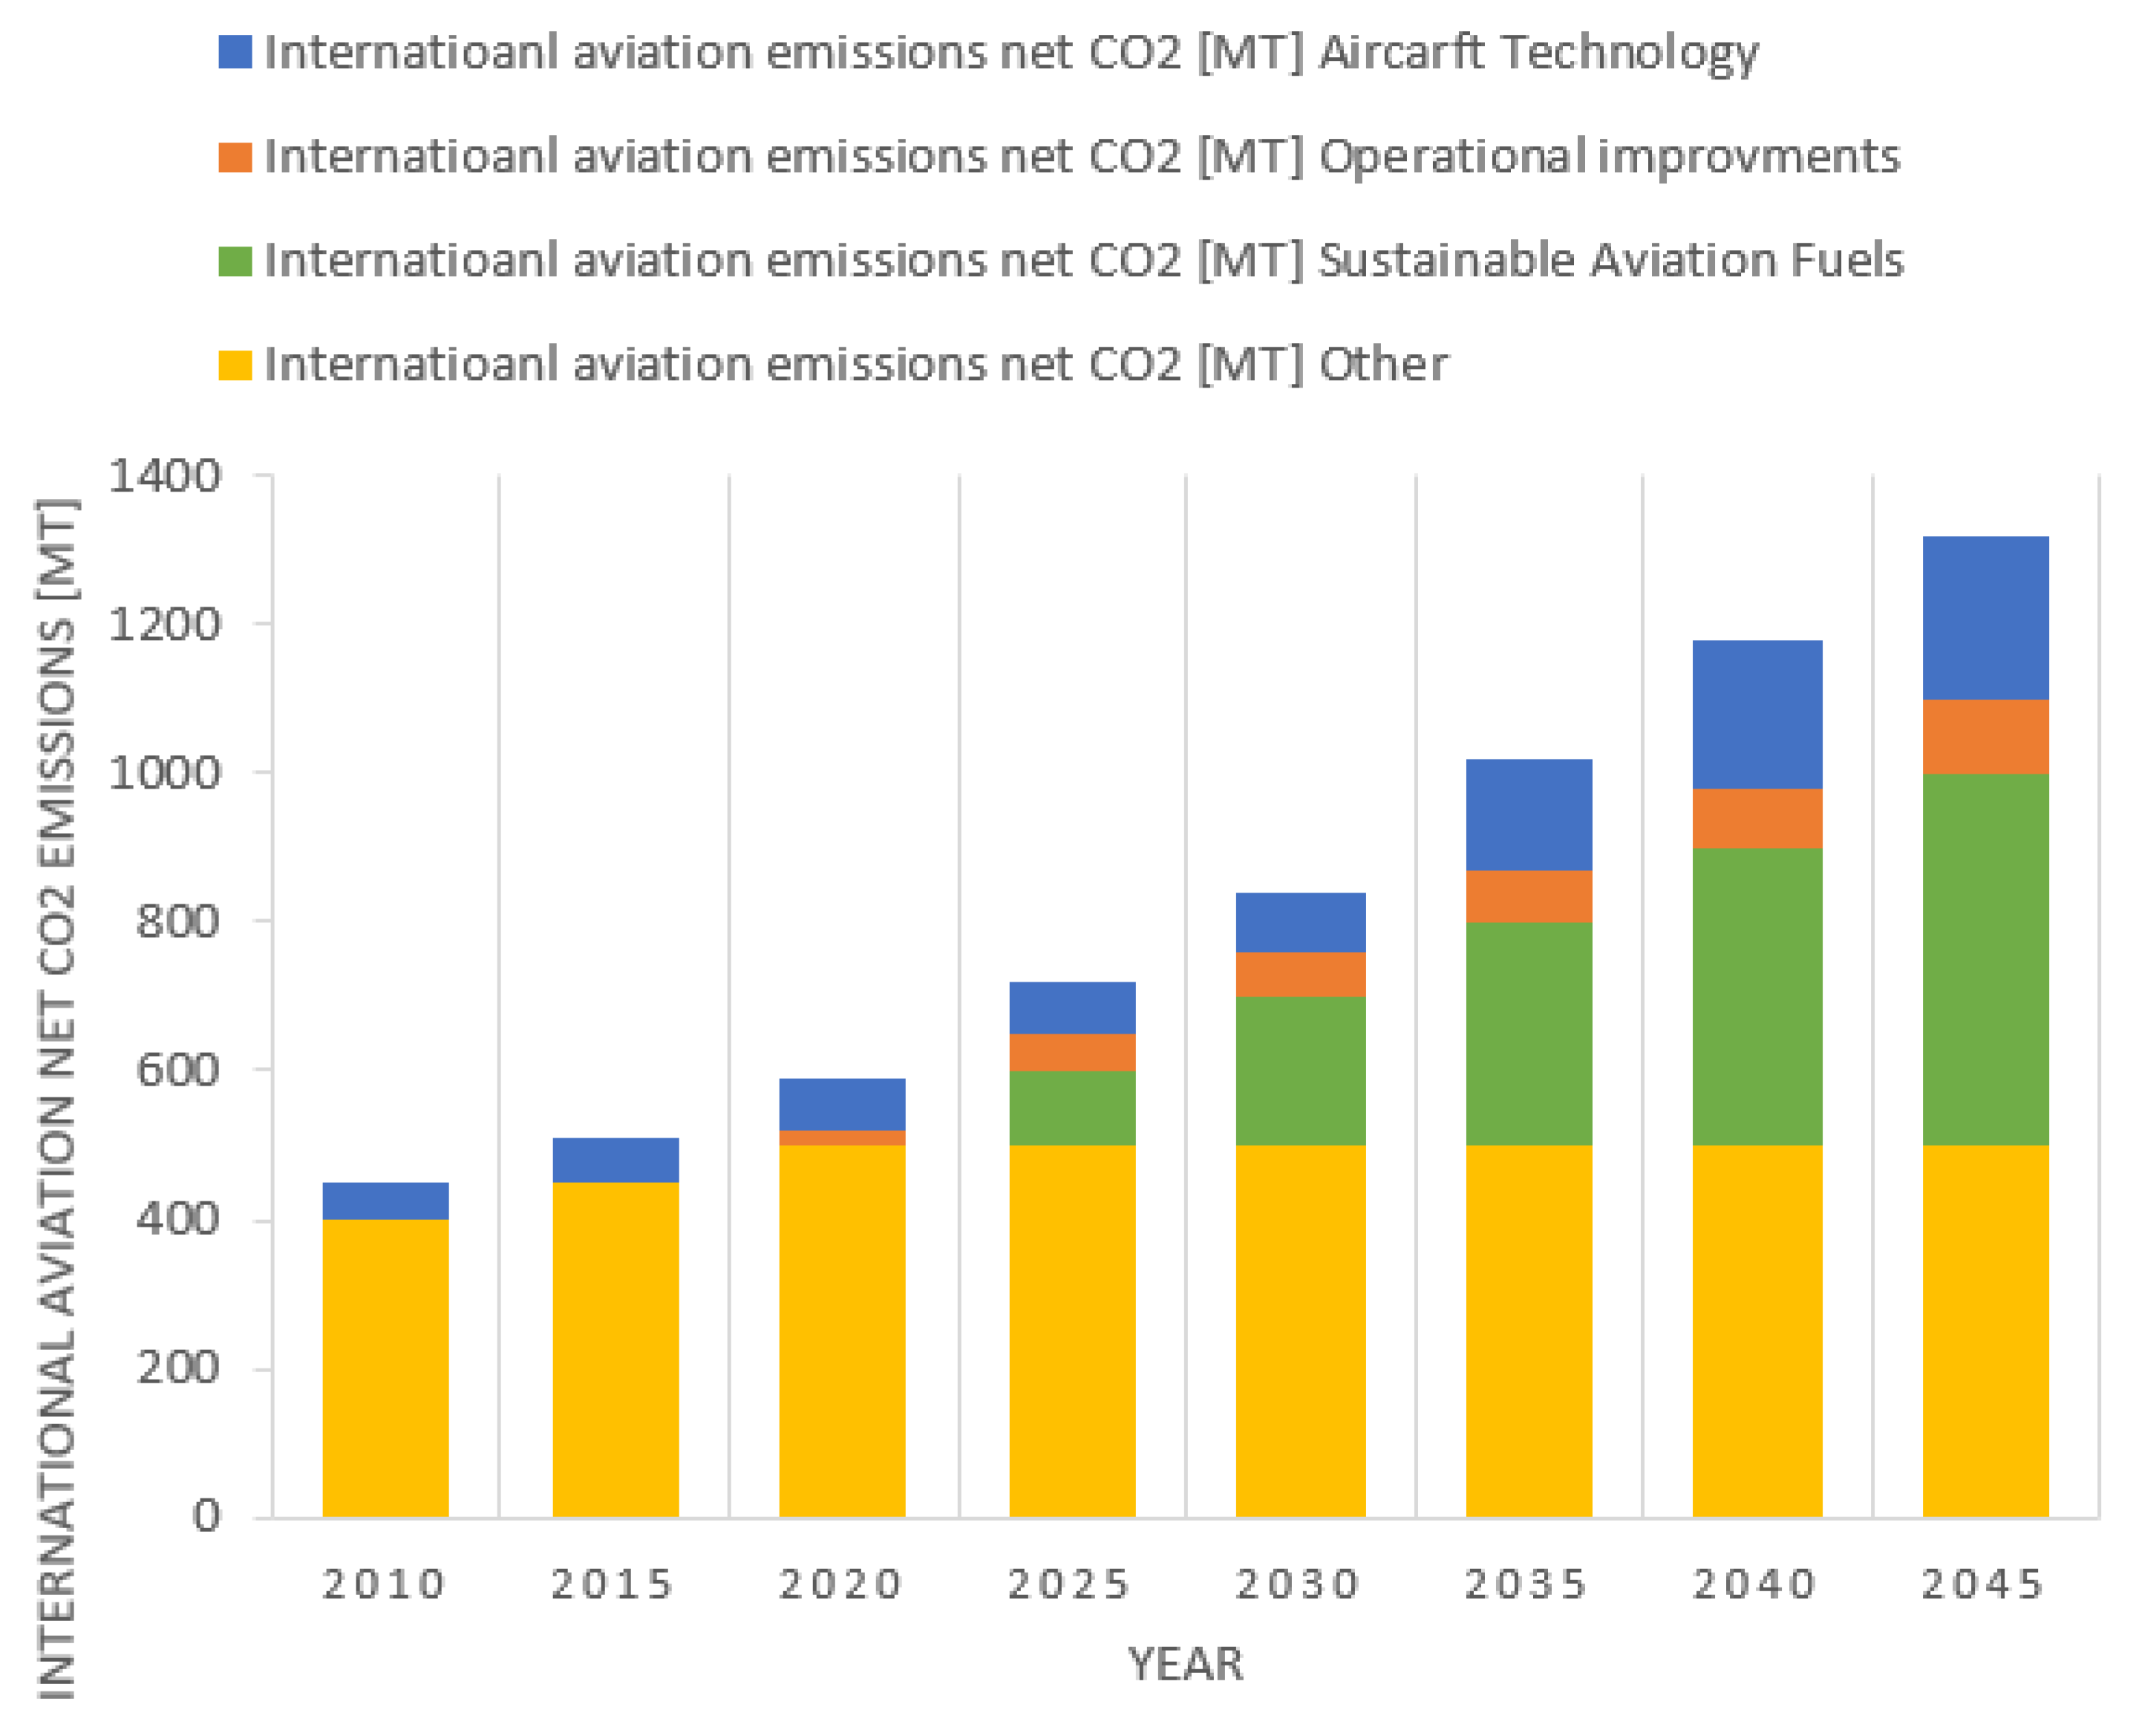
At present, the total greenhouse gas (GHG) emissions from the aviation industry account for more than 2% of global emissions, and in the absence of additional measures by 2050, emissions could increase by over 300% compared to 2005 [1]. To prevent this from happening, the Advisory Council for Aviation Research and Innovation in Europe (ACARE) has set emission targets for the aviation industry to meet by 2050, which state that CO2 emissions should be reduced by 75% and NOx emissions by 90% [2]. According to the International Civil Aviation Organization (ICAO), biofuels are considered to be an important factor in reducing emissions, as can be seen in Figure 1 [3].
In 2016, the most popular oil used for biodiesel production in the EU was rapeseed oil, accounting for 38% of the biodiesel consumed in that year [4]. To cultivate, process, transport and distribute rapeseed oil-based fuels, 46 g of CO2 is released per MJ of fuel produced. For sunflower oil-based fuels, only 34 g of CO2 is released [5]. Therefore, if the source of biofuel was switched from rapeseed oil to sunflower oil, there would be an opportunity to reduce emissions further.
The performance of potential fuels can be improved and NOx emissions can be reduced with the addition of water to form water in oil (W/O) emulsions [6,7,8,9,10]. However, water in oil emulsions will likely increase engine corrosion, which has been attributed to the higher acidity of emulsified fuel due to utilizing surfactants [11,12] and an increase of the fuel viscosity [13], which reduces the tendency of fuel breakup and atomization. An emulsion is a mixture of liquids that are immiscible with each other, and will eventually separate into individual phases [14]. Debnath, et al. [10] found that water-emulsified palm oil methyl ester (POME) improved the brake thermal efficiency (BTE) of a diesel engine by 11%, and POME that had not been emulsified resulted in a BTE that was 3% lower than diesel and released 20% more NOx than its emulsified counterpart. This could make water-emulsified fuels ideal for meeting the ACARE targets.
Emulsions should remain stable (i.e., not separate into individual phases of water and oil) for long enough after production to be used in flight. Stability tests for various W/O emulsions have previously been performed, and the results are dependent on the base fuel [9]. Sunflower oil could be an ideal base fuel that favours a reduction in GHG emissions. Therefore, the aim of this project is to investigate the stability of a water in sunflower oil emulsion, with the objectives of achieving a stability time of at least 4 days and understanding how the stability is affected during its preparation. Sunflower oil emulsions have not been stability tested before, and this time period of 4 days was chosen as a similar vegetable oil-based emulsion, using soybean oil, has been stability tested and was stable for 96 h (4 days) [12]. It would be ideal to test if sunflower oil can exceed this target.
The stability of an emulsion is driven by the droplet size of the water which forms in the oil. Smaller droplet sizes indicate a greater stability, since larger droplets favour the emulsion breakdown process driven by Ostwald Ripening and Coalescence [14]. The complete phase separation of an emulsion can happen due to a variety of particulate processes, such as flocculation, creaming or sedimentation, coalescence and Ostwald’s Ripening [15,16]. Phase separation or breakdown can occur through the direct route, starting from the original emulsion through Ostwald’s Ripening, whilst the other route must pass through the process of coalescence, where flocculation leading to coalescence or creaming and sedimentation will eventually transform into coalescence before phase separation. The flocculation process can be described as droplets that gather together to create an aggregate but do not change their original size. Creaming and sedimentation are influenced by gravity, which causes concentration gradients based on the density differences associated with the two immiscible liquids. Coalescence is the process where small droplets merge to create fewer larger droplets, and this process contributes to the reduction of the interfacial area of the system. Ostwald’s Ripening is strictly limited to emulsions with a limited solubility in the continuous phase, so that smaller droplets decrease and vanish while larger droplets grow in size. The transport medium that supports this mechanism of soluble liquid transfer is the continuous phase. Based on this, we can infer that the rate of Oswald’s Ripening depends on the mutual solubility of the oil and water phase. There is an additional mechanism for phase separation which is due to phase inversion, and in this process, the dispersion phase becomes the continuous phase and the opposite can also occur. The following background discusses how the water droplet size can be reduced when preparing emulsions.
2. Background
The main areas of interest in this research include the parameters of the emulsification process that can be optimised to reduce the size of water droplets in W/O emulsions.
Surfactant, which is a chemical used in the emulsification process to help immiscible liquids form a homogenous mixture [17], is highlighted as a substance which can be optimised in the emulsification procedure. Furthermore, a particular point of interest is the technique used to homogenise water and oil together. The benefits of using an ultrasonication technique over mechanical techniques to perform this act are presented in this section. Further principles relating to the ultrasonication technique, such as the sonotrode tip position and sonication frequency and energy density, are then discussed.
2.1. Surfactants and HLB Values
Surfactants are used in the emulsification process to help immiscible liquids such as oil and water form a homogenous mixture. This is achieved by reducing the interface tension between the liquids [17]. It is possible to predict the type of emulsion that will form based on the hydrophilic-lipophilic balance (HLB) value of the surfactant used [17,18]. HLB is a measure of the balance of the size and strength of the hydrophilic (water-loving) and lipophilic (oil-loving) groups of the surfactant [18]. An HLB of between four and six is the suggested range for the creation of stable W/O emulsions, and it has been suggested that a value outside of this range may not result in an emulsion of this type [13,19]. However, in publications by Mondal and Mandal [6] and Karim, et al. [13], W/O emulsions were formed by using surfactants with HLB values of seven, eight and nine. The discrepancy here could relate to the fact that different oils have been used by researchers when making their emulsions, which may have altered the optimum HLB for their specific system. An optimum HLB for stability exists and is dependent on the oil that is used, the composition of the initial mixture and the chemical family of the surfactant(s) being used [18]. Since sunflower oil emulsions have not been stability tested before, their optimum HLB is unknown.
2.2. Homogenisation Procedure
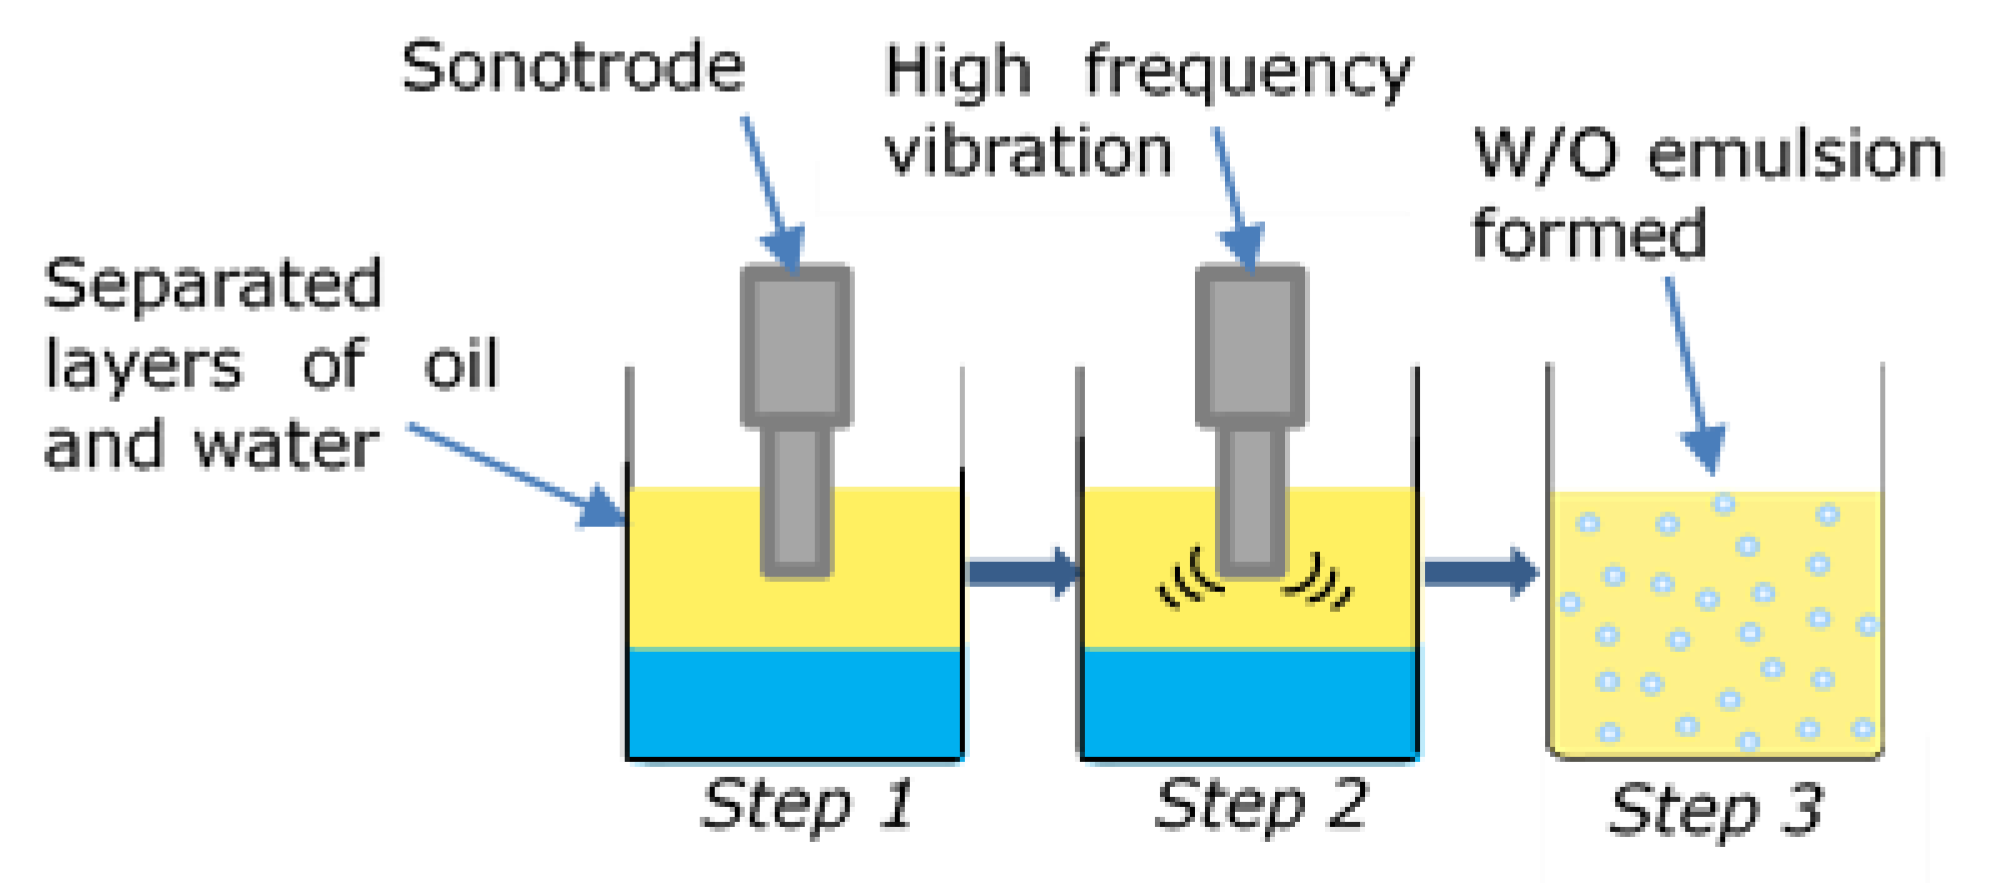
The homogenisation procedure used to emulsify oil and water has been known to affect the size of water droplets formed in W/O emulsions. Emulsification methods that are often compared are mechanical homogenisation and ultrasonication [6,13]. Mechanical homogenisation is the physical process used to reduce the interfacial tension between the two immiscible liquids of an emulsion [13]. This is usually executed through the use of a stirrer, as shown in [6]. Ultrasonication is the application of high-frequency vibration to perform the same task, and is usually applied through a sonotrode or bath, as seen in [6,10,19]. Figure 2 shows how ultrasonication is performed with a sonotrode.
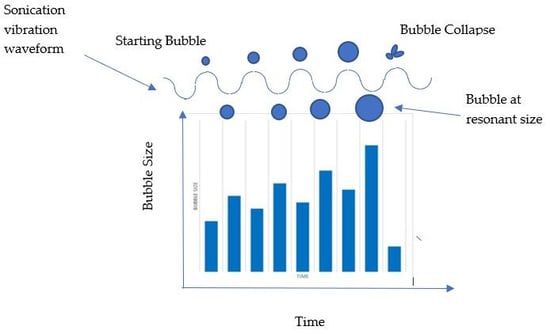
During ultrasonication, cavitation occurs, which is the formation of gaseous bubbles in the liquid medium that are cyclically compressed and expanded when ultrasonic waves are applied. Once the bubbles reach an unstable size, they will collapse [20] and shockwaves will form [21], causing the dispersion of molecules during the emulsification process. The compression and expansion of cavitation bubbles with ultrasonic waves can be seen in Figure 3 [22].
There is a general agreement that emulsions are more stable when prepared by ultrasonication rather than mechanical homogenisation [6,13]. Mondal and Mandal [6] found that, for a particular emulsion that was produced through ultrasonication, 45 h of stability was achieved. In comparison, the same emulsion that was produced through mechanical homogenisation only remained stable for 15 h. The higher stability obtained by ultrasonication can be attributed to the smaller droplet sizes [14].
2.3. Sonictaion Frequency and Energy Density
Figure 3 shows that the growth of cavitation bubbles is dependent on the frequency of the applied ultrasonication. At higher frequencies, the cycle of the ultrasonication waves is shorter and restricts bubble growth; however, at low frequencies, the bubbles will grow slower and are more violent when they collapse [20]. This could lead to shockwaves of a greater magnitude that may be more effective at dispersing the liquids to form an emulsion, and is probably the reason why low-frequency ultrasonication (20–45 kHz) is used in emulsification processes, such as those in [7,13,19,23]. Power dissipation is also known to affect the droplet size, and can be assessed through power density, ε (W/mL), which is a function of the power applied during ultrasonication, P (W), and processing volume, V (mL), as shown in Equation (1):
Li, et al. [23] have shown that a reduction in the power density will reduce the rate at which the droplet size reduces. However, whilst the power or volume may change, the effect this has on the droplet size can be altered by changing the sonication time [23]. A more useful parameter that takes time, t (s), into consideration and can be used to scale an emulsification process from a laboratory scale to large-volume production is the energy density, Ev (W.s/mL) [24]. This is shown in Equation (2):
Kojima, et al. [7] demonstrated the importance of time, and therefore energy density, for emulsion stability. It was shown that droplet size reached a limiting value with time, i.e., for a particular emulsion composition, droplet size did not reduce any further after 10 min. Conversely, Mahdi Jafari, et al. [25] observed an increase in droplet size after 20 s of processing, where an emulsion exhibited an increase in dispersed phase particle size from 243 to 298 nm. This phenomenon was referred to as over-processing. This was not observed for all of the emulsion compositions that were experimented with in [25], as some of the test cases found that the droplet size had reached a limiting value, thus agreeing with Kojima, et al. [7]. It is unknown whether sunflower oil emulsions experience over-processing, and this will need to be tested.
2.4. Sonotrode Tip Position
The position of the sonotrode during emulsification can affect the stability of the emulsion, as shown in [7]. In this study, moving the probe from a height of 5 to 60 mm changed the stability of the 70 mm high emulsion. The highest stability was obtained when the probe was placed in the highest position (60 mm), whilst the lowest stability was obtained at the lowest position (5 mm). This may be explained by the fluid movement in the control volume during emulsification. The computational fluid dynamics (CFD) results presented in Figure 4 [26] demonstrate the velocity field induced in a fluid that is subject to ultrasonication. The image shows that the fluid flows away from the ultrasonication source, i.e., the tip of the sonotrode, and recirculates as the fluid rebounds off the control volume boundary.
The region under the sonotrode tip where cavitation occurs (the cavitation zone) was an important feature in an experiment performed by Patel and Gogate [19]. A sonotrode that was able to create a stable emulsion for a 50 mL mixture could not do so for a 200 mL mixture, and this was attributed to the small cavitation zone. Since it is cavitation which drives the emulsification process through the collapse of gaseous bubbles [20], a large proportion of the fluid that is being processed should pass through the cavitation zone for effective emulsification [24]. This suggests that the recirculation effects shown in Figure 4, whereby the processed fluid cycles through the cavitation zone, are important for effective emulsification. The results obtained by Kojima et al. [7], suggesting that the least stable emulsion occurred when the sonotrode was placed 5 mm away from the bottom of the control volume, may be because recirculation effects were impeded. As this is, to the best of the authors’ knowledge, the only study testing the sonotrode depth, the results cannot be compared.
The information provided in this background section has highlighted the idea that the use of ultrasonication as a homogenisation process will lead to emulsions with a greater stability. The methodology used to create the water in sunflower oil emulsion therefore adopted the ultrasonication technique. The significance of the surfactant HLB, energy density and probe depth in terms of the stability was studied, and the factors were optimised to try to achieve the objective of obtaining an emulsion which is stable for at least 4 days.
3. Methodology
This methodology section will discuss how the three process parameters—surfactant HLB, energy density and sonotrode depth—were optimised through design of experiments (DOE) to try to achieve an emulsion that was stable for at least 4 days. The decision making behind the surfactant choice(s), emulsion composition and sonotrode vibration frequency will also be discussed.
3.1. Emulsion Composition
The composition of the emulsion, i.e., the percentage by mass of oil and water used, will affect the stability of the resulting emulsion. This has been shown in [7,10,12,13]. To ensure that the experiment could be completed within the given timeframe, the composition of the emulsion was kept constant. The composition used is shown in Table 1. This was chosen based on the recommendation of Mura, et al. [27], who tested the ignition properties of water in sunflower oil emulsions and suggested that this composition produces finely dispersed emulsions. This is ideal for creating stable emulsions.
The total volume of the emulsion was 150 mL. This is based on the recommended processing volume for the 13 mm diameter sonotrode that was used, communicated by the sonotrode supplier [28].
3.2. Surfactant Choice and HLB
Whilst the HLB value of the surfactant is significant in determining the water droplet size and emulsion stability, attention should also be paid to the chemical type of the surfactant. It has been suggested that the use of low-molecular-weight surfactants, such as Tween 80, will achieve smaller droplet sizes at a faster rate than the use of high-molecular-weight surfactants [29]. It is also recommended that blended surfactants, i.e., more than one, should be used for effective emulsification [17,18]. When determining the optimum HLB for a certain composition, practice suggests that a matched pair of Span and Tween emulsifiers should be used [18]. For this reason, the chosen surfactants that were blended in this experiment were Tween 80 and Span 80. This combination has also been a popular choice for testing emulsions other than sunflower oil [6,10,12].
The HLB values that were trialled were 4.3, 5 and 9. The values 4.3 and 5 were chosen as they fall within the recommended range of 4–6 for a stable W/O emulsion [17,18]. Given that the HLB of Span 80 (HLBSpan80) is 4.3 [30] and the HLB of Tween 80 (HLBTween80) is 15 [31], 4.3 was the lowest value that could be tested. HLB 9 was also tested since it was shown in [12] that, for a comparable emulsion (water in soybean oil), the optimum HLB for stability was 9. To determine the percentage quantity by mass of Tween 80 (%MassTween80) and Span 80 (%MassSpan80) to blend to obtain the desired HLB (HLBDesired), Equations (3) and (4) were used [14]:
Surfactant specification details are listed in Table 2.
After the quantities of surfactant to use were calculated, the density values shown in Table 3 were then used to determine the quantity, in grams, of each substance to use to make up the 150 mL mixture. A balance with an error of ±0.01 g, capable of measuring 50 g at a time, was used to measure the quantities which are shown in Table 4. Span 80 was mixed with sunflower oil and Tween 80 was mixed with water prior to sonicating the oil and water together. Mixing was performed with a magnetic stirrer sourced from the university.
3.3. Frequency and Energy Density
Ultrasonication can be applied through either an ultrasonic bath or a sonotrode. In this experiment, a sonotrode was used, as it is able to produce emulsions with smaller droplet sizes and a greater stability than a bath [34]. The sonicator used (Sonics Vibra Cell VCX130) was sourced from the university, whilst the 13 mm sonotrode was sourced externally. The Sonics Vibra Cell VCX130 has a fixed operating frequency of 20 kHz. This is ideal for emulsification and the reduction of the droplet size, since low-frequency ultrasonication causes more violent cavitation bubble collapse [20].
Preliminary testing showed that the Sonics Vibra Cell VCX130 draws 33 W of power when the 13 mm diameter sonotrode homogenises the 150 mL mixture of sunflower oil, water and surfactant(s) listed in Table 1. Given that the power drawn (P) and volume (V) remain constant, the only variable that can change the applied energy density (Ev) is the time (t), as seen in Equation (2). To understand which values of energy density to trial, a preliminary experiment was performed using the recommendations of the National Institute of Standards and Technology (NIST) [35] and Hielscher [36]. The experiment involved making four identical water in sunflower oil emulsions and applying four different energy densities: 50, 200, 400 and 600 W.s/mL. The test was repeated twice, and both times, the outcome showed that the emulsion which was subject to an energy density of 50 W.s/mL remained the most stable after 24 h. This confirmed that over-processing had occurred, since the emulsions that had been subjected to higher energy densities were sonicated for longer, but were less stable as a result. The results of this experiment can be seen in Figure 5.
The chosen values of energy density that were trialled to obtain a stable emulsion were therefore closer to 50 W.s/mL. The values trialled were 45, 55, 65 and 75 W.s/mL. Given that the power drawn (P) was 33 W and the emulsion volume (V) was 150 mL, the sonication times (t) applied to achieve these energy densities (Ev) are shown in Table 5.
3.4. Sonotrode Depth
The height of the emulsion in the beaker was 53 ± 1 mm. The sonotrode depth was varied between three positions: 5 ± 1 mm, 25 ± 1 mm and 45 ± 1 mm above the bottom of the beaker. These positions were chosen as they covered the majority of the height of the emulsion and were equally spaced.
3.5. Additional Consideration
Local heating effects due to cavitation could result in bulk heating of the emulsion, which may degrade the sample [35]. Using NIST recommendations [35], the beaker holding the emulsion was immersed in a cooling bath filled with water to the same level as the emulsion to keep the emulsion at room temperature. An indication of excessive bulk heating is the evaporation of the liquid, which was not experienced during the experiments due to the relatively low sonication energy density. The experimental setup is shown in Figure 6.
3.6. Experimental Procedure
The three factors identified were the HLB, energy density and sonotrode depth. Table 6 shows how these factors have been encoded.
The relationship between factors AB and AC was ignored, as the optimum value of factor A (HLB) is dependent on the oil that is used, the composition of the initial mixture and the chemical family of the surfactant(s) [18], i.e., it is not expected that the energy density and sonotrode depth will influence the optimum HLB. Therefore, a partial factorial method was chosen, which reduced the number of treatments from 36 to 14. The time saved allowed three repeats of the experiment. The 14 treatments chosen were selected such that the effects of each factor on the emulsion’s stability could be observed by changing one factor at a time. The experimental matrix is shown in Table 7.
The 14 emulsions were observed over a period of 14 days to identify separation of the oil and water mixture. The percentage stability of each emulsion (Es%) was measured using a similar technique to [7] (see Equation (5)), where the emulsion volume was compared at the point of no separation and at the point of measurement where oil and water may have separated. Since the emulsions were kept in a container with a constant cross section, only the height was measured. The raw measurements therefore consisted of recording the height of the emulsions straight after they had been prepared (ha), i.e., at 100% stability, and then revisiting each emulsion every day for 14 days to record the new emulsion height (hb).
The time (measured in days) for which an emulsion remained 100% stable was recorded. The objective of this project was achieved if at least one of the 14 emulsions remained 100% stable for at least 4 days.
The results were accepted if the three replicates for the treatment which led to the largest mean stability time could produce a 95% confidence interval with lower and upper bounds that were within ±1 day of the sample mean.
4. Results and Discussion
The main topics of interest in this results section are the determination of whether any of the 14 emulsions remained 100% stable for at least 4 days and understanding the optimal values of the HLB, energy density (Ev) and probe depth that would help to achieve such a result. The results from the experiment are shown in Table 8.
4.1. Stability Time
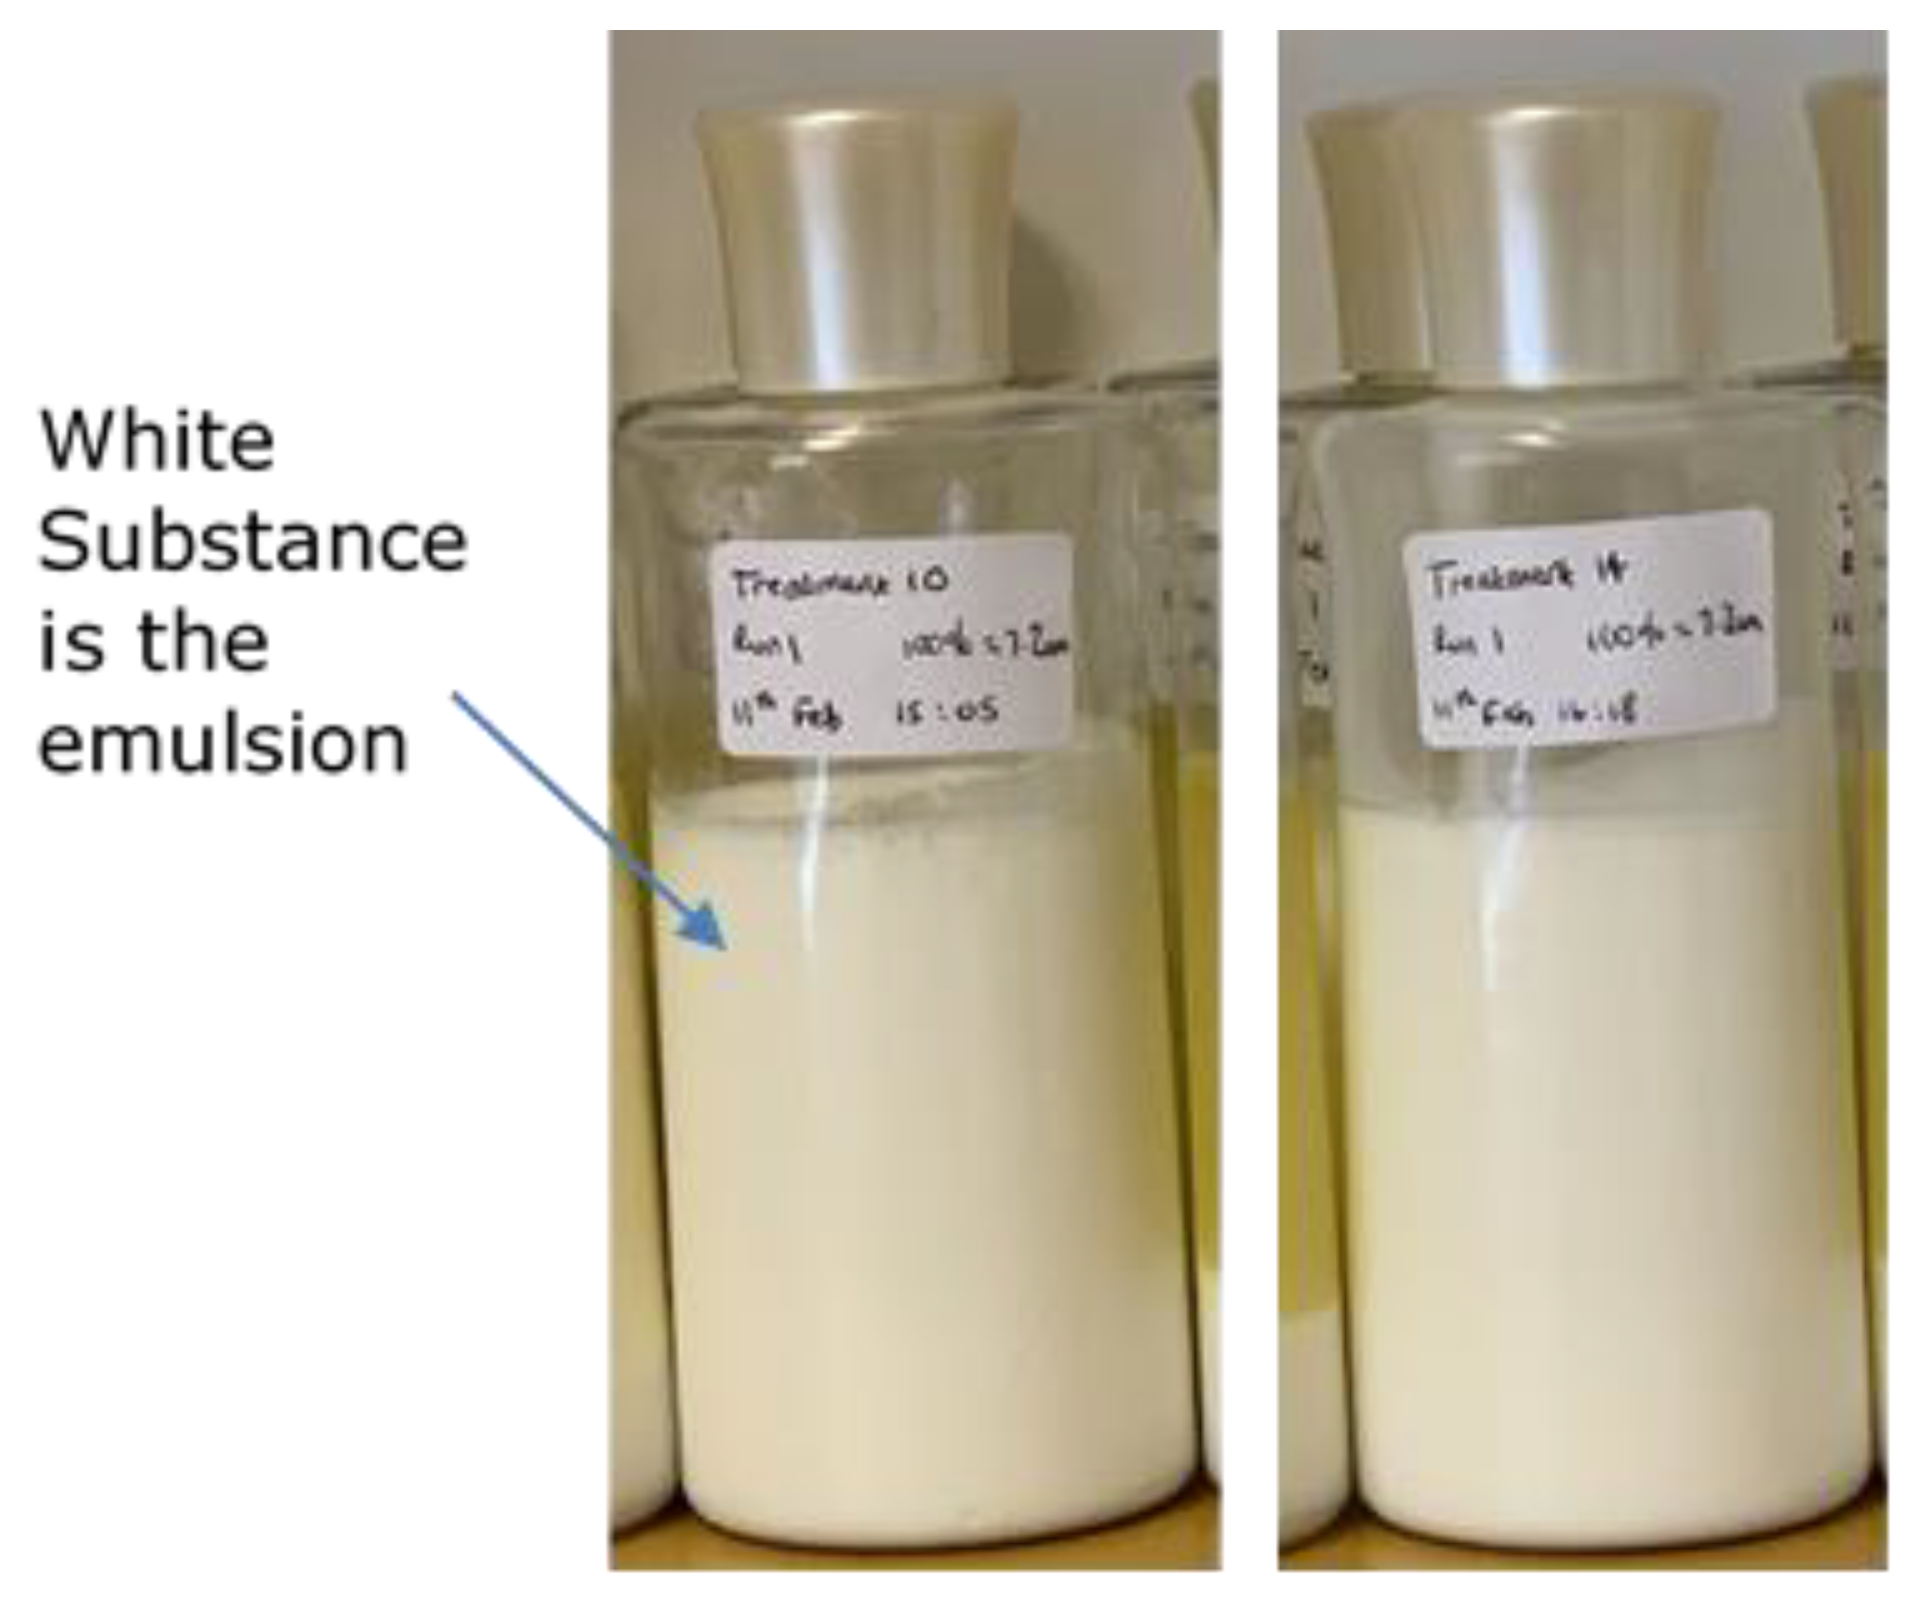
As stated in Section 3.6, the results in Table 7 can be accepted if the three replicates for the treatment(s) which lead to the greatest mean stability time can produce a 95% confidence interval with lower and upper bounds that are within ±1 day of the sample mean. The treatments with the largest mean stability time were 10 and 14, with a time of 14 days. There was no variance in the results for either of these treatments, so the acceptance criteria were satisfied. However, it should be noted that each of the 14 treatments were no longer observed after the 14 day observation period was over, for a given replicate. Therefore, the ‘true’ mean stability time and variance for both treatments 10 and 14 were undetermined, as both of these were still 100% stable on day 14 of observation, but were not observed after this in order to ascertain their ‘true’ 100% stability times. Despite this, it is clear that the objective of achieving an emulsion which is stable for at least 4 days was achieved through treatments 10 and 14. Images of treatment 10 and 14 displaying 100% stability can be seen in Figure 7.
Table 8 shows that only four of the 14 treatments had a mean 100% stability time that was greater than 0 days. These were treatments 2, 7, 10 and 14. Treatments 2 and 7 recorded similar results. Both of these had a mean stability time of 0.33 days, but the standard error of the mean was also 0.33 days. It is evident that treatments 10 and 14 are superior to both 2 and 7, and a t-statistic can be used to support this statement. Testing the hypothesis that either treatment 10 or 14 will produce an emulsion which is at least 13 days more stable than either treatment 2 or 7, the t-statistic returns a 94.2% confidence value (see Appendix B). To understand why treatments 10 and 14 are favourable, the effects that the values of HLB, energy density (Ev) and probe depth have on the emulsion stability need to be assessed. The following discussions assess the effects of changing one factor at a time.
4.2. Effects of HLB
The values of HLB trialled in this experiment were 4.3, 5 and 9. Figure 8 shows the mean stability measurements over the 14-day observation period, calculated from Equation (5) for treatments 1, 4 and 6. For these treatments, the probe depth was kept constant (5 mm), as was the energy density (Ev) (75 W.s/mL). The only variable was the surfactant HLB. As shown in Figure 8 and Table 7, none of the treatments plotted (treatments 1, 4 and 6) could remain 100% stable for at least 1 day. However, the plot clearly shows that, over a period of 14 days, using a surfactant with an HLB of 5 will result in a more stable emulsion than using a surfactant with an HLB of 4.3 or 9. HLB values lower than 9 tend to be suitable for forming water in fuel emulsions [12,13]. The samples in the current study where subjected to drop tests [15] where a single emulsion droplet was deposited on pure sunflower oil and on pure water separately. If the emulsion is dispersed in sunflower oil, but not in water, then it is a water in oil emulsion, and the oil is the continuous phase; otherwise, it is an oil in water emulsion. The tests conducted were repeated three times, and it was confirmed that all samples tested were water in oil emulsions (see Appendix A). The emulsion which used a surfactant HLB of 5 (treatment 4) was 83.33 ± 3.50% stable 14 days after it had been made. In comparison, using an HLB of 9 (treatment 6) resulted in a stability of 76.90 ± 2.00%, and using an HLB of 4.3 (treatment 1) resulted in a stability of 38.13 ± 3.00% after 14 days.
Using a surfactant with an HLB of 4.3 resulted in the least stable emulsion out of those plotted in Figure 8, which was 45.20% less stable after 14 days than the emulsion where an HLB of 5 was used. There are two possible reasons for this behaviour. One reason may be that, for a water in sunflower oil emulsion, using an HLB of 4.3 does not result in the optimal stability. Another reason to consider is that, when creating an emulsion with an HLB of 4.3, only one surfactant (Span 80) was used. It is known from the literature that the use of two surfactants blended together results in a more effective emulsification process [17,18]. For the consideration of emulsion stability, blends of emulsifiers are more desirable than a single chemical composition. Therefore, to optimize the stability, multiple factors play a role, such as the HLB value, concentration of the emulsifier and chemical family. For example, stearates display good viscosity control, while laurates deliver a sufficient stability at a low emulsion concentration. Blends of two or more emulsifiers have the advantage of combining lipophilic tendencies with hydrophilic tendencies to reach a desired HLB value. It was demonstrated that, for Tween 80/Span 80 blends, an intermediate composition had a more superior performance than an extreme composition (Span 80), which was attributed to much lower droplet sizes. Microscopic measurements revealed droplets in the nanoscale range, as compared to the microscale range for a single chemical composition emulsifier [15], so the use of a single surfactant with an HLB of 4.3 may be less effective at producing a stable emulsion.
All emulsions prepared with an HLB of 5 and 9 did, however, make use of blended surfactants. Figure 8 shows that using an HLB of 5 results in a 6.43% greater stability than using an HLB of 9 after 14 days. This suggests that, for a water in sunflower oil emulsion, the optimal HLB is closer to 5 than it is 9. This is contradictory to the study of Patil and Waghmare [12], who prepared a comparable emulsion (water in soybean oil) and found that the optimal HLB for stability was 9. However, it does support the theory from [18] suggesting that the optimal HLB is dependent on the base oil that is used, hence they are not the same.
Given that an HLB of 5 results in a better stability, it is not surprising that both treatments 10 and 14 were conducted using this value.
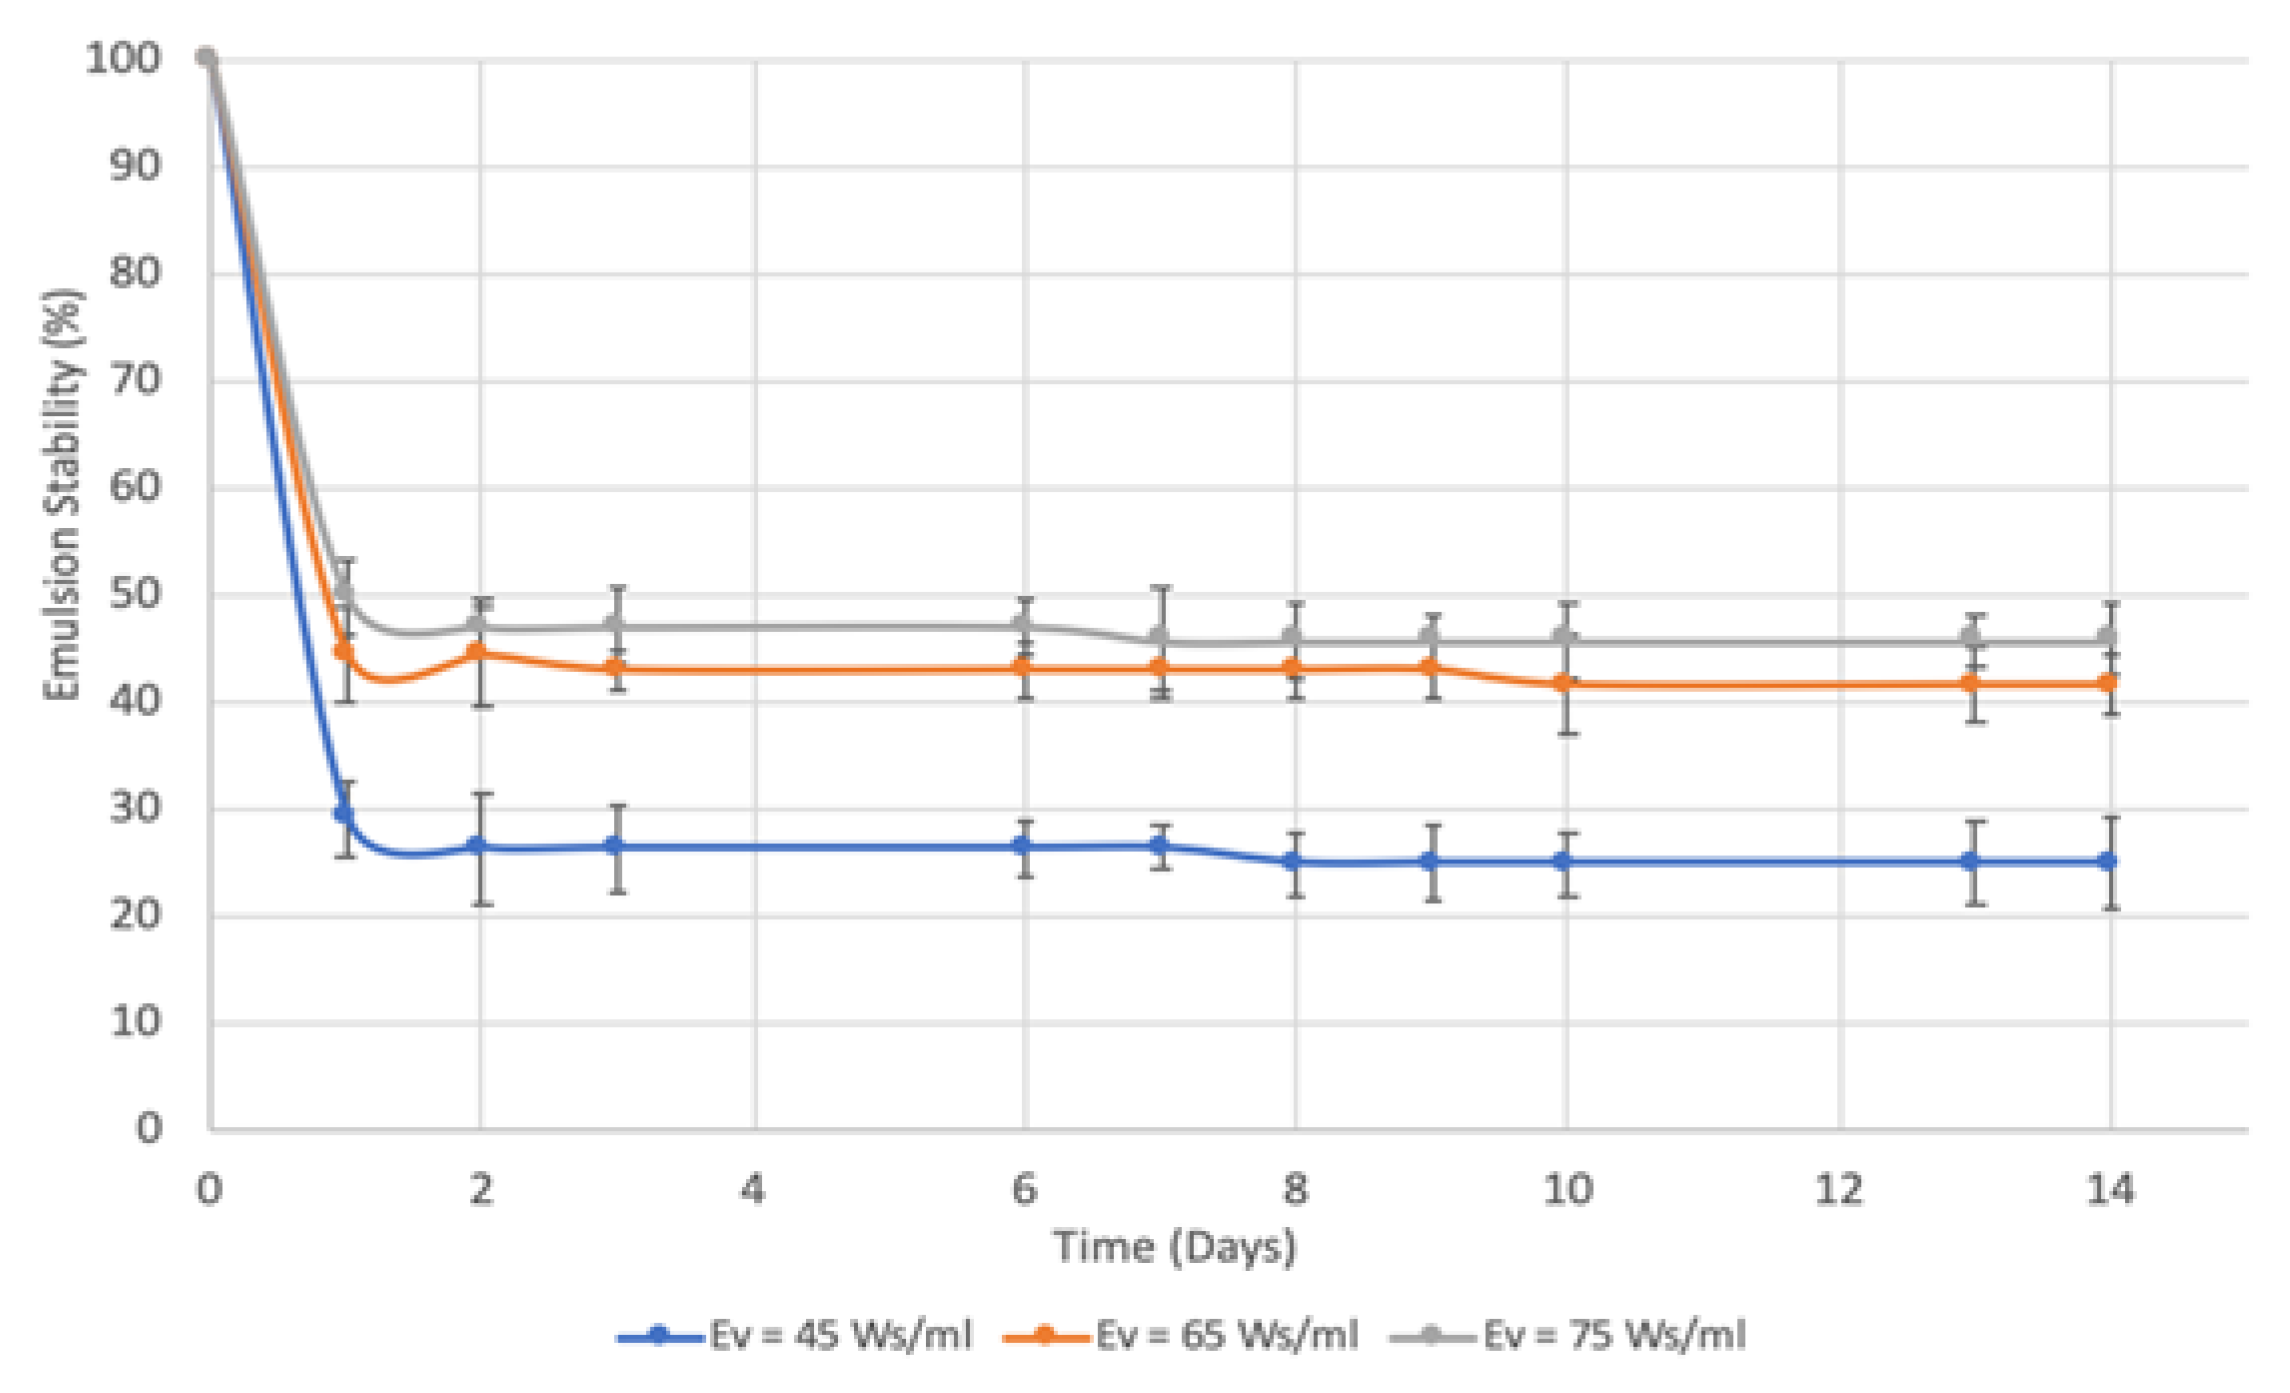
4.3. Effects of the Energy Density (Ev)
Preliminary testing showed that applying an energy density of 50 W.s/mL to a water in sunflower oil emulsion resulted in a more stable emulsion, as opposed to applying larger energy densities, where over-processing was visible. To try and find the optimum energy density, which is the point just before over-processing starts to occur, different energy densities close to 50 W.s/mL were trialled. Figure 9 shows the average stability plot for treatments 11, 12 and 13. For these treatments, the HLB was kept constant (4.3), as was the probe depth (45 mm). The only variable was the energy density (Ev).
The trend shown in Figure 9 suggests that increasing the energy density from 45 to 75 W.s/mL will increase the emulsion stability. At the end of the 14-day observation period, the emulsion which had an energy density of 75 W.s/mL applied to it (treatment 13) was 45.83 ± 3.32% stable. In comparison, the emulsion which had an energy density of 45 W.s/mL applied to it (treatment 11) was 25.07 ± 4.24% stable by day 14. Therefore, increasing the energy density by 30 W.s/mL improved the stability by 20.76%. Extrapolation of the above data to the extent possible indicates that the maximum occurs at 80.761 W.s/mL.
The results of the experiment, as well as the results from preliminary testing, suggest that the point of over-processing for a water in sunflower oil emulsion occurs between 75 and 200 W.s/mL, and that applying an energy density above 75 W.s/mL may result in a more stable emulsion. Treatments 10 and 14 had energy densities of 65 and 55 W.s/mL applied to them, whilst other treatments which were not as stable, such as treatment 1, did have the larger energy density of 75 W.s/mL applied. This suggests that, out of the parameters being tested (HLB, energy density and probe depth), energy density had less of an influence on the stability.
It has been shown in this experiment that over-processing does occur for a water in sunflower oil emulsion, and it is worth comparing the data to the results of Kojima et al. [7], who tested a water in diesel oil emulsion. Kojima et al. [7] found that this particular composition reached the peak stability after 10 min of sonication. The stability did not decrease after this point, hence no over-processing occurred. This provides supporting evidence that over-processing is dependent on the initial composition of the emulsion, and that not all emulsions will experience this phenomenon.
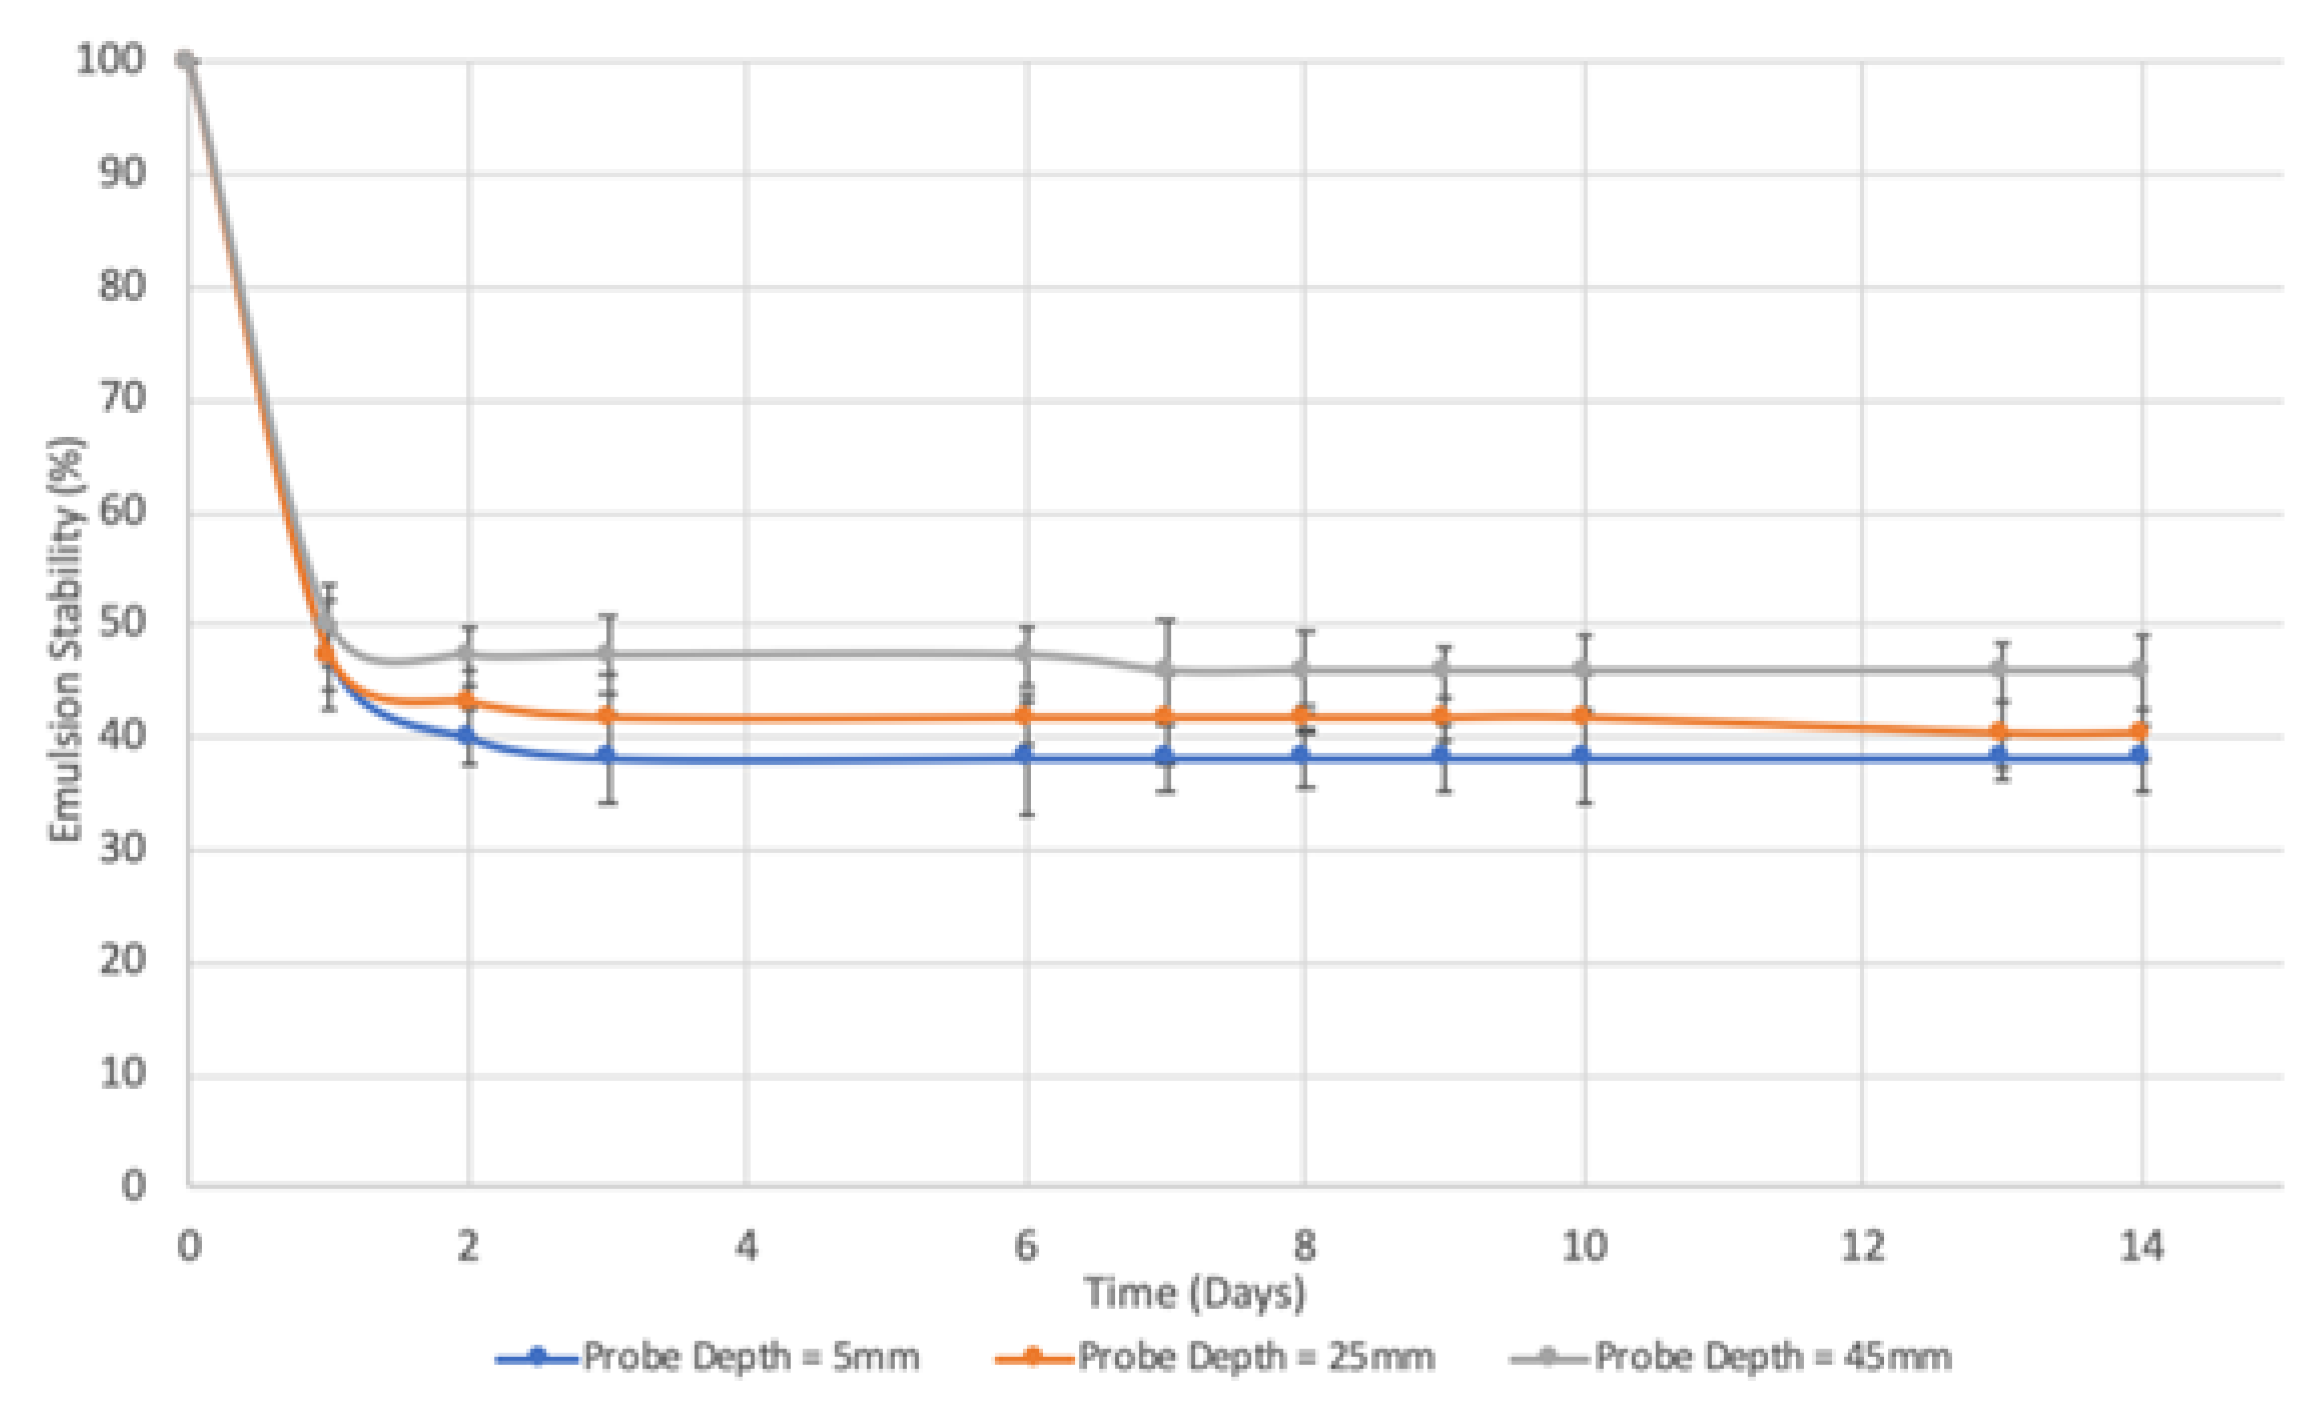
4.4. Effects of the Probe Depth
In this experiment, the effects of sonotrode probe depth on stability were studied. Its influence on stability can be seen in Figure 10, where the average stability plots for treatments 1, 9 and 13 are shown. Between these treatments, the HLB was kept constant (4.3), as was the energy density (75 W.s/mL). The only variable was the sonotrode depth.
It is evident from Figure 10 that, by increasing the depth of the sonotrode during sonication, the stability of the resulting emulsion will increase. Treatment 13, prepared with a probe depth of 45 mm, was 45.83 ± 3.32% stable by day 14. The emulsion prepared with the lowest probe depth (5 mm), treatment 1, was 38.13 ± 3.00% stable after 14 days. Therefore, increasing the depth of the probe by 40 mm increased the emulsion stability by 7.70%.
The trend shown in Figure 10 agrees with the study of Kojima et al. [7], who found that the stability of a water in oil emulsion is greatest when the probe is placed in the highest position, whilst the lowest stability is obtained when the probe is placed in its lowest position. The results can also be used to support the theory that the recirculation effects of the fluid during sonication were impeded when the probe was placed in its lowest position (5 mm), as this resulted in the poorest stability. As discussed in Section 2.4, Patil and Gogate [19] showed the importance of the cavitation zone in the creation of stable emulsions, and given that a poor stability was obtained when the sonotrode was placed in its lowest position, this would imply that the liquid was not recirculating into the cavitation zone.
Treatment 14 was prepared with the sonotrode in its highest position (45 mm), which explains its superior performance.
4.5. Stability Influence
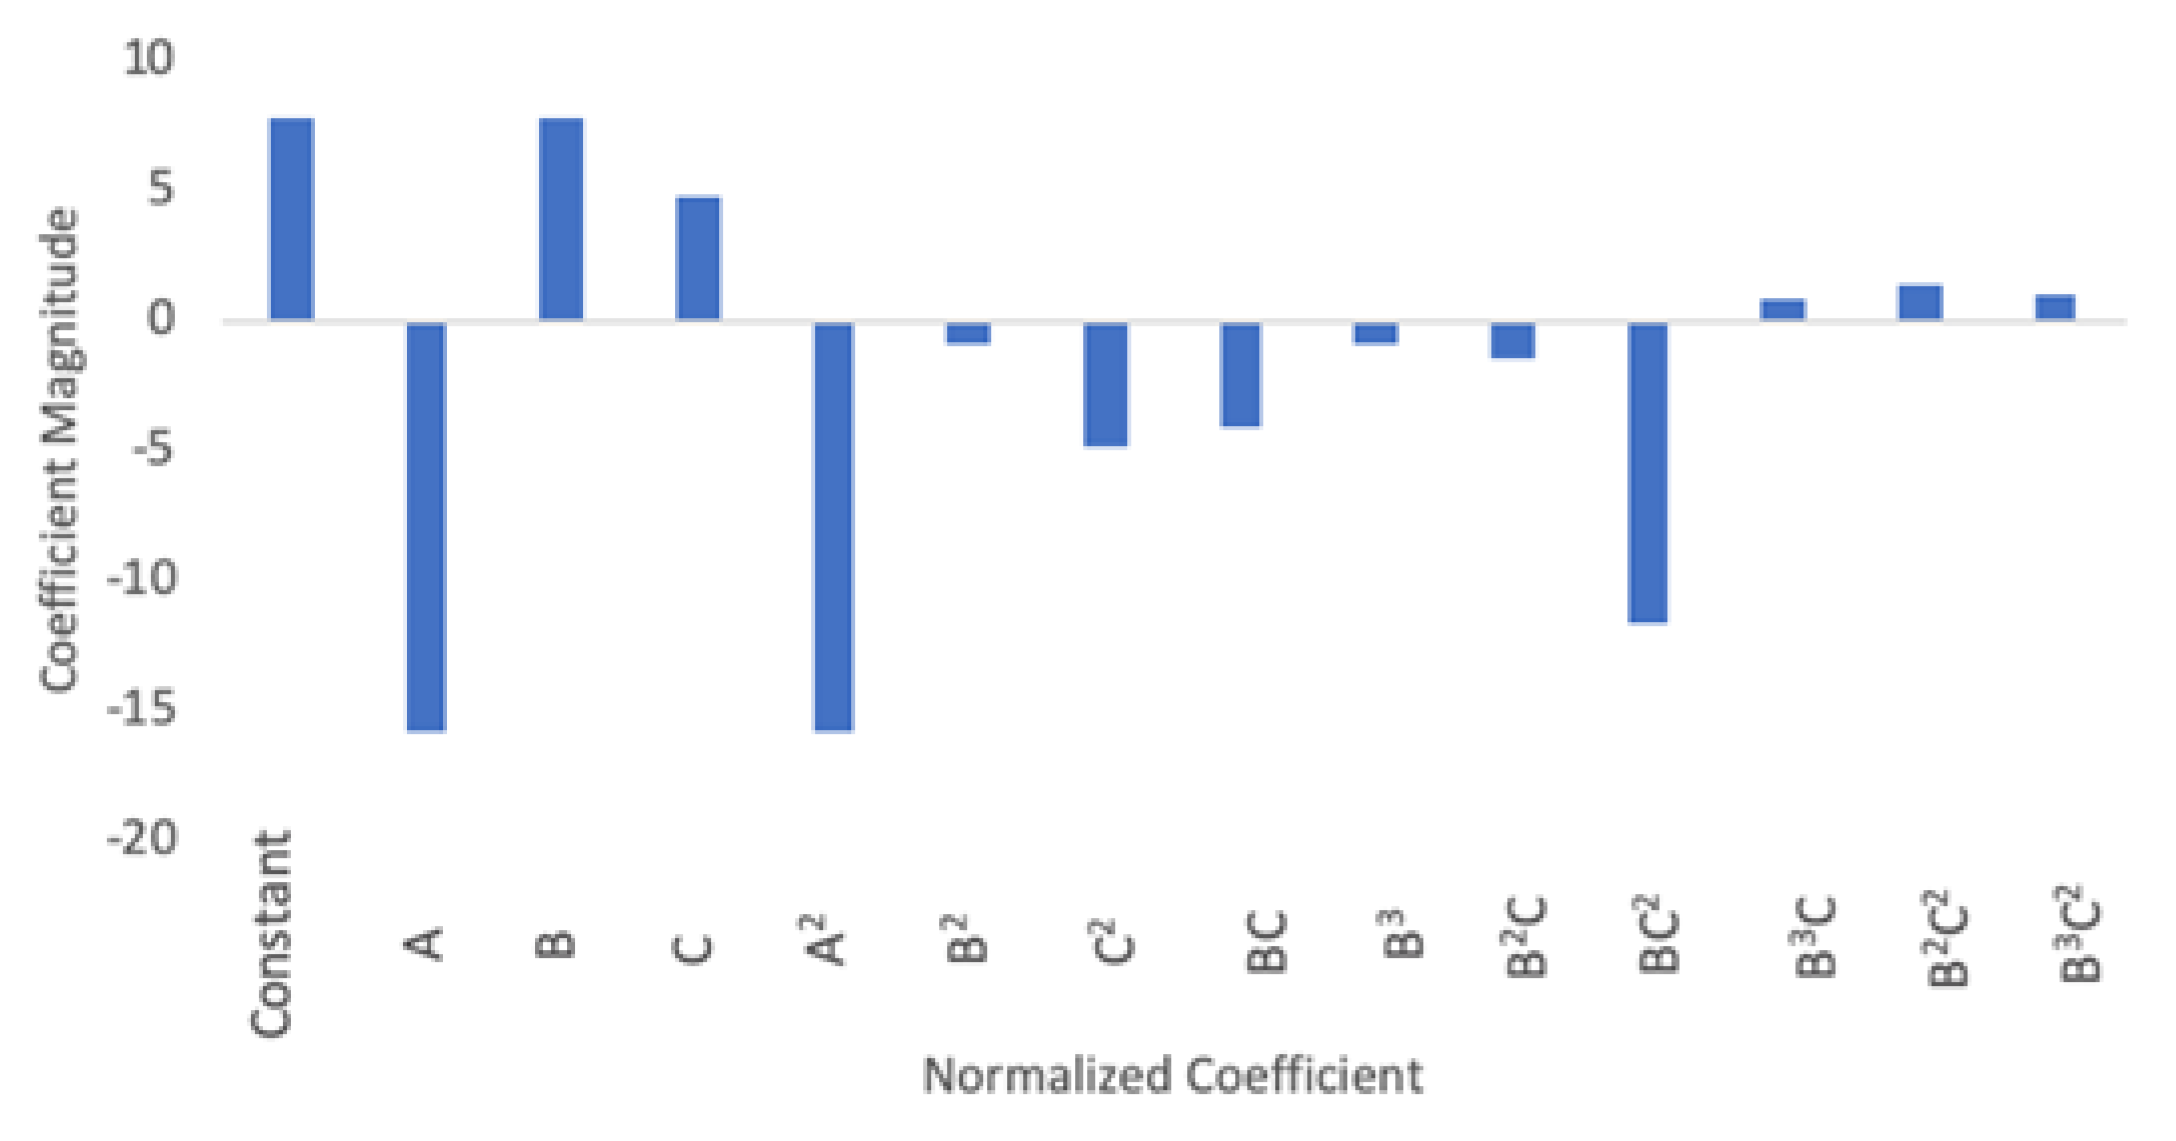
As mentioned in Section 3.6, the interaction between factor A (HLB) and any of the other factors was ignored. As a result, a partial factorial design of the experiments was used to create 14 emulsions. This also means that the response model for this experiment, whereby the response represents the 100% stability time of an emulsion, will also have 14 terms. From this response model, three of the 14 terms will be first-order terms representing factors A (HLB), B (energy density) and C (sonotrode probe depth). The response model is shown in Equation (6), whereby θx represents the coefficient.
By finding the magnitudes of the coefficients for these first-order terms in the response model (θ2, θ3, and θ4), it is possible to assess which of these factors has the greatest influence on the emulsion stability. The magnitudes of the coefficients which fit the phenomenological response model of this experiment can be seen in Figure 11.
By interpreting the magnitudes for the first-order normalized coefficients A, B and C, it can be seen that the magnitude of the coefficient for factor A is larger than that for factors B and C. Factor A has a coefficient magnitude of −15.93, whereas the magnitudes of factors B and C are 7.88 and 4.84, respectively. From this information, it can be seen that factor A (HLB) has a larger impact on the emulsion stability than factor B (energy density) and C (sonotrode probe depth).
This conclusion could be interpreted from the results presented in Table 8. Looking at treatments 11, 12, 13 and 14, the sonotrode probe depth was kept in the same position (45 mm). If the probe depth was the largest influencer, it would imply that all four treatments mentioned would achieve a similar stability time. However, the results in Table 7 show that treatments 11, 12 and 13 had a mean stability time of 0 days compared to 14 days for treatment 14. This large difference in stability time shows that the probe depth (factor C) is less influential. Furthermore, treatment 13 was subject to a larger energy density (75 W.s/mL) than treatment 14 (55 W.s/mL). It was discussed in Section 4.3 that increasing the energy density will lead to a greater stability. This would mean that, if energy density had the largest influence on the stability, treatment 13 would be more stable than treatment 14, which it is not. Section 4.2 concluded that using an HLB of 5 was the optimum HLB for stability, and that an HLB of 4.3 was the least favourable. From the four treatments being compared here, treatments 11, 12 and 13 were all prepared with an HLB of 4.3, whereas treatment 14 was prepared with an HLB of 5. It is likely that this is the cause of the large difference in stability times between these treatments, and supports the argument shown by Figure 11 that factor A (HLB) has a larger influence on the stability.
Whilst the stability performance of treatment 10 was exactly the same as that of treatment 14 over the 14-day observation period, it is likely that treatment 14 would last longer. This statement can be made, as even though both were prepared with an HLB of 5, the probe depth for treatment 14 was 20 mm higher during its preparation.
These results provide knowledge on how altering the surfactant HLB, energy density and probe depth will affect the stability of a water in sunflower oil emulsion, so the secondary objective of this work has been achieved. The results of this stability test provide knowledge on how the stability could be further improved, and have the potential to be part of a wider study to determine the suitability of a water in sunflower oil emulsion as a fuel.
5. Future Work
The results from this study show that a water in sunflower oil emulsion is capable of remaining stable for at least 14 days. Whilst this is good progress in determining the suitability of a water in sunflower oil emulsion as a fuel, further testing needs to be completed.
It may be possible to further increase the stability of the emulsion. The results here have shown that using an HLB of 5 is the optimum value of those trialled. There is now scope to test more HLB values that are closer to 5, such as 4.9 and 5.1. It is likely that this could have a large impact on the stability time achieved, as it was shown in this experiment that HLB has one of the largest influences on the emulsion stability. Furthermore, it was also mentioned that the point of over-processing for the particular emulsion composition tested lies between an energy density of 75 and 200 W.s/mL. Increasing the energy density above 75 W.s/mL is likely to increase the stability of the emulsion until the exact over-processing point is found.
As well as the stability of the emulsion, it will also be important to test the combustion characteristics. Although the stability of a fuel is important, determining how well it would perform in a combustion chamber will be another test of the viability of the fuel.
In this experiment, the composition of the emulsion was kept constant, and can be found in Table 1. It is known that changing the mass of the water and surfactant used will also alter the emulsion stability. Further work may look to change the mass percentage of these particular substances to see how it would impact the stability of the resulting sunflower oil emulsion.
6. Conclusions
ACARE has set demanding targets to reduce CO2 and NOx emissions in the aviation industry by 2050, and biofuels are considered the main technology for achieving such targets. Water-emulsified sunflower oil could reduce emissions further than the popular oils that are used in biofuels today. The stability of water in sunflower oil emulsions has not been previously tested. Therefore, the aim of this project was to test its stability, with an objective of achieving a 100% stability time of at least 4 days, as well as to understand how the stability is effected during preparation.
The methodology used to achieve this involved forming the emulsion with an ultrasonication technique, and the surfactant HLB, energy density (Ev) and sonotrode probe depth were identified as the parameters that could affect the stability. Using a partial factorial technique, 14 water in sunflower oil emulsions were prepared. The parameters were varied so that their impact on the emulsion stability could be studied by changing one factor at a time.
Of the 14 emulsions made, two remained stable for at least 14 days. These two emulsions were prepared with a surfactant HLB of 5, which was the optimum value out of those trialled. One of these was prepared with the sonotrode probe at the highest position (45 mm). Having the sonotrode in the highest position proved to be favourable for stability purposes, and improved the stability by 7.70% after 14 days for some treatments. Applying larger energy densities during ultrasonication also improved the emulsion stability. Increasing the energy density by 30 W.s/mL improved the emulsion stability by 20.76% after 14 days in some instances. Over-processing of the emulsion was evident in the preliminary testing, and the results of the experiment confirm that the point of over-processing occurs between an energy density of 75 and 200 W.s/mL. From the three process parameters being tested, HLB was concluded to be more influential than energy density and sonotrode probe depth in terms of the resulting emulsion stability. The results could be used to inform wider studies that are set up to determine the suitability of a water in sunflower oil emulsion as a fuel.
Author Contributions
Conceptualization, R.S.S. and S.M.D.; methodology, R.S.S.; validation, R.S.S.; formal analysis, R.S.S.; investigation, R.S.S. and S.M.D.; resources, R.S.S. and S.M.D.; data curation, R.S.S.; writing—original draft preparation, R.S.S. and S.M.D.; writing—review and editing, R.S.S. and S.M.D.; visualization, R.S.S.; supervision, S.M.D.; project administration, R.S.S. and S.M.D. All authors have read and agreed to the published version of the manuscript.
Funding
This research received no external funding. The research was conducted in the framework of Ravin Sahota towards his MEng Degree in Mechanical Engineering at the University of Nottingham under the direction and supervision of Dr Sam M. Dakka.
Acknowledgments
We would like to express our thanks to the School of Chemistry at The University of Nottingham for access to their laboratory facilities.
Conflicts of Interest
The authors declare no conflict of interest.
Appendix A
Drop test figures to demonstrate that the emulsion is water in oil and not oil in water.
Figure A1.
Drop test showing emulsions of droplets deposited on pure sunflower oil on the left and on water on the right: (a) at the start of the test; (b) after 8 min, when the emulsion droplet was completely dispersed while the one in water did not disperse; (c) after 40 min, when the emulsion droplet was completely dispersed while the one in water did not disperse; and (d) after 1 h, when the emulsion droplet was completely dispersed while the one in water did not disperse.

Let us take a look at the emulsion droplet dispersing in sunflower oil during the first 8 min.
Figure A2.
Drop test showing emulsions of droplets deposited on pure sunflower oil: (a) at the start of the test; (b) after 3 min, when the emulsion droplet was partially dispersed, but to some extent maintained its original shape; (c) after 4 min, when the emulsion droplet was partially dispersed and losing it original integrity, shape and size; and (d) after 5 min, when the emulsion droplet was further dispersed and transformed into a number of smaller emulsion droplets.

Appendix B
T-Statistic calculation:
Hypothesis: treatment 10/14 is better than treatment 2/7 by at least 13 days.
The value of t for this hypothesis can be calculated using the mean stability time of treatment 14 (m14 = 14) and treatment 7 (m7 = 0.33), as well as the variance for these treatments (s142 and s72, respectively). The variance for these treatments is calculated below:
The value of t can be calculated using this information, as well as the number of replicates in each treatment (n):
Recognising that the value of t is 2.01, the degrees of freedom (DOF) for treatment 14 and treatment 7 need to be determined:
From the cumulative distribution function (CDF) for the t-distribution with DOF = 4, the probability of the hypothesis is 94.2%.
References
- European Commission. Reducing Emissions from Aviation. European.Union. Available online: https://ec.europa.eu/clima/policies/transport/aviation_en# (accessed on 4 November 2019).
- Darecki, M.; Edelstenne, C.; Enders, T.; Fernandez, E.; Hartman, P.; Herteman, J.P.; Kerkloh, M.; King, I.; Ky, P.; Mathieu, M. Flightpath 2050: Europe’s Vision for Aviation; Maintaining Global Leadership and Serving Society’s Needs; Report of the High-Level Group on Aviation Research. Publ. Off. Eur. Union 2011. Available online: https://ec.europa.eu/transport/sites/transport/files/modes/air/doc/flightpath2050.pdf (accessed on 4 November 2019).
- CORSIA. Frequently Asked Questions. Available online: https://www.icao.int/environmental-protection/CORSIA/Pages/CORSIA-FAQs.aspx (accessed on 12 November 2019).
- ECOFYS. Technical assistance in realisation of the 2018 report on biofuels sustainability. Eur. Comm. 2019. Available online: https://ec.europa.eu/energy/sites/ener/files/documents/technical_assistance_in_realisation_of_the_2018_report_on_biomass_sustainability-final_report.pdf (accessed on 4 November 2019).
- The European Parliament and The Council of the European Union. Directive 2009/28/ec of the european parliament and of the council of 23 April 2009 on the promotion of the use of energy from renewable sources and amending and subsequently repealing Directives 2001/77/EC and 2003/30/EC. Off. J. Eur. Union 2009. Available online: https://eur-lex.europa.eu/LexUriServ/LexUriServ.do?uri=OJ:L:2009:140:0016:0062:EN:PDF (accessed on 4 November 2019).
- Mondal, P.K.; Mandal, B.K. A comparative study on the performance and emissions from a CI engine fuelled with water emulsified diesel prepared by mechanical homogenization and ultrasonic dispersion method. Energy Rep. 2019, 5, 639–648. [Google Scholar] [CrossRef]
- Kojima, Y.; Imazu, H.; Nishida, K. Physical and chemical characteristics of ultrasonically-prepared water-in-diesel fuel: Effects of ultrasonic horn position and water content. Ultrason Sonochemistry 2014, 21, 722–728. [Google Scholar] [CrossRef] [PubMed]
- Markov, V.A.; Kamaltdinov, V.; Savastenko, A.A. Use of Rapeseed Oil and Water Emulsion as Diesel Fuel 2019. In Proceedings of the International Science and Technology Conference, Vladivostok, Russia, 1–2 March 2019; pp. 1–5. [Google Scholar]
- Reham, S.S.; Masjuki, H.H.; Kalam, M.A.; Shancita, I.; Rizwanul Fattah, I.M.; Ruhul, A.M. Study on stability, fuel properties, engine combustion, performance and emission characteristics of biofuel emulsion. Renew. Sustain. Energy Rev. 2015, 52, 1566–1579. [Google Scholar] [CrossRef]
- Debnath, B.K.; Sahoo, N.; Saha, U.K. Adjusting the operating characteristics to improve the performance of an emulsified palm oil methyl ester run diesel engine. Energy Convers. Manag. 2013, 69, 191–198. [Google Scholar] [CrossRef]
- Davannendran, C.; Mohammad, K.; Revathi, R.; Harrison, L.N.L.; Chee, L.Y.; Dinesh, K.; Mohammed, S. Sustainability of water in diesel emulsion fuel: An assessment of its corrosion behaviour towards copper. J. Clean. Prod. 2019, 220, 1005–1013. [Google Scholar]
- Patil, H.; Waghmare, D.J. Biodiesel-water emulsions: An alternative approach for conventional fuels. Int. Res. J. Eng. Technol. 2017, 4, 1200–1204. [Google Scholar]
- Karim, Z.A.A.; Tee, D.; Khan, M.Y.; Hagos, F.Y. Investigation of Water-in-Biodiesel Emulsion Characteristics Produced by Ultrasonic Homogenizer. Matec Web Conf. 2018, 225, 01012. [Google Scholar] [CrossRef]
- Yamashita, Y.; Miyahara, R.; Sakamoto, K. Emulsion and Emulsification Technology. Cosemetic Sci. Technol. 2017, 489–506. [Google Scholar] [CrossRef]
- Preetika, R.; Pramod, S.M.; Niket, S.K.; Madivala, G.B. Kinetic stability of surfactant stabilized water-in-diesel emulsion fuels. Fuel 2019, 236, 1415–1422. [Google Scholar] [CrossRef]
- Binks, B.P.; Horozov, T.S. Colloidal Particles at Liquid Interfaces; Cambridge University Press: Cambridge, UK, 2006. [Google Scholar]
- Griffin, W.C. Classification of Surface-Active Agents by “HLB”. J. Cosmet. Sci. 1949, 1, 311–326. [Google Scholar]
- ICI Americas. The HLB System: A Time-saving Guide to Emulsifier Selection; ICI Americas Incorporated: Wilmington, DE, USA, 1984. [Google Scholar]
- Patil, L.; Gogate, P.R. Ultrasound assisted synthesis of stable oil in milk emulsion: Study of operating parameters and scale-up aspects. Ultrason. Sonochemistry 2018, 40, 135–146. [Google Scholar] [CrossRef] [PubMed]
- Virkutyte, J. The use of power ultrasound in biofuel production, bioremediation, and other applications. Power Ultrason. 2015, 1095–1122. [Google Scholar] [CrossRef]
- Hielscher. Generation of Emulsions by Ultrasonic Cavitation. Available online: https://www.hielscher.com/emulsify_01.htm (accessed on 11 November 2019).
- Schafer, M.E. Ultrasonic surgical devices and procedures. Power Ultrason. 2015, 633–660. [Google Scholar] [CrossRef]
- Li, W.; Leong, T.S.H.; Ashokkumar, M.; Martin, G.J.O. A study of the effectiveness and energy efficiency of ultrasonic emulsification. Phys. Chem. Chem. Phys. 2018, 20, 86–96. [Google Scholar] [CrossRef] [PubMed]
- Clarke, D.D.; (SciMed); Sahota, R.S.; (University of Nottingham). Personal Communication, 2019.
- Mahdi Jafari, S.; He, Y.; Bhandari, B. Nano-Emulsion Production by Sonication and Microfluidization—A Comparison. Int. J. Food Prop. 2006, 9, 475–485. [Google Scholar] [CrossRef]
- Rubinetti, D.; Weiss, D.A.; Muller, J.; Wahlen, A. Numerical Modeling and Validation Concept for Acoustic Streaming Induced by Ultrasonic Treatment. 2016. Available online: https://pdfs.semanticscholar.org/0717/eff2897e3a1cbf4cc3bb1bff6aaa08ae9356.pdf (accessed on 4 November 2019).
- Mura, E.; Massoli, P.; Josset, C.; Loubar, K.; Bellettre, J. Study of the micro-explosion temperature of water in oil emulsion droplets during the Leidenfrost effect. Exp. Therm. Fluid Sci. 2012, 43, 63–70. [Google Scholar] [CrossRef]
- Denton, J.; (Medline Scientific UK Medlinescientific.com); Sahota, R.S.; (University of Nottingham). Personal Communication, 2019.
- O’Sullivan, J.; Murray, B.; Flynn, C.; Norton, I. Comparison of batch and continuous ultrasonic emulsification processes. J. Food Eng. 2015, 167, 114–121. [Google Scholar] [CrossRef] [Green Version]
- MERCK. Span 80 Properties. Available online: https://www.sigmaaldrich.com/catalog/product/sigma/s6760?lang=en®ion=GB (accessed on 26 November 2019).
- MERCK. Product Comparsion Guide Tween 80. Available online: https://www.sigmaaldrich.com/catalog/substance/tween8012345900565611?lang=en®ion=GB&attrlist=Molecular%20weight (accessed on 26 November 2019).
- Surfachem. Safety Data Sheet Surfacare S80. Available online: https://mistralni.co.uk/products/sorbitan-monooleate (accessed on 29 November 2019).
- Rumble, J.R. CRC Handbook of Chemistry and Physics, 100th ed.; CRC: Boca Raton, FL, USA, 2019; Internet Version 2019. [Google Scholar]
- Lad, V.N.; Murthy, Z.V.P. Enhancing the Stability of Oil-in-Water Emulsions Emulsified by Coconut Milk Protein with the Application of Acoustic Cavitation. Ind. Eng. Chem. Res. 2012, 51, 4222–4229. [Google Scholar] [CrossRef]
- Taurozzi, J.; Hackley, V.; Wiesner, M. Preparation of Nanoparticle Dispersions from Powdered Material Using Ultrasonic Disruption. NIST Special Publication 1200–2. Available online: https://nvlpubs.nist.gov/nistpubs/SpecialPublications/NIST.SP.1200-2.pdf (accessed on 4 November 2019).
- Hielscher, T. Ultrasonic Production of Nano-Size Dispersions and Emulsions. In Proceedings of the European Nanosystems Conference ENS’05, Paris, France, 14–16 December 2005. [Google Scholar]
Figure 1.
The contribution of different measures for reducing aviation CO2 emissions [3].
Figure 1.
The contribution of different measures for reducing aviation CO2 emissions [3].

Figure 2.
A sonotrode applying high-frequency vibration to a separated layer of oil and water to form a water in oil (W/O) emulsion.
Figure 2.
A sonotrode applying high-frequency vibration to a separated layer of oil and water to form a water in oil (W/O) emulsion.

Figure 3.
Cavitation bubble compression and expansion varying with the ultrasonic wave applied [22].
Figure 3.
Cavitation bubble compression and expansion varying with the ultrasonic wave applied [22].

Figure 4.
Sketch simulating the velocity field produced in a liquid that is subject to ultrasonication [26].
Figure 4.
Sketch simulating the velocity field produced in a liquid that is subject to ultrasonication [26].

Figure 5.
Four emulsion samples subjected to energy densities of 50, 200, 400 and 600 W.s/mL.

Figure 6.
Experimental setup.

Figure 7.
Treatments 10 and 14 displaying 100% stability after 14 days.

Figure 8.
Emulsion stability vs. time: effects of changing the surfactant HLB.

Figure 9.
Emulsion stability vs. time: Effects of changing the energy density (Ev).

Figure 10.
Emulsion stability vs. time: effects of changing the sonotrode depth.

Figure 11.
Phenomenological response model coefficients.


Table 1.
Emulsion composition.
| Substance | Mass (%) |
|---|---|
| Sunflower oil | 60 |
| Water | 30 |
| Surfactant(s) | 10 |
Table 2.
Surfactant specifications.
| Specification\Surfactants | Span80 | Tween 80 | Sunflower Oil |
|---|---|---|---|
| Manufacturer | Mistral Industries Ltd. [32] | Sigma Aldrich [31] | Lidl UK (supermarket) |
| CAS Number | 1338-43-8 | 9005-65-6 | Vitad’or Pure sunflower oil |
| Chemical Formula | C24H44O6 | C32H60O10 |
Table 3.
Density values.
| Substance | Density (g/cm3) |
|---|---|
| Sunflower oil | 0.92 [33] |
| Water | 1.00 |
| Tween 80 | 1.07 [31] |
| Span 80 | 0.99 [32] |
Table 4.
Mass of substances required for 150 mL emulsions with different hydrophilic-lipophilic balances (HLBs).
Table 4.
Mass of substances required for 150 mL emulsions with different hydrophilic-lipophilic balances (HLBs).
| HLB | Sunflower oil (g) +/− (0.02 g) | Water (g) +/− (0.01 g) | Tween 80 (g) +/− (0.01 g) | Span80 (g) +/− (0.01 g) |
|---|---|---|---|---|
| 4.3 | 86.00 | 43 | 0.00 | 14.33 |
| 5 | 86.04 | 43.02 | 1.01 | 13.33 |
| 9 | 86.30 | 43.15 | 6.61 | 7.77 |
Table 5.
Sonication time required to apply the corresponding energy density.
| Energy Density (Ev) | Sonication Time (t) |
|---|---|
| 45 W.s/mL | 3 min 25 sec |
| 55 W.s/mL | 4 min 10 sec |
| 65 W.s/mL | 4 min 55 sec |
| 75 W.s/mL | 5 min 41 sec |
Table 6.
Factors encoded.
| Factor | Values | Encoded |
|---|---|---|
| A-HLB | 4.3, 5 and 9 | −1, 0, 1 |
| B-Energy Density | 45, 55, 65 and 75 W.s/mL | −3, −1, 1, 3 |
| C-Sonotrode Depth | 5, 25 and 45 mm | −1, 0, 1 |
Table 7.
Experimental matrix with factors A, B and C.
| A | B | C |
|---|---|---|
| −1 | 3 | −1 |
| 0 | −1 | −1 |
| 0 | 1 | −1 |
| 0 | 3 | −1 |
| 1 | −3 | −1 |
| 1 | 3 | −1 |
| −1 | −3 | 0 |
| −1 | −1 | 0 |
| −1 | 3 | 0 |
| 0 | 1 | 0 |
| −1 | −3 | 1 |
| −1 | 1 | 1 |
| −1 | 3 | 1 |
| 0 | −1 | 1 |
Table 8.
100% stability time (days) for the 14 emulsions for three-replicate experiments.
| Factors | A | B | C | 100% Stability (days) | |||
|---|---|---|---|---|---|---|---|
| Treatment | HLB | Ev (W.s/mL) | Probe Depth (mm) | Replictae1 | Replicate2 | Replictae3 | Mean |
| 1 | 4.3 | 75 | 5 | 0 | 0 | 0 | 0 |
| 2 | 5 | 55 | 5 | 0 | 1 | 0 | 0.33 |
| 3 | 5 | 65 | 5 | 0 | 0 | 0 | 0 |
| 4 | 5 | 75 | 5 | 0 | 0 | 0 | 0 |
| 5 | 9 | 45 | 5 | 0 | 0 | 0 | 0 |
| 6 | 9 | 75 | 5 | 0 | 0 | 0 | 0 |
| 7 | 4.3 | 45 | 25 | 0 | 1 | 0 | 0.33 |
| 8 | 4.3 | 55 | 25 | 0 | 0 | 0 | 0 |
| 9 | 4.3 | 75 | 25 | 0 | 0 | 0 | 0 |
| 10 | 5 | 65 | 25 | 14 | 14 | 14 | 14 |
| 11 | 4.3 | 45 | 45 | 0 | 0 | 0 | 0 |
| 12 | 4.3 | 65 | 45 | 0 | 0 | 0 | 0 |
| 13 | 4.3 | 75 | 45 | 0 | 0 | 0 | 0 |
| 14 | 5 | 55 | 45 | 14 | 14 | 14 | 14 |
© 2020 by the authors. Licensee MDPI, Basel, Switzerland. This article is an open access article distributed under the terms and conditions of the Creative Commons Attribution (CC BY) license (http://creativecommons.org/licenses/by/4.0/).
Share and Cite
MDPI and ACS Style
Sahota, R.S.; M. Dakka, S. Investigation the Stability of Water in Oil Biofuel Emulsions Using Sunflower Oil. ChemEngineering 2020, 4, 36. https://doi.org/10.3390/chemengineering4020036
AMA Style
Sahota RS, M. Dakka S. Investigation the Stability of Water in Oil Biofuel Emulsions Using Sunflower Oil. ChemEngineering. 2020; 4(2):36. https://doi.org/10.3390/chemengineering4020036
Chicago/Turabian StyleSahota, Ravin S., and Sam M. Dakka. 2020. "Investigation the Stability of Water in Oil Biofuel Emulsions Using Sunflower Oil" ChemEngineering 4, no. 2: 36. https://doi.org/10.3390/chemengineering4020036