Review

An Overview on Energy and Development of Energy Integration in Major South Asian Countries: The Building Sector

by
Rashiqa Abdul Salam
1,
Khuram Pervez Amber
2,
Naeem Iqbal Ratyal
1,
Mehboob Alam
1,
Naveed Akram
2,3,*,
Carlos Quiterio Gómez Muñoz
4,* and
Fausto Pedro García Márquez
5
1
Department of Electrical Engineering, Mirpur University of Science and Technology (MUST), Mirpur 10250 (AJK), Pakistan
2
Department of Mechanical Engineering, Mirpur University of Science and Technology (MUST), Mirpur 10250 (AJK), Pakistan
3
Department of Mechanical Engineering, Faculty of Engineering, University of Malaya, Kuala Lumpur 50603, Malaysia
4
Industrial and Aerospace Engineering, Universidad Europea de Madrid, 28670 Villaviciosa de Odón, Spain
5
Ingenium Research Group, University of Castilla-La Mancha, 45071 Ciudad Real, Spain
*
Authors to whom correspondence should be addressed.
Energies 2020, 13(21), 5776; https://doi.org/10.3390/en13215776
Submission received: 2 September 2020 / Revised: 1 October 2020 / Accepted: 22 October 2020 / Published: 4 November 2020
(This article belongs to the Special Issue Future Maintenance Management in Renewable Energies)

Abstract

:
India, Pakistan, and Bangladesh (IPB) are the largest South Asian countries in terms of land area, gross domestic product (GDP), and population. The growth in these countries is impacted by inadequate renewable energy policy and implementation over the years, resulting in slow progress towards human development and economic sustainability. These developing countries are blessed with huge potential for renewable energy resources; however, they still heavily rely on fossil fuels (93%). IPB is a major contributor to the total energy consumption of the world and its most energy-intensive building sector (India 47%, Pakistan 55% and Bangladesh 55%) displays inadequate energy performance. This paper comprehensively reviews the energy mix and consumption in IPB with special emphasis on current policies and its impact on economic and human development. The main performance indicators have been critically analyzed for the period 1970–2017. The strength of this paper is a broad overview on energy and development of energy integration in major South Asian countries. Furthermore, it presents a broad deepening on the main sector of energy consumption, i.e., the building sector. The paper also particularly analyzes the existing buildings energy efficiency codes and policies, with specific long-term recommendations to improve average energy consumption per person. The study also examines the technical and regulatory barriers and recommends specific measures to adapt renewable technologies, with special attention to policies affecting energy consumption. The analysis and results are general and can be applied to other developing countries of the world.

1. Introduction

Global energy demand has been increasing exponentially at a yearly average rate of 2.2% since 1965. The world energy outlook has already predicted it to increase by 30% between today and 2040 [1,2]. Among various regions in the world, South Asia is a major contributor, whose energy demand is increasing at twice the pace of China [3]. The South Asian region consists of eight countries and is directly responsible for 6.42% of total global energy consumption [4]. The continuously increasing population and urbanization in this part of the world have resulted in exponential growth in the building sector, which is becoming a key factor contributing to global energy demand. In these South Asian countries, India, Pakistan, and Bangladesh (IPB) are the major countries in terms of their energy consumption, land area, GDP, and population. IPB countries were a single country, known as the “Indo-Pak Subcontinent” before 1947. Energy consumption in IPB is considered quite high, with India ranked 4th globally (5.57%) and 1st (86%) among the South Asian countries [5].
Energy is often regarded as the backbone of a country’s economic and human development [6]. GDP is usually used as an indicator for the economic development, whereas human development index (HDI) is used as an indicator for country rankings in four tiers of human development. HDI is defined by three important factors: health, education, and standard of living of a country. Industrial development, urbanization, and population growth have resulted in an extreme shortfall of electricity in IPB countries. Figure 1 shows the percentage of shortfall of average electricity consumption in these countries. A comparison of per capita income (PCI) over the years shows a reduction in electricity shortfall for countries with better GDP per person. The graph clearly indicates that a power shortage can hamper economic development and is one of the most glaring disparities between developing and developed countries [7]. Among IPB countries, one of the contributing factors to the slow growth and energy crisis is a failure of comprehensive energy policies, which are influenced by wrong decisions and pressures at every step of the energy supply chain. A detailed analysis of these policies with remedial recommendations and its impacts on power shortages is discussed in this paper.
Electricity consumption per capita (ECPC) is another indicator, which has been widely used by researchers to compare the energy consumption of different countries. A scatter plot of Figure 2 between HDI and ECPC of 29 countries located in different climatic regions of the world clarifies the relationship between the economic and human development of a country and its electricity consumption. An analysis of data in Figure 2 shows that for highly developed countries (HDI > 0.8), changes in energy consumption barely affect human development. However, for countries with medium or low HDI, variations in consumption of energy affect the overall HDI, thereby building a direct relationship between energy and human development.
The nature of the curve in Figure 2 suggests that, for countries having ECPC < 5 MWh, there exists a positive linear relationship between HDI and ECPC. It is apparent that the average ECPC for such countries is 1.3 MWh with an average HDI value of 0.64, suggesting that these countries fall under the HDI category of medium human development. HDI values < 0.6 in countries such as Nepal and Pakistan indicate that these countries are not self-sufficient in meeting their energy demands. It is also evident from Figure 2 that the collective ECPC value of IPB is only 14% of the total ECPC of US. This difference could be attributed to the higher availability of energy resources and better living standards in the US that are lacking in IPB countries. It is important to note that there is a long-term relationship between human development and energy consumption, and effective energy policy can play a significant role in substantial economic growth by providing a better standard of living. In 2017, the global energy mix was 36% oil, 17.1% coal, 26.9% natural gas, 9.8% nuclear, and renewable energy resources (RERs) contributed about 9.1% [10]. Globally, 30–40% percent of the total energy is consumed in the building sector, of which residential buildings consume three-fourths of the total buildings consumption [11].
Currently, on average, about 68% of the energy produced in IPB countries comes from fossil fuel [12,13,14], which accounts for 7.8% of the global CO2 emissions. Available energy resources of IPB are already limited and the countries’ energy mix heavily relies on the import of fossil fuels [15]. There is a huge scope for the renewable energy technologies (RETs), e.g., solar, wind, and biomass, but a comprehensive exploration by exploiting all available resources vis-à-vis their geostatic location still needs critical investigation. All these three countries lack in their electricity generation. In India, there is an electricity shortfall of 2.5 GW, while Pakistan and Bangladesh suffer from a shortfall of 6.5 GW and 7 GW, respectively, that is resulting in a daily load shedding of 6 to 8 h [8,9].
The varying climatic conditions with increasing population, economic development, and human growth in IPB countries have resulted in an increased demand for energy in the building sector. Only in Pakistan, the building sector consumes 55% of the country’s total available energy [12] The climatic conditions in IPB are very hot during summer months, with a maximum temperature of 50 °C in some areas. This gives rise to the cooling load, which calls for the availability of a high amount of electricity in the building sector of IPB. This makes building sector an essential part for reviewing energy and development of the IPB region, with a view to analyzing various driving factors and relevant policies impacting high consumption. Similar studies have been performed in [16,17], where energy consumption for sustainable development in the buildings of Malaysia and Lithuania have been thoroughly studied. The authors in [18] have explained how the use of RETs in buildings of China can help achieve a reduction in energy consumption.
There is limited published data on the relationship between energy policies and its impact on human development of IPB countries. Owing to the significance of this region, this study attempts to address this gap by critically reviewing and comparing the major driving factors of buildings energy consumption and its effect on the economy of the region, with specific recommendation on revisiting relevant buildings energy codes in IPB. The study further attempts to explore the potential for RERs and energy efficiency in this energy-intensive region, with specific recommendations by re-addressing government policies to fully exploit RETs. The analysis and results are general and will go a long way in helping IPB, as well as developing countries, to overcome energy crises, with special emphasis on improving the energy performance of their building sectors.
The structure of the paper is as follows: Section 2 presents the overview of energy mix and consumption in IPB. Section 3 covers the comparison of buildings energy consumption, which is followed by potential and utilization of RERs in IPB in Section 4. Section 5 is about tracking development and energy consumption in IPB, while in Section 6 energy efficient buildings codes and renewable energy policies and challenges are discussed. Section 7 concludes the paper by giving analysis, opportunities, and recommendations of the study.

2. Energy Mix and Consumption in IPB

IPB are situated in the geographic region of South Asia. Figure 3 shows the map of IPB with India consisting of 29 states and 7 union territories [19]. Pakistan has four provinces (Punjab, Sindh, Baluchistan, and Khyber-Pakhtunkhwa (KPK)) and three federally administered territories: Gilgit–Baltistan, Islamabad Capital Territory, and Azad Jammu and Kashmir (AJK)) [12], whereas Bangladesh has 8 divisions (Rangpur, Raj Shahi, Dhaka, Khulna, Barisal, Mymensingh, Sylhet, and Chittagong) [20]. This section will discuss the energy mix in IPB, to see existing reliance of these countries on various energy sources.

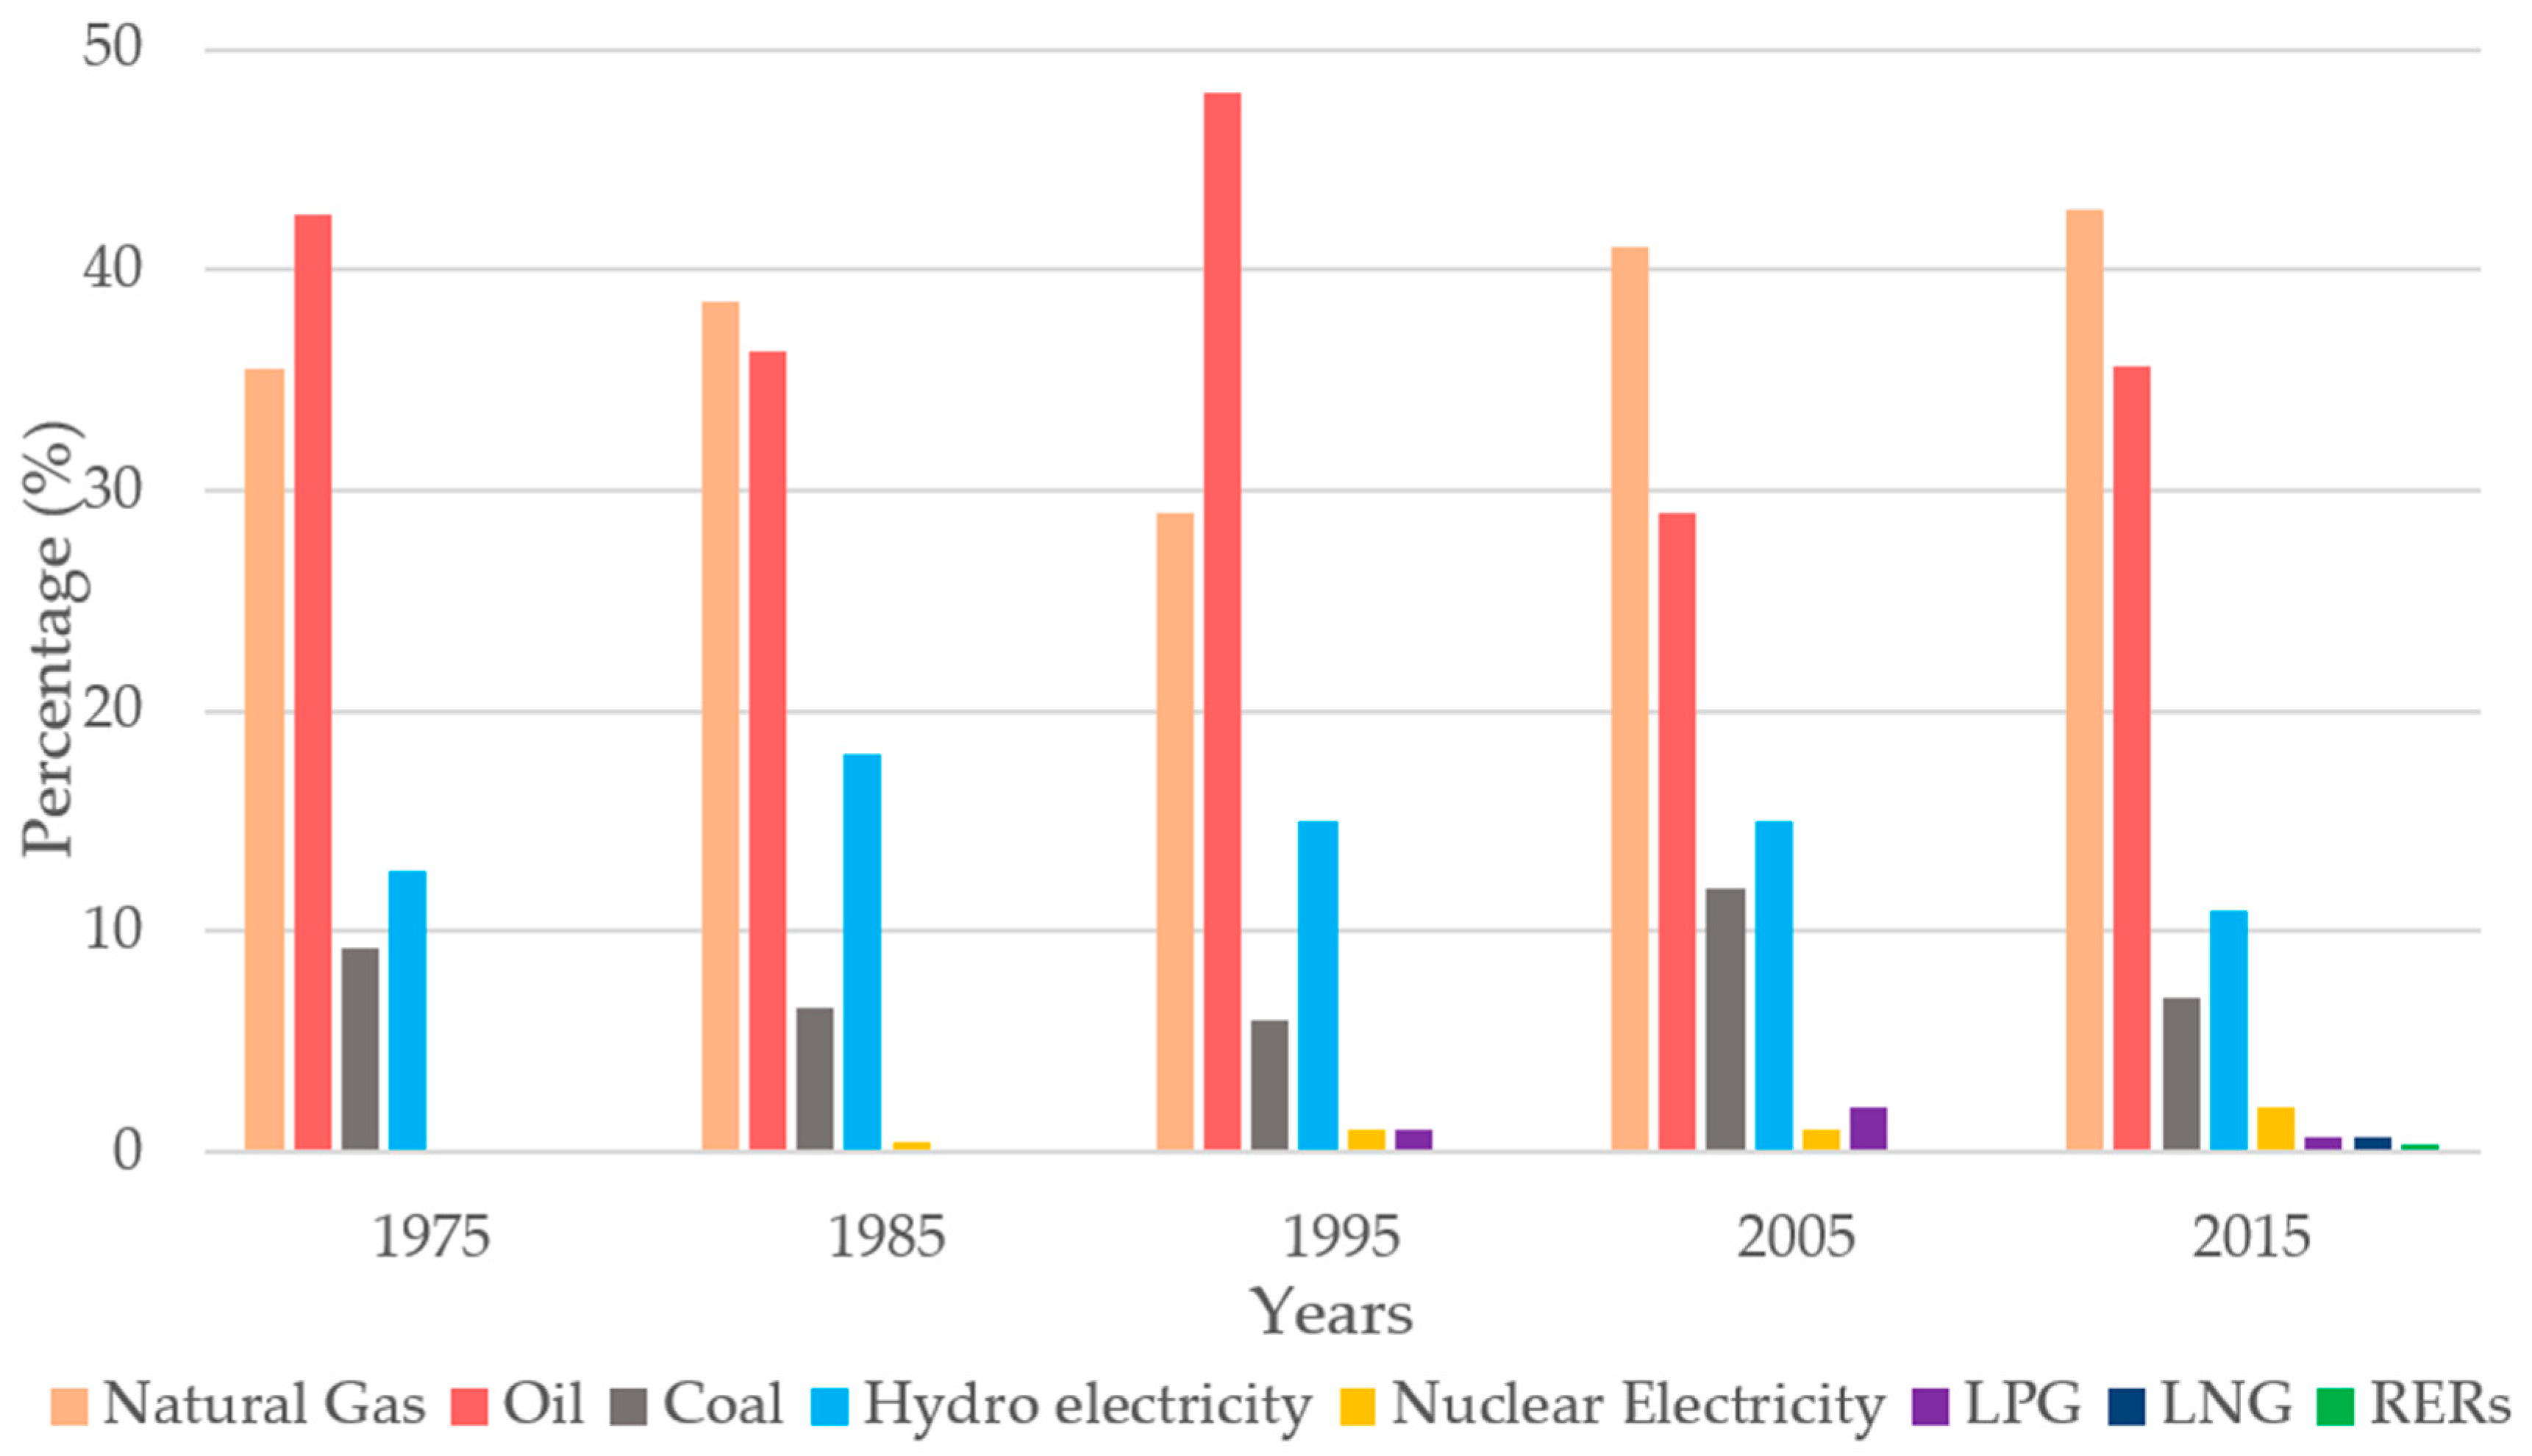
2.1. Energy Mix and Consumption in India

The energy mix of India (2017) comprises mainly of fossil fuels (nearly 90%). It comprises coal (56%), oil (28%), natural gas (7%), hydro (5.5%), nuclear (1%), and RERs (2.5%) [21]. The energy mix of India (1990–2017) given in Figure 4 shows that there has not been much change over these years in the energy mix. Coal is the major contributor of the energy mix in India with a percent increase of +0.2% per annum in 27 years (1990–2017). India has more than 300 billion tons (2015) of coal reserves, of which 87 billion tons are proven resources [1]. In 2016, India became the second largest consumer of coal in the world due to strong growth in coal consumption in the industry [22]. The second major contributor to the energy mix of India is oil. There has been a decrease of −9.6% since 1990 (−0.3% annually) in the energy mix share of oil. India imports nearly 80% of the oil, even though India has 4500 million tons (2017) of oil reserves [23], of which only 5% are being utilized [24], while the production is 36.9 million tons. There is a need to increase the refining capacity in India, which will require strong policies and heavy costs. The share of natural gas, however, remained almost the same, i.e., 7.5% in 1990 and 7% in 2017. There has been a reduction of −1.15% annually in the hydel energy (−31.25% since 1990). Hydel energy constitutes 19% of the electricity produced in the country [25]. There have not been many efforts in increasing the hydel energy share, but India is planning to increase the share of RERs for the generation of electricity in the country. RERs, at present, only account for 2.5% (2018) in the energy mix and 20% in the power generation mix of India [26]. India’s share of nuclear energy had been unchanged since 2000 (1%). India has planned to initiate the installation of a nuclear power plant with France in Jaitpur, which is expected to produce 9.6 GW of electricity [27].
The total electricity generation capacity of India is 333 GW (2017), out of which nearly 13% is generated in Maharashtra state (42.6 GW) [28]. Figure 5 shows the state-wise generation capacity of India [29] for the major 12 states that generate nearly 74% of total electricity in the country, while the rest of the 16 states and the associated territories generate the remaining 26%. Similarly, Figure 6 shows the ECPC of the top 15 states. Although the associated territories like Goa (548 MW) and Dadar and Nagar Haveli (252 MW) have a little share in electricity generation but bear quite higher ECPC (1.8 MWh and 13.7 MWh, respectively) compared to the average ECPC of India, 1.07 MWh [28]. The major reasons behind their high ECPC are low population and high industrial activity and tourism in these territories. On the contrary, the states of Uttar Pradesh (UP) and Bihar are among the largest states of India population-wise, but their ECPC is low as compared to nation’s average; 502 kWh and 203 kWh, respectively. A major portion of the population in the villages of these areas are deprived of electricity [30].

2.2. Energy Mix and Consumption in Pakistan

Like India, Pakistan relies heavily on fossil fuels to meet its energy demands. The energy mix of Pakistan (2015) comprises natural gas (42.7%), oil (35.5%), hydroelectricity (11%), coal (7%), nuclear (2%), Liquified petroleum gas (LPG, 0.7%), imported Liquified natural gas (LNG, 0.7%), Renewable energy resources (0.3%), and imported electricity (0.2%), which also reveals that nearly 85% of the energy generated in Pakistan comes from fossil fuels [31,32]. The energy mix of Pakistan over the last 5 decades is presented in Figure 7. A major share of Pakistan’s energy mix is restricted to natural gas and oil. It has been shifting from oil to gas since 1975 with an increase of +16% in natural gas and a decrease of −19.3% in oil [33,34]. Between 1995 and 2015, the share of natural gas increased from 29% to 42.7%, whereas oil’s share decreased from 48% to 35.6%. This shift of energy source was due to increased oil prices in the global oil market, local availability of natural gas resources and relatively lower prices of natural gas [35]. The share of coal has been found nearly consistent between 1975 (9.3%) and 2015 (7%). Discovery of new coal resources has led Pakistan to build new coal power plants of capacity 2.6 GW in 2018 in collaboration with China under its ongoing China Pakistan Economic Corridor (CPEC) project [36]. Pakistan has coal reserves of 186 billion tons [37]. The Hydel energy share in Pakistan’s energy mix over these years (1975–2015) has remained the same. Pakistan is also installing two nuclear power plants expected to be operational in 2019 and 2020, with a total capacity of 22 GW [38], which will increase the percentage of nuclear from 2% (750 MW) to nearly 5.8%. LNG became a part of the energy mix of Pakistan from 2015, while LPG share from 1995 (2%) decreased in 2015 (0.7%). Various power generation projects have been initiated in the country between 2010 and 2018, including 10 projects under the CPEC project of nearly 9.5 GW. Three major power generation projects of 3.5 GW based on Re-gasified liquified natural gas (RLNG) are also expected to be completed by 2019.
The major contribution of energy resource i.e., natural gas has its provincial share of production (2015) as Sindh (56%), Baluchistan (13%), KPK (12%) and Punjab (3%). However, the consumption of natural gas in these provinces is quite opposite to the production. Punjab (with a population of 110 million) [39] is the largest province of Pakistan and utilizes about 69% of the total natural gas, while KPK, Sindh, Baluchistan, and the associated territories utilize 8%, 7%, 5%, and 11%, respectively [40]. Similarly, the provincial share of electricity generation and electricity consumption per capita (with a total generation of 117 TWh) is shown in Figure 8 and Figure 9, respectively [32,41]. Nearly 68% of the total electricity generated is consumed by Punjab province.

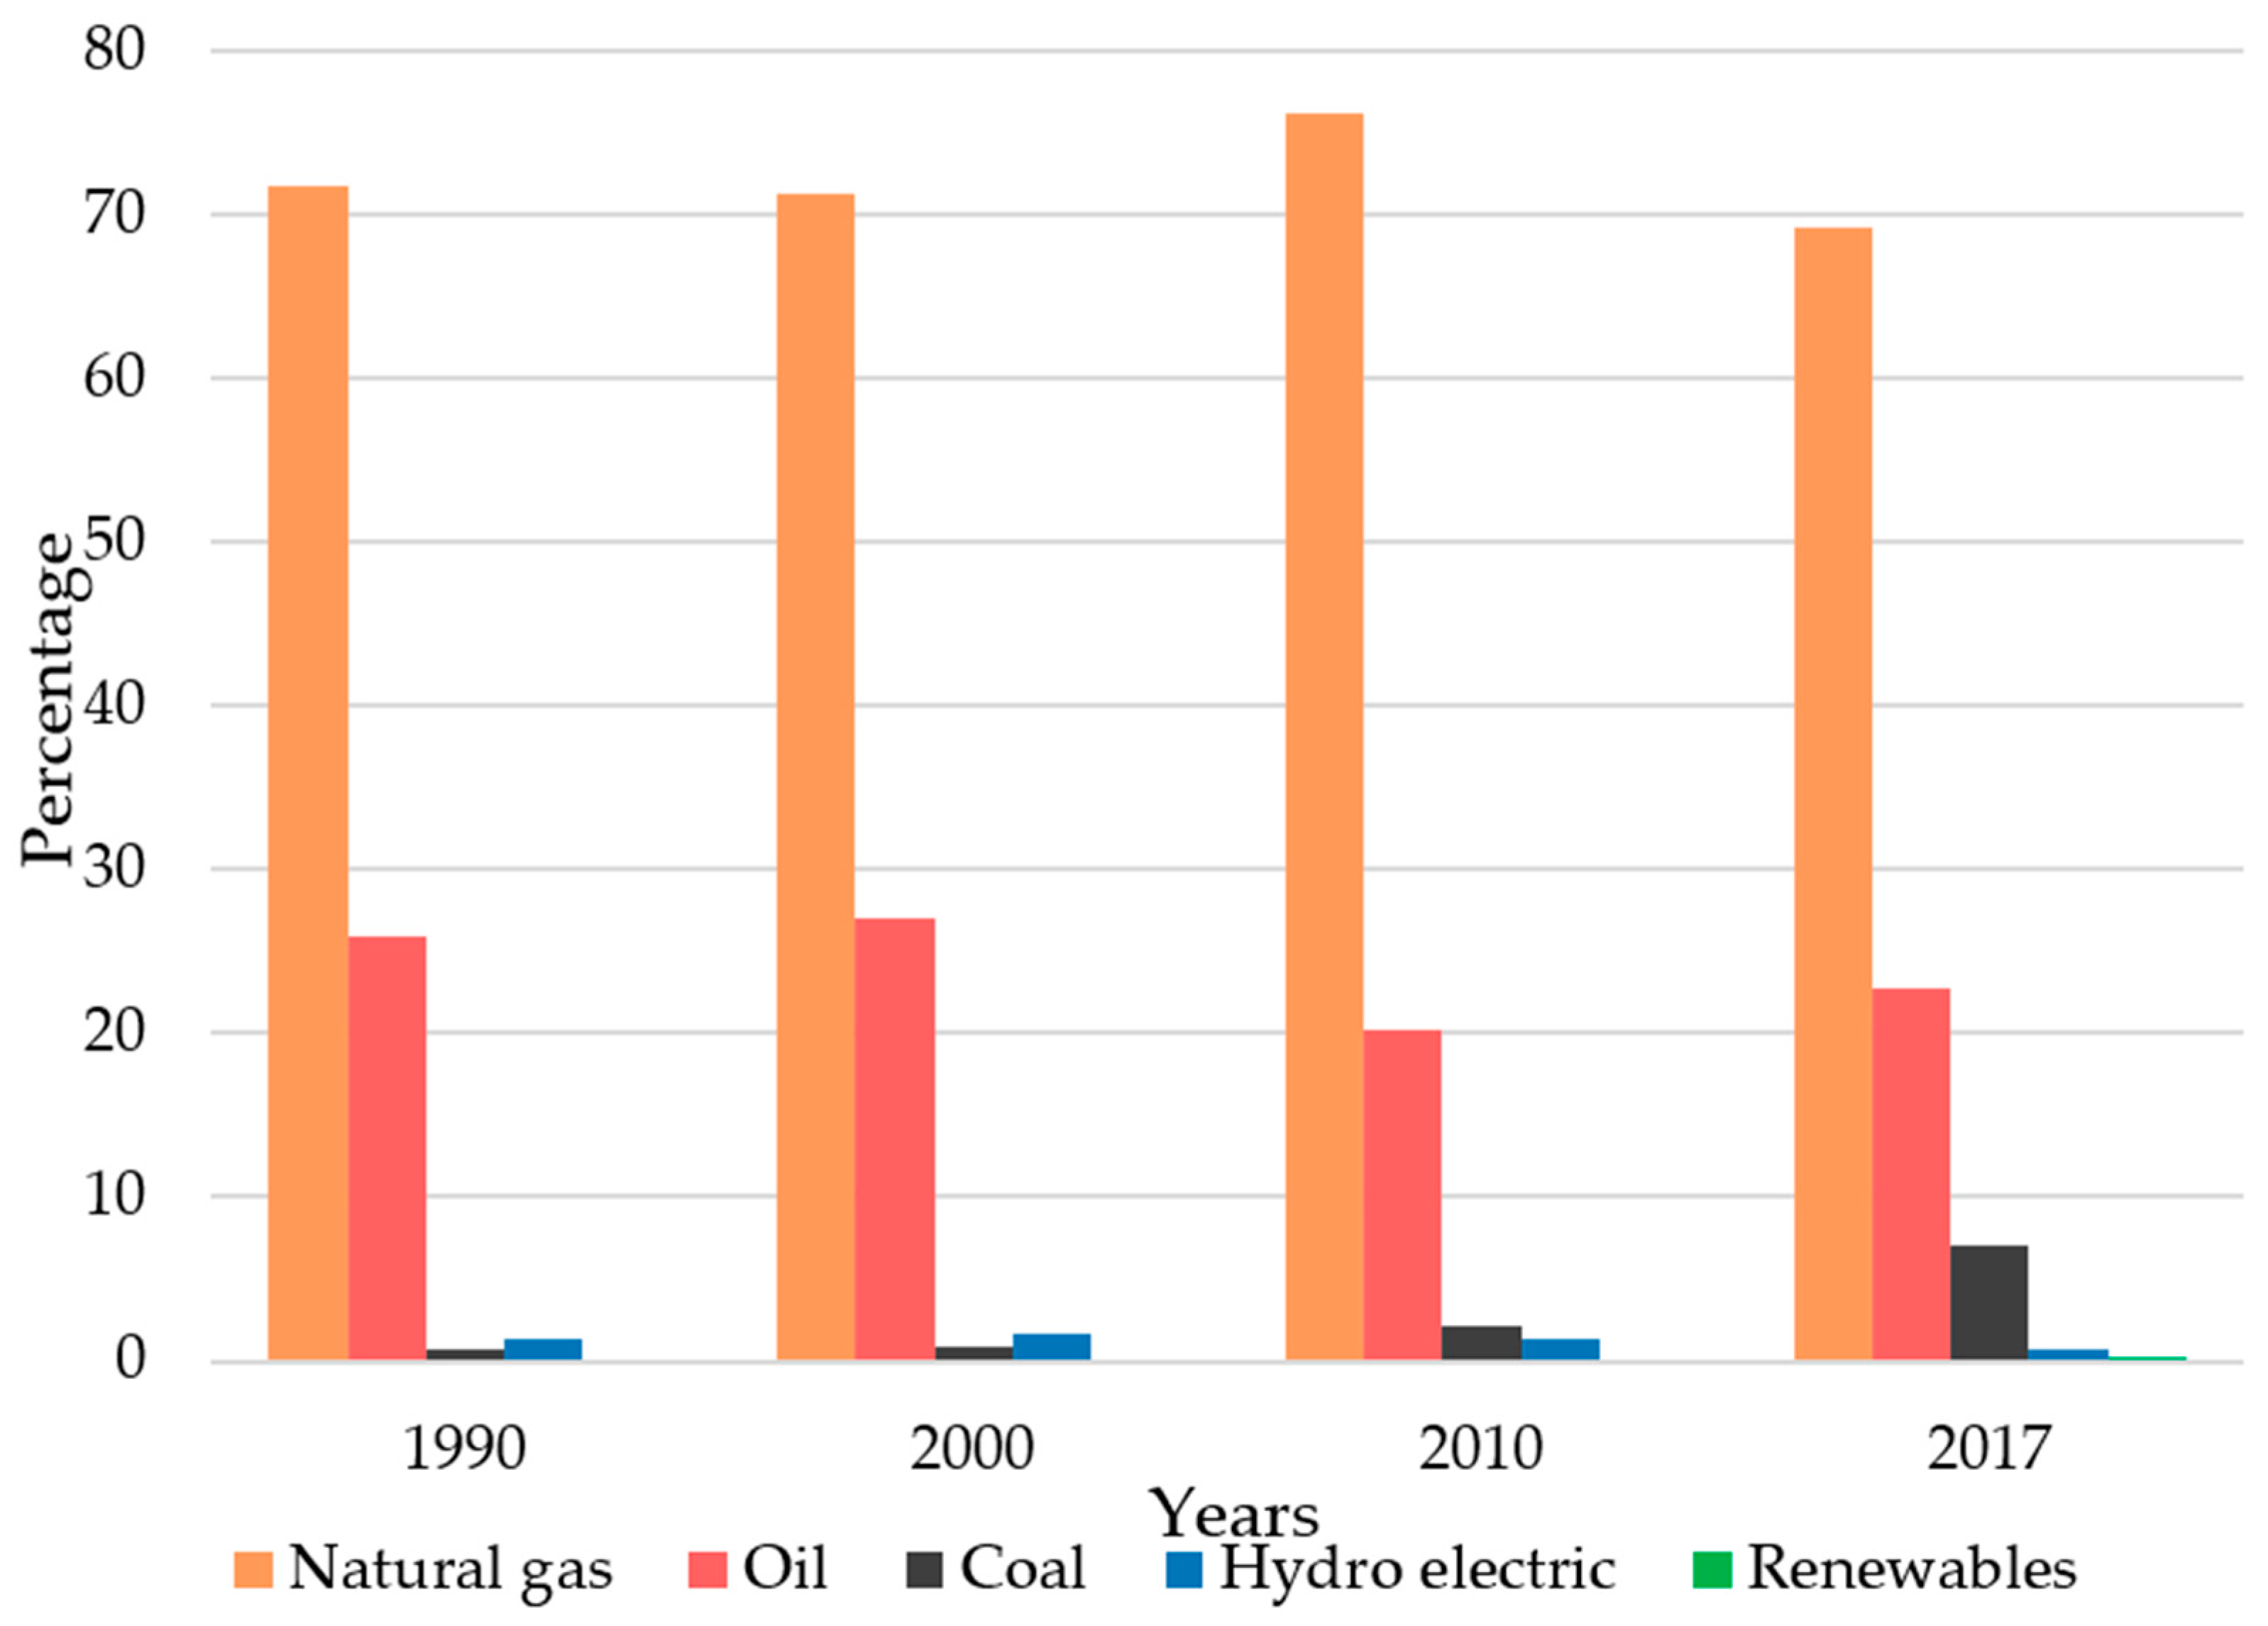
2.3. Energy Mix and Consumption in Bangladesh

The energy mix of Bangladesh (2017), given in Figure 10, comprises of natural gas (69.3%), oil (22.7%), coal (7.1%), hydro (0.7%) and RERs (0.2%). Bangladesh depends almost entirely on fossil fuels (99.1%) to meet its energy demands [21]. Since 1990, there has only been the slightest of change (decline) in the consumption of natural gas and oil in the energy mix of the country; a −0.1% and −0.4% decrease, respectively (annually). Bangladesh has nearly 22 discovered gas fields with reserves of 15 trillion cubic feet [42], which has always been the major source of energy in various sectors, and produces 67% of electricity for the country. However, a high rate of consumption is also resulting in depletion of resources of natural gas. To deal with the threat of resources depletion, the country launched an energy supply plan to estimate the requirement of each source of energy for the optimized utilization in all sectors [43]. After natural gas, oil covers the major portion in the energy mix (2017: 22.7%). There are no internal resources of oil within the country and for all the oil-fired power plants, oil is imported from other countries. The author in [44] suggests the use of coal (lower international import cost as compared to oil) and RERs in place of oil to fulfill the energy demands. The country has seen a 33% rise (annually) in consumption of coal since 1990 and has planned to start coal-based power plants with the capacity to produce 7.5 GW of electricity by 2021, which is nearly 50% of the current (2017) electricity generation capacity of Bangladesh [45]. The production of electricity through hydro power has also seen a decline from 1.4% (1990) to 0.7% (2017). Bangladesh has plenty of water but does not have enough water flow along with the required heights for the generation of electricity [46]. Currently, only 47% of the entire population and one-third of the total rural households have electricity access in Bangladesh. However, the Government of Bangladesh (GOB) is planning to increase this rate to 97% and provide uninterrupted power supply [47]. According to the Power and energy sector master plan (2016), various new power plants are to be completed by 2021 in Bangladesh, including two 1.2 GW nuclear plants in Pabna (Division. Raj Shahi), a 7.5 GW coal-based power plant, and various small RERs based plants, to meet the energy demands of the country [48].
The total electricity generation capacity of Bangladesh is 13.5 GW (2016–2017). Out of the total capacity, 7.58 GW (56%) comes from public sector power plants, 5.37 GW (40%) from the private sector, while 600 MW (4%) is imported. The power generation capacity and natural gas production division-wise have been given in Figure 11 [49]. The major portion of electricity is generated in the Dhaka (38%) and Chittagong (28%) divisions. Within these divisions, Dhaka city being the largest city of Bangladesh population-wise, a major portion of electricity produced in the country (55%) is consumed [50]. The Divisions of Chittagong and Sylhet have nearly 78% of total electricity generation capacity and the rest is generated in other divisions. All west divisions import electricity from the eastern zone by 230 kV power transmission lines [51]. The divisions of Sylhet and Chittagong are also the major producers of natural gas in the country, which accounts for 66% of electricity produced in the country [52].

2.4. Energy Mix Analysis and Issues

The total primary energy consumption of IPB is 10 PWh (2017), out of which 86.6% is consumed by India (8765.5 TWh). India consumes 10 times more primary energy than Pakistan (940.8 TWh) and nearly 20 times more than that of Bangladesh (383.7 TWh). India is also the major contributor to CO2 emissions in the region (89.6%). This difference could be attributed to India’s largest area and population amongst the three countries. The major source of energy in IPB is fossil fuels, whereas the largest sector of energy consumption is the building sector. Table 1 gives a brief comparison of the energy situation in IPB.
A clear analysis of available energy mix in IPB from Figure 4, Figure 7, and Figure 10 shows heavy reliance on fossil fuels (India: 90%, Pakistan: 85%, Bangladesh: 99%), a finite energy source that is also harmful to the environment, causing ecological damage, environmental pollution, and climate change. It is envisioned from Figure 2 for IPB that in the next few decades they will join the club of high human development. A continuous reliance on finite energy indicates governments’ persistent erroneous policies, which needs serious consideration and re-evaluation. The analysis, opportunities, and recommendations discussed in Section 7 will sum up the key points discussed here with specific recommendations to overcome energy crises in IPB countries.

3. Energy Consumption in Building Sector of IPB

Energy consumption globally has three major sectors: industrial, building, and transportation. The continuously increasing population and urbanization in IPB have resulted in exponential growth in the building sector, which is becoming a key factor contributing to global energy demand. In IPB, the major contributor to energy consumption is the building sector (India 47%, Pakistan 55%, and Bangladesh 55%), which shows inadequate energy performance. This section will discuss energy consumption in building sectors of IPB, with a view to highlighting the existing significance of building energy consumption.

3.1. Energy Consumption in Building Sector of India

The total energy consumption in India (7490 TWh: 2017) has increased +19% from 2013 to 2017 (4% annually) due to increased energy consumption in industrial and building sectors [53]. In India, the building sector consumes a total of 47% of total energy, while the industrial sector uses 34% of total energy. The rest of the 19% of total energy is consumed in the transport (14.4%) and agriculture sectors (4.6%).
The building sector in India consumed 2477 TWh in 2015. Building energy consumption in India since 2006 is presented in Figure 12 [3], which shows a yearly increasing trend with an average of +2.7% per year (2006–2015). According to the Energy information administration (EIA) 2017 report, around the globe, the fastest growth in building energy consumption will occur in India by 2040 [54]. Different factors governing the rise of energy consumption in the building sector are rapid urbanization, increase in people’s income, rapidly increasing population, and fast economic growth [55]. Out of 2477 TWh (2015), 89% is consumed in residential buildings (2209 TWh), while non-residential buildings consume the rest of the 11% (267 TWh). The energy consumption in the residential sector decreased from 92% in 2006 to 89% in 2015, while in the non-residential sector, it has increased from 8% (2006) to 11% (2015). In rural houses in India, the major portion of the energy consumed is based on traditional sources, i.e., biomass. A total of 93.8% of energy in rural houses is used for cooking, while for lighting and appliances, 4.2% and 1.8% is used, respectively. This distribution is quite different in urban buildings, where a major portion of energy is consumed in air conditioners (55%) [56].
The building structures in India range from mud houses in rural areas to high-rise buildings in urban areas. In rural areas, the majority of people do not have access to commercial resources of energy and are dependent on animal waste, fuelwood, and crop residue to meet their energy demands. According to a report (2015), nearly 237 million Indians do not have access to electricity, out of which 90% of people reside in rural areas [57]. In 2015, the total electricity consumption in the building sector of India was 296 TWh. Figure 13 shows the building electricity consumption in India from 2010–2015 [53].
There has been an increase of +43% (+9% annually) in the total electricity consumption. Over this period (2010–2015), the personal income of the people and urbanization kept on rising [57]. The majority of people, particularly in rural areas, are unaware of the benefits of using low carbon sources as sustainable means of energy [58]. It is also evident from Figure 13 that the residential sector (2015) consumes nearly 74% of the total buildings’ electricity, while the non-residential sector uses 26%. In the residential sector, there is an increase of +49% (+10% annually) in electricity consumption, while +29% (+6% annually) in the non-residential sector, showing a steady rise in consumption over these years (2010–2015) as more people gain access to modern energy services. However, following the National building codes (NBC) can result in lowering the overall consumption of energy in buildings and improving energy efficiency. In some states, the increased household electricity consumption is also due to metering issues e.g., 40% of total electricity connections in Uttar Pradesh are unmetered connections of rural areas [59]. The economic growth and increasing migration rate towards the urban areas have also resulted in an increased demand for more commercial sector services, which has ultimately led to an increase in electricity consumption in non-residential buildings.

3.2. Energy Consumption in Building Sector of Pakistan

The annual growth rate of energy demand (2016: 953 TWh) in Pakistan has been increasing by 2.36% since 2005, which can be attributed to the accelerated urbanization of community [60,61]. Urbanization is also linked to the energy consumption in industrial and residential sectors. The industrial sector in Pakistan (2016) consumed 24%, while transport and agriculture sector consumed 19% and 1%, respectively. A major portion of energy (55%) in Pakistan is consumed in the building sector, in which residential buildings use 47% of the total energy, while the non-residential buildings, which include hospitals, educational campuses, banking, shopping malls, etc., consume 8% of the total energy [53].
Pakistan is among those countries that have the highest rate of energy consumption in buildings as compared to developed countries such as USA (39%), Canada (27%), and China (20%) [62]. Energy efficient and sustainable buildings are imperative to building an equilibrium between the present and future energy demands of a country. An overview of the building energy consumption in Pakistan for the period 2006–2015 has been presented in Figure 14 [3,32], which demonstrates that there has been an increase of 26.46% in energy consumption in buildings since 2006, with an annual average increase rate of +2.9%. The reasons for this increase are urbanization and rise in living standards of the people, which may further increase the buildings’ energy consumption as compared to the total energy consumption of the country in the forthcoming years.
Building energy consumption in Pakistan can be divided into two sectors: residential buildings and non-residential buildings. Residential buildings can further be classified as rural and urban buildings that range from skyscrapers to mud houses. The major portion of the energy used in residential buildings (after biomass and waste) comprises of electricity and natural gas. According to National Electric Power Regulatory Authority (NEPRA), nearly 32,000 villages are still void of electricity, where people use traditional sources of energy, e.g., kerosene, firewood, and diesel to meet their energy demands [63]. Only 20% of the buildings in Pakistan have gas supply [64,65], while the rest of the people use LPG or firewood. This raises the health hazards and contributes to adverse environmental effects by increasing the CO2 emissions of 3.2% annually in the country since 2006. Each year, 80–85% of electricity in the building sector is consumed in residential sector buildings, while the non-residential buildings (government and private) utilize 15–20% [32].
An overview of total electricity consumption in residential and non-residential buildings [53] for the past five years (2010–2015) is given in Figure 15. An annual rise of +4.2% in residential and +3.2% in commercial buildings is evident. A possible reason for the rise in building sector energy of Pakistan is non-implementation of its building codes. Small changes in the building and material can make a big difference in energy consumption of the building in urban and rural areas, where people are unaware of efficient design and building codes [66]. Another reason is the shortfall that prevails in the electricity system. People have started to use alternate resources including fossil fuel generators and Uninterrupted power supply (UPS). UPS are charged from the grid electricity resulting in an increased load (+7%) and increased strain in case of poor quality of UPS [67]. However, very few alternate resources are found in use to charge the UPS, which can reduce the overall load to the grid station. Other reasons for this increase in building energy consumption are economic development, waste of energy at user end, and population growth.

3.3. Energy Consumption in Building Sector of Bangladesh

The building sector in Bangladesh consumes 55% of the total energy, which is followed by the industrial sector that consumes 30%, while the transport and agriculture sectors consume 12% and 4% energy, respectively. Economic growth and rising population (157 million: 2017) are resulting in increased consumption of energy in the building sector of the country [68]. Bangladesh witnessed a rise of nearly +30% in its buildings’ energy consumption (383 TWh: 2017)) since 2006 (+3% annually). The total energy consumption in buildings is given in Figure 16 from 2006 to 2016 [3]. Energy consumption in residential buildings rose to about +28.1%, while the non-residential building sector has risen +2.8% in a span of ten years (2006–2016). Many people in rural areas that do not have access to basic energy resources are planning to reside the urban areas, which ultimately results in increased energy demand. Currently, 38% of people live in urban areas, but the rate has been increasing rapidly and is expected to rise to 50% by 2050 [69]. GOB is also planning to reduce the total primary energy demand by reducing energy consumption to −20% with the help of energy-saving building codes [48].
The buildings in Bangladesh range from small bamboo houses in the rural areas to commercial superstructures in urban lands. The economy of Bangladesh depends mostly on agriculture and, as a result, most of the houses in rural areas are found around agricultural or floating farmlands. The rural areas of Bangladesh are also experiencing transformation into urban house designs and multi-story structures, which are often found in high standard and densely populated areas of Dhaka, Bangladesh.
The major portion of energy, electricity consumption in buildings (2015) has been increasing with a rate of +7.8% annually since 2010. Figure 17 shows the increase in the electricity consumption in residential and non-residential buildings of Bangladesh over the period 2010–2015 [3]. The residential sector consumption of electricity has increased enormously by 48% in the same period (2010–2015) due to the rapidly increasing economy of the country, urbanization, and demand for a comfortable lifestyle. In rural households, the residents mostly use biomass to fulfill their energy demands. However, with the passage of time, the demand for comfort has increased and people in rural areas have shifted towards the purchase of more electric equipment, e.g., refrigerators, televisions, etc., [70].
In commercial buildings, there has been a rise of 8% in electricity consumption since 2010. The electricity consumption by air conditioners and lightning are 50% and 10–30%, respectively [71]. Using energy efficient equipment in the commercial sector can reduce electricity consumption by 50%. The new version of Bangladesh national building codes (BNBC) has made it compulsory on major energy consumers to follow the Energy efficiency & conservation codes (EE&C) [72]. Efficient conservation and use of energy can result in a better economy and environment.

3.4. Significance of Building Energy Consumption

The buildings electricity consumption of India (296 TWh: 2015) is six times more than that of Pakistan (47.96 TWh: 2015) and 15 times more than that of Bangladesh (19.56 TWh: 2015). The electricity consumption in non-residential sector buildings in IPB regions is 26%, 13%, and 16%, respectively. The increased electricity usage in commercial buildings of India is due to diverse activities in the commercial sector, a sector that contributed 69% share in 2015 in the national GDP of the country [73]. Between the period 2010 to 2015, the buildings electricity consumption in Pakistan and Bangladesh increased, owing to the domestic income increase, rise in living standards, use of imported electricity-intensive goods, and increasing population of the countries. An electricity audit in commercial buildings of Bangladesh showed that in Dhaka, nearly 8–15% of electricity can be saved using energy efficient equipment and 28% to 45% of electricity consumed in lighting can be reduced with efficient components [74]. In Pakistan, nearly 38% of the residential electricity is used for lighting purposes, which can be made efficient by using Light emitting diodes (LEDs) lamps, Compact fluorescent light (CFLs), and daylight [75]. The electricity supply in India in 2012 was insufficient to meet the demands of the country due to the space cooling needs. The Bureau of energy efficiency (BEE) in India has standardized the levels and labels for users to compare the efficiency of air conditioners that could save nearly 14% of the projected electricity consumption by 2020 [76]. Therefore, the building sector is a major contributor to energy consumption and is an essential part of reviewing energy and development of IPB. The analysis in this section will later form the basis for long-term recommendations to improve average energy consumption.

4. Potential and Utilization of RERs in IPB

Energy is often regarded as the major contributor to a country’s economic and human development, a regular power shortage can hamper economic development and is one of the most glaring disparities between developing and developed countries. The IPB region faces a shortfall of electricity each year, as shown in Figure 18. Various states in India, particularly the ones that are underdeveloped, face a shortfall of electricity each year. Figure 18a shows that in 2012–2013, the electricity shortfall was raised as high as 12.1 GW, which eventually came down to 3.3 GW in 2017–2018 [77]. People in the country, specifically Indian firms, have started to rely on their own generators or alternate power sources to facilitate themselves at the times of power outages. A reasonable increase in the reliability in generation, transmission, and distribution will be required to overcome these shortages and to cut down the use of diesel-based generators at a large scale [78]. Despite ever-increasing electricity demand, the shortfall graph also shows that the GOI, since 2012, was able to reduce the total shortfall by -12% per annum. Similarly, in Pakistan, the shortfall of electricity ranges from 4–7 GW, shown in Figure 18b, with a daily load shedding of 8–10 h. The reasons include circular debt, inability to build new dams due to political reasons, defective policies of the government, line losses, and electricity theft. Pakistan has strong potential to harness the energy shortfall by exploring the available RERs such as solar, wind, biomass, and geothermal. Pakistan has the potential of a generation of 60 GW (40% share in current energy mix) from hydel sources, which would require building new dams in the identified areas. In addition, for micro hydel more than 600 MW (for small units) potential exists in the country [79]. Bangladesh faces a shortfall of nearly 2–4 GW each year with a load shedding of 3–4 h daily in urban areas, whereas in rural areas the duration is even longer [80]. The reasons behind load shedding in the country include operating inefficiencies of public sector power plants that use old machinery, insufficient gas supply to the power plants, system losses, unauthorized electricity connections, and misuse of electricity [81]. Figure 18c shows that the consumption (demand) of electricity has been increasing with an annual rate of +14% each year since 2012. The graph also reveals that the total power shortage remained almost the same during this duration, which suggests none or limited efforts to overcome this power crisis in the country. However, the IPB region is blessed with RERs (solar, wind and biomass), which can help reduce the electricity shortfall prevailing in the region.

4.1. Solar Energy Potential in IPB

Solar energy is one of the cleanest and safest ways to produce sustainable energy. The entire IPB region is blessed with enormous potential for solar energy, which has not been explored up to its complete potential. Owing to the great land area, India has great potential to harness solar energy. India has the potential to generate nearly 5000 trillion kWh/year. The Government of India (GOI) is planning to start hybrid wind and solar power projects to meet its energy demands in the near future [82]. In India, the already deployed solar power projects are producing 5% (19.3 GW) of the total global solar power-based energy [83]. The GOI is set to connect 100 GW of solar plants to the grid and about 40 GW of decentralized rooftop solar PV by 2022 [84]. The GOI has recently installed (2016) 31,472 solar pumps, which is more than the total number of pumps installed during the last 24 years. Nearly 1.2 million households in India are using solar energy to meet their energy demands [85]. Major solar parks of India have also been shown in Table 2 [86].
Pakistan has solar global insolation of 5–7 kWh/m2/day, which, if covering 10 × 10 m2 area of Pakistan with solar panels, can result in a generation of 348 MWh. Pakistan is now progressing in its energy production of solar power projects. Quaid-e-Azam solar park of 1 GW in Punjab is under construction, along with many other small wind and solar power projects of 50 MW. Under rural electrification programs of AEDB, nearly 8000 villages will be electrified using solar Photo voltaic (PV) panel [87]. The Parliament of Pakistan is the first parliament building in the world that only uses solar energy (2016) for its power consumption [88].
The share of solar power is 59.1% among other RERs in Bangladesh, which can be enhanced tremendously owing to the great solar potential. The solar insolation in the area is around 4–5 kWh/m2/day with daily 7–10 sunshine hours [89]. The Bangladesh power development board (BPDB) has initiated various 10kW solar PV AC systems in different districts of Chittagong and a total of 1,320,965 Solar home systems (SHSs) in the entire country. Like Pakistan and India, Bangladesh’s geographical location allows the generation of nearly 282 PWh, whereas the actual share of generation of electricity of solar PV in Bangladesh is only 0.7%. However, the GOB issued 500 MW plan in 2012 for the promotion of solar energy and further plans to initiate 340 MW solar projects that include solar parks, irrigation pumps, mini-grids, and solar roof tops [44,90].

4.2. Wind Energy Potential in IPB

Wind is another powerful resource to produce energy in IPB. The major share among RERs-based power projects in India is of wind energy, accounting for over 57.4% (among RERs) of installed capacity (28,700 MW). The current wind energy share of India is 6.4% (32.8 GW) of the total global wind energy [83]. The GOI is set to connect 60 GW of wind energy plants to the grid by 2020 and is committed to the US to increase the share of RERs in power mix to 40% by 2030. According to Ministry of new and renewable energy (MNRE), India has an estimated wind energy potential of 102 GW at 80 m height and 302 GW at 100 m. Among IPB, India leads in the production of energy using wind resources, which has the highest speed of about 10 m/s, whereas the lowest speed observed is 7 m/s along the coastlines [91]. Muppandal is the most important site of a wind farm in India, with the capacity to produce 1.5 GW of wind energy in the state that uses winds from the Arabian Sea.
Pakistan has a wind speed of 5–7.5 m/s (Sindh), which can produce 11 GW of power [92]. The total power production with wind energy in 2018 in Pakistan was 1.2 GW. The areas along the coast of Sindh and some areas of Baluchistan and KPK have a potential of producing 50 GW of electricity using wind energy [91]. The Alternative Energy Development Board (AEDB) has initiated 23 wind-based projects of 40–56 MW in Jhimpir and Gharo during the years 2013–2018, while a few are under construction. There is slow progress in electricity production with wind energy in Pakistan, but AEDB has been tasked to increase the power production of the country to 5% by 2030 [87].
As compared to India and Pakistan, little work has been done for wind-based power projects in Bangladesh. Bangladesh has a wind speed ranging from 2.96 m/s to 5 m/s in various regions, which can be used to extract power for stand-alone electricity projects [93]. The current capacity of wind power is only 0.9 MW in the country, whereas the total potential of wind power is around 20 GW. However, GOB has targeted on the production of 1.3 GW from wind power by 2021. Two projects of 10 MW and 60 MW are under planning at the locations of Kalapara Patuakhali and Chakaria Upazila Cox’s Bazar, respectively. The areas of St. Martins Island, Cox’s Bazar, Patenga, Bhola, Barguna, Dinajpur, Thakurgaon, and Panchagar bear an average wind speed of 4.5 m/s, which is good enough for running wind turbines [94].

4.3. Biomass Energy Potential in IPB

IPB is an agricultural region, which makes the potential of biomass-based (biogas, agriculture, and livestock) energy projects even higher in the region. India has a great capacity to produce energy from biomass owing to the abundant agricultural and forest area in the country. India has a capacity of 17.5 GW of energy using biomass, while the current generation using biomass is only 2.6 GW. GOI is further installing more biomass power projects to produce 1 GW of energy. India produces nearly 500 million metric tons [95] of biomass each year, which, if utilized properly, can produce 1.16 PWh of electricity [91]. Recently, in 2016, India commissioned various biomass/biogas-based power projects of almost 7.9 GW and initiated deployment of improved biomass cookstoves demonstration in domestic and large-scale cooking communities. Various biomass projects are under construction, ranging from 20 to 102 MW in the states of Punjab, Haryana, and Karnataka.
Pakistan has a strong potential to utilize biomass energy but unfortunately, due to the lack of policies, a great amount of biomass is wasted each year in the form of crop residue, animal livestock, forestry residue, and food waste, etc., [96]. However, AEDB with the help of the world bank has started a biomass mapping program in all provinces of Pakistan, which will evaluate the quantity and quality of biomass along with the technologies required to utilize them. AEDB has started various projects, ranging from 26 to 60 MW, in various places. M/s Chiniot Power Ltd. project has a capacity of 62.4 MW located in Rahim Yar Khan, while another project of 74.4 MW is under the letter of support stage at the same location. More than 1200 biogas plants have been installed at various locations of Punjab, with 72 plants in Kasur. It is estimated in Punjab, if 765,000 (above 20 horse power) tube wells are running on biogas, it could save 29 million liters of diesel per year. The estimated biogas potential of Pakistan is about 201 TWh [9,97].
Bangladesh is not so far in its potential of biomass-based energy production. The country has initiated almost 40,000 biogas-based power plants and is determined to increase this number to 60,000 [98]. A 1 MW grid-connected power plant based on municipal solid waste is under construction and will be completed by 2020. According to a study, each year the country produces 182.22 million tons of biomass and has the potential to produce 373.71 TWh of electricity [16]. However, the actual share of biomass/biogas in the production of electricity in the country is only 0.2% among RERs. In Bangladesh, biogas produced only from animal wastes can result in production of 1.4 billion liters of diesel [99].

4.4. Growth and Analysis of RERs

The efficient use of RERs offers a range of economic and environmental advantages. A comprehensive plan of the existing resources and their percentage utilization is necessary for making candid policy decision. The compiled data of renewable energy in IPB gives a good overview of existing resources and their potential. Table 2 gives a comparison of RERs potential in IPB. Currently, various policies for the promotion of RERs have been presented in these countries, which have drawn the attention of people towards adopting renewable energy. According to a report of the world bank, Pakistan (77/100 points) scored higher than India (67) and Bangladesh (57) in terms of adopting RETs [100]. A sustainable long-term policy is required to manage these resources to exploit RERs to their maximum potential. IPB needs to develop future projection of RERs and its share in the energy mix with increasing population growth and development. These policies will go a long way in planning comprehensive strategies to overcome energy crisis in IPB.

5. Tracking Development and Energy Consumption in IPB

In this section, the GDP and HDI of the IPB and their relation to the ECPC have been analyzed thoroughly to find out the major economical and non-economic factors involved in the increased use of energy in the building sector.

5.1. Gross Domestic Product (GDP)

The variation in the GDP of IPB (1970–2017) is shown in Figure 19. The GDP of Pakistan and India has seen almost similar trends. The major reasons for high growth rates in India are agriculture growth, increased industrial output, government refined policies and ease of doing business. Fast economic growth (international trade, foreign investment, and strong workforce) of India in 2010 resulted in a sudden rise of GDP [102]. The entire globe slowed down in its GDP growth with 3.5% between 2005 and 2015 due to the great recession, but India still moved forward in its GDP growth owing to the reforms in the country [103]. Despite having a high GDP growth rate, India, along with other countries of South Asia, is considered as a poor region due to the economic imbalance among the population, where income disparity is on the rise over the years.
In Pakistan, the factors affecting the GDP include agriculture, industrial, services, and trade sectors growth, along with the hurdles faced by the country in terms of impacts of terrorism, energy crises, and security conditions between 2000 and 2014 [105]. In 2001, the incident of 9/11 occurred, which led to a wave of terrorism in Pakistan, leaving negative impacts on its economy [106]. However, due to the consistent engagement of Pakistan’s military in the affected areas, the security conditions in Pakistan became much better, giving rise to its economic development. The change of GDP in Pakistan after 2005 is also attributed to various economic factors, e.g., in 2005, the agriculture sector of Pakistan showed improved growth of 6.6%, and the manufacturing industry showed an efficient growth of 15.4% [107]. Whereas, in 2010, a shift towards the services sector, industrial sectors (manufacturing, mining, quarrying, and energy), and business sectors resulted in a rise in GDP and ultimately HDI [108]. The overall growth in GDP of Bangladesh is not significant as compared to Pakistan and India. In 2013, the political violence in the country affected the overall economic growth since the public property was destroyed and commercial centers were shut down, resulting in lower overall sales [109]. Despite having repeated extraneous economic shocks, natural disasters, and widespread poverty, the GDP growth rate of Bangladesh in 2017 was 12%, which is 10% higher than that of Pakistan, and is projected to grow at a pace of 6–7% during 2018–2020 [110]. From 1970 to 2017, the GDP has seen a +2.05% annual increase. The reasons behind the rise in GDP are microfinance and industry growth (garments) in the country [111]. Bangladesh (at present, a low-income country) targets to become a middle-income economy by 2021, which will require a massive increase of power supply for its rapidly growing economy [112].

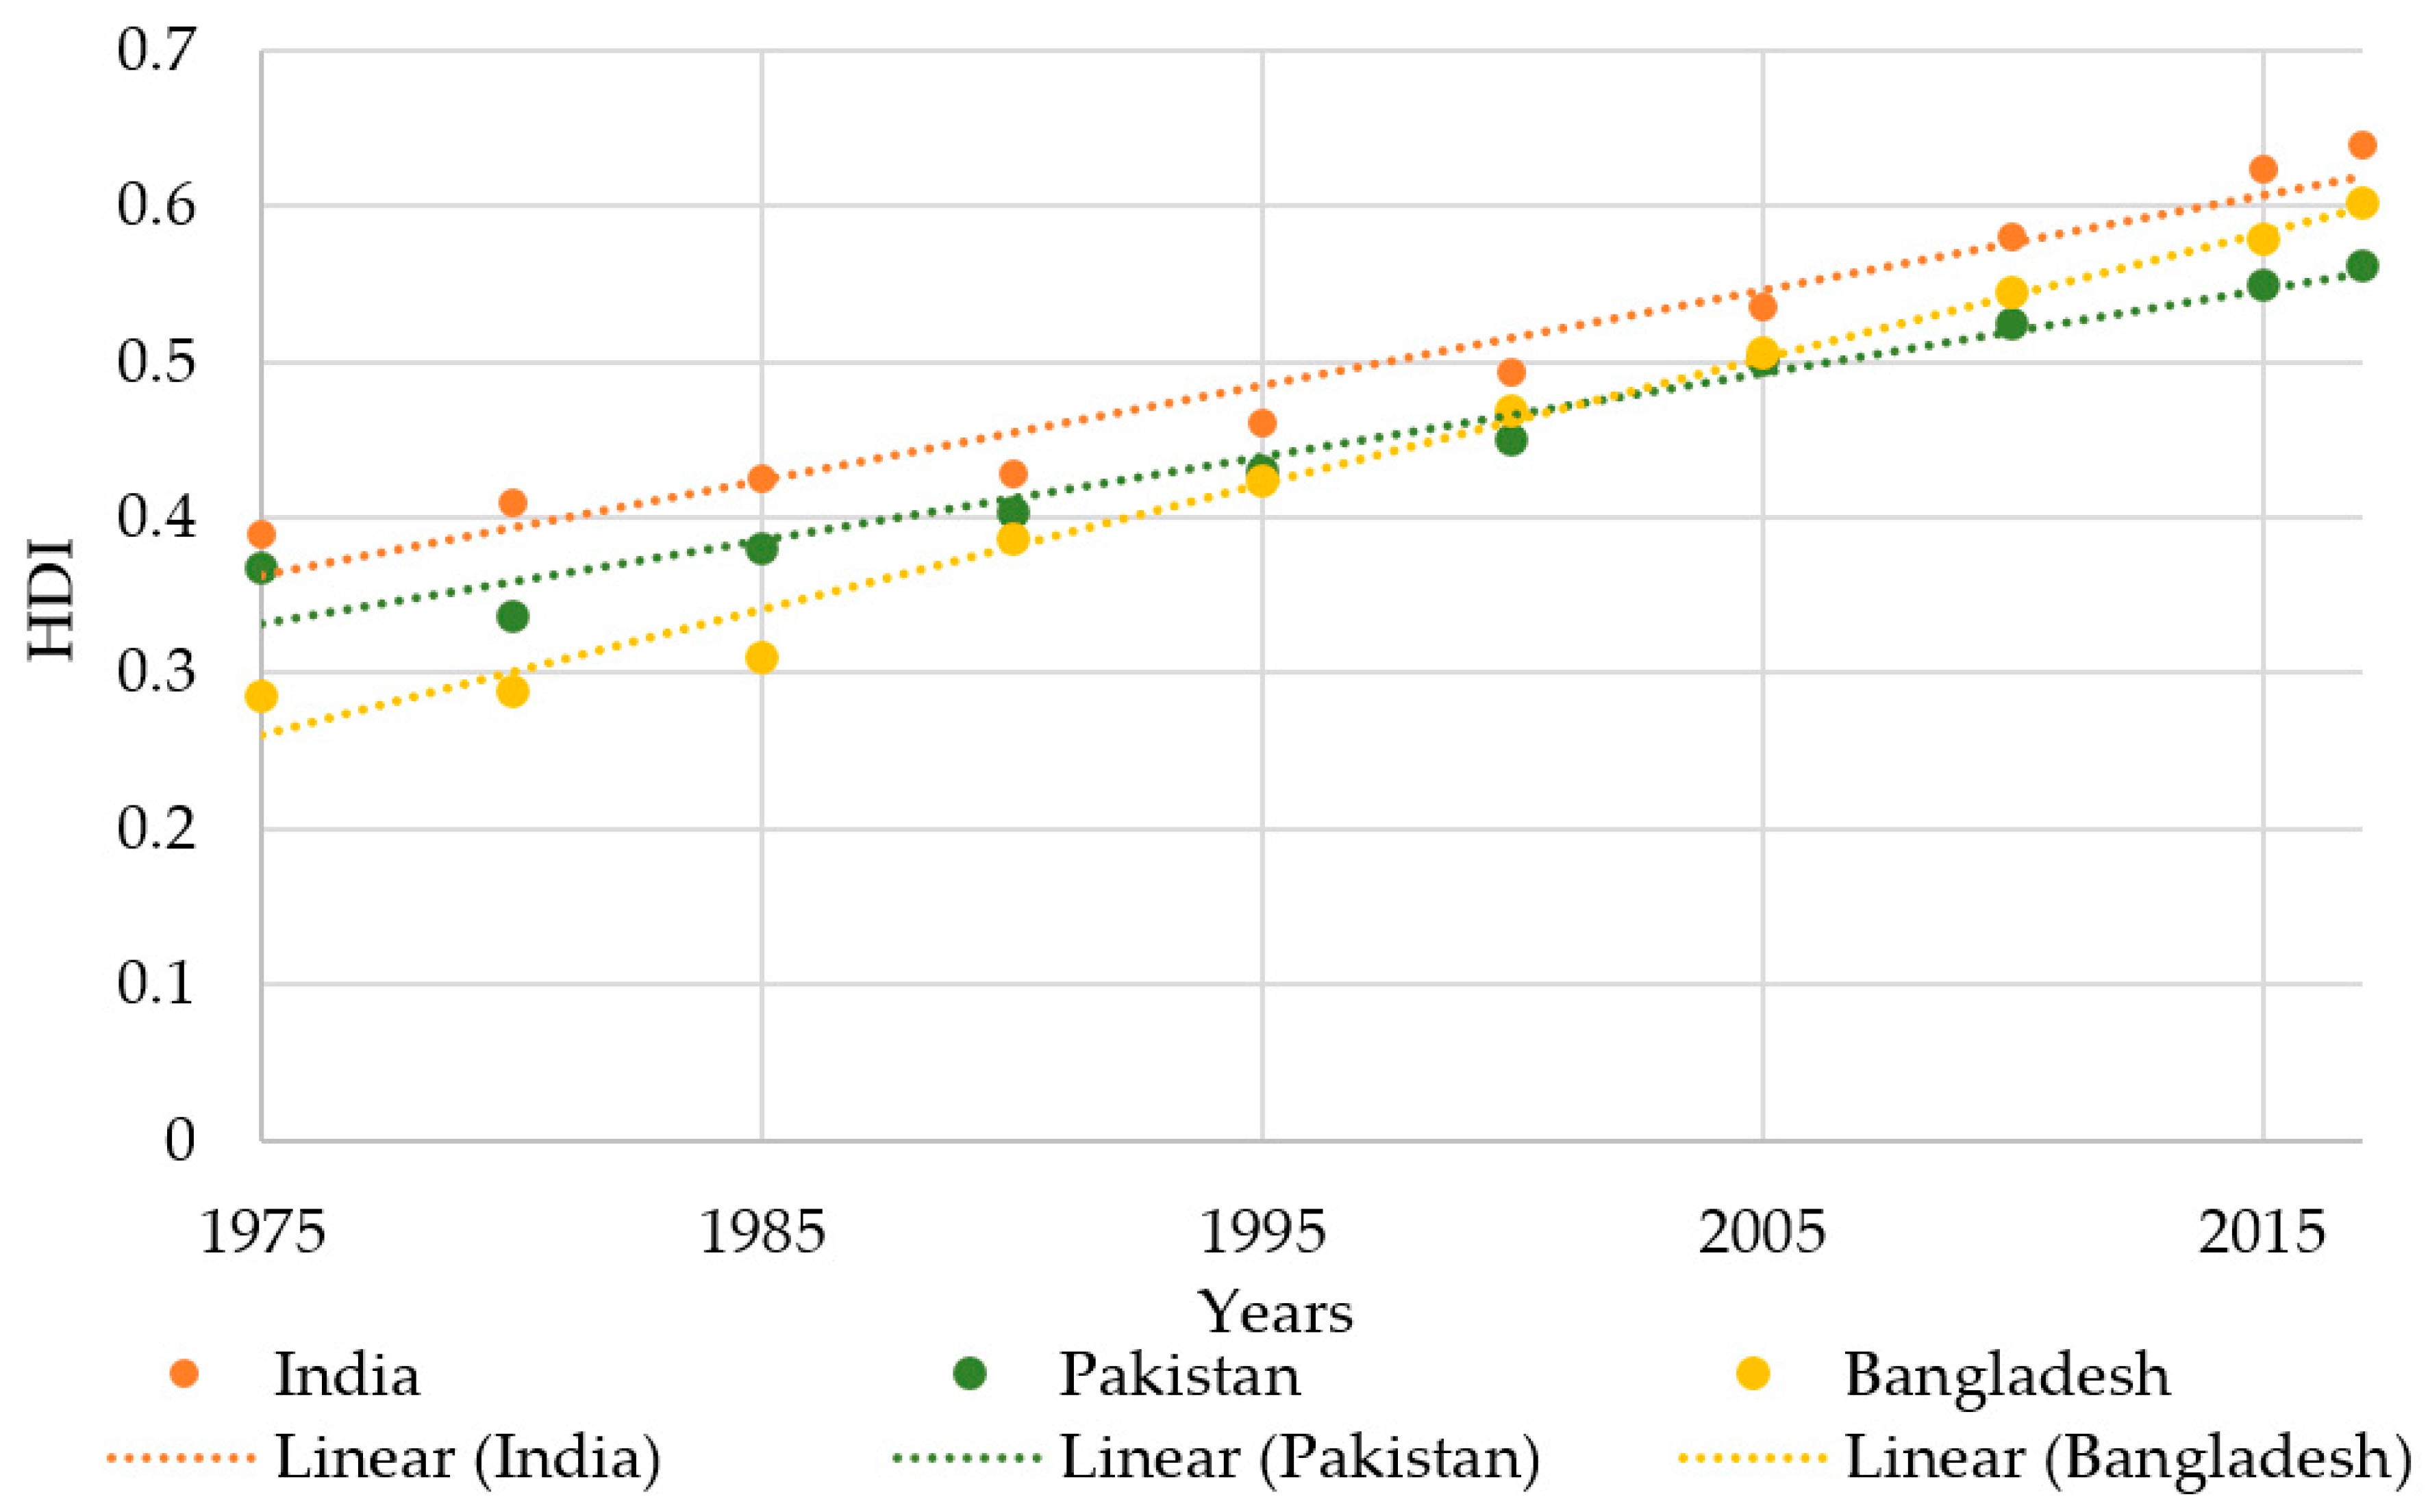
5.2. Human Development Index (HDI)

A comparison of HDI of IPB over the period 1975–2017 is shown in Figure 20. The HDI of India (0.640: 2017) shows a linear trend [113]; however, there exists a growing inequality among various states of India, with some states showing HDI in the range of lowest human development regions, which can be overcome by covering the differences at the state level. The rate of increase of HDI (1.5% per annum) is not as high as compared to the GDP of the country due to the multidimensional poverty, lack of educational standards and health facilities, high rates of malnutrition, unemployment, and lower budget allocation for the health and education sectors [114,115]. The HDI of Pakistan (0.56: 2017) shows [104] a linear trend with the lowest rate of increase observed yearly among IPB since 1975 (1.2% annually). This shows no significant steps had been taken by the Government to raise the HDI of the country. However, the new selected government in 2018 has shown a keen interest in developing policies to focus on the human development through the provision of basic health and education facilities, employment, reducing poverty, and by increasing the standards of education. The HDI of Bangladesh has seen similar increasing trends to India and ranks as a medium development country. From 1970 to 2017, the HDI has increased by +2.35% annually, which is highest among IPB. According to the United nations development program (UNDP), the average increase in the rise of HDI of Bangladesh had been highest among all South Asian Countries in 1990–2015 (1.64%) [116]. However, due to a rapidly growing population, nearly 16% of people in Bangladesh still live below the line of severe poverty, with acute deprivation in health, education, and living standards in the country. In addition, the UNDP reports also state that there exists inequality in the human development distribution, as is the case with India.

5.3. Electricity Consumption Per Capita (ECPC)

The ECPC of India and Pakistan remained almost the same till 2005. Figure 21 gives a comparison of ECPC of IPB. The increasing ECPC trend of India (1075 kWh: 2017) became exponential afterwards, with a leap of 609 kWh in merely 12 years. The ECPC of India (1075 kWh: 2017) is one-third of the average ECPC of the world (3.1 MWh: 2017). The rate of increase in ECPC of India is due to the electrification of villages, rise in domestic electric power consumption, technology advancements, rise in living standards, industrialization, high rate of population (ranked 2nd in the most populous nations of the world) [117] and economic growth [118]. India is one of the largest steel producing countries (3rd) of the world. Nearly 57% of the steel is produced using electricity, resulting in massive electricity consumption [119]. For Pakistan, the major reasons behind the overall rise in ECPC include industrialization, improved living standards, urbanization, and technology advancement. An important fact to notice in Figure 19 is the exponential rise in the GDP of Pakistan after 2005; USD 177 billion (2010) from USD 73 billion (2005) in merely five years, and has been increasing from 2010 to 2017 with a rate of +10.94% per annum. In 2005 there also has been a +4.8% rise in ECPC per annum (2000–2005) as compared to the previous (1995–2000) rate of +0.8% in 2000, which is one of the reasons for increase in GDP in 2005. The rise in ECPC has a positive influence on GDP of the country, whereas load shedding with increased prices of electricity had caused a negative impact on the economy and demands implementation of load management strategies within the country [120]. The ECPC of Bangladesh is 330 kWh (2017), which is quite low as compared to Pakistan and India. Bangladesh came into existence 24 years after the formation of Pakistan and India, and thus the country has not seen a high level of development due to high rate of population (average 1.89% annually since 1970) and poverty with natural disasters causing damage to infrastructure [121]. The ECPC of Bangladesh has seen an increase of about +63% per annum from 1970 to 2017 as shown in Figure 21. The ECPC of Bangladesh is lower as compared to Pakistan and India but the rate of rise of ECPC has been the highest among IPB (+63% per annum since 1971). In 1971, only 3% of the population had access to electricity, which despite facing natural disasters, eventually rose to 60% in 2012 [45].

5.4. Relationship of Electricity Consumption with GDP and HDI

In IPB, the common reasons for the rise in ECPC include technological advancements, industrialization, rise in living standards, improved health and transport facilities, and urbanization. These factors ultimately demand an increase in energy consumption in the building sectors of IPB, a source of over 50% of total energy consumption. In IPB the level of awareness of green energy is also low in the public, which results in an increased load on the grid.
The author in [122] finds a unidirectional relationship between the ECPC and GDP of Bangladesh and states that it is the GDP that drives the energy consumption in Bangladesh. For Pakistan and India, the rise in GDP and ECPC are strongly dependent on each other. These trends of ECPC, HDI, and GDP show that these three parameters are strongly related to each other, i.e., higher ECPC means higher HDI and GDP, and vice versa. Figure 22 shows a logarithmic relationship between ECPC and GDP of Bangladesh and Pakistan, while the relationship for India has been observed to be linear. In IPB during the period 1975–2017, industrialization increased, which ultimately resulted in higher GDP and electricity consumption. (RIndia = 0.95, RPakistan = 0.93, RBangladesh = 0.98).
Figure 23 shows linear relationship between ECPC and HDI of IPB (RIndia = 0.94, RPakistan = 0.93, RBangladesh = 0.90). These higher values of correlation coefficient (R) clearly demonstrate that human development in IPB is strongly dependent on the availability of electricity. Implementation of effective building codes and RERs policies can play a significant role in efficient energy utilization which will further enhance economic and human development. In the next section, building codes and RERs policies have been reviewed with a view to identify their degree of effectiveness.

6. Building Codes and RERs Policies in IPB

The building sector is one of the major energy-extensive sectors in IPB. IPB have building codes and RERs policies in place, which have been discussed in detail in this section, to identify their degree of effectiveness.

6.1. Buildings Energy Efficiency Codes (BEECs)

Building regulations are mandatory standards for the design and construction of buildings to ensure energy efficiency and the health and safety of people including those with disabilities [123]. To regulate energy efficiency in buildings, Building energy efficiency codes (BEEC) have been introduced worldwide parallel to the building regulations. International energy agency (IEA) defines BEEC as a set of minimum but mandatory energy performance requirements to regulate energy use in buildings [124]. Some of the elements defining BEEC are:
(i)
Comprehensive coverage of buildings based on size, age, and its geographic location.
(ii)
An inspection framework for code compliance at various construction stages.
(iii)
Energy efficiency trainings of building staff.
(iv)
Use of recommended building materials.
Table 3 briefly explores the BEECs employed in IPB along with their challenges faced in implementation.
The review of building codes has revealed that IPB are moving towards sustainable energy efficient building sector. The core energy-efficient elements identified in building codes of these countries are building envelope, lighting and Heating, ventilation, and air conditioning (HVAC), which can be attributed to the climatic condition of this region. However, it has been observed that implementation of buildings codes is seriously lacking and requires some solid measures such as the development of revised building codes/policies by the respective governments. In developed countries of the world, mostly the BEECs are prepared through expert organizations and implemented either through national or state legislatures [144]. The jurisdiction varies from national to state and plays an important role, which is not only limited to implementation but also to training and supporting industry and evaluation agencies. An important aspect of energy saving by various countries is to adapt strict policies by following any of the standards defined by relevant international agencies/forums e.g., IEA (International Energy Agency) or IPEEC (International Partnership for Energy Efficiency Cooperation), which helps them to accelerate their progress towards achieving global energy and climate goals. Another new initiative taken by the developed economies is moving towards green building codes, for example Code for sustainable homes (CSH) is fully implemented in the UK [124]. These codes not only allow energy savings but also helps to maintain good environmental quality and sustainability. Note that the awareness level of people in IPB is very poor towards building codes [139,140], a good understanding is required at all levels to gain advantage and build energy efficient living environment.

6.2. Renewable Energy Policies and Challenges

Besides the building regulations, there are dedicated departments for the promotion and exploitation of RERs in IPB, where renewable energy policies have been developed for promoting the use of RETs. The implementation of BEECs and RETs development in IPB is often hindered by the social barriers. Overall, a lack of public awareness is observed with an uncooperative attitude of general public towards any initiative adopted by the government to improve reliability of electric supply. In IPB like other developing countries the episodes of “Not in my back-yard” prevail [145,146]. In addition, the majority of the population resides in rural areas, where people cannot afford of-the-grid RETs for electricity generation. All these issues along with growing demand of energy in IPB becomes a constant challenge and will greatly impact the progress towards human development and economic sustainability of these countries. This section discusses the renewable energy policies and challenges in IPB with special emphasis to identify opportunities as well as the effectiveness of existing policies.

6.2.1. Renewable Energy Policies and Challenges in India

India has many policies built for the promotion and development of RERs. These policies include the Indian National Policy on Biofuels (2015), National Renewable Energy Law 2015—DRAFT (2015), and India 175 GW Renewable Energy Target for 2022 (2015), etc., with the main purpose to increase the consumption of RETs as energy sources. Separate policies for the promotion of wind and solar-based projects have been implemented in states like Maharashtra, Andhra Pradesh, Uttar Pradesh, Gujrat, etc., [147]. India is the only country in the world that has developed a ministry for RERs, the MNRE. The country is promoting the RERs based power projects through private investment, mandatory environmental audits for power projects and promotion of stand-alone systems for rural and remote areas [148]. MNRE initiated Solar Energy Corporation of India, whose main objective is to make India world’s leading country to produce solar power projects by 2022 [149]. However, the country still faces hurdles in implementing the RERs policies. Despite having an abundance of solar power potential, the dependence on solar projects includes high initial cost, technical skills, and manufacturing challenges due to competitors (China and Taiwan). The country is promoting solar projects with the of taxes on import of cells and giving incentives to the people on purchase of equipment but lacks these provisions for wind-based power projects [25]. Although various policies exist for the states but the government provides limited solutions or facilitates the investors for only a short period of time. For example, the wind energy promotion policy in Madhya Pradesh (MP) waives off the electricity duty payment for only a 5-year period, giving rise to uncertainty in people for investment in RER based projects [150]. There also exists a lack of cooperation among different ministries [151]. India has recently passed the National Wind-Solar Hybrid Policy (2018) along with schemes for the promotion of biomass-based cogeneration in industries and promotion of solar thermal technologies for cooking, space heating, and cooling applications aiming at better utilization of resources. It is predicted that the hybrid policy will also open up a new area for availability of renewable power at competitive prices along with reduced variability.

6.2.2. Renewable Energy Policies and Challenges in Pakistan

In Pakistan, there are two dedicated departments working for promoting the RETs, the Pakistan Council of Renewable Energy Technologies (PCRET) and AEDB. PCRET [152] was established in 2001 with an aim to carry out R&D in the field of RETs for the socio-economic development of the country and promote the new and existing technologies to overcome the prevailing energy shortages. AEDB’s main objective is to facilitate, promote, and encourage the development of Renewable Energy in Pakistan. The Government of Pakistan has tasked the AEDB [153] to ensure 5% share of RETs in total national power generation capacity by 2030. Pakistan introduced its first renewable energy policy in 2006 [154]. It focuses mainly on enhancing the deployment of solar, wind, and micro-hydel power projects in the country along with the mitigation of poverty by providing employment with technical skills in the people. The policy also facilitates investors through different incentives. However, the country has seen slow progress in the deployment of RERs-based power projects due to different challenges [155]. The energy conservation policy of Pakistan was meant to increase the consumption of renewables in the country to 10% by 2015 but could not do so due to different barriers such as the higher cost of the equipment and import duty [156]. Other barriers include the unavailability of local manufacturing plants of RERs and unavailability of skilled workers in this significant area. Universities in Pakistan have realized the significance of RERs and have started undergraduate and graduate level programs in energy engineering systems to produce skilled engineers in this area. Import duty on RERs has been waived off/minimized by the current government and, therefore, it is hoped that the growth in the use of RERs will accelerate in Pakistan in the coming years.

6.2.3. Renewable Energy Policies and Challenges in Bangladesh

In Bangladesh, the GOB issued its renewable energy policy in 2008 [157]. Major features of this policy include: promotion of solar PV based systems, promotion of solar water-based heaters, tax exemption at the user end, private sector partnerships, and promotion of clean energy. GOB has planned to remove the barriers in the way of power production using biomass and provides financial support to proposals received and a one-time capital subsidy according to the installed capacity [95]. To mitigate depletion of energy resources, Sustainable and Renewable Energy Development Authority (SREDA), GOB have also issued EE&C Master Plan [71] in 2015 to promote three programs:
(i)
Energy Management Program to target large industrial consumers
(ii)
EE&C Labeling Program intended for residential consumers
(iii)
The EE&C Buildings Program focused on the implementation of new versions of BNBC (Revised)
The barriers in the way of policies promoting RERs in Bangladesh are similar in nature to Pakistan and India. These include lack of incentives for private investors, lack of coordination among ministries, difficulty in procedures, limited budget allocation to the RERs-based projects, and slow rate of diffusion of new technologies [101,158]. Lack of awareness is also one of the major causes in the promotion of green buildings, where the public keeps following the traditional construction and energy consumption habits [159]. However, with the help of SREDA, the GOB is making its way out to overcome these challenges by establishing 52 million solar home systems in the past 5 years, finalizing the draft of energy audit regulation-2018, starting short-term loan schemes for buildings and industrial sectors and energy conservation schooling program for the awareness of importance of RETs among public.

7. Analysis, Opportunities, and Recommendations

7.1. Analysis and Opportunities

In this study, energy mix, total energy consumption, buildings energy consumption in the context of its driving factors viz. GDP, HDI, ECPC, building energy codesm, and RERs policies of IPB have been thoroughly studied and compared. The following analysis and opportunities have been drawn from this study;
(i)
Fossil fuels have a major share in the energy mix of IPB with natural gas as highest (40%), oil second (29%) and coal as third (23%). In terms of total energy consumption, India stands first (8765.5 TWh), Pakistan second (940.8 TWh), and Bangladesh at third place (383.7 TWh). India has the highest population among the total population of IPB (77.4%). An analysis of energy mix and contribution of fossil fuels in IPB has seen a limited change from 1970 to date.
(ii)
In terms of ECPC, India has highest ECPC (1075 kWh), which is 45% higher than that of Pakistan (598 kWh) and 69% higher than that of Bangladesh (330 kWh).
(iii)
The ECPC and GDP of IPB countries are logarithmically related to each other (RIndia = 0.95, RPakistan = 0.93, RBangladesh = 0.92). This strong relationship between ECPC and GDP clearly shows that the economic development in these countries is directly linked with the availability of energy resources especially electricity.
(iv)
The human development in IPB is strongly dependent on the availability of electricity (RIndia = 0.94, RPakistan = 0.93, RBangladesh = 0.90). However, all three countries are facing power shortage, which has led to lower values of HDI in the medium range for India and Bangladesh, while Pakistan falls in the lower range (HDIIndia = 0.64, HDIPakistan = 0.57, HDIBangladesh = 0.60). The rising trend of HDI in IPB can be attributed to the increasing urbanization and improved living standards.
(v)
Rising population, GDP, and HDI have resulted in increased buildings energy consumption in IPB. The major drivers are rapid urbanization, industrialization, the rise in living standards, and increasing per capita income, which has ultimately improved health, education, and recreational facilities.
(vi)
There has been an increase of 8.6%, 4%, and 7.8%, respectively in the building’s electricity consumption of IPB annually during the period of 2010–2015.
(vii)
The building energy efficiency codes in IPB require a proper implementation to realize quantitative benefits. Different stakeholders lack awareness about these building codes; therefore, provide opportunities to gain the advantage of energy efficiency in buildings. It is evident from the reported studies that proper implementation of these codes can result in 30–40% energy savings in the building sector of IPB.
(viii)
The IPB lack quality indicator due to insufficient resources to review buildings and designs, which undermines both implementation and compliance.
(ix)
The current share of RERs in the energy mix of IPB is insignificant due to ineffective policies and lack of skilled manpower with heavy reliance on fossil fuels.
(x)
A total of 1.5 PW (Solar: 99.9%, Wind: 0.00006%: Biomass: 0.0008%) of energy for India, 8.76 TW (Solar: 99.2%, Wind: 0.57%, Biomass: 0.26%) for Pakistan, and 77.63 TW (Solar: 99.9%, Wind: 0.0002%, Biomass: 0.0005%) for Bangladesh can be produced from RERs.

7.2. Recommendations

(i)
There is a heavy dependence of fossil fuels in IPB, which are finite resources and have adverse effects on the environment, economy, education and health sectors. More rigid policies for implementation of RETs and extensive research work in this field should be encouraged.
(ii)
The ECPC trends with GDP and HDI show that to stand in the line of developed nations, IPB must focus on efficient use of energy by reducing the power consumption and generation gap. In addition, the only possible solution is to invest in RETs.
(iii)
To make the buildings energy efficient, implementation of BEECs at the government level with increased awareness of the public is necessary through electronic and social media. Certification of green buildings and regular audits can help improve the implementation rate of BEECs. These building codes must be declared mandatory for the new and existing buildings to realize higher energy savings.
(iv)
The government should devise plans to encourage the stakeholders in adopting the RETs by offering jobs in this sector, providing essential security to the investors, offering incentives (such as Feed-in-Tariff, decreased import duty, and sales tax on RETs equipment), integrating RETs into the energy audits and their evaluation, and by introducing carbon tax on use of fossil fuels. Significant federal tax credit and exemption to the companies supporting renewable energy production is another recommendation for IPB countries.
(v)
The current focus of RERs policies in IPB is to increase overall grid electricity but should also focus on the development of plans on renewable energy generation in buildings. The concept of net metering should be introduced in IPB, which credits solar energy system owners who add electricity to the grid (Feed-in-Tariff). The net metering is successfully employed in various developed countries and will accelerate the promotion of RETs.
(vi)
Governments of IPB should encourage the development of technical programs to produce skilled labor in order to support the promotion of RETs. In addition, local industries should be encouraged in developing indigenous RETs equipment.
(vii)
The governments of IPB need to realize the cultural and social impacts and revise their existing approach towards public awareness for the electric energy generation and its environmental impact. Note that these steps are long being ignored by IPB countries and are usually treated as minor issues. This will help to overcome any contrary opinion of general public towards any initiative adopted by the government to improve reliability of electric supply.
(viii)
It is necessary to introduce and adapt some well-recognized building environmental assessment schemes to develop a more robust ecologically friendly criteria and establish good regulatory mechanisms for the monitoring and management of standards.

8. Conclusions

The energy mix of IPB with special emphasis on energy consumption and its impact on economic growth and human development have been extensively reviewed in this paper. The main performance indicator of ECPC, GDP, HDI, and buildings energy consumption have been found strongly correlated to support the pragmatic findings that availability of enough energy resources will ensure the rising economic and human development of IPB countries. The paper also particularly analyzed BEECs with a specific recommendation to improve the efficient use of energy in the building sector. Implementation of energy efficient building codes can play an important role in the sustainable development of IPB. The growing economy of IPB will require renewable and sustainable energy resources to meet their future energy needs. The Governments of IPB are recommended to focus on generating cost-effective electricity by overcoming technical and governing barriers in the way of implementation and adapting RETs with special emphasis on policies affecting energy consumption. A rapidly increasing population and accelerated urbanization in IPB requires concrete policies by the government to overcome the challenge of energy deficiency and the recommendations and analysis in this paper will go a long way in helping IPB overcoming its energy crisis. The study analyzed energy resources and development in major South Asian countries, and finally, conclude that renewable and sustainable energy is indispensable for the eco-friendly future and economy for IPB countries. The analysis and conclusions in this paper are general and also applicable to other developing countries in the world.

Author Contributions

Conceptualization, R.A.S., K.P.A., and N.I.R.; methodology, R.A.S., K.P.A. and M.A.; formal analysis, N.A., F.P.G.M., and C.Q.G.M.; investigation F.P.G.M., N.A., and C.Q.G.M.; writing—original draft preparation, R.A.S. and N.A.; writing—review and editing, K.P.A., N.I.R., and M.A.; supervision, K.P.A., C.Q.G.M. and M.A. All authors have read and agreed to the published version of the manuscript.

Funding

The work reported herewith has been financially by the Dirección General de Universidades, Investigación e Innovación of Castilla-La Mancha, under Research Grant ProSeaWind project (Ref.: SBPLY/19/180501/000102).

Conflicts of Interest

The authors declare no conflict of interest.

References

  1. World Energy Outlook. India Energy Outlook 2015. Available online: https://webstore.iea.org (accessed on 9 July 2020).
  2. EIA. Annual Energy Outlook 2017. Available online: https://www.eia.gov/outlooks/aeo/ (accessed on 14 May 2020).
  3. WEO. 2017: Key Findings. International Energy Agency. Available online: https://www.iea.org/weo2017/ (accessed on 15 May 2020).
  4. International Energy Association. IEA Statistics. International Energy Association. 2018. Available online: http://www.iea.org/statistics/statisticssearch/ (accessed on 15 May 2020).
  5. Shahbaz, M.; Zakaria, M.; Shahzad, S.; Mahalik, M. The energy consumption and economic growth nexus in top ten energy-consuming countries: Fresh evidence from using the quantile-on-quantile approach. Energy Econ. 2018, 71, 282–301. [Google Scholar] [CrossRef] [Green Version]
  6. Adu, D.; Denkyirah, E. Economic growth and environmental pollution in West Africa: Testing the environmental kuznets curve hypothesis. Kasetsart J. Soc. Sci. 2018. [Google Scholar] [CrossRef]
  7. Kaygusuz, K. Energy for sustainable development: A case of developing countries. Renew. Sustain. Energy Rev. 2012, 16, 1116–1126. [Google Scholar] [CrossRef]
  8. Ahmed, S.; Islam, M.; Karim, M.; Karim, N. Exploitation of renewable energy for sustainable development and overcoming power crisis in Bangladesh. Renew. Energy 2014, 72, 223–235. [Google Scholar] [CrossRef]
  9. Wakeel, M.; Chen, B.; Jahangir, S. Overview of energy portfolio in Pakistan. Energy Procedia 2016, 88, 71–75. [Google Scholar] [CrossRef] [Green Version]
  10. EIA. International Energy Outlook 2017. Available online: https://www.eia.gov/outlooks/ (accessed on 15 May 2018).
  11. Nejat, P.; Jomehzadeh, F.; Taheri, M.; Gohari, M.; Majid, A.M. A global review of energy consumption, CO2 emissions and policy in the residential sector (with an overview of the top ten CO2 emitting countries). Renew. Sustain. Energy Rev. 2015, 43, 843–862. [Google Scholar] [CrossRef]
  12. Amber, K.; Aslam, M.; Ikram, F.; Kousar, A.; Ali, H.; Akram, N.; Afzal, K.; Mushtaq, H. Heating and cooling degree-days maps of pakistan. Energies 2018, 11, 94. [Google Scholar] [CrossRef] [Green Version]
  13. Perwez, U.; Sohail, A. Forecasting of pakistan’s net electricity energy consumption on the basis of energy pathway scenarios. Energy Procedia 2014, 61, 2403–2411. [Google Scholar] [CrossRef] [Green Version]
  14. Ahamad, M.; Tanin, F. Next power generation-mix for Bangladesh: Outlook and policy priorities. Energy Policy 2013, 60, 272–283. [Google Scholar] [CrossRef]
  15. Kaur, R.; Luthra, A. Population growth, urbanization and electricity—Challenges and initiatives in the state of Punjab, India. Energy Strategy Rev. 2018, 21, 50–61. [Google Scholar] [CrossRef]
  16. Khanzode, P.; Nigam, S.; Karthikeyan, S. Indian power scenario-a road map to 2020. In Proceedings of the 2014 International Conference on Circuits, Power and Computing Technologies [ICCPCT-2014], Nagercoil, India, 20–21 March 2014. [Google Scholar]
  17. Rath, S.; Yu, P.; Srinivas, S. Challenges of non-communicable diseases and sustainable development of China and India. Acta Ecol. Sin. 2018, 38, 117–125. [Google Scholar] [CrossRef]
  18. Huda, A.; Mekhilef, S.; Ahsan, A. Biomass energy in Bangladesh: Current status and prospects. Renew. Sustain. Energy Rev. 2014, 30, 504–517. [Google Scholar] [CrossRef]
  19. Štreimikienė, D. Residential energy consumption trends, main drivers and policies in Lithuania. Renew. Sustain. Energy Rev. 2014, 35, 285–293. [Google Scholar] [CrossRef]
  20. Yuan, X.; Wang, X.; Zuo, J. Renewable energy in buildings in China—A review. Renew. Sustain. Energy Rev. 2013, 24, 1–8. [Google Scholar] [CrossRef]
  21. Maps of India. Political Map of India. Available online: https://www.mapsofindia.com/maps/india/india-political-map.htm (accessed on 8 July 2018).
  22. Maps of World. Political Map of Bangladesh. Available online: https://www.mapsofworld.com/bangladesh/bangladesh-political-map.html (accessed on 6 August 2018).
  23. Dudley, B. BP Energy Outlook, 2018 edition. Available online: https://www.bp.com/ (accessed on 9 July 2018).
  24. U.S Energy Information Administration. Energy Outlook 2017. Available online: www.iea.org (accessed on 9 July 2018).
  25. BP Global. BP Statistical Review of World Energy. Available online: https://www.bp.com/en/global/.../energy.../statistical-review-of-world-energy.html (accessed on 11 July 2018).
  26. The Oil and Gas Year. The Oil and Gas Year India 2017. Available online: https://www.theoilandgasyear.com/ (accessed on 10 July 2018).
  27. Khare, V.; Nema, S.; Baredar, P. Status of solar wind renewable energy in India. Renew. Sustain. Energy Rev. 2013, 27, 1–10. [Google Scholar] [CrossRef] [Green Version]
  28. Government of India. Power Sector. Available online: www.mowp.gov.pk/ (accessed on 15 July 2018).
  29. Patil, Y.Y.; Raut, P.D. Demographic study around proposed jaitapur nuclear power plant, Maharashtra, India: A case study. Environ. Res. Dev. 2012, 6, 916–922. [Google Scholar]
  30. Government of India. Statistical Yearbook of India 2017. Available online: www.mospi.gov.in/statistical-year-book-india/2017 (accessed on 20 July 2018).
  31. Government of India. Annual Report 2017. Available online: https://powermin.nic.in/en/content/annual-reports-year-wise-ministry (accessed on 20 July 2018).
  32. Oda, H.; Tsujita, Y. The determinants of rural electrification: The case of Bihar, India. Energy Policy 2011, 39, 3086–3095. [Google Scholar] [CrossRef] [Green Version]
  33. Farooqui, S. Prospects of renewables penetration in the energy mix of Pakistan. Renew. Sustain. Energy Rev. 2014, 29, 693–700. [Google Scholar] [CrossRef]
  34. Hydrocarbon Development Institute of Pakistan. Pakistan Energy Yearbook 2015; Ministry of Petroleum and Natural Resources: Karachi, Pakistan, 2015.
  35. Government of Pakistan. Pakistan Economic Survey 2007–08. Available online: www.finance.gov.pk/survey_0708.html (accessed on 27 June 2020).
  36. Mumtaz, A.; Khan, A. Prospects for coal gasification in Pakistan. Energy 1986, 11, 1103–1111. [Google Scholar] [CrossRef]
  37. Government of Pakistan. Pakistan Economic Survey 2013/14. Available online: www.finance.gov.pk/survey_1314.html (accessed on 29 June 2020).
  38. CPEC. CPEC Project Updates, February 2018. Available online: http://www.cpecinfo.com/news/cpec-project-updates-feb-2018/NDg2MQ== (accessed on 29 June 2020).
  39. Salehg, A. Oil & Gas Sector of Pakistan and Sustainable Development, 1st ed.; LAP Lambert Academic Publishing: 2015. Available online: https://www.researchgate.net/publication/278751135_Oil_Gas_Sector_of_Pakistan_and_Sustainable_Development (accessed on 20 January 2020).
  40. PNRA. Pakistan Nuclear Regularity Authority Annual Report 2017. Available online: https://www.pnra.org/reports.html (accessed on 30 June 2020).
  41. Pakistan Bureau of Statistics. District Wise Census Results 2017. Available online: http://www.pbs.gov.pk/content/provisional-summary-results-6th-population-and-housing-census-2017-0 (accessed on 20 June 2020).
  42. Oil and Gas Regularity Authority. State of the Regulated Petroleum Industry. Available online: www.ogra.org.pk/download/3227 (accessed on 30 June 2020).
  43. Kalair, N.A.; Bilal, H. Smart grids: An approach to integrate the renewable energies and efficiently manage the energy system of Pakistan. In Proceedings of the 2014 Computing, Communications and Networking Technologies (ICCCNT), Hefei, China, 11–13 July 2014. [Google Scholar]
  44. Malek, M.I.; Hossain, M.M.; Sarkar, M.A.R. Production and utilization of natural gas. In Proceedings of the 7th IMEC &16th Annual Paper Meet, Dhaka, Bangladesh, 2–3 January 2015. [Google Scholar]
  45. Baky, H.M.; Rahman, M.; Islam, A. Development of renewable energy sector in Bangladesh: Current status and future potentials. Renew. Sustain. Energy Rev. 2017, 73, 1184–1197. [Google Scholar] [CrossRef]
  46. Das, A.; Halder, A.; Mazumder, R.; Saini, V.; Parikh, J.; Parikh, K. Bangladesh power supply scenarios on renewables and electricity import. Energy 2018, 155, 651–667. [Google Scholar] [CrossRef]
  47. Islam, S.; Khan, M. A review of energy sector of bangladesh. Energy Procedia 2017, 110, 611–618. [Google Scholar] [CrossRef]
  48. Hassan, A.; Rahman, M.; Khan, F.; Malik, M.; Ali, M. Electricity challenge for sustainable future in Bangladesh. APCBEE Procedia 2012, 1, 346–350. [Google Scholar] [CrossRef] [Green Version]
  49. Planning Commission. Seventh Five Year Plan (FY2016–FY2020): Accelerating Growth, Empowering Citizens. Available online: www.plancomm.gov.bd/ (accessed on 28 July 2020).
  50. People’s Republic of Bangladesh MB. People’s Republic of Bangladesh Power & Energy Sector Master Plan. Available online: http://www.open_jicareport.jica.go.jp/pdf/12269742.pdf (accessed on 28 July 2018).
  51. PETROBANGLA. Annual Report 2016. Bangladesh Oil, Gas and Mineral Corporation. Available online: https://petrobangla.org.bd/ (accessed on 26 July 2020).
  52. Haider, M.T.; Ahmed, M. Energy Consumption and Urban Texture: A Case Study of Dhaka. The Daily Star. Available online: https://www.thedailystar.net/25th-anniversary-special-part-1/energy-consumption-and-urban-texture-case-study-dhaka-210286 (accessed on 3 August 2020).
  53. The World Bank. Sustainable Energy for All: Rapid Assessment and Gap Analysis. Available online: https://www.pacificclimatechange.net/ (accessed on 27 July 2020).
  54. Bangladesh Power Development Board. Annual Report 2016-17. Available online: www.bpdb.gov.bd (accessed on 28 July 2020).
  55. Enerdata. Global Energy and CO2 Emissions. Enerdata. Available online: https://www.enerdata.net/ (accessed on 30 May 2020).
  56. EIA. International Energy Outlook 2018. Available online: https://www.eia.gov/outlooks/ieo/ (accessed on 15 August 2020).
  57. Tiwari, P. Energy efficiency and building construction in India. Build. Environ. 2001, 10, 1127–1135. [Google Scholar]
  58. Berardi, U. A cross-country comparison of the building energy consumptions and their trends. Resour. Conserv. Recycl. 2017, 123, 230–241. [Google Scholar] [CrossRef]
  59. The Rockefeller Foundation. Expanding Opportunities for Re-Newable Energy-Based Mini Grids in Rural India. Available online: www.smartpowerindia.org/ (accessed on 23 July 2020).
  60. Behjat, H. International Energy Outlook 2016. Available online: https://www.eia.gov/outlooks/ieo/pdf/0484(2016).pdf (accessed on 23 July 2020).
  61. Yu, S.; Tan, Q.; Evans, M.; Kyle, P.; Vu, L.; Patel, P. Improving building energy efficiency in India: State-level analysis of building energy efficiency policies. Energy Policy 2017, 110, 331–341. [Google Scholar] [CrossRef]
  62. Shahbaz, M.; Chaudhary, A.; Ozturk, I. Does urbanization cause increasing energy demand in Pakistan? Empirical evidence from STIRPAT model. Energy 2017, 122, 83–93. [Google Scholar] [CrossRef] [Green Version]
  63. Hydrocarbon Development Institute of Pakistan. Pakistan Energy Yearbook 2012; Ministry of Petroleum and Natural Resources: Karachi, Pakistan, 2012.
  64. Energy Information Administration. Annual Energy Review. Available online: https://www.eia.gov/totalenergy/data/annual/ (accessed on 30 May 2020).
  65. NEPRA. State of Industry Report 2016. Available online: https://www.nepra.org.pk/industryreports.htm (accessed on 6 July 2020).
  66. Ahmed, S.B. Country Report of Pakistan. 2016. Available online: https://eneken.ieej.or.jp/en/ (accessed on 30 May 2020).
  67. Pakistan Bureau of Statistics. Year Book 2015–16. 2016. Available online: www.pbs.gov.pk/publications (accessed on 4 May 2020).
  68. Aized, T.; Mehmood, S.; Anwar, Z. Building energy consumption analysis, energy saving measurements and verification by applying HAP software. Pak. J. Eng. Appl. Sci 2017, 21, 1–10. [Google Scholar]
  69. Arshad, N.; Ali, U. An analysis of the effects of residential uninterpretable power supply systems on Pakistan’s power sector. Energy Sustain. Dev. 2017, 36, 16–21. [Google Scholar] [CrossRef]
  70. CIA. The World Factbook. Central Intelligence Agency. Available online: https://www.cia.gov/library/publications/the-world-factbook/geos/bg.html (accessed on 28 July 2020).
  71. Uddin, N. Assessing urban sustainability of slum settlements in Bangladesh: Evidence from Chittagong city. J. Urban Manag. 2018, 7, 32–42. [Google Scholar] [CrossRef]
  72. Debnath, K.; Mourshed, M.; Chew, S. Modelling and forecasting energy demand in rural households of Bangladesh. Energy Procedia 2015, 75, 2731–2737. [Google Scholar] [CrossRef] [Green Version]
  73. Government of Bangladesh. Energy Efficiency and Conservation Master Plan up to 2030. 2015. Available online: http://www.open_jicareport.jica.go.jp/pdf/12231247.pdf (accessed on 2 September 2020).
  74. Housing and Building Research Institute. Bangladesh National Building Code. 2015. Available online: http://www.pwd.gov.bd/document/library/BNBC_Part01.pdf (accessed on 3 September 2020).
  75. EIA. Buildings Energy Consumption in India is Expected to Increase Faster than in Other Regions. Energy Information Administration; 2017. Available online: https://www.eia.gov/todayinenergy/detail.php?id=33252 (accessed on 26 August 2020).
  76. Rayhana, R.; Khan, M.A.D.; Hassan, D. Electric and lighting energy audit: A case study of selective commercial buildings in Dhaka. In Proceedings of the 2015 IEEE International WIE Conference on Electrical and Computer Engineering (WIECON-ECE), Dhaka, Bangladesh, 19–20 December 2015. [Google Scholar]
  77. Ahmed, I.; Iqbal, I. Energy saving potential in buildings for Karachi climate using daylight. In Proceedings of the 2014 International Conference on Energy Systems and Policies (ICESP), Islamabad, Pakistan, 24–26 November 2014. [Google Scholar]
  78. Peterson, D. India Likely to Experience Continued Growth in Electricity Use for Air Conditioning. 2017. Available online: https://www.eia.gov/todayinenergy/detail.php?id=23512 (accessed on 10 August 2020).
  79. Ministry of Power. Growth of Electricity Sector in India from 1947–2017. Available online: www.cea.nic.in/ (accessed on 20 July 2020).
  80. Szakonyi, D.; Urpelainen, J. Electricity sector reform and generators as a source of backup power: The case of India. Energy Sustain. Dev. 2013, 17, 477–481. [Google Scholar] [CrossRef]
  81. Qureshi, F.; Akintug, B. Hydropower potential in Pakistan. In Proceedings of the 11th International Congress in Advances in Civil Engineering, Istanbul, Turkey, 21–25 October 2014. [Google Scholar]
  82. EBL Securities Ltd. Power Sector Review of Bangladesh. 2017. Available online: www.eblsecurities.com/ (accessed on 1 August 2020).
  83. Anam, K.; Bustam, H.A. Power crisis & its solution through renewable energy in Bangladesh. Bangladesh J. Sci. Ind. Res. 2010. [Google Scholar] [CrossRef] [Green Version]
  84. Jethani, J.K. National Wind-Solar Hybrid Policy. Wind Energy Division- Ministry of New and Renewable Energy Resources. 2018. Available online: https://mnre.gov.in/ (accessed on 19 July 2020).
  85. Deshmukh, R.; Wu, G.C.; Callaway, D.S.; Phadke, A. Geospatial and techno-economic analysis of wind and solar resources in India. Renew. Energy 2019, 134, 947–960. [Google Scholar] [CrossRef] [Green Version]
  86. Rathore, P.K.S.; Chauhan, D.S.; Singh, R.P. Decentralized solar rooftop photovoltaic in India: On the path of sustainable energy security. Renew. Energy 2019, 131, 297–307. [Google Scholar] [CrossRef]
  87. Ministry of New and Renewable Energy. Annual Report 2016–17; Government of India: New Delhi, India, 2017.
  88. Top 5 Largest Solar Power Plants in India. WalkThroughIndia 7 Species of Fauna in Western Ghats of India Comments. Available online: http://www.walkthroughindia.com/walkthroughs/top-5-largest-solar-power-plants-india/ (accessed on 23 February 2020).
  89. AEDB. Alternative Energy Development. Alternative Energy Development Board; 2018. Available online: http://www.aedb.org/ (accessed on 30 June 2020).
  90. Ayyaz, S.M. Solar Power Generation Project. Available online: http://www.na.gov.pk/uploads/1429522953_299.pdf (accessed on 7 July 2018).
  91. Mahmud, A.D.D. Prospects of solar energy in bangladesh. IOSR J. Electr. Electron. Eng. 2013, 4, 46–57. [Google Scholar] [CrossRef]
  92. 500 MW Solar Programme 2012–2016: An Initiative to Promote Renewable Energy Programme in Bangladesh|ESCAP Policy Documents Management. Available online: https://policy.asiapacificenergy.org/node/217 (accessed on 24 March 2020).
  93. Ahmed, S.; Mahmood, A.; Hasan, A.; Sidhu, G.A.S.; Butt, M.F.U. A comparative review of China, India and Pakistan renewable energy sectors and sharing opportunities. Renew. Sustain. Energy Rev. 2016, 57, 216–225. [Google Scholar] [CrossRef]
  94. Sheikh, M.A. Renewable energy resource potential in Pakistan. Renew. Sustain. Energy Rev. 2009, 13, 2696–2702. [Google Scholar] [CrossRef]
  95. Islam, M.R.; Islam, M.R.; Beg, M.R.A. Renewable energy resources and technologies practice in Bangladesh. Renew. Sustain. Energy Rev. 2008, 12, 299–343. [Google Scholar] [CrossRef]
  96. Saifullah, A.Z.A.; Karim, A.; Karim, R.; Khan, M.; Iqbal, M.; Mahboob, S. A wind map of Bangladesh. Renew. Energy 2004, 29, 643–660. [Google Scholar]
  97. Kumar, A.; Kumar, N.; Baredar, P.; Shukla, A. A review on biomass energy resources, potential, conversion and policy in India. Renew. Sustain. Energy Rev. 2015, 45, 530–539. [Google Scholar] [CrossRef]
  98. Naqvi, S.R.; Jamshaid, S.; Naqvi, M.; Farooq, W.; Niazi, M.B.K.; Aman, Z.; Zubair, M.; Ali, M.; Shahbaz, M.; Inayat, A. Potential of biomass for bioenergy in Pakistan based on present case and future perspectives. Renew. Sustain. Energy Rev. 2018, 81, 1247–1258. [Google Scholar] [CrossRef] [Green Version]
  99. Ali, M.F. Agri Dept Envisages Gains: Summary for 10,000 Biogas Plants. DAWNCOM 2013. Available online: https://www.dawn.com/news/1039966 (accessed on 10 March 2020).
  100. Hossain, M.; Hossain, S.; Uddin, M. Renewable energy: Prospects and trends in Bangladesh. Renew. Sustain. Energy Rev. 2017, 70, 44–49. [Google Scholar] [CrossRef]
  101. Halder, P.; Paul, N.; Joardder, M.; Sarker, M. Energy scarcity and potential of renewable energy in Bangladesh. Renew. Sustain. Energy Rev. 2015, 51, 1636–1649. [Google Scholar] [CrossRef]
  102. The World Bank. Regulatory Indicators for Sustainable Energy. RISE. 2018. Available online: http://rise.esmap.org/ (accessed on 14 August 2020).
  103. Hossain, S.M.; Rokonuzzaman, M.D.; Hossam, E.-M. Sustainability, prospect and challenges of renewable energy in Bangladesh. Int. J. Eng. Innov. Technol. 2015, 5, 64–69. [Google Scholar]
  104. Adam, C.; Mark, B. Economic Change in India. 2010. Available online: http://citeseerx.ist.psu.edu/viewdoc/download?doi=10.1.1.395.4924&rep=rep1&type=pdf (accessed on 8 July 2020).
  105. Jorgenson, D.W.; Fukao, K.; Timmer, M.P. The World Economy: Growth or Stagnation? Cambridge University Press: Cambridge, UK, 2016. [Google Scholar]
  106. World Data. Energy Consumption in Pakistan. 2015. Available online: https://www.worlddata.info/asia/pakistan/energy-consumption.php (accessed on 30 May 2020).
  107. Farooq, U.M.; Sabir, M.D.; Tahir, H.S.; Rasheed, K.M. Key factors affecting GDP in Pakistan over the period 1975–2011. J. Econ. Sustain. Dev. 2013, 4, 142–149. [Google Scholar]
  108. Kamran, Y. How 9/11 Changed Pakistan. The Express Tribune. 2017. Available online: https://tribune.com.pk/story/1503622/911-changed-pakistan/ (accessed on 4 September 2020).
  109. Government of Pakistan. Pakistan Economic Survey 2005–06. 2006. Available online: www.finance.gov.pk/survey/chapters/title.pdf (accessed on 30 May 2020).
  110. Syed, A.; Shaikh, F. Effects of macroeconomic variables on Gross Domestic Product (GDP) in Pakistan. Procedia Econ. Financ. 2013, 5, 703–711. [Google Scholar] [CrossRef] [Green Version]
  111. Osmi, A. Political Violence Affects the Bangladesh Economy. The Commonwealth Youth Program. 2013. Available online: http://www.yourcommonwealth.org/uncategorized/political-violence-affects-the-bangladesh-economy/ (accessed on 20 August 2020).
  112. The World Bank. Bangladesh Development Update: Building on Resilience. 2018. Available online: https://www.worldbank.org/en/news/feature/2018/04/09/bangladesh-development-update-building-on-resilience (accessed on 20 August 2020).
  113. Raihan, S.; Osmani, S.; Khalily, M. The macro impact of microfinance in Bangladesh: A CGE analysis. Econ. Model. 2017, 62, 1–15. [Google Scholar] [CrossRef]
  114. World Bank Group. Bangladesh, a Middle Income Country by 2021: What Will it Take in Terms of Poverty Reduction? 2018. Available online: https://openknowledge.worldbank.org/handle/10986/18668 (accessed on 17 September 2020).
  115. The World Bank. World Bank Open Data. 2018. Available online: https://data.worldbank.org/ (accessed on 8 July 2020).
  116. United Nations Development Program. Human Development Report 2016. Available online: http://www.hdr.undp.org/en/2016-report (accessed on 8 August 2020).
  117. Falebita, O.; Koul, S. From developing to sustainable economy: A comparative assessment of India and Nigeria. Environ. Dev. 2018, 25, 130–137. [Google Scholar] [CrossRef]
  118. Mallick, H. Examining the linkage between energy consumption and economic growth in India. J. Dev. Areas 2009, 43, 249–280. [Google Scholar] [CrossRef]
  119. Kelly, P. India’s Steel Industry, Like America’s, Is Dominated by Electric-Based Processes. EIA; 2017. Available online: https://www.eia.gov/todayinenergy/detail.php?id=34052 (accessed on 25 August 2020).
  120. Zaman, M.; Shaheen, F.; Haider, A.; Qamar, S. Examining relationship between electricity consumption and its major determinants in Pakistan. Int. J. Energy Econ. Policy 2015, 5, 998–1009. [Google Scholar]
  121. Dewan, T. Societal impacts and vulnerability to floods in Bangladesh and Nepal. Weather Clim. Extrem. 2015, 7, 36–42. [Google Scholar] [CrossRef] [Green Version]
  122. Mozumder, P.; Marathe, A. Causality relationship between electricity consumption and GDP in Bangladesh. Energy Policy 2007, 35, 395–402. [Google Scholar] [CrossRef]
  123. Chandel, S.; Sharma, A.; Marwaha, B. Review of energy efficiency initiatives and regulations for residential buildings in India. Renew. Sustain. Energy Rev. 2016, 54, 1443–1458. [Google Scholar] [CrossRef]
  124. Evans, M.; Roshchanka, V.; Graham, P. An international survey of building energy codes and their implementation. J. Clean. Prod. 2017, 158, 382–389. [Google Scholar] [CrossRef]
  125. Indian Standards Institution. National Building Code—1970, 1st ed.; Indian Standards Institution: New Delhi, Indian, 1974. [Google Scholar]
  126. Bureau of Indian Standards. National Building Code—1983, 1st ed.; Bureau of Indian Standards: New Delhi, Indian, 1983.
  127. Bureau of Indian Standards. SP7: National Building Code—2005. Available online: http://www.bis.org.in/sf/nbc.htm (accessed on 28 August 2020).
  128. Bureau of Energy Efficiency. Energy Conservation Building Code 2007. 2008. Available online: https://townplanning.gujarat.gov.in/ (accessed on 28 August 2020).
  129. Government of India. The Energy Conservation Amendment Act 2010. 2010. Available online: www.mercindia.org.in/ (accessed on 28 August 2020).
  130. Dhaka, S.; Mathur, J.; Garg, V. Combined effect of energy efficiency measures and thermal adaptation on air conditioned building in warm climatic conditions of India. Energy Build. 2012, 55, 351–360. [Google Scholar] [CrossRef]
  131. Tulsyan, A.; Dhaka, S.; Mathur, J.; Yadav, J. Potential of energy savings through implementation of energy conservation building code in Jaipur City, India. Energy Build. 2013, 58, 123–130. [Google Scholar] [CrossRef]
  132. Liu, F.; Mayor, A.S.; Hogan, J.F. Home|ESMAP. A Global Coalition to Tap Geothermal Energy in Developing Countries|ESMAP 2010. Available online: https://www.esmap.org/ (accessed on 11 February 2020).
  133. Ministry of Housing & Works. Pakistan Building Code. 1986. Available online: http://www.mohw.gov.pk/ (accessed on 26 August 2018).
  134. National Energy Conservation Centre. Building Energy Code of Pakistan. 1990. Available online: https://www.humanitarianlibrary.org/sites/default/files/2013/05/buildingecp.pdf (accessed on 20 August 2020).
  135. National Energy Conservation Centre. Building Code of Pakistan (Energy Provisions—2011). 2011. Available online: https://www.pec.org.pk/building_code_pakistan.aspxIslamabad (accessed on 26 August 2020).
  136. Ahmad, K.; Rafique, A.; Badshah, S. Energy efficient residential buildings in Pakistan. Energy Environ. 2014, 25, 991–1002. [Google Scholar] [CrossRef]
  137. Government of Pakistan. Building Sector. ENERCON; 2017. Available online: http://www.enercon.gov.pk/enercond912.html?mc_id=23 (accessed on 17 September 2020).
  138. UNDP. Improving Energy Efficiency through Building Materials, Pakistan. Available online: https://sgp.undp.org/images/SGP_Pakistan2.pdf (accessed on 12 September 2020).
  139. Mahar, W.A.; Anwar, N.U.R.; Attia, S. Building energy efficiency policies and practices in Pakistan: A literature review. In Proceedings of the 5th International Conference on Energy, Environment & Sustainable Development (EESD), Quetta, Pakistan, 14–16 November 2018. [Google Scholar]
  140. Mirza, U.K.; Ahmad, N.; Harijan, K.; Majeed, T. Identifying and addressing barriers to renewable energy development in Pakistan. Renew. Sustain. Energy Rev. 2009, 13, 927–931. [Google Scholar] [CrossRef]
  141. SREDA. Energy Efficiency and Conservation Crossing Project. 2018. Available online: http://www.sreda.gov.bd/index.php/site/page/36b6-1c7d-c76e-c9b5-0469-7cbb-3756-824e-7412-d72b (accessed on 28 August 2020).
  142. Hassan, T. Energy Footprint of Selective Commercial Buildings in Dhaka. 2015. Available online: http://hdl.handle.net/10361/4881 (accessed on 10 September 2020).
  143. Kamal, M.; Gani, M.O. A critical review on importance of eco-structure building or green building in Bangladesh. Int. J. Bus. Adm. 2016, 7, 166–180. [Google Scholar] [CrossRef] [Green Version]
  144. Zhang, Y.; Wang, J.; Hu, F.; Wang, Y. Comparison of evaluation standards for green building in China, Britain, United States. Renew. Sustain. Energy Rev. 2017, 68, 262–271. [Google Scholar] [CrossRef]
  145. Abouzakhar, F.S.; Blackburn, R.T. Cultural and social impacts on electrical energy use management. In Proceedings of the 1995 International Conference on Energy Management and Power Delivery EMPD ’95, Singapore, 21–23 November 1995. [Google Scholar]
  146. Shah, S.A.A.; Solangi, Y.A.; Ikram, M. Analysis of barriers to the adoption of cleaner energy technologies in Pakistan using modified delphi and fuzzy analytical hierarchy process. J. Clean. Prod. 2019, 235, 1037–1050. [Google Scholar] [CrossRef]
  147. IEA. Renewable Energy. 2018. Available online: https://www.iea.org/policiesandmeasures/renewableenergy/?country=India (accessed on 7 February 2020).
  148. Srikanth, R. India’s sustainable development goals—Glide path for India’s power sector. Energy Policy 2018, 123, 325–336. [Google Scholar] [CrossRef]
  149. Government of India. JNNSM. 2019. Available online: http://seci.co.in/ (accessed on 7 February 2020).
  150. EIA. Madhya Pradesh Wind Power Project Policy 2012. 2018. Available online: https://www.iea.org/policiesandmeasures/renewableenergy/?country=India (accessed on 11 February 2020).
  151. Kumar, N.; Pal, N. The existence of barriers and proposed recommendations for the development of renewable energy in Indian perspective. Environ. Dev. 2018, 22, 2187–2205. [Google Scholar] [CrossRef]
  152. Ministry of Science and Technology. Available online: http://www.pcret.gov.pk/index.html (accessed on 18 February 2020).
  153. Ministry of Energy. Alternative Energy Development Board. Available online: http://www.aedb.org/ (accessed on 18 February 2020).
  154. AEDB. RE Policy for Development of Power Generation 2006. 2006. Available online: http://www.aedb.org/ (accessed on 7 February 2020).
  155. Shirwani, R.; Gulzar, S.; Asim, M.; Umair, M.; Al-Rashid, M.A. Control of vehicular emission using innovative energy solutions comprising of hydrogen for transportation sector in Pakistan: A case study of Lahore City. Int. J. Hydrog. Energy 2020, 45, 16287–16297. [Google Scholar] [CrossRef]
  156. Zafar, U.; Rashid, T.U.; Khosa, A.A.; Khalil, M.S.; Rashid, M. An overview of implemented renewable energy policy of Pakistan. Renew. Sustain. Energy Rev. 2018, 82, 654–665. [Google Scholar] [CrossRef]
  157. Government of The People’s Republic of Bangladesh. Renewable Energy Policy of Bangladesh; Ministry of Power: Dhaka, Bangladesh, 2006.
  158. Rahman, S.; Azim, M. Sustainability and the environment: Prospect and challenges of renewable energy in Bangladesh. SSRN Electron. J. 2011. [Google Scholar] [CrossRef]
  159. Mondal, M.A.H.; Kamp, L.M.; Pachova, N.I. Drivers, barriers, and strategies for implementation of renewable energy technologies in rural areas in Bangladesh—An innovation system analysis. Energy Policy 2010, 38, 4626–4634. [Google Scholar] [CrossRef]
Figure 1. Percentage shortfall, HDI, and PCI in IPB over the years 2012–2017 [8,9].
Energies 13 05776 g001
Figure 2. HDI and ECPC of 29 countries located in different climatic regions of the world show the linear and steady-state relationship between ECPC and HDI for low/middle and high development regions, respectively [10].
Energies 13 05776 g002
Figure 3. Map of IPB showing various provinces, territories, zones, and divisions.
Energies 13 05776 g003
Figure 4. Energy mix of India shows coal has been the major contributor in energy mix over the past three decades [21].
Energies 13 05776 g004
Figure 5. Generation Share of Electricity state-wise [29].
Energies 13 05776 g005
Figure 6. Electricity Consumption Per Capita of India state-wise [28].
Energies 13 05776 g006
Figure 7. Energy Mix of Pakistan showing heavy dependence on natural gas and oil over the past four decades [32].
Energies 13 05776 g007
Figure 8. Provincial share of electricity generation and consumption of Pakistan [40,41].
Energies 13 05776 g008
Figure 9. ECPC of Pakistan province-wise [32].
Energies 13 05776 g009
Figure 10. Energy mix of Bangladesh shows the dependence entirely on fossil fuels (99.1%) [21].
Energies 13 05776 g010
Figure 11. Electricity and natural gas production share division-wise based on currently active gas production fields (excluding condensate gas data) [49,50].
Energies 13 05776 g011
Figure 12. Building energy consumption in India, showing a +2.7% increase per year [3].
Energies 13 05776 g012
Figure 13. Building electricity consumption in India shows an annual increase of +9% over the years 2010–2015 [3].
Energies 13 05776 g013
Figure 14. Buildings energy consumption in Pakistan, showing an annual average increase rate of +2.9% over the years 2006–2015 [3,32].
Energies 13 05776 g014
Figure 15. Building electricity consumption in Pakistan, showing increasing electricity consumption over the years [12].
Energies 13 05776 g015
Figure 16. Building energy consumption in Bangladesh rising linearly with a rate of +7.8% annually over the years 2006 to 2016 [3].
Energies 13 05776 g016
Figure 17. Building electricity consumption in Bangladesh shows an increase in residential and non-residential buildings over the years 2010–2015 [3].
Energies 13 05776 g017
Figure 18. Electricity shortfall in IPB, almost showing a similar trend in electricity generation and shortfall over the years. India being on the high scale of HDI is a closing gap between supply and demand and is expected to overcome the shortfall of electricity in the next few decades.
Energies 13 05776 g018
Figure 19. GDP of IPB shows exponentially trend in increase for each of IPB countries [104].
Energies 13 05776 g019
Figure 20. HDI Comparison of IPB shows a linear trend for each of IPB countries with Bangladesh having the highest rate in increase.
Energies 13 05776 g020
Figure 21. ECPC comparison of IPB shows Bangladesh and India making progress exponentially while the trend for Pakistan is linear.
Energies 13 05776 g021
Figure 22. ECPC of IPB vs. GDP shows a logarithmic relationship between ECPC and GDP of Bangladesh and Pakistan, while the relation for India has been observed linear.
Energies 13 05776 g022
Figure 23. ECPC vs. HDI showing a linear relationship for each of IPB countries.
Energies 13 05776 g023
Table 1. Comparison of Energy Overview of IPB.
ComparisonUnitsIndiaPakistanBangladeshTotal/
Average
Population (2017)Billions1.35
(78.7%)
0.208
(12.11%)
0.157
(11.62%)
1.7147
Areakm23,280,000 (77.6%)796,096
(18.84%)
147,570
(3.4%)
4,220,000
Total Primary Energy Consumption (2017) TWh8765.5
(86.9%)
940.8
(9.3%)
383.7
(3.8%)
10,090
Total Primary Consumption by Fuel (2017)Oil TWh339.5
(11.3%)
2583
(85.8%)
87.2
(2.9%)
3009.7
Natural Gas TWh407
(33.6%)
539.6
(44.8%)
266.3
(22%)
1212.9
Coal TWh82.5
(1.6%)
4931
(97.8%)
26.7
(0.5%)
5040.2
Nuclear TWh20.9
(17.5%)
98.8
(82.5%)
Nil119.7
Hydro TWh81.4
(18.5%)
357
(81%)
2.32
(0.5%)
440.72
RERs TWh9.3
(3.5%)
253.5
(96%)
1.16
(0.5%)
263.96
Total Electricity Generation (2017) TWh1497123.974.71695.6
ECPC (2017) kWh10765983302004
HDI (2017)N/A0.640.5620.6080.603
GDP (2017)Billion USD2597.4313.3249.73160.4
Energy Consumption in Buildings (2015) TWh2477
(79.2%)
482.2
(15.4%)
169.3
(5.4%)
3128.5
Electricity Consumption in Buildings (2015) TWh296
(83.3%)
47.96
(13.5%)
19.57
(5.5%)
355.46
Average Electricity Shortfall (2017) GW2.5
(26.8%)
3.71
(39.8%)
3.1
(33.2%)
9.31
CO2 Emissions (2017)Million Tonnes2344.2
(89.6%)
189.2
(7.2%)
82.8
(3.2%)
2616.2
Table 2. Comparison of RERs potential in IPB.
Renewable Energy ResourceIndiaPakistanBangladesh
1. Solar Energy
Solar Insolation4–7 kWh/m2/day5–7 kWh/m2/day4–5 kWh/m2/day
Daily sunshine hours6–9 hrs daily7–8 hrs daily7–10 hrs daily
Areas with highest solar insolationRajasthan, Jammu and Kashmir, Gujrat, and Madhya PradeshBaluchistan, Southern Punjab, and Northern SindhDhaka, Khulna, Northern Areas, and Chittagong regions
Solar energy potential5000 PWh per year (Current is 25 GW) [84]25.4 PWh per year (Current production is 4.4 GWh) [101]282 PWh (Current capacity is 172 MW) [44,90]
Major solar projectsPavagada Solar Park, Kurnool Ultra Mega Solar Park, Bhadla Solar Park, Charanka Solar Park, GujaratQuaid-e-Azam Solar Energy Park, Rural electrification programAshuganj 100 MW Grid Tied Solar Park, Gangachara 55 MW Solar Park, 200 MW (AC) Solar Park by SunEdison Energy Holding (Singapore) Pvt Ltd.
2. Wind Energy
Average wind speed7–10 m/s5–7.5 m/s2.96–5 m/s
Areas with higher wind speedKarnataka, Andhra Pradesh, Tamil Nadu, GujaratSouthern Sindh, North western locations of Baluchistan, Central areas of KPKSt. Martins Island, Cox’s Bazar, Patenga, Bhola, Barguna, Dinajpur, Thakurgaon, Panchagar
Wind energy potential102 GW (Current production is 32.8 GW) [91]50 GW (Current production is 1.2 GW) [91]20 GW (Current production is 0.9 MW) [94]
Major wind projectsMuppandal Windfarm Kanyakumari, Jaisalmer Wind Park, Brahmanvel Wind Farm DhuleThree Gorges Pakistan wind farms, UEP Wind Farm, Sachal Wind FarmFeni Wind Power Plant, 1 MW Capacity Wind Battery Hybrid Power Plant (off-grid)
3. Biomass Energy
Total Biomass production500 million metric tons per year19.125 million m3 per day182.22 million tons per year
Biomass energy potential1.16 PWh (13% of the total energy consumption) [91]201 TWh from biogas (21% of the total energy consumption) [9,97]373.1 TWh (97% of the total energy consumption) [99]
Major Biomass projectsBannari Amman Sugars Ltd., Sugarfed, Bermaco Energy Systems Ltd. Bihar,M/s Chiniot Power Ltd., M/s Etihad Power Generation Limited., M/s JDW Sugar Mills Ltd. (Multiple units)SEAL Biomass-based Electricity Project, Phenix Agro Ltd. at Member Bari, Gazipur, Municipal Solid Waste under Pilot Project at Keraniganj on Turnkey Basis
Table 3. BEECs of IPB.
CodesYear IssuedIssuing AuthorityApplicable toDesigned forStatus% Savings ObservedPotential of Energy SavingChallenges in Implementation
India
National Building Code (NBC) [125]1970Indian Standards InstitutionCommercial buildings (new and existing)—to 100 kW connected load and 120 kVA contract demand or greater [126]Studying climatic factors of the site, reducing power consumption by making use of daylight, using fluorescent lamps, and planting trees. Not Mandatory1. 40% reduction in energy consumption [127]17–48%Low awareness level, reluctance of public in changing their conventional ways of energy consumption, and lack of incentives by the government in this regard [128].
NBC Revised [129]1983Bureau of Indian Standards2. 17–42% reduction in 6 different buildings types
NBC Revised [130]2005Bureau of Indian Standards3. Proposed 48% energy savings between now and 2050 and residential buildings predicted additional saving of 25% from 2010 to 2050 [131]
Energy Conservation Building Code (ECBC) [132]2007GOIThe building envelope, HVAC, service water heating, lighting, and electric power and motors
ECBC Revised2016GOIMandatory for RE future provisions
Other-Rating Programs
BEE Star Rating --Commercial sector-----
LEED Residential to commercial office buildings.
GRIHAHigh rise buildings
Pakistan
Pakistan Building Code (PBC-1986) [133]. 1986GOPlarge public buildings with a conditioned area of 900 square meters, unconditioned buildings of the covered area of 1200 square meter or more Building envelopes, mechanical systems, and equipment including HVAC, service water heating, lighting, and electric power and motors. Not Mandatory1. 38.5% decrease-Residential building [134]30–70%Lack of awareness among the public [135], lack of support from management and leadership, and lack of enough incentives and major initial cost [136].
Building Energy Code of Pakistan (BECP-1990) [137] 1990GOP2.30% savings [138]
Building Code of Pakistan-Energy Provision-2011 (BCP-EP-2011) [139]2011NEECA and PEC3. Reduction in energy use up to 70% [140].
Bangladesh
BNBC [72] 1993GOB(New and Existing Buildings) Thermal insulation and ventilation of the building envelope, EE&C of building equipment (such as HVAC, fans, lighting, escalators and lifts), water management and efficiency.Not Mandatory1. 20% energy saving [71,141]8–45%Lack of green buildings education to public, skill development, environmental management, hazards, research information, lack of institutional incentives, and reluctance of public to change [142].
2. 8 to 45% energy reduction in three buildings [143]
BNBC [revised] 20153. 29.6% reduction in electricity demand can be obtained if a 20% improvement in energy efficiency is achieved by 2030 [45].
Publisher’s Note: MDPI stays neutral with regard to jurisdictional claims in published maps and institutional affiliations.

