Digital Marketing Attribution: Understanding the User Path


1
Department of Telematics Engineering, Universidad Carlos III de Madrid, 28911 Leganés, Spain
2
Department of Advanced Analytics Neo Media World, 28003 Madrid, Spain
3
UC3M-Santander Big Data Institute, 28903 Getafe, Spain
*
Author to whom correspondence should be addressed.
Electronics 2020, 9(11), 1822; https://doi.org/10.3390/electronics9111822
Submission received: 6 October 2020
/
Revised: 22 October 2020
/
Accepted: 29 October 2020
/
Published: 2 November 2020
(This article belongs to the Section Computer Science & Engineering)
Abstract
:Digital marketing is a profitable business generating annual revenue over USD 200B and an inter-annual growth over 20%. The definition of efficient marketing investment strategies across different types of channels and campaigns is a key task in digital marketing. Attribution models are an instrument used to assess the return of investment of different channels and campaigns so that they can assist in the decision-making process. A new generation of more powerful data-driven attribution models has irrupted in the market in the last years. Unfortunately, its adoption is slower than expected. One of the main reasons is that the industry lacks a proper understanding of these models and how to configure them. To solve this issue, in this paper, we present an empirical study to better understand the key properties of user-paths and their impact on attribution models. Our analysis is based on a large-scale dataset including more than 95M user-paths from real advertising campaigns of an international hoteling group. The main contribution of the paper is a set of recommendation to build accurate, interpretable and computationally efficient attribution models such as: (i) the use of linear regression, an interpretable machine learning algorithm, to build accurate attribution models; (ii) user-paths including around 12 events are enough to produce accurate models; (iii) the recency of events considered in the user-paths is important for the accuracy of the model.
1. Introduction
The ability of digital marketing to offer personalized advertisements to customers had made it one of the main marketing channels used by advertisers and a very profitable business. The Internet Advertising Bureau reported this business generated a revenue of USD 107.5B solely in the US in 2018, with an interannual growth of 21.8%.
In such a prominent business, it is important to define correct strategies to decide which of the available channels (search, social, programmatic, etc.) should be used and how to distribute the investment across these channels. One way, and arguably the most efficient, to define such strategies are the so-called attribution models. An attribution model is a set of rules defined to attribute the success of a conversion (e.g., a purchase in the advertiser’s website) across the different marketing events, i.e., ads, shown to the user prior to the conversion. These events are referred to as touchpoints, and the whole set of them is referred to as user path.
Digital marketing stakeholders understood the importance of attribution models. However, the lack of enough computation capacity made them adopt simple attribution models that we refer to as first-generation models. These models use simple fixed rules based on the position of the touchpoint in the user path. For instance, the most widely used model, referred to as last event, attributes the full value of the conversion to the last touchpoint in the user path. It is needless to say that these simplistic models are inaccurate and may lead to taking wrong decisions regarding the impact of different channels in conversions. The increase in the computation capacity and the implementation of scalable algorithms allowed in the last years the development of the second generation of attribution models that we refer to as data-driven models. These models leverage the information in the user-path in order to infer the impact of each touchpoint in the conversion. These models offer several advantages. For instance, they offer higher accuracy and are custom to each dataset. Although, it is well accepted the superiority of data-driven models over first generation models, the use of the former is still not generalized in the digital marketing industry.
Despite the arguable relevance that data-driven models have for digital marketing, the academic community has neither paid significant attention to them, this has probably been the motivation for the slow adoption of these models by the industry. The most commonly used data-driven model so far is the Shapley value [1]. Some works have analyzed the effect of external factors on this specific model [2]. Others have studied the effect of different attributions on budget allocation [3]. The research community has proposed alternative data-driven models to Shapley value. These works propose the utilization of neural networks [4], Markov chains [5,6], survival analysis [7,8], regressions [9] or econometric models [10]. Finally, some works have analyzed the impact of specific channels, in particular, display ads, in the global attribution [11,12]. These works try to address a controversy in online advertising concerning the actual value that display advertising adds to digital marketing.
Researchers and practitioners have mainly focused on the definition of data-driven models evaluating the use of different types of algorithms and techniques (Shapley value, neural networks, Markov chains, etc.). The selection of the specific algorithm to use is important. However, it is equally important to understand the influence that key characteristics of the user-path have in the accuracy of data-driven attribution models. Despite the relevance of understanding this, to the best of the authors’ knowledge, there is any previous work by the industry or the academia addressing this issue. To fill this gap, and enhance our knowledge of data-driven attribution models, in this paper, we analyze four key features of the user path and their impact in the accuracy of data-driven attribution models. The considered features are:
- The user path length: whether the number of touchpoints forming the user path impact the accuracy of the model.
- The recency of information: whether the position of the considered touchpoints in the user path (closer vs. further to the conversion) influence the accuracy of the model.
- The granularity: whether the accuracy of the model is affected by the granularity of the touchpoints. We consider touchpoints mapped into two levels, channels and campaigns. The latter offers higher granularity than the former.
- The aggregation level: whether registering the number of appearances of a given type of touchpoint (e.g., type of channel) in the user path leads to more accurate models than considering just the binary presence of the type of touchpoint.
To analyze the impact and importance of these features and guarantee the generality of the obtained results we have conducted a large-scale empirical analysis using a real-world dataset, from a big international hoteling group, including 95 million user-paths collected across tens of advertising campaign four machine learning algorithms. Moreover, we have used four different machine learning algorithms (linear regression, naive Bayes, random forest and support vector machine) to assess the validity of our results across algorithms.
The main findings obtained from our analysis are the following ones:
- Linear regression is the algorithm leading to more accurate attribution models. This is a relevant finding since linear regression produces easily interpretable models, which ease the decision-making process.
- The touchpoints closest to conversion are those with the highest impact in the accuracy of the model and thus are the most important to be considered when building data-driven attribution models.
- At least 12 touchpoints are needed to achieve a high accuracy level in data-driven attribution models.
- Attribution models at campaign level offer higher accuracy than those at channel level. Moreover, since campaign level presents a much richer tagging than channel level, more sophisticated decision can be taken.
- Recording the presence of each type of touchpoint offers more accurate models than collecting the number of appearances of each type of touchpoint.
It is worth noting that the results are derived from the analysis of our dataset, and we cannot state that the obtained results are generalizable. However, due to the size of the dataset we are confident that we would obtain similar results in other datasets.
The rest of the paper is organized as follows: Section 2 presents the background. Section 3 details the dataset to be used in the rest of the paper. Section 4 describes the methodology to analyze the key user-path characteristics. Section 5 presents the obtained results while Section 6 discusses the advantages of data-driven models as well as the best practice to build attribution models. Finally, we conclude the paper in Section 7.
2. Background
The marketing strategy of a company is at high level defined by its media investment plan, which specifies the investment made by the company in different marketing channels. Due to the importance of such a plan, companies seek manners to take informed decisions in this matter. One way of doing so is defining the media investment plan based on the attribution that each marketing channel had to the different KPIs of a company, for instance, sales.
Before digital marketing entered the scene, econometric models were used to work and define attribution. At that time, this approach was the best way to work with the available data as it uses both aggregated media buying data and aggregated purchases. However, the rapid development of the Web (first) and the mobile ecosystem (afterwards) equipped with technologies enabling the tracking of users interactions (e.g., cookies) opened new avenues to measure attribution since it was possible to track individual users interactions with the different marketing channels and campaigns. This enabled us to (theoretically) know precisely the complete path users follow until converting (e.g., make a purchase) and thus the first digital attribution models, as we know them today, began to appear.
2.1. Attribution Models
An attribution model in the digital marketing ecosystem is defined as a set of rules used to assign values to the different touchpoints (e.g., channels, campaigns, etc.) a user has interacted with before performing the desired action, also known as conversion (for example: make a purchase, complete a form, etc.). Note that the set of interactions of a user with the different touchpoints is referred to as the user’s path.
2.1.1. First Generation (Widely Adopted) Attribution Models
Based on the aforementioned online tracking technologies, the first generation of online attribution models appeared. This first generation is formed by a group of very simple models which either assigns the full attribution to a single touchpoint or use simple heuristics to distribute the attribution across touchpoints in the path (e.g., homogeneous distribution).
The most commonly used model in the industry nowadays belongs to this first generation attribution model and is referred to as last interaction. In this model, as the name implies, the entire merit of the conversion is attributed exclusively to the last touchpoint. In the digital market we find different variants of this model:
- Last Click: The conversion is attributed exclusively to the last click. This is the model that Google Search Ads 360 uses.
- Last Non-Direct Click: The conversion is attributed exclusively to the last click that is not part of the direct channel (the direct channel refers to the case when the user reaches the website by directly typing the URL in her browser). This is the model that Google Analytics uses.
- Floodlight: The conversion is attributed to the last click in the path. If there is no click, then it is attributed to the last impression in the path. This is the model that Google Campaign Manager uses.
Alternative methods have been used. For instance, the first interaction model and its different variants (e.g., first click) attribute the conversion exclusively to the first touchpoint (e.g., click) of the user’s path. More sophisticated methods try to attribute the conversion to multiple touchpoints based on different heuristics. The most representative examples of these models are:
- Linear: This model evenly distributes the attribution homogeneously among all the touchpoints in the user path.
- Position Based: In this model, 40% of the conversion is attributed to the first and last touchpoint, respectively. The remaining 20% is evenly distributed among the between touchpoints.
- Time Decay: This model assigns to each touchpoint a value proportional to its position in the path such that the closest touchpoints to the conversion receive more value. The advertiser defines the proportionality of the points.
Figure 1 shows examples of the discussed first-generation models. While these first-generation attribution models are the most extensively used in the digital marketing ecosystem, there is a common agreement by the involved stakeholders that they fall short in meeting their goal of properly attributing a conversion across the different touchpoints of a user path. For instance, considering that all the merit of a conversion goes to just a single touchpoint is unrealistic (See Section 5.2.1).
2.1.2. Data-Driven Attribution Models
A new generation of data-driven models has been proposed to solve the limitations of this first generation of attribution models. These are models based on mathematical and statistical foundations, which use as input data from previous advertising campaigns in order to identify an accurate distribution of the attribution across the different touchpoints present in those campaigns. In particular, data-driven models offer three main advantages over first-generation models:
- A data-driven attribution methodology creates a model based on the input data. Hence, there is a specific attribution model for each set of input data used. In other words, data-driven models offer personalized models for each advertiser and even more for each of the advertising campaigns it activates. Furthermore, with data-driven models, the model will be evolving in time adjusting the data as it comes.
- The most commonly used attribution models are the different variants of the last iteration model. This model uses a single touchpoint per path, discarding any other information available in the converting path. Data-driven models, as well as the most sophisticated first-generation models (e.g., linear model) use the full information available in paths.
- First generation models use exclusively the converting paths (i.e., paths leading to a conversion). Considering that the conversion rate is typically below 1%, first-generation models are discarding more than 99% of the available information. Instead, data-driven models use data in both converting and non-converting paths. The importance of using both converting and non-converting paths can be illustrated by a simple example: Let us assume that we have a dataset with 1000 paths—5 converting and 995 non-converting paths. Out of the five converting paths three of them includes as last interaction a click on a specific advertisement A. However, a click on A appears also as the last interaction in the 995 non-converting paths. A model considering just converting paths would wrongly assign a high value to ad A since it appears in most converting paths. However, if a model considers both converting and non-converting paths, it would conclude that the presence of a click on A as last interaction would most likely lead to a non-converting path and thus would assign it a very low value.
The most commonly adopted data-driven model by the industry so far is the one based on the Shapley value. This is a game-theory model that allows splitting value into a coalition. The Shapley value has two main disadvantages compared to other data-driven models. First, it is not possible to quantify the predictive power for the model, and thus the performance of such model cannot be assessed. Second, computing the Shapley value is a P-hard problem [2] so that the number of operations for solving it requires an exponential number of operations based on the number of players. In our case, the number of players maps to the number of channels or campaigns, so that this restrings a lot the number of campaigns that we can compute attribution for. The research community has also discussed other alternatives using Markov Chain [5] or recurrent neural networks [4]. However, these approaches have a significant limitation in the interpretability of the obtained results, making them invalid to support the decision-making process that is the ultimate purpose of attribution models.
It is important to highlight that data-driven models are not a one-fits-all solution and come with their own challenges and limitations. For instance, as mentioned above, to be actionable data-driven models should be interpretable in order to translate its results into decisions. On the other hand, it is unknown the data these models should use as input in order to be efficient. For instance, some real implementations of these models have opted to use just the last four events present in the user path as input to the models, which as we will show later is insufficient. In this paper, we will present, to the best of our knowledge, the most thorough analysis conducted so far on the functionality and relevance of user paths characteristics and input data in data-driven attribution models for digital marketing.
2.2. Attribution Model Granularity (Campaign vs. Channel Level)
As indicated above, one of the main goals for attribution models is helping to build an informed online marketing strategy. Marketing strategies are built on top of two main elements: channels and campaigns. They represent two levels of granularity, as graphically represented in Figure 2, since a campaign is typically defined within a specific channel. Next, we describe each of these elements in more detail.
- -
- Channels: define the different online means an advertiser/agency can use to show their ads. The most common channels used in digital marketing are the following ones:
- Affiliation: It refers to the content bought through an affiliation program.
- Paid Search: It refers to the promoted content shown in search engines.
- Display Programmatic: It refers to the content bought through a demand site platform (DSP)
- Display Premium: It refers to the content bought through direct deals with publishers.
- Paid Social: It refers to the promoted content shown in social networks.
- Direct: It refers to users’ accesses the advertiser’s webpage by directly writing the URL in the browser.
- Email: It refers to the content sent to users’ email.
- Organic: It refers to users visits to the advertiser’s webpage coming from a search engine not promoted content.
- Metasearch: It refers to users visits to the advertiser’s webpage coming from a metasearch engine.
Most existing attribution models operate at the channel level because they are easily interpretable and actionable. They allow advertisers to take high-level decisions on how to split the budget across different available channels to optimize different KPIs (return on investment (ROI), conversion ratio, click through ration (CTR), etc.). However, these models discard (in principle) useful data available at the campaign level, that we discuss next.
- -
- Campaigns: Campaigns sit in the next granularity level after channels in the marketing strategy plan of an advertiser/agency. Campaigns respond to different configurations depending on the associated channel. For instance, search campaigns are further divided into ad groups, whereas display and social campaigns are divided into placements and adsets, respectively. Campaigns configuration offers valuable information for attribution purposes, including:
- Advertiser;
- Business Unit;
- Channel;
- Strategy (Prospecting, Retargeting, Shopping, DSA, Broad, Phase, Exact);
- Program (Marketing Campaign) (Type of content);
- Language;
- Target Country;
- etc.
From a business perspective, the campaign level is the one at which activation occurs. Indeed, the budget is usually allocated at this level. Despite this, surprisingly, attribution models at campaign level are uncommonly used.
In this paper, we analyze attribution models at both channel and campaign levels. This allows us to compare the performance of models when applied at different granularity level and thus take an informed conclusion about the correctness of the trend in the industry of just using channel level attribution models.
2.3. The Key Element for Attribution Models: The User Path
The user path (or user journey) is defined as the sequence of touchpoints a user has interacted with. The user path is divided into two: the out-site path corresponds to the user actions (i.e., touchpoints) outside the advertiser website; the in-site path corresponds to the actions of the user within the advertiser website. While there can be attribution models considering both subpaths, in general, attribution models consider the out-site path exclusively because it is where the advertising strategy occurs. In this paper, we consider the out-site path also.
The out-site paths are divided into two groups:converted paths are those leading to a conversion (e.g., a purchase), whereas non-converted paths are those not leading to a conversion. Moreover, the touchpoints forming an out-site path can be of two types: impressions or clicks. Impressions refer to ads shown to the user, whereas clicks refer to those ads the user clicks bringing her to the advertiser’s webpage. Hence, clicks are considered a more meaningful interaction with the ad. Finally, each touchpoint has different associated tags. In channel level attribution models each touchpoint is tagged with the channel to which it belongs. Instead, in campaign level attribution models, a touchpoint is classified with a set of parameters presented above (campaign, strategy, language, target country, etc.).
One of the main problems of the attribution models is the incompleteness of the out-side path. Advertisers and agencies rely on a myriad of different platforms to register touchpoints. Unfortunately, different platforms register different touchpoints and usually, they do not share information between them. For instance, Google Campaign Manager, a platform owned by Google, records the clicks but does not collect impressions occurring on Facebook. Therefore, it is important to be aware of this limitation of attribution models.
3. Dataset
In this section, we first describe the data source considered in the paper, as well as its limitations. Afterwards, we provided details of the specific dataset to be used in this paper.
3.1. Data Description
The data used in this paper correspond to the data collected through the Google Campaign Manager (formerly known as DoubleClick Campaign Manager or DCM) platform for all advertising campaigns run by a marketing agency on behalf of a multinational company from the tourism sector.
Google Campaign Manager is the most extensively used platform by marketing agencies. It tracks and measures all paid advertising channels (with few exceptions, for instance, impressions on Facebook) and records the conversion events using floodlights [13]. The collected information is made available through the data transfer logs [14]. This structure provides every recorded interaction in a single line so that each line identifies the user that interacted with the touchpoint as well as all the tags associated to the touchpoint including a timestamp and the campaign ID. Specifically, the data transfer logs are organized into three independent tables [15] each including information for a different type of interaction:
- Activity table: This table includes the conversions recorded by the platform. Each line contains the information associated with a transaction. It offers information about the different type of conversions. We are only interested in transactions.
- Clicks table: This table includes the clicks recorded by the platform. Each row includes the metadata information associated with a click (campaign ID, user ID, time, country, etc.)
- Impressions table: This table presents in each row the information associated with a served impression including all its metadata (campaign, user ID, time, country, etc.).
Combining the information available in these three tables we can reconstruct the paths for all users who have been targeted by a campaign. The user (or cookie-ID)—an anonymized unique identifier [16]—serves as a unique key to merge the information in the three tables and build the associated user path. In particular, we use the DoubleClick tracking ID, which is an anonymized ID. This tracking ID does not expose either the user’s browser cookie or mobile device ID and complied with the data protection legislation in effect at the time of the data collection. The different touchpoints (i.e., impression and clicks) as well as conversion (if it occurs) can be sequenced using the timestamp of each of them. The DoubleClick tracking ID may be zeroed for different reasons, e.g., problem in the tracking process, privacy reasons, etc. [17]. If this happens, it is impossible to know which user has generated that event and therefore, such touchpoint cannot be incorporated to any user path creating a gap. As a result, all the rows in the transfer logs with zeroed user-ID will be removed for our analysis.
Finally, it is worth noticing that due to the last approved EU legislation in data protection, the GDPR, Google zeroed the user-ID of every record in the transfer logs since September 2018 [18]. Hence, all the data used in this study is dated before September 2018. The fact that Google Campaign Manager is anymore a valid source to implement attribution models does not invalidate the results in our study since other similar platforms allow us to obtain similar data as the one we use. In particular, Google will soon provide a new tool called Ads Data Hub [12] that will allow access to this data privately. Furthermore, nowadays, the log information provided by Data Management Platforms (DMP) is of similar nature to the one we use in our analysis.
3.2. Final Dataset
We have cleaned up the transfer log files, removed the rows with zeroed ID. This process let us with a total of 95,394,428 user paths, that overall include 344,366,428 touchpoints, not counting conversions.
Each of these paths is labelled as a converted or non-converted. We have only 36,857 converted- paths, this represents of all user-paths. To develop robust data-driven models it is important to build a balanced dataset with an equivalent number of converted and non-converted paths in order to avoid biased models that predict with high probability non-converted paths. To this end, we construct 15 different datasets; each of them includes the set of converted paths and a set of equal size of not converted-paths selected randomly.
3.3. Data Availability
Our study is based on third party data from Neo Media World (https://neomediaworld.com/) which has its regulations for data sharing. Requests to access the datasets may be sent to: [email protected]. Data had been gathered using Google Campaign Manager; therefore similar data can be gathered using this tool.
4. Methodology
The goal of this paper is to analyze the functionality and relevance of key user paths characteristics in data-driven attribution models for digital marketing. Towards this end, we have to (1) define such key characteristics, (2) define the list of algorithms to construct data-driven models to evaluate those characteristics and (3) define the performance evaluation methodology.
4.1. User Path Key Characteristics
We consider four user path characteristics in our analysis: path length, recency of information, granularity and frequency. We will describe each one of them in detail. Moreover, we will indicate the set of values we will consider for each of them in our conducted experiments.
- -
- Path Length: This is the number of touchpoints that we consider in each of the user paths to generate our attribution model. For instance, a path length of 5 indicates that we will use user paths including 5 touchpoints. The path length values used for the analyses conducted in this paper are: 1, 4, 8, 12, 16, 20, 24, 28, 32, 36, 40, 44, 48, 52, 56, 60.
This variable allows us to understand the impact of the number of considered touchpoints in the performance of data-driven attribution models. Note that cost of processing user paths increases (in the best case) linearly with the number of touchpoints considered.
- -
- Recency of information: This determines which touchpoints from the user path we use as input to our algorithm to construct an attribution model. In particular, we consider three cases:
- First Events: We select the first (i.e., least recent) N touchpoints from the user-path, where N is equal to the Path Length characteristic defined above.
- Last Events: We select the last (i.e., most recent) N touchpoints from the user-path.
- Random Events: We select N touchpoints at random from the user-path.
The analysis of this characteristic will reveals in which part of the user path we find more useful information.
- -
- Granularity: This characteristic indicates the granularity level of the attribution model. As explained in Section 2.2 we consider two relevant levels for digital marketing stakeholders: channel vs. campaign levels. Our analysis will allow us to compare the performance of attribution models at these two levels and thus discuss whether the industry trend of using just the channel level is correct.
- -
- Aggregation: This characteristic defines the aggregation level considered in the model for each type of touchpoint. We consider two scenarios:
- Aggregated: In this case, the aggregation variable is binary. It only indicates if the type of touchpoint is present in the user-path (1) or it is not present (0).
- Disaggregated: In this case, the aggregation variable is an integer that indicates the number of times a type of touchpoint is present in the user-path.
To clarify the concept of the aggregation characteristic let us consider a toy example for a channel level granularity. In this case, each touchpoint is defined by its associated channel. In our example the user-path is formed by 10 touchpoints divided in channels as follows: 3, paid search; 4, affiliation; 4, display programmatic; 0, display premium; 0, email; 0, paid social. If we consider the aggregated option the value of the aggregation characteristic for the channels would be: [1, 1, 1, 0, 0, 0] for [paid search, affiliation, display programmatic, display premium, email, paid social]. Instead if we consider the disaggregated we would have the following values of aggregation for each channel: [3, 4, 4, 0, 0, 0] for [paid search, affiliation, display programmatic, display premium, email, paid social].
In the paper we will consider all possible combinations of values for each of the considered characteristics: path length (16 cases), recency (3 cases), granulatity (2 cases) and aggregation (2 cases). This represents a total of 192 combinations of key characteristics. Each of these combinations serve as configuration set-up to construct attribution models with four different algorithms (See Section 4.2) for each of the 15 considered datasets (See Section 3.2). As a result, we build 11,520 attribution models which provide the required statistical robustness and significance to the obtained results regarding the relevance of the analyzed user path characteristics in the performance of attribution models.
4.2. Considered Data-Driven Algorithms
We consider four algorithms to construct the more than 11k data-driven attribution models used in our analysis. We acknowledge that other alternative algorithms may have been considered. However we have limited the study to these four for the following reasons: (1) other alternatives such as neural networks have been discarded due to their associated interpretability limitations; (2) the considered algorithms, contrary to the Shapley value, should allow to evaluate the predictability performance; (3) the results indicate that the predictability power of the considered algorithms is reasonably high so that the derived attribution models present a good performance. Since the primary goal of the paper is studying the relevance of user path characteristics and not finding the best performing algorithm, the considered algorithms fulfil their purpose.
The considered algorithms are:
- Linear Regression: it is a linear approach to modelling the relationship between a scalar response (or dependent variable) and one or more explanatory variables (or independent variables).
- Naive Bayes: they are a family of simple “probabilistic classifiers” based on applying Bayes’ theorem with strong (naive) independence assumptions between the features.
- Random Forest: it is an ensemble learning method for classification, regression and other tasks that operates by constructing a multitude of decision trees at training time and outputting the class that is the mode of the classes (classification) or mean prediction (regression) of the individual trees.
- Support Vector Machine (SVM): it is a representation of the examples as points in space, mapped so that the examples of the separate categories are divided by a clear gap that is as wide as possible. New examples are then mapped into that same space and predicted to belong to a category based on which side of the gap they fall.
All these algorithms produce predictive models that will allow us to compare their performance in different considered scenarios and thus evaluate the impact of each of the considered user path characteristics.
4.3. Performance Evaluation Methodology
As indicated in Section 4.1 we are considering in total 11,520 scenarios. Each of them considers a dataset formed by a group of user-paths balanced between those that lead to a conversion and those that do not. For each dataset, we apply a traditional training-testing validation process [19] extensively used to evaluate the performance of machine learning algorithms. In particular, our dataset is divided into a training and a validation subset including 80% and 20% of the data samples (note that we have tried with different percentages of samples in the training and testing sets obtaining a similar result to those presented in the paper), respectively. The attribution model is trained with the training subset, and the performance is assessed using the validation dataset. To evaluate the performance of the different models we rely mainly on an accuracy metric (ACC) [20]. However, we also use other alternative metrics such as area under the curve (AUC).
Using this methodology we have obtained the accuracy performance for the attribution model associated to each one of the 11,520 considered scenarios, which allows us to conduct a thorough analysis of the impact of the considered key user-path characteristics in data-driven attribution models. The obtained results are presented and discussed in the next section.
5. Results
In this section, we present the obtained results. First, we compare the performance of the data-driven attribution models obtained with the different algorithms. Afterwards, we will carefully analyze the different user-path characteristics deriving conclusions for the appropriate efficient design of data-driven attribution models.
5.1. Algorithms’ Performance
Figure 3 presents the Accuracy (ACC) for the more than 11k executed models in an organized manner. Each plot includes the ACC for a combination of the following user-path characteristics: Recency (Last, Random or First touchpoints), Granularity (Campaign or Channel) and Aggregation (Aggregated or Disaggregated). Moreover, each of the plots includes the result for the 15 considered datasets, the 16 considered user-path lengths and the 4 considered algorithms.
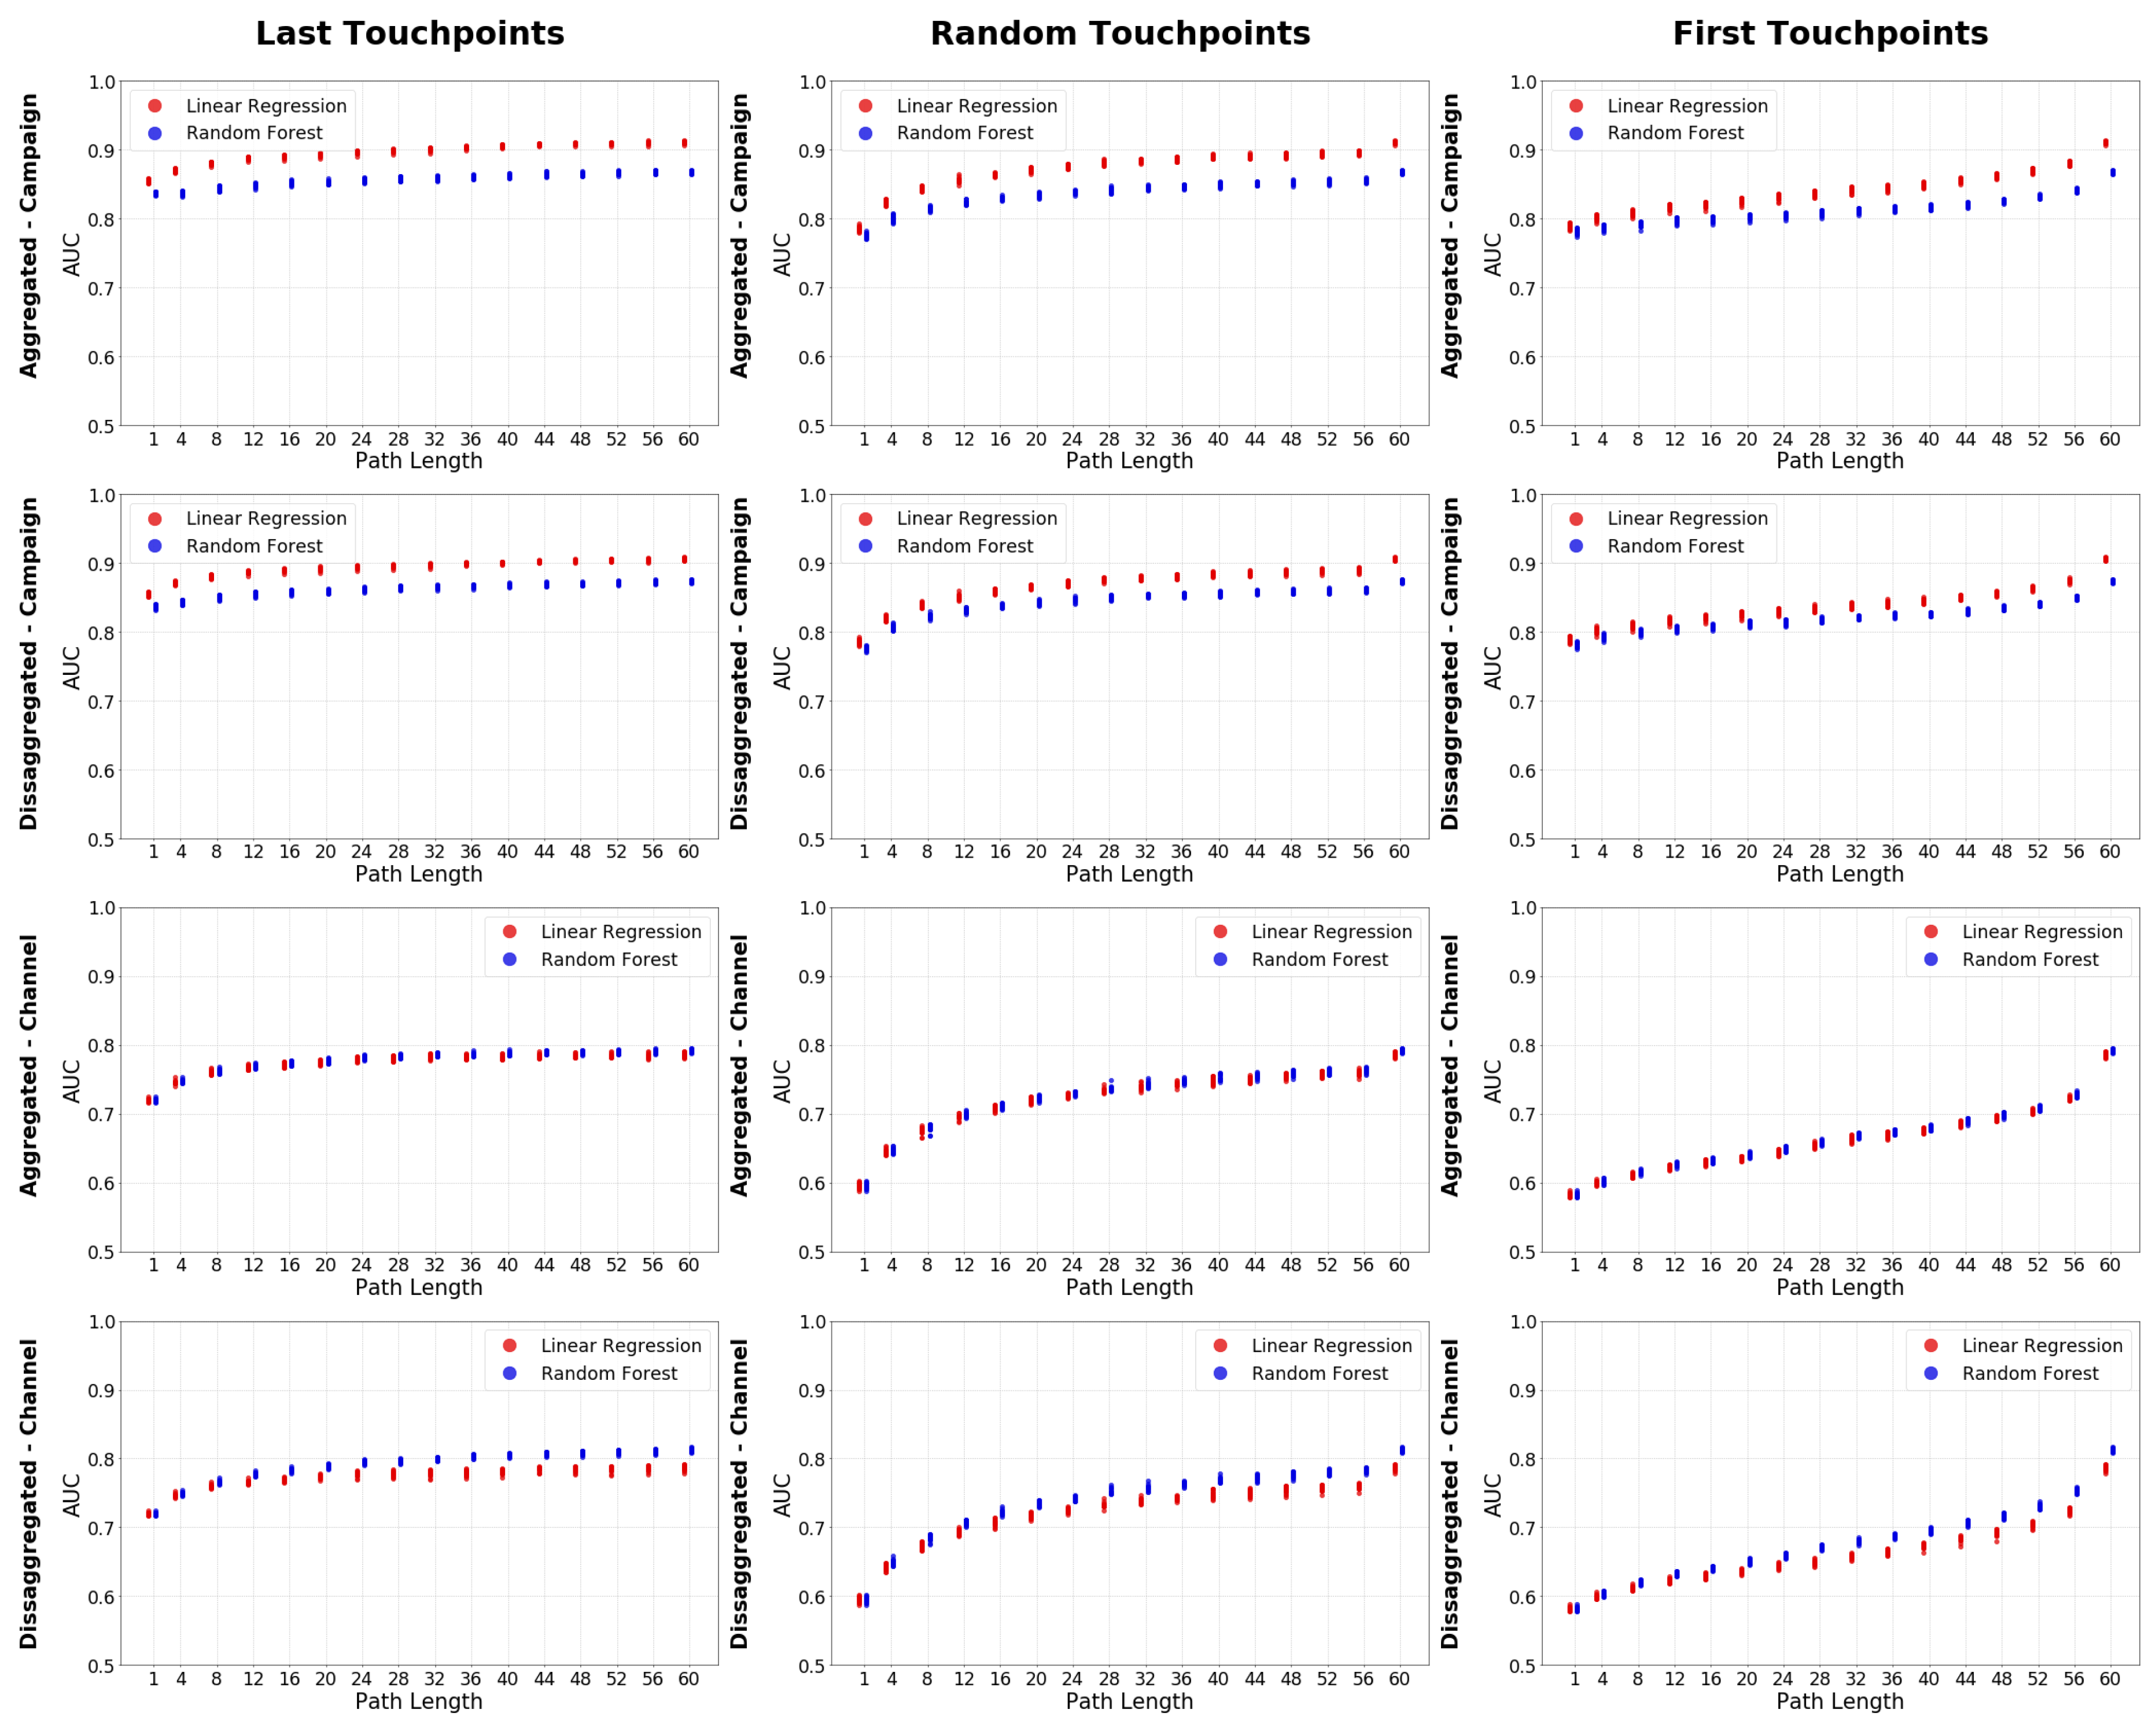
The results indicate that the worst algorithm to be used is naive Bayes since it offers the worst accuracy in almost all considered scenarios. Furthermore, naive Bayes is the model that behaves the most different from the other models. This can be seen by the Pearson correlation with the other models that is usually the smallest, while the Kolmogorov–Smirnov test values are the biggest (correlations and Kolmogorov–Smirnov test values can be seen in Table A1 in Appendix A) Contrary, Linear Regression is with few exceptions the algorithm offering the best results. The only exception occurs for the scenarios at channel granularity and disaggregated level where Random Forest offer and slightly better accuracy than Linear Regression. To validate the generally superior performance of Linear Regression, we have used a second evaluation metric, the AUC. Figure 4 shows the AUC of Linear Regression and Random Forest following the same organization described for Figure 3. The conclusion obtained for ACC holds when considering AUC as the performance metric.
The fact that linear regression offers the best predictability should be interpreted as excellent news for the digital marketing ecosystem for two reasons: (1) it is a very well known algorithm, easy to implement and offering good scalability properties and (2) it is highly interpretable. Then, it allows attribution models to meet the interpretability requirement, which allows them to be key tools for decision making around marketing campaigns.
Using the AUC of these two models, we can see that the linear regression outperforms the random forest except for the disaggregated-channel cases. However, using the Kolmogorov–Smirnov test values (Table A2), we can see that in the disaggregated-channel de valuer move from to while in the Campaign cases move from up to . Therefore, the total loss when using the linear regression is less than with the random forest.
In the rest of this section, we analyze the selected characteristics of user-paths. To avoid adding noise to the analysis and based on the results in this subsection we stick to the use of the attribution models obtained with the linear regression as reference.
5.2. Analysis of User-Path Characteristics
This section addresses the primary goal of the paper, analyze the relevance of key user-path characteristics in data-driven models in digital marketing and provide guidelines for the efficient configuration of attribution models.
We based our analysis on four initial hypothesis, one for each of the path characterisitics considered in this paper.
Hypothesis 1
(The largest the path, the better results). The result is that in general, this is true, but due to an asymptotic behaviour, 12 touchpoint ought to be good enough. This will be discussed in Section 5.2.1.
Hypothesis 2
(The more recent the events, the better). We have found out that this is true. This will be discussed in Section 5.2.2.
Hypothesis 3
(The more granular, the better). We have found out that this is true. This will be discussed in Section 5.2.3.
Hypothesis 4
(The less aggregated, the better). Contrarily to the previous cases, the obtained results shown this hypothesis as invalid. This will be discussed in Section 5.2.4.
5.2.1. User Path Length
Common sense tells us that the longer the user-paths we consider for our attribution model are, the more information we provide to the algorithm and thus, a more accurate result is obtained. However, the use of long paths has associated limitations: The length of user-paths depend on the number of times campaigns impact a user. There are studies that show that impacting a user more than 10 times do not lead to higher conversion rates [21]. Hence companies typically limit the number of impacts made on individual users through the frequency cap. Therefore, the number of long paths present in a campaign dataset are likely to be very limited and non-representative of the performance of the campaign. This may lead to taking wrong strategic decisions on the application of attribution. Therefore, from the perspective of attribution models, it is important to find a trade-off so that we consider user-paths of sufficient length to contain representative data of the campaign performance as well as being sufficiently short.
To analyze the effect of the user-path length in the performance of attribution models, we consider as reference the ACC and AUC values associated to the Linear Regression algorithm in Figure 3 and Figure 4, respectively. When considering the recency characteristic the first or random touchpoints scenarios, as expected, the ACC (and AUC) of the models increases as we consider longer paths. However, we observe an asymptotic trend in the accuracy increase. This means that the first touchpoints considered in the user-path add more information to the model, and as we increase the number of touchpoints, they provide less and less information.
If we do the exercise to select a reasonable user-path length that generates models of high accuracy while guaranteeing to have a sufficiently large sample of user-paths that provides sufficient statistical significance to the attribution model, we conclude that user-paths including around 12 touchpoints is a good trade off. Note that this recommended user-path length also aligns with the aforementioned research studies recommending to set a frequency cap around 10 touchpoints to a user.
Note that this recommendation is not valid for the scenarios where the recency characteristic considers the last touchpoints. In this case, as we can observe in Figure 3 and Figure 4, the asymptotic behaviour is broken on the range of user-path lengths larger than 50 touchpoints. This indicates that the last touchpoints added to the path provide valuable information for the attribution model. This phenomenon has to do with the Recency characteristic that we analyze next.
5.2.2. Recency of Information
In this subsection, we analyze which touchpoints in a user-path provide more information so that the data-driven model offers higher accuracy results: the last touchpoints (those closer to the conversion, in case it occurs)? Or the first touchpoints (those occurring further in time to the conversion)? Or contrarily, is it irrelevant the sequence position of touchpoints and any random selection of them leads to similar accuracy results?
Figure 5 shows results for the Linear Regression algorithm. Each plot includes the result for a combination of Granularity (Channel or Campaign) and Aggregation (Aggregated vs. Disaggregated) user-path characteristics and all possible values of user-path lengths considered. To ease the analysis, results are grouped by the Recency variable (red: last touchpoints; green: random touchpoints; blue: first touchpoints). The accuracy of attribution models is in any case higher when considering the last touchpoints. Whereas, the worse accuracy is obtained when we consider the first touchpoints. The figure shows that the last touchpoinnt and random touchpoint accuracy evolves in a similar way, but the first touchpoint evolution is reversed and reach the largest improvement with the highest number of touchpoints. This is confirmed by the correlations as well as Kolmogorov–Smirnov test values (Table A3). The correlations are high for the last and random, smaller for the random and first, and the smallest is the last and first. With the Kolmogorov–Smirnov test values, we can see that the most different distribution is the fist touchpoint one. This reveals that the closest are the touchpoints collected to the conversion event, the more accurate is our attribution model and thus more effective the decision taken on strategic decisions.
We are also in the position to explain why the asymptotic behaviour in the accuracy performance was broken for use cases using the first touchpoints recency approach reported in Section 5.2.1. The touchpoints with more information are the one closest to the conversion event. These touchpoints are those occupying the last positions in the case the first touchpoint approach is used, and thus they are only considered in very long paths. So, we observe a sudden increase in the accuracy for very long paths, including such touchpoints, which breaks the asymptotic behaviour in the accuracy growth with respect to the user-path length.
Finally, if we jointly consider the results obtained from the user-path length and recency characteristics analyses, we can provide some meaningful guidelines for the implementation of attribution models. In case the resources used to compute an attribution model are limited, a recommended practice is to limit the length of considered paths to 12 touchpoints, selecting specifically the last 12 touchpoints of each user-path to build the model. Based on our results obtained from the execution of more than 11k attribution models, this approach would provide strong guarantees to obtain accurate models.
5.2.3. Granularity
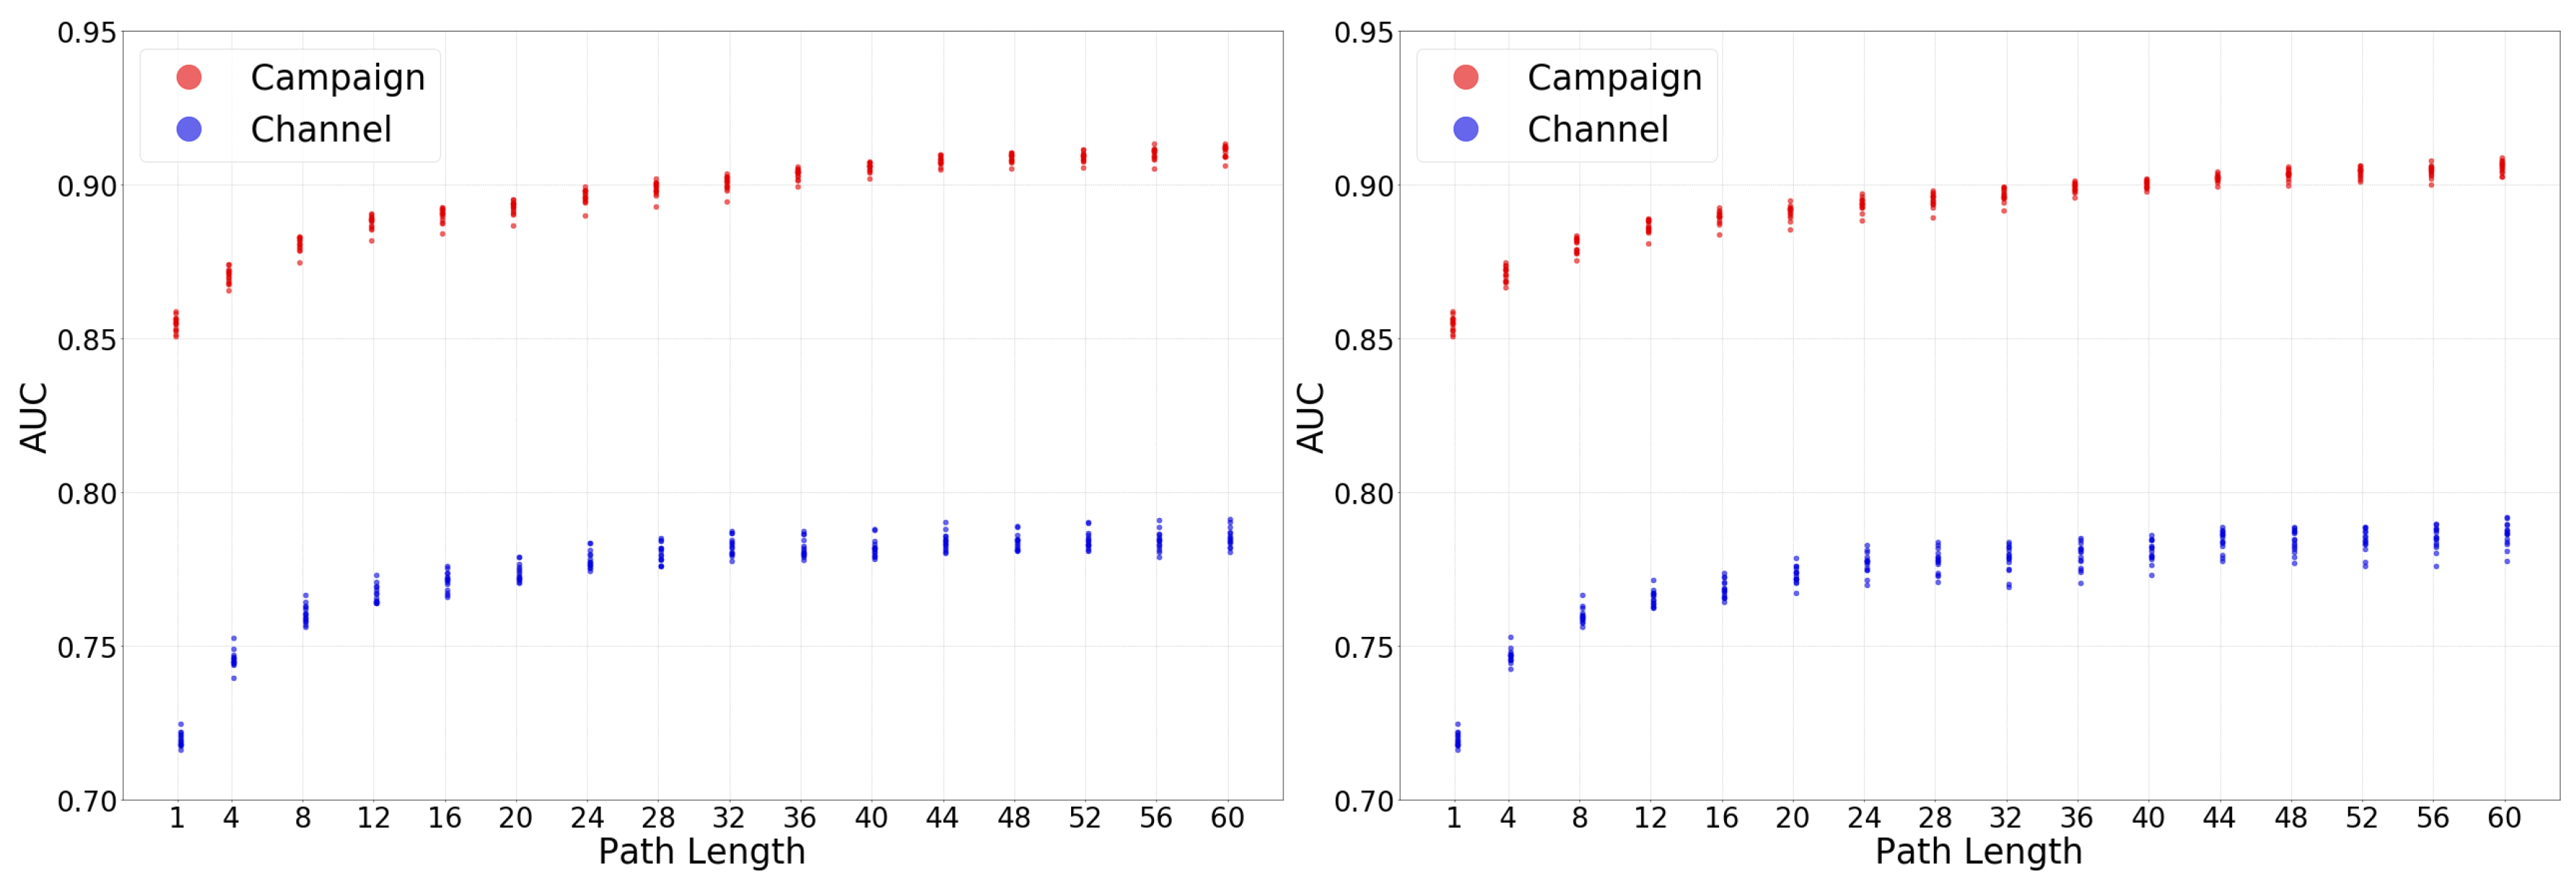
In this section, we analyze the accuracy offered by attribution models at the two considered granularity levels: channel vs. campaigns. As hypothesized in Section 2.2, campaigns include further information than channels, and thus we expect the accuracy obtained by data-driven attribution models is higher at campaign level compared to channel level. To assess this hypothesis Figure 6 shows the accuracy (measured with the AUC) of the tens of thousands of attribution models computed for our dataset for the campaign (red colour) vs. the channel (blue colour) levels. The left and right panels present the results for the aggregated and disaggregated values of the aggregation variable. While the correlations between the campaign and channel distributions are very high in both cases, the Kolmogorov–Smirnov test value is one (Table A4). This is due to the almost equal evolution of the two distributions but having that the attribution models at campaign level offer systematically around a 15% relative improvement in the AUC compared to its channel level counterpart.
This observation validates our initial hypothesis.
Our results demonstrate that attribution models at campaign level offer higher accuracy. In addition, as discussed in Section 2.2 campaigns offer much richer tagging information than channels, thus allowing to define more refined online marketing strategies. Based on this, we would recommend the industry to modify the current trend focus on analyzing attribution at the channel level to develop attribution models at the campaign level.
5.2.4. Aggregation
As in the case of Granularity, our initial assumption is that in the case of the Aggregation characteristic of user-paths the more granular option, i.e., the disaggregated approach would result in more accurate attribution models since it captures the actual representativeness of a given type of touchpoint (campaign or channel) in the user-path. Instead, the aggregated approach just reflects the presence of a given type of touchpoint in a binary manner.
To evaluate the correctness of our hypothesis, Figure 7 shows the accuracy (based on the AUC) for the different attribution models grouped by its aggregated approach (aggregated in red, disaggregated in blue). The left and right panels present the results for campaign and channel levels, respectively. The obtained results prove that our hypothesis is wrong. Aggregated and Disaggregated approaches show very similar accuracy (even, in the case of long user-paths and the campaign granularity disaggregated approach performs slightly better. This is not very relevant since a reported level above such large user-paths represents a minority of samples in the implementation of attribution models). The correlation of both distributions (Table A5) that both of them are very similar. Although the Kolmogorov–Smirnov test is expected to be smaller is probably due to some outliers that can be seen in the figure.
While we do not have an explanation based on solid statistical fundaments to this observation, we conjecture that it is related to the unbalanced presence of different types of touchpoints in user-paths. This seems to lead the algorithms using the disaggregated approach to deliver over-fitting models.
This counter-intuitive result may have important implications in resource consumption to generate attribution models. Specifically, the computational requirements get reduced in comparison to the disaggregated approach because it is enough to record the presence of a touchpoint type in a user-path instead of keeping track of the number of times a touchpoint appears.
5.3. Attribution Model Example
Following the results of the analysis of user-paths characteristics, we have configured our own attribution model as follows: (1) the selected algorithm is linear regression, (2) we consider paths including the 12 most recent touchpoints, (3) campaign level granularity and aggregated approach. For this configuration, we have the aforementioned 14 different datasets to train our algorithm. Note that our goal in this subsection is to prove the utility and simplicity of use of data-driven attribution models and not to perform a whole detailed analysis to define a strategic marketing plan. For this purpose, and to simplify the interpretation of results, we have grouped the different campaigns by channels (note that we have run the model at campaign level (not channel level) and grouped the campaigns per channel to ease the explanation). Figure 8 shows (using boxplots) the distribution of the percentage of total attribution assigned to each channel by our attribution model. We observe that two of the considered channels dominate the attribution of conversion. In particular, paid search and affiliation campaigns are attributed (in median) around 55% and 33% of the conversion, respectively. Display programmatic seems to have also a non-negligible impact in conversions with a percentage of conversion (in median) around 12%. Finally, paid social and display premium seems to have a negligible impact on conversions.
These results are invaluable for making decisions concerning the marketing strategy and the media buy plan. A more detailed analysis considering the rich tagging of campaigns may help to raise other insights about the campaigns’ performance based on the target location, target audience, type of creativity, etc. However, performing such a study is out of the scope of an academic paper and responsibility for digital marketing experts.
6. Discussion
6.1. First Generation vs. Data-Driven Attribution Models
After our analysis of the key characteristics of user-paths, in this section, we use the obtained results to present an objective and empirical comparison of the performance of (widely adopted) first-generation attribution models.
The performance of the last interaction and first interaction model can be assessed in the results in Figure 3 and Figure 4. The Last Interaction (First Interaction) model results correspond to the samples associated with path lengths equal to 1 within the Last Event (First Event) plots. These models present the worst results (excepting for the naive Bayes algorithm) in their correspondent figures. The reason is that using just one event leads to losing much significant information and attributing the conversion exclusively to the last (or first) event. In addition, the performance of the First Interaction is worse compared to Last Interaction because as we have demonstrated the events closest to the conversion include more information.
Other more sophisticated first-generation models also present clear performance limitations based on the obtained results. On the one hand, the linear model (which attributes the same weight to all events) would lead to wrong results since touchpoints closer to the conversion should be assigned larger relevance. Finally, the time decay model is the first-generation model which best captures the essence of the results from our analysis, since it assigns higher relevance to closer touchpoints to the conversion. However, defining the “decay rule” (i.e., the weight of each specific touchpoint) is not trivial and probably there is not a general rule that fits in every case. This makes this model impractical in reality.
In summary, our results leave no doubt that data-driven attribution models overperform first-generation models since they offer better accuracy and are easily activable. Thus, we strongly recommend its use to stakeholders in the digital marketing ecosystem.
6.2. Summary of Best Practices for Data-Driven Attribution Model Design and Configuration
The first aspect to consider is the prediction algorithm to be used. The two fundamental requirements are: (1) the predictability performance of the resulting model should be high, (2) the algorithm should be scalable and (3) the resulting model should be easily interpretable so it can trigger the activation of a data-driven marketing strategy. Our results indicate that a linear regression method meets the three previous requirements. So it is a good candidate to be used in attribution models. However, we would like to acknowledge that our results cannot be considered fully general and that there might be other datasets for which an alternative method to linear regression may offer better performance. For this reason, an important guideline to follow is to analyze (at least) with a small data sample the performance of different alternative algorithms and based on the analysis of the obtained results select the algorithm to use for the analysis of the whole dataset.
The second aspect refers to the set-up of user-path characteristics to achieve the best possible results from the utilization of data-driven attribution models. In particular, we have analyzed four key characteristics (path length, recency, granularity and aggregation) and come up with insightful conclusions to guide the proper configuration of attribution models:
- Attribution models produce very good predictability utilizing user paths with (around) 12 touchpoints. While considering longer user paths marginally increase the accuracy of the model, it incurs in higher computational costs and may jeopardize the statistical robustness of the system due to the lack of data samples, including long paths. Note that for instance in our dataset less than 3% of the data-samples include user-paths including more than 15 touchpoints.
- Models should consider the most recent touchpoints. Hence, if we follow our recommendation and set the considered the maximum user path-length equal 12, we would transform all paths including more than 12 touchpoints into paths of length 12, including the 12 most recent touchpoints.
- Data-driven attribution models perform better at campaign level compared to channel level. This result should encourage the digital marketing stakeholders to revert the current trend in which attribution models are mostly used at channel level. In addition to offer better prediction accuracy, campaign level offers a much richer labelling of touchpoints allowing to take a more refined decision as part of the marketing strategy plan.
- To obtain a better performance, data-driven attribution models should consider as input only the presence/absence of each type of touchpoint in a user-path. Considering the number of appearances (integer variable) instead of the sole presence (binary variable) leads to less accurate models.
Finally, we have used the described guidelines(linear regression algorithm, paths with 12 touchpoints, campaign granularity and aggregated approach) to execute an attribution model and analyzed it. To simplify the analysis, we have grouped the campaigns by its associated channel. The results indicate that paid search and affiliated campaigns are those contributing more to conversions. In particular (in median) around 55% (30%) of the conversion value is attributed to paid search (affiliated) campaigns.
6.3. Summary of Technical Contributions
For the study, we have work with a dataset that has 344,366,428 touchpoints (rows). On average, the execution time for each of the models for our tests has taken 42 s what for the 11,520 cases that we have to test will be 5 days and 14 h. The machine used is composed of a master node with 8 CPUs and 30 GB of RAM and 16 worker nodes each with 4 CPUs and 15 GB of RAM. A machine with these characteristics will cost, in google cloud, USD 274.18 for the whole 5 days and 14 h [22].
Applying this methodology in a few days and within a very reasonable cost is it possible to test the four hypotheses that we have stated in Section 5.2 and know the model that best work for the dataset (or apply any other data-driven attribution model as Shapley Value, Markov Chain, etc.)
Finally, we present a pseudocode (Algorithm 1) that summarizes the implementation of an algorithm based on the recommendations described in Section 6.2:
| Algorithm 1: Characteristics selection. |
 |
After all characteristics have been defined, it is the moment to do the attribution. At this point, any data-driven model can be used.
7. Conclusions and Future Works
Attribution models are a key tool to define digital marketing strategies and investment plans. In recent years, a new generation of data-driven models has started to gain momentum. However, their adoption is being slower than expected. One of the main reasons is the lack of knowledge on how to correctly configure and build these models.
In this paper, we try to address this issue by analyzing the functionality and relevance of four key user-paths characteristics in data-driven attribution models for digital marketing. These four characteristics are: path length, recency of information, granularity and aggregation. To this end, we conduct a thorough empirical evaluation considering more than 13k different scenarios built from a real dataset, including more than 95M user-paths obtained from real advertising campaigns from an international hoteling group.
Our analysis reveals important insights of high value for digital advertising stakeholders to understand the functionality of data-driven attribution model better. First, we have found that simple and interpretable models such as linear regression offers the most accurate attribution models. The interpretability of these models eases their adoption since the model can be mapped straightforwardly into business decisions. Second, we have identified important guidelines to follow in the configuration of attribution models: (i) the longer the user-paths we consider in the model, the higher will be its accuracy. However, to obtain sufficiently high accuracy, it is enough having user-paths with 12 touchpoints; (ii) the recency of the considered touchpoints matters. It is very important to include in the attribution models the most recent samples (closest to the conversion) in order to build more accurate models; (iii) running models at higher granularity leads to higher accuracy. In particular, in this paper, we have proven that models constructed at the campaign level are more accurate compared to those at channel level; (iv) surprisingly, it is better to just record the presence of each type of event in the user-paths rather than the number of appearances. This reduces the complexity of the models.
The use of the referred guidelines will help digital marketing stakeholders to build accurate, interpretable and computationally efficient data-driven attribution models.
As future work, we would like to test this methodology on datasets from different markets and countries to verify that the methodology works in different scenarios. Furthermore, it would be interesting to understand and quantify the loss in accuracy due to the request for interpretability by comparing the results obtained from our models against results from neural networks or other black-box approaches reach.
Author Contributions
Conceptualization, J.R.L., Á.C.R. and R.C.R.; software, J.R.L.; writing–original draft preparation, J.R.L.; writing–review and editing, Á.C.R. and R.C.R.; visualization, J.R.L.; supervision, Á.C.R. and R.C.R. All authors have read and agreed to the published version of the manuscript.
Funding
The research leading to these results has received funding from: the European Union’s Horizon 2020 innovation action programme under grant agreement No 786741 (SMOOTH project) and the gran agreement No 871370 (PIMCITY project); the Ministerio de Economía, Industria y Competitividad, Spain, and the European Social Fund(EU), under the Ramón y Cajal programme (grant RyC-2015-17732);the Ministerio de Ciencia e Innovación under the project ACHILLES (Grant PID2019-104207RB-I00); the Community of Madrid synergic project EMPATIA-CM (Grant Y2018/TCS-5046).
Conflicts of Interest
The authors declare no conflict of interest. The funders had no role in the design of the study; in the collection, analyses, or interpretation of data; in the writing of the manuscript, or in the decision to publish the results
Appendix A. Correlations and Kolmogorov–Smirnov Tests

Table A1.
This table shows the correlation and Kolmogorov–Smirnov test for Figure 3.
Table A1.
This table shows the correlation and Kolmogorov–Smirnov test for Figure 3.
| CASE | LEVEL | AGGREGATION | MODEL 1 | MODEL 2 | CORRELATION | CORRELATION p-Value | Kolmogorov–Smirnov Test | Kolmogorov–Smirnov Test p-Value |
|---|---|---|---|---|---|---|---|---|
| FirstTouchpoints | Campaign | Aggregated | Linear Regression | Naive Bayes | 0.95905 | 2.15938 × 10 | 0.38750 | 1.85406 × 10 |
| FirstTouchpoints | Campaign | Aggregated | Linear Regression | Random Forest | 0.98117 | 5.52885 × 10 | 0.39583 | 3.55634 × 10 |
| FirstTouchpoints | Campaign | Aggregated | Linear Regression | Support Vectore Machine | 0.99661 | 3.45530 × 10 | 0.00416 | 0.98562 |
| FirstTouchpoints | Campaign | Aggregated | Naive Bayes | Random Forest | 0.96616 | 4.54059 × 10 | 0.14583 | 1.20518 × 10 |
| FirstTouchpoints | Campaign | Aggregated | Naive Bayes | Support Vectore Machine | 0.96639 | 2.06114 × 10 | 0.39583 | 3.55634 × 10 |
| FirstTouchpoints | Campaign | Aggregated | Random Forest | Support Vectore Machine | 0.98473 | 1.04442 × 10 | 0.39166 | 8.16011 × 10 |
| FirstTouchpoints | Campaign | Dissaggregated | Linear Regression | Naive Bayes | 0.77532 | 2.09664 × 10 | 0.74583 | 2.32108 × 10 |
| FirstTouchpoints | Campaign | Dissaggregated | Linear Regression | Random Forest | 0.97865 | 1.53307 × 10 | 0.25416 | 3.21883 × 10 |
| FirstTouchpoints | Campaign | Dissaggregated | Linear Regression | Support Vectore Machine | 0.98477 | 7.19193 × 10 | 0.22083 | 1.53700 × 10 |
| FirstTouchpoints | Campaign | Dissaggregated | Naive Bayes | Random Forest | 0.81459 | 3.17564 × 10 | 0.69166 | 3.62046 × 10 |
| FirstTouchpoints | Campaign | Dissaggregated | Naive Bayes | Support Vectore Machine | 0.79135 | 8.94877 × 10 | 0.69166 | 3.62046 × 10 |
| FirstTouchpoints | Campaign | Dissaggregated | Random Forest | Support Vectore Machine | 0.97008 | 2.48304 × 10 | 0.13333 | 2.79511 × 10 |
| FirstTouchpoints | Channel | Aggregated | Linear Regression | Naive Bayes | 0.99939 | 0.00000 | 0.00291 | 0.99996 |
| FirstTouchpoints | Channel | Aggregated | Linear Regression | Random Forest | 0.99960 | 0.00000 | 0.00416 | 0.98562 |
| FirstTouchpoints | Channel | Aggregated | Linear Regression | Support Vectore Machine | 0.99681 | 2.22724 × 10 | 0.00708 | 0.58473 |
| FirstTouchpoints | Channel | Aggregated | Naive Bayes | Random Forest | 0.99929 | 0.00000 | 0.00541 | 0.87396 |
| FirstTouchpoints | Channel | Aggregated | Naive Bayes | Support Vectore Machine | 0.99683 | 1.05113 × 10 | 0.00666 | 0.66147 |
| FirstTouchpoints | Channel | Aggregated | Random Forest | Support Vectore Machine | 0.99663 | 1.31583 × 10 | 0.10000 | 0.18148 |
| FirstTouchpoints | Channel | Dissaggregated | Linear Regression | Naive Bayes | 0.16407 | 1.08994 × 10 | 0.71250 | 6.11511 × 10 |
| FirstTouchpoints | Channel | Dissaggregated | Linear Regression | Random Forest | 0.99722 | 1.77211 × 10 | 0.12083 | 6.00680 × 10 |
| FirstTouchpoints | Channel | Dissaggregated | Linear Regression | Support Vectore Machine | 0.97006 | 2.69353 × 10 | 0.11666 | 7.62164 × 10 |
| FirstTouchpoints | Channel | Dissaggregated | Naive Bayes | Random Forest | 0.15513 | 1.61580 × 10 | 0.81250 | 7.92155 × 10 |
| FirstTouchpoints | Channel | Dissaggregated | Naive Bayes | Support Vectore Machine | 0.21287 | 9.04128 × 10 | 0.63333 | 1.70191 × 10 |
| FirstTouchpoints | Channel | Dissaggregated | Random Forest | Support Vectore Machine | 0.96517 | 1.36343 × 10 | 0.21666 | 2.39543 × 10 |
| LastTouchpoints | Campaign | Aggregated | Linear Regression | Naive Bayes | 0.57136 | 3.37384 × 10 | 0.82916 | 7.73191 × 10 |
| LastTouchpoints | Campaign | Aggregated | Linear Regression | Random Forest | 0.95826 | 2.01009 × 10 | 0.86250 | 1.99034 × 10 |
| LastTouchpoints | Campaign | Aggregated | Linear Regression | Support Vectore Machine | 0.99374 | 1.27030 × 10 | 0.00958 | 0.22066 |
| LastTouchpoints | Campaign | Aggregated | Naive Bayes | Random Forest | 0.56043 | 2.99844 × 10 | 0.24166 | 1.46566 × 10 |
| LastTouchpoints | Campaign | Aggregated | Naive Bayes | Support Vectore Machine | 0.57339 | 2.22731 × 10 | 0.82499 | 8.08169 × 10 |
| LastTouchpoints | Campaign | Aggregated | Random Forest | Support Vectore Machine | 0.95954 | 5.29300 × 10 | 0.86250 | 1.99034 × 10 |
| LastTouchpoints | Campaign | Dissaggregated | Linear Regression | Naive Bayes | −0.86587 | 1.52694 × 10 | 0.93750 | 1.78519 × 10 |
| LastTouchpoints | Campaign | Dissaggregated | Linear Regression | Random Forest | 0.91808 | 1.25788 × 10 | 0.82916 | 7.73191 × 10 |
| LastTouchpoints | Campaign | Dissaggregated | Linear Regression | Support Vectore Machine | 0.87676 | 1.26842 × 10 | 0.62916 | 7.49606 × 10 |
| LastTouchpoints | Campaign | Dissaggregated | Naive Bayes | Random Forest | −0.76205 | 8.06506 × 10 | 0.81250 | 7.92155 × 10 |
| LastTouchpoints | Campaign | Dissaggregated | Naive Bayes | Support Vectore Machine | −0.76334 | 4.60512 × 10 | 0.93750 | 1.78519 × 10 |
| LastTouchpoints | Campaign | Dissaggregated | Random Forest | Support Vectore Machine | 0.86028 | 1.38382 × 10 | 0.54166 | 1.22993 × 10 |
| LastTouchpoints | Channel | Aggregated | Linear Regression | Naive Bayes | 0.99689 | 9.16379 × 10 | 0.00749 | 0.51034 |
| LastTouchpoints | Channel | Aggregated | Linear Regression | Random Forest | 0.99886 | 1.75984 × 10 | 0.19583 | 1.93303 × 10 |
| LastTouchpoints | Channel | Aggregated | Linear Regression | Support Vectore Machine | 0.99112 | 1.33923 × 10 | 0.00374 | 0.99606 |
| LastTouchpoints | Channel | Aggregated | Naive Bayes | Random Forest | 0.99651 | 1.04477 × 10 | 0.25416 | 3.21883 × 10 |
| LastTouchpoints | Channel | Aggregated | Naive Bayes | Support Vectore Machine | 0.98865 | 6.09605 × 10 | 0.00874 | 0.31764 |
| LastTouchpoints | Channel | Aggregated | Random Forest | Support Vectore Machine | 0.99082 | 7.43567 × 10 | 0.18333 | 6.09875 × 10 |
| LastTouchpoints | Channel | Dissaggregated | Linear Regression | Naive Bayes | −0.63605 | 1.29516 × 10 | 0.74166 | 1.56860 × 10 |
| LastTouchpoints | Channel | Dissaggregated | Linear Regression | Random Forest | 0.98942 | 1.49867 × 10 | 0.52083 | 4.50694 × 10 |
| LastTouchpoints | Channel | Dissaggregated | Linear Regression | Support Vectore Machine | 0.70896 | 5.82266 × 10 | 0.28333 | 6.85579 × 10 |
| LastTouchpoints | Channel | Dissaggregated | Naive Bayes | Random Forest | −0.68942 | 3.48277 × 10 | 0.79166 | 4.74215 × 10 |
| LastTouchpoints | Channel | Dissaggregated | Naive Bayes | Support Vectore Machine | −0.37137 | 2.90334 × 10 | 0.67083 | 1.44069 × 10 |
| LastTouchpoints | Channel | Dissaggregated | Random Forest | Support Vectore Machine | 0.68891 | 4.08419 × 10 | 0.61250 | 2.46207 × 10 |
| RandomTouchpoints | Campaign | Aggregated | Linear Regression | Naive Bayes | 0.96053 | 2.94741 × 10 | 0.66249 | 3.56615 × 10 |
| RandomTouchpoints | Campaign | Aggregated | Linear Regression | Random Forest | 0.98788 | 1.37407 × 10 | 0.65416 | 8.32078 × 10 |
| RandomTouchpoints | Campaign | Aggregated | Linear Regression | Support Vectore Machine | 0.99673 | 3.69189 × 10 | 0.00833 | 0.37583 |
| RandomTouchpoints | Campaign | Aggregated | Naive Bayes | Random Forest | 0.96713 | 1.52240 × 10 | 0.12916 | 3.63764 × 10 |
| RandomTouchpoints | Campaign | Aggregated | Naive Bayes | Support Vectore Machine | 0.96504 | 2.08569 × 10 | 0.65000 | 3.93256 × 10 |
| RandomTouchpoints | Campaign | Aggregated | Random Forest | Support Vectore Machine | 0.98926 | 8.79755 × 10 | 0.63333 | 1.70191 × 10 |
| RandomTouchpoints | Campaign | Dissaggregated | Linear Regression | Naive Bayes | 0.79425 | 2.03930 × 10 | 0.87500 | 7.19807 × 10 |
| RandomTouchpoints | Campaign | Dissaggregated | Linear Regression | Random Forest | 0.98464 | 2.11034 × 10 | 0.53333 | 1.35073 × 10 |
| RandomTouchpoints | Campaign | Dissaggregated | Linear Regression | Support Vectore Machine | 0.98519 | 2.66800 × 10 | 0.46250 | 1.53368 × 10 |
| RandomTouchpoints | Campaign | Dissaggregated | Naive Bayes | Random Forest | 0.81255 | 1.02702 × 10 | 0.82916 | 7.73191 × 10 |
| RandomTouchpoints | Campaign | Dissaggregated | Naive Bayes | Support Vectore Machine | 0.78285 | 5.94595 × 10 | 0.86250 | 1.99034 × 10 |
| RandomTouchpoints | Campaign | Dissaggregated | Random Forest | Support Vectore Machine | 0.97400 | 1.78534 × 10 | 0.20000 | 1.29540 × 10 |
| RandomTouchpoints | Channel | Aggregated | Linear Regression | Naive Bayes | 0.99977 | 0.00000 | 0.00291 | 0.99996 |
| RandomTouchpoints | Channel | Aggregated | Linear Regression | Random Forest | 0.99983 | 0.00000 | 0.00541 | 0.87396 |
| RandomTouchpoints | Channel | Aggregated | Linear Regression | Support Vectore Machine | 0.99744 | 7.23197 × 10 | 0.00416 | 0.98562 |
| RandomTouchpoints | Channel | Aggregated | Naive Bayes | Random Forest | 0.99974 | 0.00000 | 0.00583 | 0.80993 |
| RandomTouchpoints | Channel | Aggregated | Naive Bayes | Support Vectore Machine | 0.99739 | 1.09554 × 10 | 0.00541 | 0.87396 |
| RandomTouchpoints | Channel | Aggregated | Random Forest | Support Vectore Machine | 0.99739 | 7.38090 × 10 | 0.00791 | 0.44028 |
| RandomTouchpoints | Channel | Dissaggregated | Linear Regression | Naive Bayes | 0.32975 | 1.70530 × 10 | 0.93750 | 1.78519 × 10 |
| RandomTouchpoints | Channel | Dissaggregated | Linear Regression | Random Forest | 0.99939 | 0.00000 | 0.20833 | 5.66818 × 10 |
| RandomTouchpoints | Channel | Dissaggregated | Linear Regression | Support Vectore Machine | 0.96069 | 1.85341 × 10 | 0.20833 | 5.66818 × 10 |
| RandomTouchpoints | Channel | Dissaggregated | Naive Bayes | Random Forest | 0.32689 | 2.20947 × 10 | 0.93750 | 1.78519 × 10 |
| RandomTouchpoints | Channel | Dissaggregated | Naive Bayes | Support Vectore Machine | 0.36247 | 7.29166 × 10 | 0.93333 | 5.18820 × 10 |
| RandomTouchpoints | Channel | Dissaggregated | Random Forest | Support Vectore Machine | 0.95964 | 3.96644 × 10 | 0.32083 | 2.53287 × 10 |
Table A2.
This table shows the correlation and Kolmogorov–Smirnov test for Figure 4.
Table A2.
This table shows the correlation and Kolmogorov–Smirnov test for Figure 4.
| CASE | LEVEL | AGGREGATION | CORRELATION | CORRELATION p-Value | Kolmogorov–Smirnov Test | Kolmogorov–Smirnov Test p-Value |
|---|---|---|---|---|---|---|
| FirstTouchpoints | Campaign | Aggregated | 0.99063 | 7.68134 × 10 | 0.44583 | 7.65377 × 10 |
| FirstTouchpoints | Campaign | Dissaggregated | 0.99682 | 1.45866 × 10 | 0.32500 | 1.29829 × 10 |
| FirstTouchpoints | Channel | Aggregated | 0.99930 | 0.00000 | 5.83333 × 10 | 0.80993 |
| FirstTouchpoints | Channel | Dissaggregated | 0.99620 | 2.17642 × 10 | 0.18333 | 6.09875 × 10 |
| LastTouchpoints | Campaign | Aggregated | 0.95559 | 2.78564 × 10 | 0.90416 | 1.85789 × 10 |
| LastTouchpoints | Campaign | Dissaggregated | 0.97669 | 4.71308 × 10 | 0.87083 | 1.04488 × 10 |
| LastTouchpoints | Channel | Aggregated | 0.99447 | 4.90792 × 10 | 0.33333 | 3.31722 × 10 |
| LastTouchpoints | Channel | Dissaggregated | 0.98081 | 5.07700 × 10 | 0.65416 | 8.32078 × 10 |
| RandomTouchpoints | Campaign | Aggregated | 0.99478 | 5.44999 × 10 | 0.69583 | 6.58000 × 10 |
| RandomTouchpoints | Campaign | Dissaggregated | 0.99608 | 1.07000 × 10 | 0.60833 | 1.00999 × 10 |
| RandomTouchpoints | Channel | Aggregated | 0.99954 | 0.00000 | 0.10000 | 0.18148 |
| RandomTouchpoints | Channel | Dissaggregated | 0.99861 | 1.85000 × 10 | 0.35000 | 1.94000 × 10 |
Table A3.
This table shows the correlation and Kolmogorov–Smirnov test for Figure 5.
Table A3.
This table shows the correlation and Kolmogorov–Smirnov test for Figure 5.
| LEVEL | AGGREGATION | CASE 1 | CASE 2 | CORRELATION | CORRELATION p-Value | Kolmogorov–Smirnov Test | Kolmogorov–Smirnov Test p-Value |
|---|---|---|---|---|---|---|---|
| Campaign | Aggregated | Last Touchpoints | Random Touchpoints | 0.97901 | 2.02613 × 10 | 0.45000 | 2.92515 × 10 |
| Campaign | Aggregated | Last Touchpoints | First Touchpoints | 0.82339 | 1.71458 × 10 | 0.76249 | 9.21018 × 10 |
| Campaign | Aggregated | Random Touchpoints | First Touchpoints | 0.84854 | 9.80121 × 10 | 0.53333 | 1.35073 × 10 |
| Campaign | Dissaggregated | Last Touchpoints | Random Touchpoints | 0.97053 | 4.19641 × 10 | 0.61250 | 2.46207 × 10 |
| Campaign | Dissaggregated | Last Touchpoints | First Touchpoints | 0.78384 | 3.67931 × 10 | 0.81250 | 7.92155 × 10 |
| Campaign | Dissaggregated | Random Touchpoints | First Touchpoints | 0.86759 | 3.66627 × 10 | 0.55000 | 1.06852 × 10 |
| Channel | Aggregated | Last Touchpoints | Random Touchpoints | 0.95169 | 4.92301 × 10 | 0.77500 | 2.10634 × 10 |
| Channel | Aggregated | Last Touchpoints | First Touchpoints | 0.62657 | 1.40472 × 10 | 0.90833 | 9.33002 × 10 |
| Channel | Aggregated | Random Touchpoints | First Touchpoints | 0.80527 | 5.96048 × 10 | 0.60000 | 1.65172 × 10 |
| Channel | Dissaggregated | Last Touchpoints | Random Touchpoints | 0.95344 | 6.78221 × 10 | 0.77916 | 2.66376 × 10 |
| Channel | Dissaggregated | Last Touchpoints | First Touchpoints | 0.64488 | 1.30494 × 10 | 0.90000 | 3.53773 × 10 |
| Channel | Dissaggregated | Random Touchpoints | First Touchpoints | 0.79840 | 2.37511 × 10 | 0.59583 | 6.53878 × 10 |
Table A4.
This table shows the correlation and Kolmogorov–Smirnov test for Figure 6.
Table A4.
This table shows the correlation and Kolmogorov–Smirnov test for Figure 6.
| AGGREGATION | CORRELATION | CORRELATION p-Value | Kolmogorov–Smirnov Test | Kolmogorov–Smirnov Test p-Value |
|---|---|---|---|---|
| Dissaggregated | 0.97326 | 4.77910 × 10 | 1.00000 | 1.76010 × 10 |
| Aggregated | 0.96226 | 1.59434 × 10 | 1.00000 | 1.76010 × 10 |
Table A5.
This table shows the correlation and Kolmogorov–Smirnov test for Figure 7.
Table A5.
This table shows the correlation and Kolmogorov–Smirnov test for Figure 7.
| LEVEL | CORRELATION | CORRELATION p-Value | Kolmogorov–Smirnov Test | Kolmogorov–Smirnov Test p-Value |
|---|---|---|---|---|
| Campaign | 0.99498 | 4.88854 × 10 | 0.28333 | 6.85579 × 10 |
| Channel | 0.98719 | 9.36360 × 10 | 0.12500 | 4.69426 × 10 |
References
- Shapley, L.S. A value for n-person games. Contrib. Theory Games 1953, 2, 307–317. [Google Scholar]
- Berman, R. Beyond the last touch: Attribution in online advertising. Mark. Sci. 2018, 37, 771–792. [Google Scholar] [CrossRef] [Green Version]
- Geyik, S.C.; Saxena, A.; Dasdan, A. Multi-Touch Attribution Based Budget Allocation in Online Advertising. arXiv 2015, arXiv:1502.06657. [Google Scholar]
- Ren, K.; Fang, Y.; Zhang, W.; Liu, S.; Li, J.; Zhang, Y.; Yu, Y.; Wang, J. Learning multi-touch conversion attribution with dual-attention mechanisms for online advertising. In Proceedings of the 27th ACM International Conference on Information and Knowledge Management, Torino, Italy, 22–26 October 2018; pp. 1433–1442. [Google Scholar]
- Kakalejčík, L.; Bucko, J.; Resende, P.A.; Ferencova, M. Multichannel Marketing Attribution Using Markov Chains. J. Appl. Manag. Investig. 2018, 7, 49–60. [Google Scholar]
- Anderl, E.; Becker, I.; Von Wangenheim, F.; Schumann, J.H. Mapping the customer journey: Lessons learned from graph-based online attribution modeling. Int. J. Res. Mark. 2016, 33, 457–474. [Google Scholar] [CrossRef]
- Ji, W.; Wang, X. Additional multi-touch attribution for online advertising. In Proceedings of the Thirty-First AAAI Conference on Artificial Intelligence, San Francisco, CA, USA, 4–9 February 2017. [Google Scholar]
- Zhang, Y.; Wei, Y.; Ren, J. Multi-touch attribution in online advertising with survival theory. In Proceedings of the 2014 IEEE International Conference on Data Mining, Shenzhen, China, 14–17 December 2014; pp. 687–696. [Google Scholar]
- Shao, X.; Li, L. Data-driven multi-touch attribution models. In Proceedings of the 17th ACM SIGKDD International Conference on Knowledge Discovery and Data Mining, San Diego, CA, USA, 21–24 August 2011; pp. 258–264. [Google Scholar]
- Sinha, R.; Saini, S.; Anadhavelu, N. Estimating the incremental effects of interactions for marketing attribution. In Proceedings of the 2014 IEEE International Conference on Behavioral, Economic, and Socio-Cultural Computing (BESC2014), Shanghai, China, 30 October–1 November 2014; pp. 1–6. [Google Scholar]
- Ghose, A.; Todri, V. Towards a digital attribution model: Measuring the impact of display advertising on online consumer behavior. SSRN 2015. [Google Scholar] [CrossRef] [Green Version]
- Kireyev, P.; Pauwels, K.; Gupta, S. Do display ads influence search? Attribution and dynamics in online advertising. Int. J. Res. Mark. 2016, 33, 475–490. [Google Scholar] [CrossRef]
- About Floodlight—Campaign Manager Help. 2019. Available online: https://support.google.com/dcm/answer/2823388?hl=en (accessed on 7 October 2019).
- Data Transfer v2.0|Campaign Manager|Google Developers. Available online: https://developers.google.com/doubleclick-advertisers/dtv2/overview (accessed on 20 July 2017).
- Data Transfer v2.0: File Format|Campaign Manager|Google Developers. 2019. Available online: https://developers.google.com/doubleclick-advertisers/dtv2/reference/file-format (accessed on 7 October 2019).
- DoubleClick for Publishers Help. Available online: https://support.google.com/dfp_premium/table/7401123 (accessed on 17 August 2017).
- Data Transfer v2.0: Match Tables|Campaign Manager|Google Developers. Available online: https://developers.google.com/doubleclick-advertisers/dtv2/reference/match-tables (accessed on 15 November 2017).
- Important Changes to Data Transfer—Campaign Manager Help. 2019. Available online: https://support.google.com/dcm/answer/9006418 (accessed on 7 October 2019).
- Xu, Y.; Goodacre, R. On Splitting Training and Validation Set: A Comparative Study of Cross-Validation, Bootstrap and Systematic Sampling for Estimating the Generalization Performance of Supervised Learning. J. Anal. Test. 2018, 2, 249–262. [Google Scholar] [CrossRef] [PubMed] [Green Version]
- Precision and Recall—Wikipedia. 2019. Available online: https://en.wikipedia.org/wiki/Precision_and_recall (accessed on 7 November 2019).
- Chandler-Pepelnjak, J.; Song, Y.B. Optimal Frequency: The iMpact of Frequency on Conversion Rates. 2009. Available online: https://advertising.microsoft.com/wwdocs/user/enus/researchlibrary/researchreport/OptimalFrequency.pdf (accessed on 25 August 2016).
- Google Cloud Platform Pricing Calculator. Available online: https://cloud.google.com/products/calculator/#id=58aba1c2-cccb-4b43-a27a-c34ae852e9a1 (accessed on 21 October 2020).
Figure 1.
Touchpoint distribution based on the position for all of the first-generation models. Where on the left is the first touchpoint in the path and the rightmost bar is the last touchpoint.
Figure 1.
Touchpoint distribution based on the position for all of the first-generation models. Where on the left is the first touchpoint in the path and the rightmost bar is the last touchpoint.

Figure 2.
Distribution of the different levels for the elements in the marketing platforms.

Figure 3.
Accuracy of the 4 models in the different use cases. Preferably see it in color.

Figure 4.
Area under the curve for random forest and linear regression in all the use cases. Preferably see it in color.
Figure 4.
Area under the curve for random forest and linear regression in all the use cases. Preferably see it in color.

Figure 5.
Comparison of the accuracy in the linear model for each of the recencies of information. Preferably see it in color.
Figure 5.
Comparison of the accuracy in the linear model for each of the recencies of information. Preferably see it in color.

Figure 6.
Comparison of the accuracy in the linear model for the campaign granularity against the channel granularity. On the left side we have the aggregated frequency and on the right the disaggregated frequency. Preferably see it in color.
Figure 6.
Comparison of the accuracy in the linear model for the campaign granularity against the channel granularity. On the left side we have the aggregated frequency and on the right the disaggregated frequency. Preferably see it in color.

Figure 7.
Comparison of the accuracy in the linear model for aggregated frequency against disaggregated frequency. On the left side we have the campaign granularity and on the right the channel granularity. Preferably see it in color.
Figure 7.
Comparison of the accuracy in the linear model for aggregated frequency against disaggregated frequency. On the left side we have the campaign granularity and on the right the channel granularity. Preferably see it in color.

Figure 8.
Proportion of the conversion value attributed to each of the channels for our ideal case.

Publisher’s Note: MDPI stays neutral with regard to jurisdictional claims in published maps and institutional affiliations. |
© 2020 by the authors. Licensee MDPI, Basel, Switzerland. This article is an open access article distributed under the terms and conditions of the Creative Commons Attribution (CC BY) license (http://creativecommons.org/licenses/by/4.0/).
Share and Cite
MDPI and ACS Style
Romero Leguina, J.; Cuevas Rumín, Á.; Cuevas Rumín, R. Digital Marketing Attribution: Understanding the User Path. Electronics 2020, 9, 1822. https://doi.org/10.3390/electronics9111822
AMA Style
Romero Leguina J, Cuevas Rumín Á, Cuevas Rumín R. Digital Marketing Attribution: Understanding the User Path. Electronics. 2020; 9(11):1822. https://doi.org/10.3390/electronics9111822
Chicago/Turabian StyleRomero Leguina, Jesús, Ángel Cuevas Rumín, and Rubén Cuevas Rumín. 2020. "Digital Marketing Attribution: Understanding the User Path" Electronics 9, no. 11: 1822. https://doi.org/10.3390/electronics9111822
Note that from the first issue of 2016, this journal uses article numbers instead of page numbers. See further details here.