Higher Fecal Short-Chain Fatty Acid Levels Are Associated with Gut Microbiome Dysbiosis, Obesity, Hypertension and Cardiometabolic Disease Risk Factors

 , , ,
, , , 
Abstract
:1. Introduction
2. Materials and Methods
2.1. Study Population
2.2. Blood Biochemical Parameters
2.3. Adiposity and Blood Pressure
2.4. Diet Assessment and Physical Activity
2.5. Fecal Sampling
2.6. Fecal Microbiota Characterization
2.7. Quantification of Fecal SCFAs
2.8. Statistical Analyses
2.9. Availability of Data and Material
3. Results
4. Discussion
5. Conclusions
Supplementary Materials
Author Contributions
Funding
Acknowledgments
Conflicts of Interest
References
- Flint, H.J.; Scott, K.P.; Duncan, S.H.; Louis, P.; Forano, E. Microbial degradation of complex carbohydrates in the gut. Gut Microbes 2012, 3, 289–306. [Google Scholar] [CrossRef] [PubMed] [Green Version]
- Stumpff, F. A look at the smelly side of physiology: Transport of short chain fatty acids. Pflugers Arch. Eur. J. Physiol. 2018, 470, 571–598. [Google Scholar] [CrossRef] [PubMed]
- Hamer, H.M.; Jonkers, D.; Venema, K.; Vanhoutvin, S.; Troost, F.J.; Brummer, R.J. Review article: The role of butyrate on colonic function. Aliment. Pharmacol. Ther. 2008, 27, 104–119. [Google Scholar] [CrossRef] [PubMed]
- Den Besten, G.; Lange, K.; Havinga, R.; van Dijk, T.H.; Gerding, A.; van Eunen, K.; Muller, M.; Groen, A.K.; Hooiveld, G.J.; Bakker, B.M.; et al. Gut-derived short-chain fatty acids are vividly assimilated into host carbohydrates and lipids. AJP Gastrointest. Liver Physiol. 2013, 305, G900–G910. [Google Scholar] [CrossRef] [PubMed]
- Kelly, C.J.; Zheng, L.; Campbell, E.L.; Saeedi, B.; Scholz, C.C.; Bayless, A.J.; Wilson, K.E.; Glover, L.E.; Kominsky, D.J.; Magnuson, A.; et al. Crosstalk between microbiota-derived short-chain fatty acids and intestinal epithelial HIF augments tissue barrier function. Cell Host Microbe 2015, 17, 662–671. [Google Scholar] [CrossRef] [PubMed]
- Peng, L.; Li, Z.-R.; Green, R.S.; Holzman, I.R.; Lin, J. Butyrate enhances the intestinal barrier by facilitating tight junction assembly via activation of AMP-activated protein kinase in Caco-2 cell monolayers. J. Nutr. 2009, 139, 1619–1625. [Google Scholar] [CrossRef] [PubMed]
- Jung, T.H.; Park, J.H.; Jeon, W.M.; Han, K.S. Butyrate modulates bacterial adherence on LS174T human colorectal cells by stimulating mucin secretion and MAPK signaling pathway. Nutr. Res. Pract. 2015, 9, 343–349. [Google Scholar] [CrossRef]
- Cani, P.D.; Bibiloni, R.; Knauf, C.; Neyrinck, A.M.; Delzenne, N.M. Changes in gut microbiota control metabolic diet-induced obesity and diabetes in mice. Diabetes 2008, 57, 1470–1481. [Google Scholar] [CrossRef]
- Byrne, C.S.; Chambers, E.S.; Morrison, D.J.; Frost, G. The role of short chain fatty acids in appetite regulation and energy homeostasis. Int. J. Obes. 2015, 39, 1331–1338. [Google Scholar] [CrossRef] [Green Version]
- Vieira, A.T.; MacIa, L.; Galvão, I.; Martins, F.S.; Canesso, M.C.C.; Amaral, F.A.; Garcia, C.C.; Maslowski, K.M.; De Leon, E.; Shim, D.; et al. A role for gut microbiota and the metabolite-sensing receptor GPR43 in a murine model of gout. Arthritis Rheumatol. 2015, 67, 1646–1656. [Google Scholar] [CrossRef]
- Smith, P.M.; Howitt, M.R.; Panikov, N.; Michaud, M.; Gallini, C.A.; Bohlooly, Y.M.; Glickman, J.N.; Garrett, W.S.; Bohlooly, Y.M.; Glickman, J.N.; et al. The microbial metabolites, short-chain fatty acids, regulate colonic Treg cell homeostasis. Science 2013, 341, 569–573. [Google Scholar] [CrossRef] [PubMed]
- McNeil, N.I. The contribution of the large intestine to energy supplies in man. Am. J. Clin. Nutr. 1984, 39, 338–342. [Google Scholar] [CrossRef] [PubMed] [Green Version]
- Rahat-Rozenbloom, S.; Fernandes, J.; Gloor, G.B.; Wolever, T.M.S. Evidence for greater production of colonic short-chain fatty acids in overweight than lean humans. Int. J. Obes. 2014, 38, 1525–1531. [Google Scholar] [CrossRef] [PubMed] [Green Version]
- Turnbaugh, P.J.; Ley, R.E.; Mahowald, M.A.; Magrini, V.; Mardis, E.R.; Gordon, J.I. An obesity-associated gut microbiome with increased capacity for energy harvest. Nature 2006, 444, 1027–1031. [Google Scholar] [CrossRef] [PubMed]
- Schwiertz, A.; Taras, D.; Schafer, K.; Beijer, S.; Bos, N.A.; Donus, C.; Hardt, P.D.; Schäfer, K.; Beijer, S.; Bos, N.A.; et al. Microbiota and SCFA in lean and overweight healthy subjects. Obesity 2010, 18, 190–195. [Google Scholar] [CrossRef] [PubMed]
- Jumpertz, R.; Le, D.S.; Turnbaugh, P.J.; Trinidad, C.; Bogardus, C.; Gordon, J.I.; Krakoff, J. Energy-balance studies reveal associations between gut microbes, caloric load, and nutrient absorption in humans. Am. J. Clin. Nutr. 2011, 94, 58–65. [Google Scholar] [CrossRef] [PubMed] [Green Version]
- Turnbaugh, P.J.; Hamady, M.; Yatsunenko, T.; Cantarel, B.L.; Duncan, A.; Ley, R.E.; Sogin, M.L.; Jones, W.J.; Roe, B.A.; Affourtit, J.P.; et al. A core gut microbiome in obese and lean twins. Nature 2009, 457, 480–487. [Google Scholar] [CrossRef]
- Zweigner, J.; Schumann, R.R.; Weber, J.R. The role of lipopolysaccharide-binding protein in modulating the innate immune response. Microbes Infect. 2006, 8, 946–952. [Google Scholar] [CrossRef]
- Siri, W. Body Composition from Fluid Spaces and Density: Analysis of Methods; National Academy of Sciences: Washington, DC, USA, 1961; Volume 1, ISBN 9788578110796. [Google Scholar]
- IPAQ Research Committee Guidelines for Data Processing and Analysis of the International Physical Activity Questionnaire (IPAQ): Short and Long Forms. Available online: http://www.academia.edu/5346814/Guidelines_for_Data_Processing_and_Analysis_of_the_International_Physical_Activity_Questionnaire_IPAQ_Short_and_Long_Forms_Contents (accessed on 1 June 2017).
- De la Cuesta-Zuluaga, J.; Mueller, N.T.; Corrales-Agudelo, V.; Velásquez-Mejía, E.P.; Carmona, J.A.; Abad, J.M.; Escobar, J.S. Metformin is associated with higher relative abundance of mucin-degrading Akkermansia muciniphila and several short-chain fatty acid–producing microbiota in the gut. Diabetes Care 2017, 40, 54–62. [Google Scholar] [CrossRef]
- Schloss, P.D.; Westcott, S.L.; Ryabin, T.; Hall, J.R.; Hartmann, M.; Hollister, E.B.; Ryan, A.; Oakley, B.B.; Parks, D.H.; Courtney, J.; et al. Introducing mothur: Open-source, platform-independent, community-supported software for describing and comparing microbial communities. Appl. Environ. Microbiol. 2009, 75, 7537–7541. [Google Scholar] [CrossRef]
- DeSantis, T.Z.; Hugenholtz, P.; Larsen, N.; Rojas, M.; Brodie, E.L.; Keller, K.; Huber, T.; Dalevi, D.; Hu, P.; Andersen, G.L. Greengenes, a chimera-checked 16S rRNA gene database and workbench compatible with ARB. Appl. Environ. Microbiol. 2006, 72, 5069–5072. [Google Scholar] [CrossRef] [PubMed]
- Kindt, R.; Coe, R. Tree Diversity Analysis. A Manual and Software for Common Statistical Methods for Ecological and Biodiversity Studies; World Agroforestry Centre (ICRAF): Nairobi, Kenya, 2005; ISBN 92-9059-179-X. [Google Scholar]
- Chen, J.; Bittinger, K.; Charlson, E.S.; Hoffmann, C.; Lewis, J.; Wu, G.D.; Collman, R.G.; Bushman, F.D.; Li, H. Associating microbiome composition with environmental covariates using generalized UniFrac distances. Bioinformatics 2012, 28, 2106–2113. [Google Scholar] [CrossRef] [PubMed] [Green Version]
- Storey, J.D.; Bass, A.J.; Dabney, A.; Robinson, D. qvalue: Q-Value Estimation for False Discovery Rate Control. Available online: http://github.com/jdstorey/qvalue (accessed on 17 April 2018).
- Claesson, M.J.; Cusack, S.; O’Sullivan, O.; Greene-Diniz, R.; de Weerd, H.; Flannery, E.; Marchesi, J.R.; Falush, D.; Dinan, T.; Fitzgerald, G.; et al. Composition, variability, and temporal stability of the intestinal microbiota of the elderly. Proc. Natl. Acad. Sci. USA 2011, 108, 4586–4591. [Google Scholar] [CrossRef] [PubMed]
- De la Cuesta-Zuluaga, J.; Corrales-Agudelo, V.; Velásquez-Mejía, E.P.; Carmona, J.A.; Abad, J.M.; Escobar, J.S. Gut microbiota is associated with obesity and cardiometabolic disease in a population in the midst of Westernization. Sci. Rep. 2018, 8, 11356. [Google Scholar] [CrossRef] [PubMed]
- Clarke, S.F.; Murphy, E.F.; O’Sullivan, O.; Lucey, A.J.; Humphreys, M.; Hogan, A.; Hayes, P.; O’Reilly, M.; Jeffery, I.B.; Wood-Martin, R.; et al. Exercise and associated dietary extremes impact on gut microbial diversity. Gut 2014, 63, 1913–1920. [Google Scholar] [CrossRef] [PubMed] [Green Version]
- Peres-Neto, P.R.; Jackson, D.A. How well do multivariate data sets match? The advantages of a procrustean superimposition approach over the Mantel test. Oecologia 2001, 129, 169–178. [Google Scholar] [CrossRef] [PubMed]
- Forslund, K.; Hildebrand, F.; Nielsen, T.; Falony, G.; Le Chatelier, E.; Sunagawa, S.; Prifti, E.; Vieira-Silva, S.; Gudmundsdottir, V.; Krogh Pedersen, H.; et al. Disentangling type 2 diabetes and metformin treatment signatures in the human gut microbiota. Nature 2015, 528, 262–266. [Google Scholar] [CrossRef] [Green Version]
- Fernandes, J.; Su, W.; Rahat-Rozenbloom, S.; Wolever, T.M.; Comelli, E.M. Adiposity, gut microbiota and faecal short chain fatty acids are linked in adult humans. Nutr Diabetes 2014, 4, e121. [Google Scholar] [CrossRef]
- Teixeira, T.F.S.; Grześkowiak, Ł.; Franceschini, S.C.C.; Bressan, J.; Ferreira, C.L.L.F.; Peluzio, M.C.G. Higher level of faecal SCFA in women correlates with metabolic syndrome risk factors. Br. J. Nutr. 2013, 109, 914–919. [Google Scholar] [CrossRef]
- Ppatil, D.; Pdhotre, D.; Gchavan, S.; Sultan, A.; Jain, D.S.; Lanjekar, V.B.; Gangawani, J.; Sshah, P.; Stodkar, J.; Shah, S.; et al. Molecular analysis of gut microbiota in obesity among Indian individuals. J. Biosci. 2012, 37, 647–657. [Google Scholar] [CrossRef]
- Vogt, J.A.; Wolever, T.M. Fecal acetate is inversely related to acetate absorption from the human rectum and distal colon. J. Nutr. 2003, 133, 3145–3148. [Google Scholar] [CrossRef] [PubMed]
- Binder, H.J. Role of colonic short-chain fatty acid transport in diarrhea. Annu. Rev. Physiol. 2010, 72, 297–313. [Google Scholar] [CrossRef] [PubMed]
- Boets, E.; Deroover, L.; Houben, E.; Vermeulen, K.; Gomand, S.V.; Delcour, J.A.; Verbeke, K. Quantification of in vivo colonic short chain fatty acid production from inulin. Nutrients 2015, 7, 8916–8929. [Google Scholar] [CrossRef]
- Layden, B.T.; Yalamanchi, S.K.; Wolever, T.M.; Dunaif, A.; Lowe, W.L., Jr. Negative association of acetate with visceral adipose tissue and insulin levels. Diabetes Metab. Syndr. Obes. 2012, 5, 49–55. [Google Scholar] [CrossRef] [PubMed]
- Zhao, L.; Zhang, F.; Ding, X.; Wu, G.; Lam, Y.Y.; Shi, Y.; Shen, Q.; Dong, W.; Liu, R.; Ling, Y.; et al. Gut bacteria selectively promoted by dietary fibers alleviate type 2 diabetes. Science 2018, 359, 1151–1156. [Google Scholar] [CrossRef]
- Gao, Z.; Yin, J.; Zhang, J.; Ward, R.E.; Martin, R.J.; Lefevre, M.; Cefalu, W.T.; Ye, J. Butyrate improves insulin sensitivity and increases energy expenditure in mice. Diabetes 2009, 58, 1509–1517. [Google Scholar] [CrossRef] [PubMed]
- Den Besten, G.; Bleeker, A.; Gerding, A.; van Eunen, K.; Havinga, R.; van Dijk, T.H.; Oosterveer, M.H.; Jonker, J.W.; Groen, A.K.; Reijngoud, D.-J.; et al. Short-chain fatty acids protect against high-fat diet-induced obesity via a PPARγ-dependent switch from lipogenesis to fat oxidation. Diabetes 2015, 64, 2398–2408. [Google Scholar] [CrossRef]
- Matheus, V.A.; Monteiro, L.C.S.; Oliveira, R.B.; Maschio, D.A.; Collares-Buzato, C.B. Butyrate reduces high-fat diet-induced metabolic alterations, hepatic steatosis and pancreatic beta cell and intestinal barrier dysfunctions in prediabetic mice. Exp. Biol. Med. 2017, 242, 1214–1226. [Google Scholar] [CrossRef] [Green Version]
- Guo, S.; Al-Sadi, R.; Said, H.M.; Ma, T.Y. Lipopolysaccharide causes an increase in intestinal tight junction permeability in vitro and in vivo by inducing enterocyte membrane expression and localization of TLR-4 and CD14. Am. J. Pathol. 2013, 182, 375–387. [Google Scholar] [CrossRef]
- Cani, P.D.; Amar, J.; Iglesias, M.A.; Poggi, M.; Knauf, C.; Bastelica, D.; Neyrinck, A.M.; Fava, F.; Tuohy, K.M.; Chabo, C.; et al. Metabolic endotoxemia initiates obesity and insulin resistance. Diabetes 2007, 56, 1761–1772. [Google Scholar] [CrossRef]
- Albenberg, L.; Esipova, T.V.; Judge, C.P.; Bittinger, K.; Chen, J.; Laughlin, A.; Grunberg, S.; Baldassano, R.N.; Lewis, J.D.; Li, H.; et al. Correlation between intraluminal oxygen gradient and radial partitioning of intestinal microbiota. Gastroenterology 2014, 147, 1055–1063. [Google Scholar] [CrossRef] [PubMed]
- Shin, N.R.; Whon, T.W.; Bae, J.W. Proteobacteria: Microbial signature of dysbiosis in gut microbiota. Trends Biotechnol. 2015, 33, 496–503. [Google Scholar] [CrossRef] [PubMed]
- Litvak, Y.; Byndloss, M.X.; Tsolis, R.M.; Bäumler, A.J. Dysbiotic Proteobacteria expansion: A microbial signature of epithelial dysfunction. Curr. Opin. Microbiol. 2017, 39, 1–6. [Google Scholar] [CrossRef] [PubMed]
- The Human Microbiome Project Consortium; Huttenhower, C.; Gevers, D.; Knight, R.; Abubucker, S.; Badger, J.H.; Chinwalla, A.T.; Creasy, H.H.; Earl, A.M.; FitzGerald, M.G.; et al. Structure, function and diversity of the healthy human microbiome. Nature 2012, 486, 207–214. [Google Scholar] [CrossRef] [Green Version]
- Napolitano, A.; Miller, S.; Nicholls, A.W.; Baker, D.; Van Horn, S.; Thomas, E.; Rajpal, D.; Spivak, A.; Brown, J.R.; Nunez, D.J. Novel gut-based pharmacology of metformin in patients with type 2 diabetes mellitus. PLoS ONE 2014, 9, e100778. [Google Scholar] [CrossRef]
- Everard, A.; Belzer, C.; Geurts, L.; Ouwerkerk, J.P.; Druart, C.; Bindels, L.B.; Guiot, Y.; Derrien, M.; Muccioli, G.G.; Delzenne, N.M.; et al. Cross-talk between Akkermansia muciniphila and intestinal epithelium controls diet-induced obesity. Proc. Natl. Acad. Sci. USA 2013, 110, 9066–9071. [Google Scholar] [CrossRef] [PubMed] [Green Version]
- Million, M.; Angelakis, E.; Maraninchi, M.; Henry, M.; Giorgi, R.; Valero, R.; Vialettes, B.; Raoult, D. Correlation between body mass index and gut concentrations of Lactobacillus reuteri, Bifidobacterium animalis, Methanobrevibacter smithii and Escherichia coli. Int. J. Obes. 2013, 37, 1460–1466. [Google Scholar] [CrossRef] [PubMed]
- Goodrich, J.K.; Waters, J.L.; Poole, A.C.; Sutter, J.L.; Koren, O.; Blekhman, R.; Beaumont, M.; Van Treuren, W.; Knight, R.; Bell, J.T.; et al. Human genetics shape the gut microbiome. Cell 2014, 159, 789–799. [Google Scholar] [CrossRef]
- Konikoff, T.; Gophna, U. Oscillospira: A central, enigmatic component of the human gut microbiota. Trends Microbiol. 2016, 24, 523–524. [Google Scholar] [CrossRef]
- Louis, S.; Tappu, R.M.; Damms-Machado, A.; Huson, D.H.; Bischoff, S.C. Characterization of the gut microbial community of obese patients following a weight-loss intervention using whole metagenome shotgun sequencing. PLoS ONE 2016, 11, e0149564. [Google Scholar] [CrossRef]
- Ridaura, V.K.; Faith, J.J.; Rey, F.E.; Cheng, J.; Duncan, A.E.; Kau, L.; Griffi, N.W.; Lombard, V.; Henrissat, B.; Bain, J.R.; et al. Gut microbiota from twins discordant for obesity modulate metabolism in mice. Science 2013, 341, 1241214. [Google Scholar] [CrossRef] [PubMed]
- Bäumler, A.J.; Sperandio, V. Interactions between the microbiota and pathogenic bacteria in the gut. Nature 2016, 535, 85–93. [Google Scholar] [CrossRef] [PubMed] [Green Version]


| Variables | All Data | Fecal Butyrate | OTU Richness | ||||||
|---|---|---|---|---|---|---|---|---|---|
| Tertile 1 | Tertile 2 | Tertile 3 | p-Value | Tertile 1 | Tertile 2 | Tertile 3 | p-Value | ||
| n | 441 | 147 | 147 | 147 | 150 | 147 | 144 | ||
| Age (years) | 41 ± 1 | 40 ± 1 | 41 ± 1 | 41 ± 1 | 0.58 | 40 ± 1 | 40 ± 1 | 42 ± 1 | 0.05 * |
| Sex (%males: %females) | 48:52 | 37:63 | 50:50 | 57:43 | 0.002 * | 54:46 | 51:49 | 37:63 | 0.01 * |
| Diet | |||||||||
| Calorie intake (kcal/day) | 1930 ± 21 | 1854 ± 31 | 1957 ± 39 | 1980 ± 38 | 0.05 * | 1938 ± 35 | 1960 ± 39 | 1893 ± 35 | 0.50 |
| Fiber intake (g/day) | 17.7 ± 0.2 | 16.6 ± 0.4 | 18.3 ± 0.4 | 18.2 ± 0.4 | 0.002 * | 17.5 ± 0.4 | 18.1 ± 0.4 | 17.5 ± 0.4 | 0.62 |
| Physical activity | |||||||||
| MET/min/week | 5104 ± 263 | 4160 ± 343 | 5458 ± 548 | 5695 ± 446 | 0.13 | 5538 ± 475 | 5224 ± 438 | 4530 ± 452 | 0.53 |
| Adiposity | |||||||||
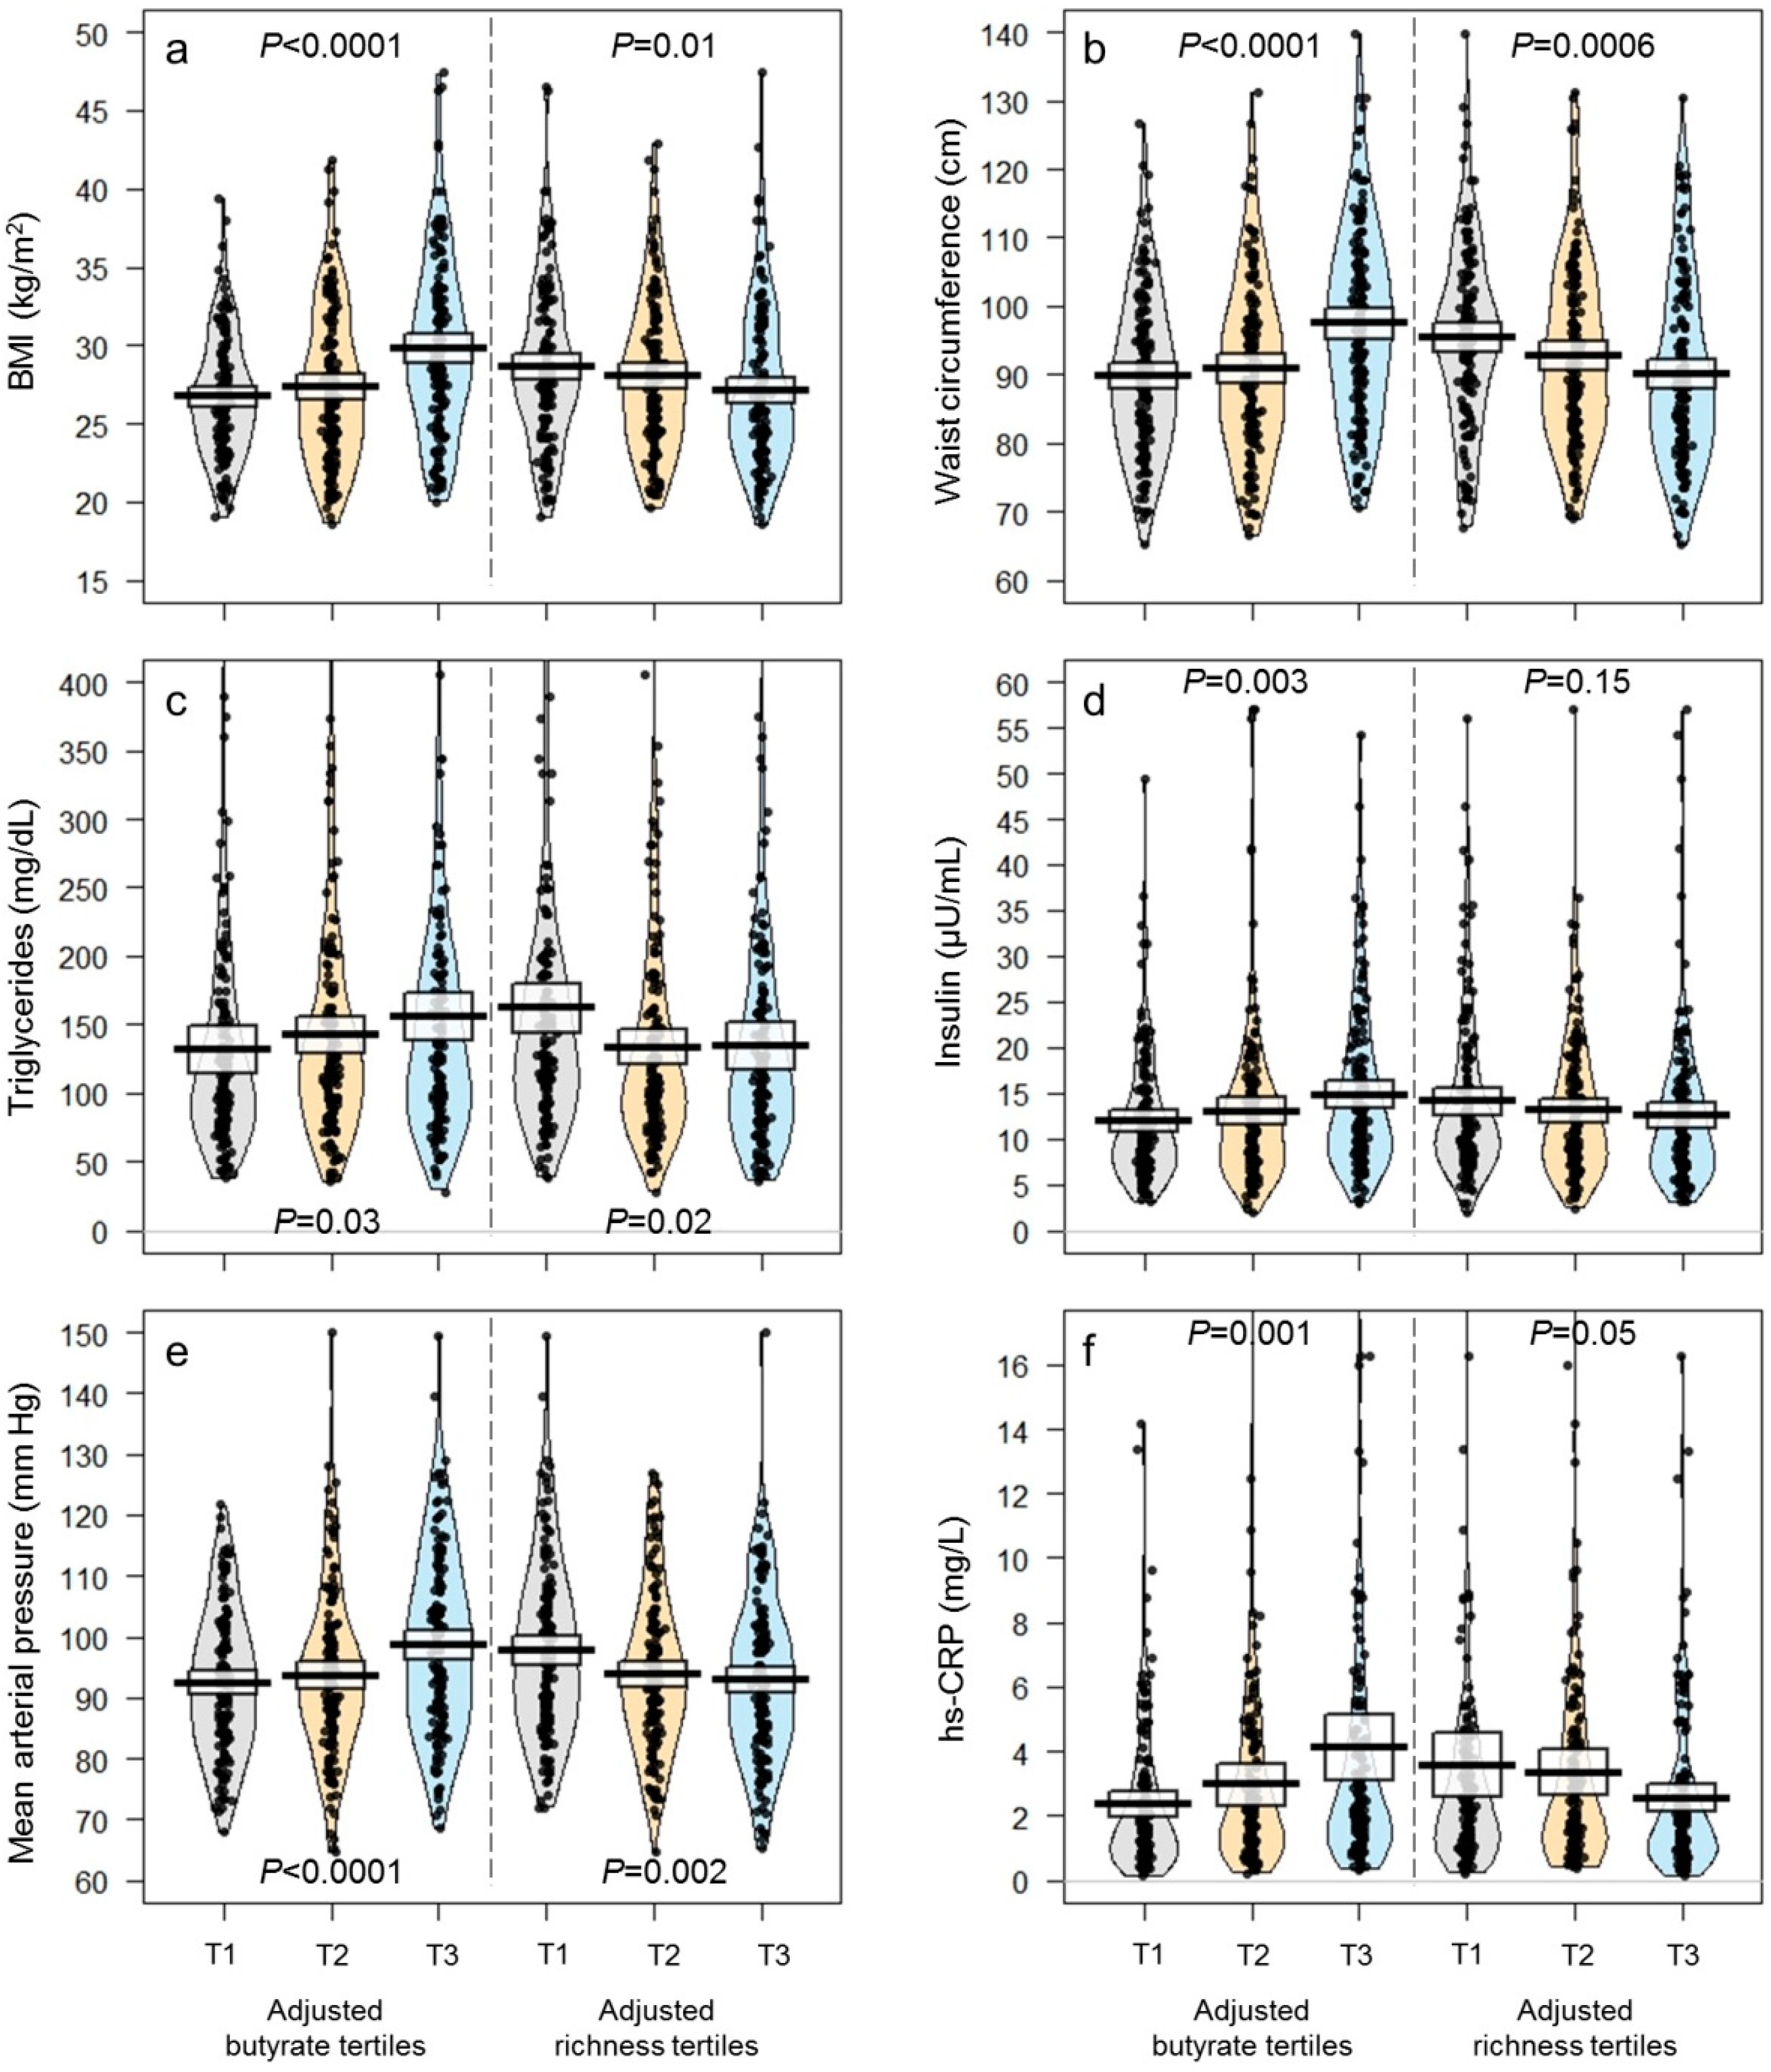
| BMI (kg/m2) | 27.9 ± 0.2 | 26.8 ± 0.3 | 27.5 ± 0.4 | 29.6 ± 0.4 | <0.0001 * | 28.6 ± 0.4 | 28.1 ± 0.4 | 27.1 ± 0.4 | 0.03 * |
| Body fat (%) | 37.2 ± 0.3 | 36.3 ± 0.4 | 37.1 ± 0.5 | 38.1 ± 0.5 | 0.03 * | 37.3 ± 0.5 | 36.6 ± 0.4 | 37.6 ± 0.4 | 0.29 |
| Waist circumference (cm) | 92.8 ± 0.6 | 89.3 ± 0.9 | 91.7 ± 1.1 | 97.3 ± 1.1 | <0.0001 * | 94.6 ± 1.1 | 93.2 ± 1.1 | 90.3 ± 1.1 | 0.01 * |
| Blood chemistry | |||||||||
| HDL (mg/dL) | 46 ± 1 | 47 ± 1 | 46 ± 1 | 45 ± 1 | 0.32 | 43 ± 1 | 47 ± 1 | 48 ± 1 | 0.007 * |
| LDL (mg/dL) | 115 ± 1 | 116 ± 2 | 115 ± 3 | 114 ± 2 | 0.88 | 114 ± 2 | 115 ± 2 | 116 ± 2 | 0.84 |
| VLDL (mg/dL) | 28.7 ± 0.9 | 27.1 ± 1.7 | 28.3 ± 1.7 | 30.8 ± 1.5 | 0.05 * | 31.2 ± 1.7 | 27.2 ± 1.4 | 27.7 ± 1.8 | 0.05 * |
| Triglycerides (mg/dL) | 143 ± 5 | 135 ± 9 | 141 ± 8 | 154 ± 7 | 0.05 * | 157 ± 8 | 136 ± 7 | 137 ± 9 | 0.03 * |
| hs-CRP (mg/L) | 3.2 ± 0.2 | 2.44 ± 0.19 | 3.08 ± 0.36 | 3.93 ± 0.50 | 0.003 * | 3.77 ± 0.50 | 3.15 ± 0.35 | 2.51 ± 0.21 | 0.05 * |
| Glucose (mg/dL) | 89 ± 1 | 87 ± 2 | 90 ± 2 | 91 ± 2 | 0.07 * | 89 ± 1 | 90 ± 2 | 89 ± 2 | 0.73 |
| HbA1c (%) | 5.55 ± 0.03 | 5.49 ± 0.05 | 5.58 ± 0.04 | 5.58 ± 0.05 | 0.25 | 5.49 ± 0.04 | 5.54 ± 0.06 | 5.63 ± 0.05 | 0.10 |
| Insulin (µU/mL) | 13.3 ± 0.4 | 12.0 ± 0.5 | 12.7 ± 0.7 | 15.1 ± 0.8 | 0.004 * | 14.3 ± 0.7 | 12.8 ± 0.7 | 12.6 ± 0.7 | 0.07 * |
| HOMA-IR | 3.12 ± 0.15 | 2.81 ± 0.16 | 3.31 ± 0.37 | 3.25 ± 0.18 | 0.06 * | 3.01 ± 0.18 | 3.42 ± 0.36 | 2.85 ± 0.19 | 0.29 |
| Leptin (ng/mL) | 7.14 ± 0.30 | 7.01 ± 0.56 | 6.68 ± 0.51 | 7.72 ± 0.51 | 0.20 | 7.37 ± 0.54 | 7.16 ± 0.54 | 6.88 ± 0.48 | 0.84 |
| Adiponectin (µg/mL) | 6.8 ± 0.2 | 6.6 ± 0.3 | 7.3 ± 0.4 | 6.5 ± 0.3 | 0.08 * | 6.3 ± 0.3 | 6.7 ± 0.3 | 7.4 ± 0.3 | 0.04 * |
| LBP (µg/mL) | 4.50 ± 0.08 | 4.37 ± 0.13 | 4.56 ± 0.14 | 4.58 ± 0.13 | 0.48 | 4.84 ± 0.14 | 4.35 ± 0.13 | 4.31 ± 0.13 | 0.007 * |
| Blood pressure | |||||||||
| Systolic (mm Hg) | 124 ± 1 | 120 ± 1 | 124 ± 2 | 130 ± 2 | <0.0001 * | 128 ± 2 | 124 ± 1 | 121 ± 1 | 0.002 * |
| Diastolic (mm Hg) | 80 ± 1 | 78 ± 1 | 79 ± 1 | 84 ± 1 | <0.0001 * | 82 ± 1 | 79 ± 1 | 79 ± 1 | 0.03 * |
| Mean (mm Hg) | 95 ± 1 | 92 ± 1 | 94 ± 1 | 99 ± 1 | <0.0001 * | 98 ± 1 | 94 ± 1 | 93 ± 1 | 0.01 * |
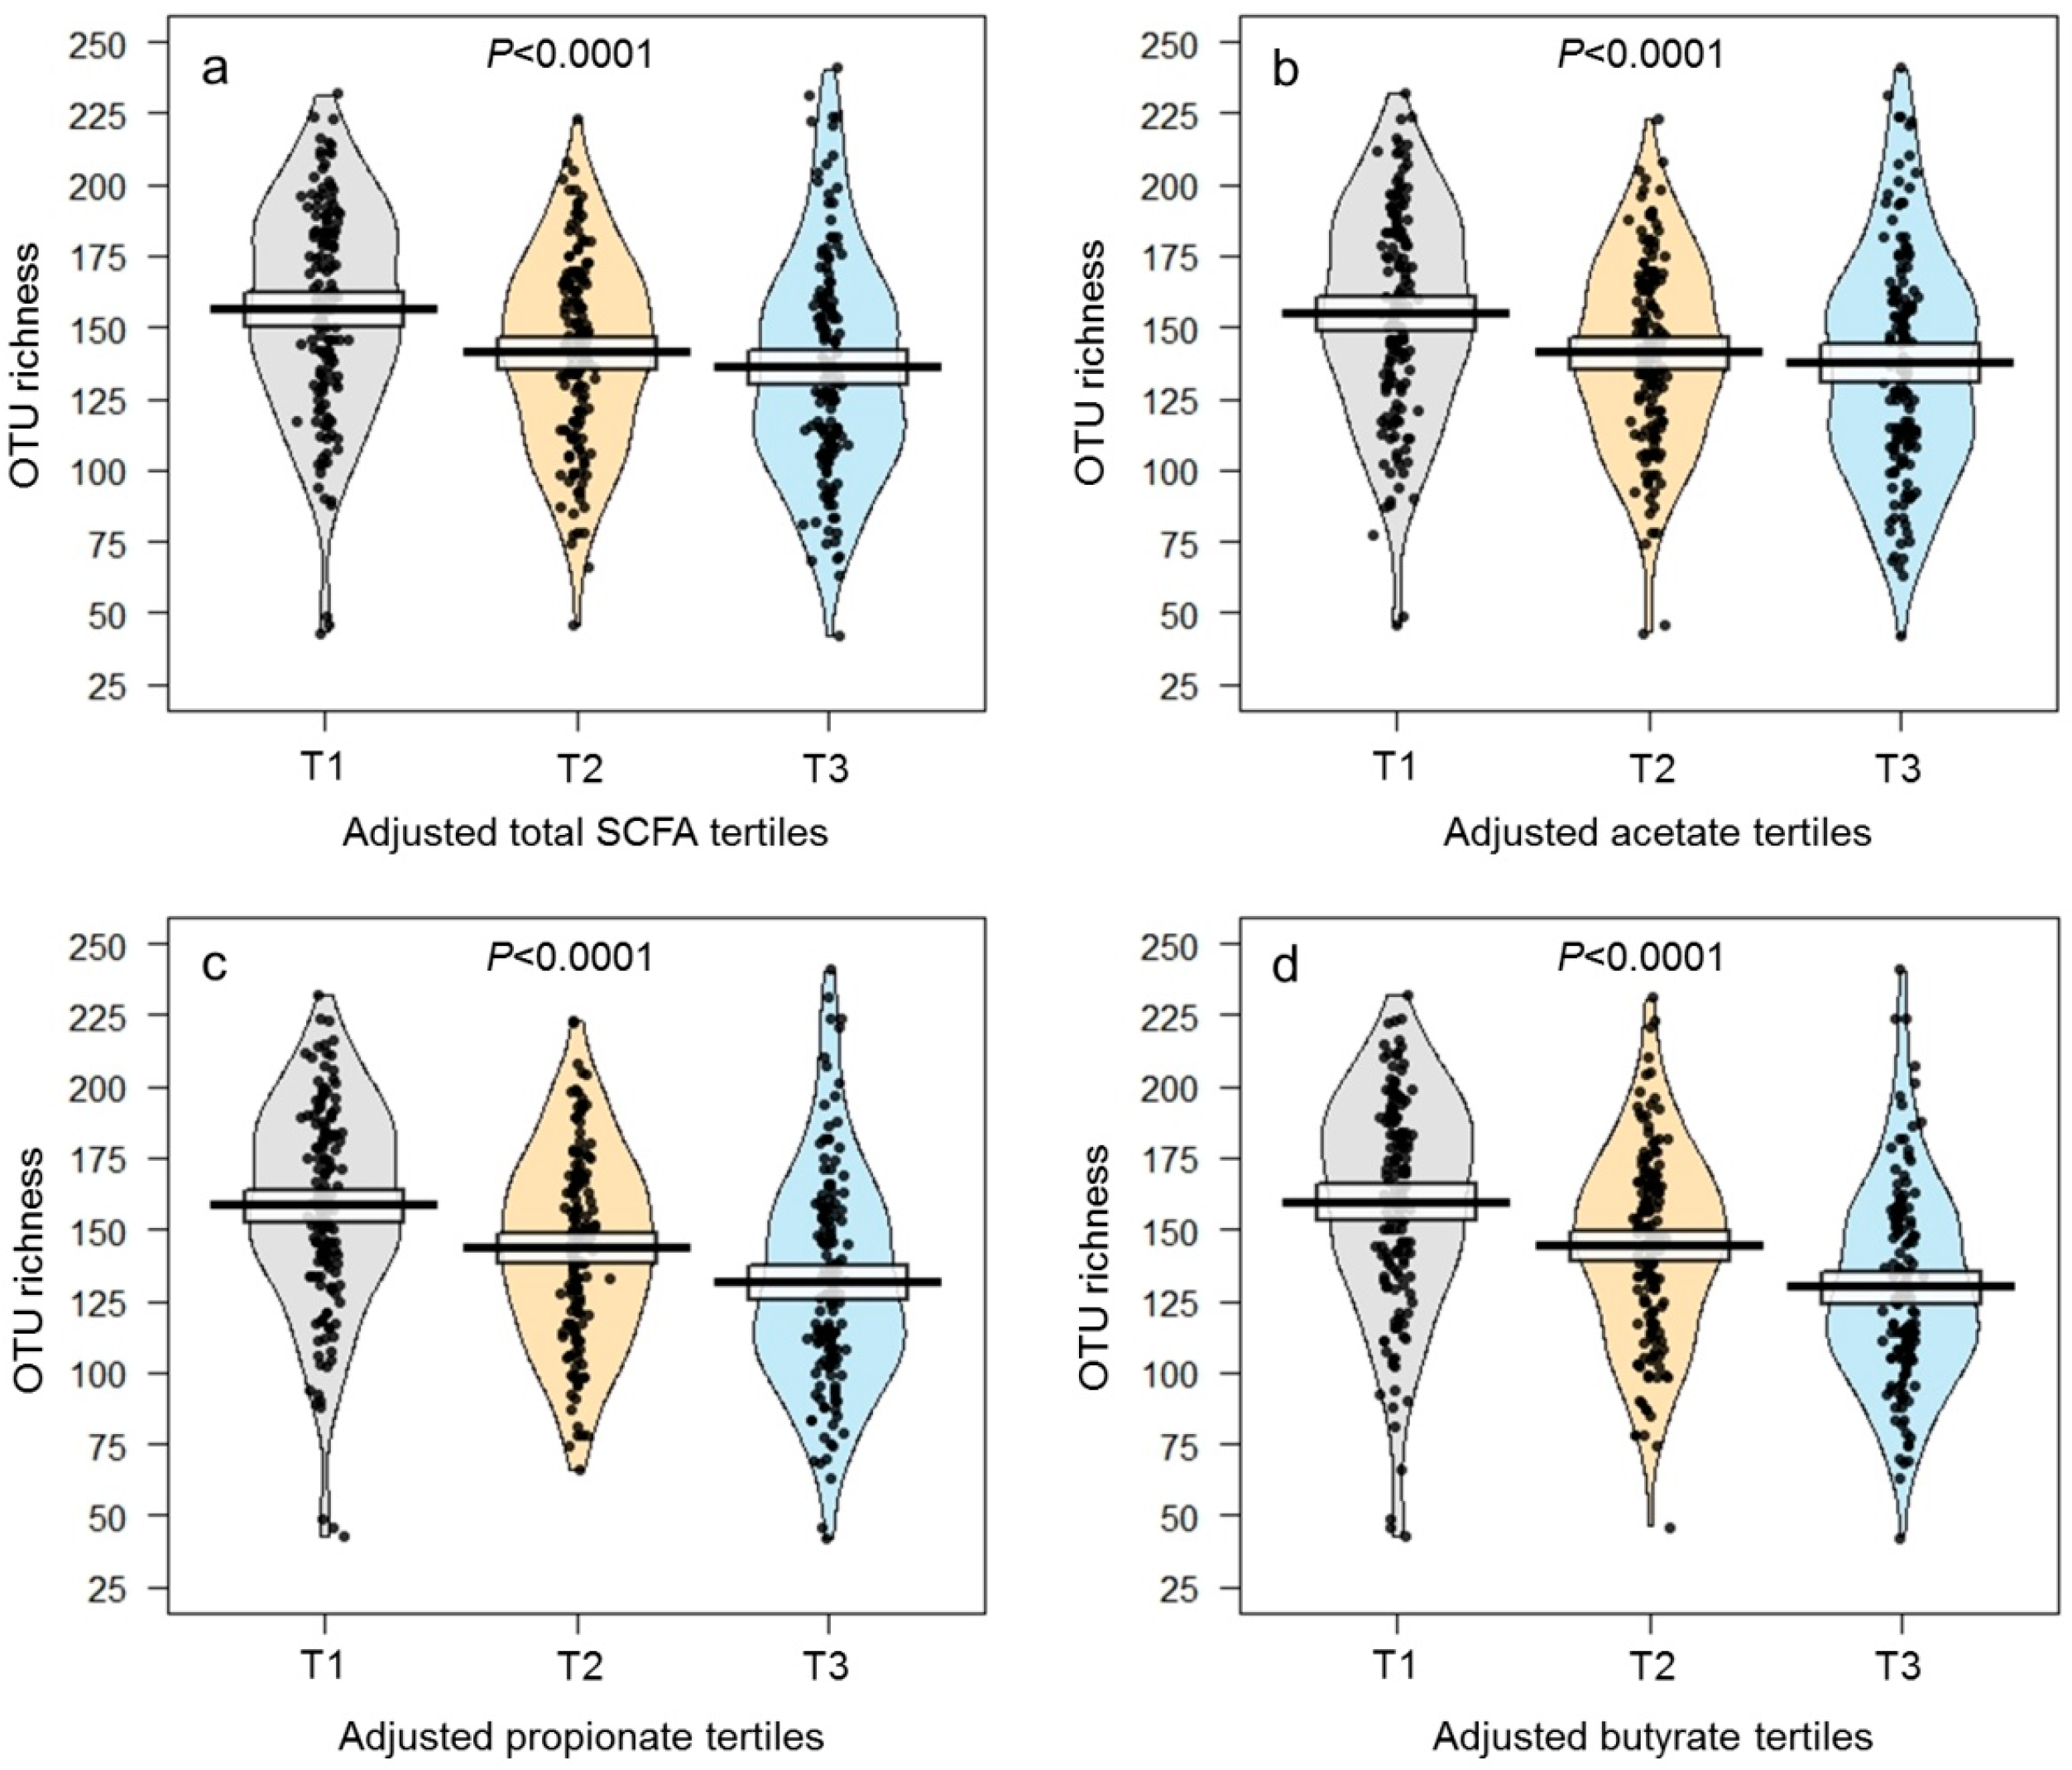
| OTU richness | 144 ± 2 | 158 ± 3 | 143 ± 3 | 133 ± 3 | <0.0001 * | 103 ± 2 | 145 ± 1 | 186 ± 1 | <0.0001 * |
| Fecal SCFAs | |||||||||
| Total SCFAs (µmol/g) | 5.60 ± 0.36 | 1.22 ± 0.10 | 4.19 ± 0.25 | 11.39 ± 0.83 | <0.0001 * | 7.02 ± 0.57 | 5.06 ± 0.43 | 4.67 ± 0.79 | <0.0001 * |
| Acetate (µmol/g) | 3.83 ± 0.24 | 0.94 ± 0.08 | 3.00 ± 0.22 | 7.55 ± 0.53 | <0.0001 * | 4.56 ± 0.40 | 3.53 ± 0.31 | 3.38 ± 0.50 | 0.0004 * |
| Propionate (µmol/g) | 1.18 ± 0.10 | 0.19 ± 0.02 | 0.81 ± 0.06 | 2.54 ± 0.24 | <0.0001 * | 1.66 ± 0.15 | 1.00 ± 0.10 | 0.88 ± 0.22 | <0.0001 * |
| Butyrate (µmol/g) | 0.59 ± 0.04 | 0.09 ± 0.01 | 0.38 ± 0.01 | 1.29 ± 0.11 | <0.0001 * | 0.80 ± 0.07 | 0.54 ± 0.04 | 0.41 ± 0.10 | <0.0001 * |
| Isobutyrate (µmol/g) | 0.04 ± 0.01 | 0.01 ± 0.001 | 0.03 ± 0.002 | 0.08 ± 0.02 | <0.0001 * | 0.03 ± 0.003 | 0.03 ± 0.003 | 0.05 ± 0.02 | 0.25 |
| Total SCFAs | Acetate | Propionate | Butyrate | Isobutyrate | OTU Richness | |
|---|---|---|---|---|---|---|
| Adiposity | ||||||
| BMI | 0.28 * | 0.26 * | 0.29 * | 0.25 * | 0.13 * | −0.11 * |
| Body fat | 0.13 * | 0.12 * | 0.14 * | 0.11 * | 0.09 | −0.06 |
| Waist circumference | 0.26 * | 0.23 * | 0.28 * | 0.24 * | 0.14 * | −0.19 * |
| Blood chemistry | ||||||
| HDL | −0.10 * | −0.08 | −0.13 * | −0.11 * | −0.06 | 0.15 * |
| LDL | −0.02 | −0.02 | −0.01 | 0.00 | 0.01 | 0.03 |
| VLDL | 0.14 * | 0.12 * | 0.18 * | 0.14 * | 0.02 | −0.15 * |
| Triglycerides | 0.14 * | 0.12 * | 0.18 * | 0.15 * | 0.02 | −0.16 * |
| hs-CRP | 0.18 * | 0.16 * | 0.19 * | 0.24 * | 0.14 * | −0.11 * |
| Glucose | 0.10 | 0.10 | 0.12 * | 0.04 | 0.05 | −0.06 |
| HbA1c | 0.12 * | 0.14 * | 0.10 | 0.06 | 0.11 * | 0.02 |
| Insulin | 0.18 * | 0.16 * | 0.19 * | 0.17 * | 0.11 * | −0.10 |
| HOMA-IR | 0.09 | 0.07 | 0.09 | 0.08 | 0.04 | −0.06 |
| Leptin | 0.06 | 0.06 | 0.07 | 0.06 | 0.06 | 0.01 |
| Adiponectin | −0.05 | −0.04 | −0.07 | −0.06 | −0.01 | 0.13 * |
| LBP | 0.18 * | 0.17 * | 0.17 * | 0.17 * | 0.07 | −0.12 * |
| Blood pressure | ||||||
| Systolic | 0.22 * | 0.19 * | 0.25 * | 0.23 * | 0.07 | −0.21 * |
| Diastolic | 0.19 * | 0.16 * | 0.23 * | 0.21 * | 0.04 | −0.16 * |
| Mean | 0.21 * | 0.18 * | 0.25 * | 0.23 * | 0.06 | −0.19 * |
| OTU richness | −0.28 * | −0.21 * | −0.35 * | −0.33 * | −0.06 | — |
| Fecal SCFAs | ||||||
| Total SCFAs | — | 0.98 * | 0.93 * | 0.86 * | 0.43 * | −0.28 * |
| Acetate | 0.98 * | — | 0.88 * | 0.78 * | 0.39 * | −0.21 * |
| Propionate | 0.93 * | 0.88 * | — | 0.86 * | 0.41 * | −0.35 * |
| Butyrate | 0.86 * | 0.78 * | 0.86 * | — | 0.51 * | −0.33 * |
| Isobutyrate | 0.43 * | 0.39 * | 0.41 * | 0.51 * | — | −0.06 |
| Fecal Butyrate | OTU Richness | |||||
|---|---|---|---|---|---|---|
| Tertile 1 | Tertile 2 | Tertile 3 | Tertile 1 | Tertile 2 | Tertile 3 | |
| Obesity 1 | N = 80 | N = 93 | N = 90 | N = 80 | N = 86 | N = 97 |
| Unadjusted model | Referent | 1.12 (0.91, 1.33) | 1.72 (1.51, 1.93) | Referent | 0.91 (0.69, 1.12) | 0.75 (0.55, 0.95) |
| Confounder-adjusted model 4 | Referent | 1.22 (1.02, 1.43) | 1.95 (1.74, 2.16) | Referent | 0.98 (0.77, 1.20) | 0.72 (0.52, 0.93) |
| Confounder-adjusted 4 + LBP model | Referent | 1.08 (0.88, 1.29) | 1.73 (1.52, 1.94) | Referent | 1.05 (0.84, 1.27) | 0.78 (0.58, 0.98) |
| Central obesity 2 | N = 144 | N = 143 | N = 144 | N = 144 | N = 144 | N = 143 |
| Unadjusted model | Referent | 1.22 (1.06, 1.39) | 1.56 (1.40, 1.73) | Referent | 0.95 (0.78, 1.12) | 0.96 (0.79, 1.12) |
| Confounder-adjusted model 4 | Referent | 1.22 (1.06, 1.39) | 1.54 (1.37, 1.71) | Referent | 0.97 (0.80, 1.13) | 0.92 (0.75, 1.09) |
| Confounder-adjusted 4 + LBP model | Referent | 1.10 (0.93, 1.27) | 1.39 (1.22, 1.55) | Referent | 0.99 (0.82, 1.15) | 0.97 (0.80, 1.14) |
| Hypertension 3 | N = 144 | N = 143 | N = 144 | N = 144 | N = 144 | N = 143 |
| Unadjusted model | Referent | 1.16 (0.99, 1.32) | 1.33 (1.16, 1.49) | Referent | 0.91 (0.74, 1.07) | 0.98 (0.82, 1.15) |
| Confounder-adjusted model 4 | Referent | 1.12 (0.96, 1.29) | 1.31 (1.14, 1.47) | Referent | 0.92 (0.76, 1.09) | 0.89 (0.73, 1.06) |
| Confounder-adjusted 4 + LBP model | Referent | 1.08 (0.91, 1.24) | 1.25 (1.08, 1.42) | Referent | 0.92 (0.76, 1.09) | 0.90 (0.73, 1.06) |
© 2018 by the authors. Licensee MDPI, Basel, Switzerland. This article is an open access article distributed under the terms and conditions of the Creative Commons Attribution (CC BY) license (http://creativecommons.org/licenses/by/4.0/).
Share and Cite
De la Cuesta-Zuluaga, J.; Mueller, N.T.; Álvarez-Quintero, R.; Velásquez-Mejía, E.P.; Sierra, J.A.; Corrales-Agudelo, V.; Carmona, J.A.; Abad, J.M.; Escobar, J.S. Higher Fecal Short-Chain Fatty Acid Levels Are Associated with Gut Microbiome Dysbiosis, Obesity, Hypertension and Cardiometabolic Disease Risk Factors. Nutrients 2019, 11, 51. https://doi.org/10.3390/nu11010051
De la Cuesta-Zuluaga J, Mueller NT, Álvarez-Quintero R, Velásquez-Mejía EP, Sierra JA, Corrales-Agudelo V, Carmona JA, Abad JM, Escobar JS. Higher Fecal Short-Chain Fatty Acid Levels Are Associated with Gut Microbiome Dysbiosis, Obesity, Hypertension and Cardiometabolic Disease Risk Factors. Nutrients. 2019; 11(1):51. https://doi.org/10.3390/nu11010051
Chicago/Turabian StyleDe la Cuesta-Zuluaga, Jacobo, Noel T. Mueller, Rafael Álvarez-Quintero, Eliana P. Velásquez-Mejía, Jelver A. Sierra, Vanessa Corrales-Agudelo, Jenny A. Carmona, José M. Abad, and Juan S. Escobar. 2019. "Higher Fecal Short-Chain Fatty Acid Levels Are Associated with Gut Microbiome Dysbiosis, Obesity, Hypertension and Cardiometabolic Disease Risk Factors" Nutrients 11, no. 1: 51. https://doi.org/10.3390/nu11010051