Comparison of the Financial Standing of Companies Generating Electricity from Renewable Sources and Fossil Fuels: A New Hybrid Approach


Department of Operations Research, Faculty of Computer Science and Management, Wrocław University of Science and Technology, Wyb. Wyspiańskiego 27, 50-370 Wrocław, Poland
Energies 2019, 12(20), 3856; https://doi.org/10.3390/en12203856
Submission received: 11 September 2019
/
Revised: 30 September 2019
/
Accepted: 10 October 2019
/
Published: 12 October 2019
(This article belongs to the Special Issue Economics of Sustainable and Renewable Energy Systems)
Abstract
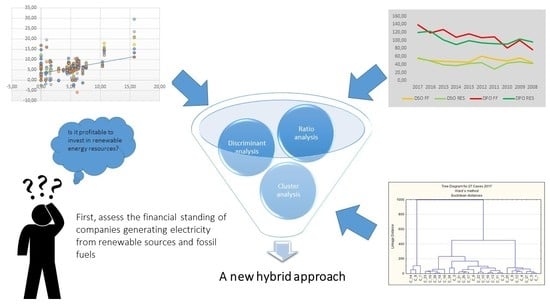
:Companies operating in the energy sector are under pressure to boost the level of green energy production. The use of renewable energy sources will have a positive impact on the environment, but the basic question is whether power plants that produce electricity using renewable energy sources are in better financial condition than those that use only traditional energy sources. We address the latter using a new hybrid approach that extends prior research by combining three analyses: ratio analysis with a large set of indicators, the Altman model and cluster analysis. To test the statistical significance of differences between groups, Student’s t-test is applied. The sample concerns companies from the Baltic States and Central Europe in the years 2008–2017. The results indicate that in most cases there is no statistical difference in the financial standing of companies that use renewable energy sources and those that generate only fossil fuel-based energy.
1. Introduction
The majority of the global energy supply depends on fossil fuels (FF), sources of which are unevenly distributed across world regions, creating meaningful energy security challenges. Moreover, there has been a significant increase in energy demand, consumption, and climate change caused by economic and social development in the world economy. To react to the challenges and to improve the security of the energy supply, diversification and utilization of renewable energy resources (RER) are two of the crucial topics for debate among policymakers and researchers. The local availability, cleanliness, eco-friendliness, and sustainability of RER have caused some economists and policymakers to agree that the only way to achieve an improvement in environmental sustainability is through greater consumption of RER [1]. This means increasing energy production using mainly biomass, geothermal, photovoltaic, high-temperature solar thermal, wind, and non-utility hydro resources.
Thus there has been increased interest in the renewable energy sector (RES). The RES has achieved vast growth from a very small base in the global economy during recent decades and is still a small share of the total energy supply. The International Energy Agency (IEA) pointed out that renewable energy will be the fastest-growing factor of global energy supply, with a high annual growth rate. The contributions of the private sector in this area are crucial. These contributions include the exploration of new energy reserves; the adoption and promotion of clean energy technologies; and the provision of affordable, secure, and reliable energy to end consumers. Nevertheless, businesses operating in the energy sector have recently been under serious financial threat as a result of the plunge in oil prices, which has led to the calling off or delay of planned infrastructure and exploration tasks, while shrinking the prospects of investments already under implementation. Consequently, the viability of power plants is a timely topic, notably in a global context, bearing in mind the developments in the economic/business environment and the energy sector itself [2].
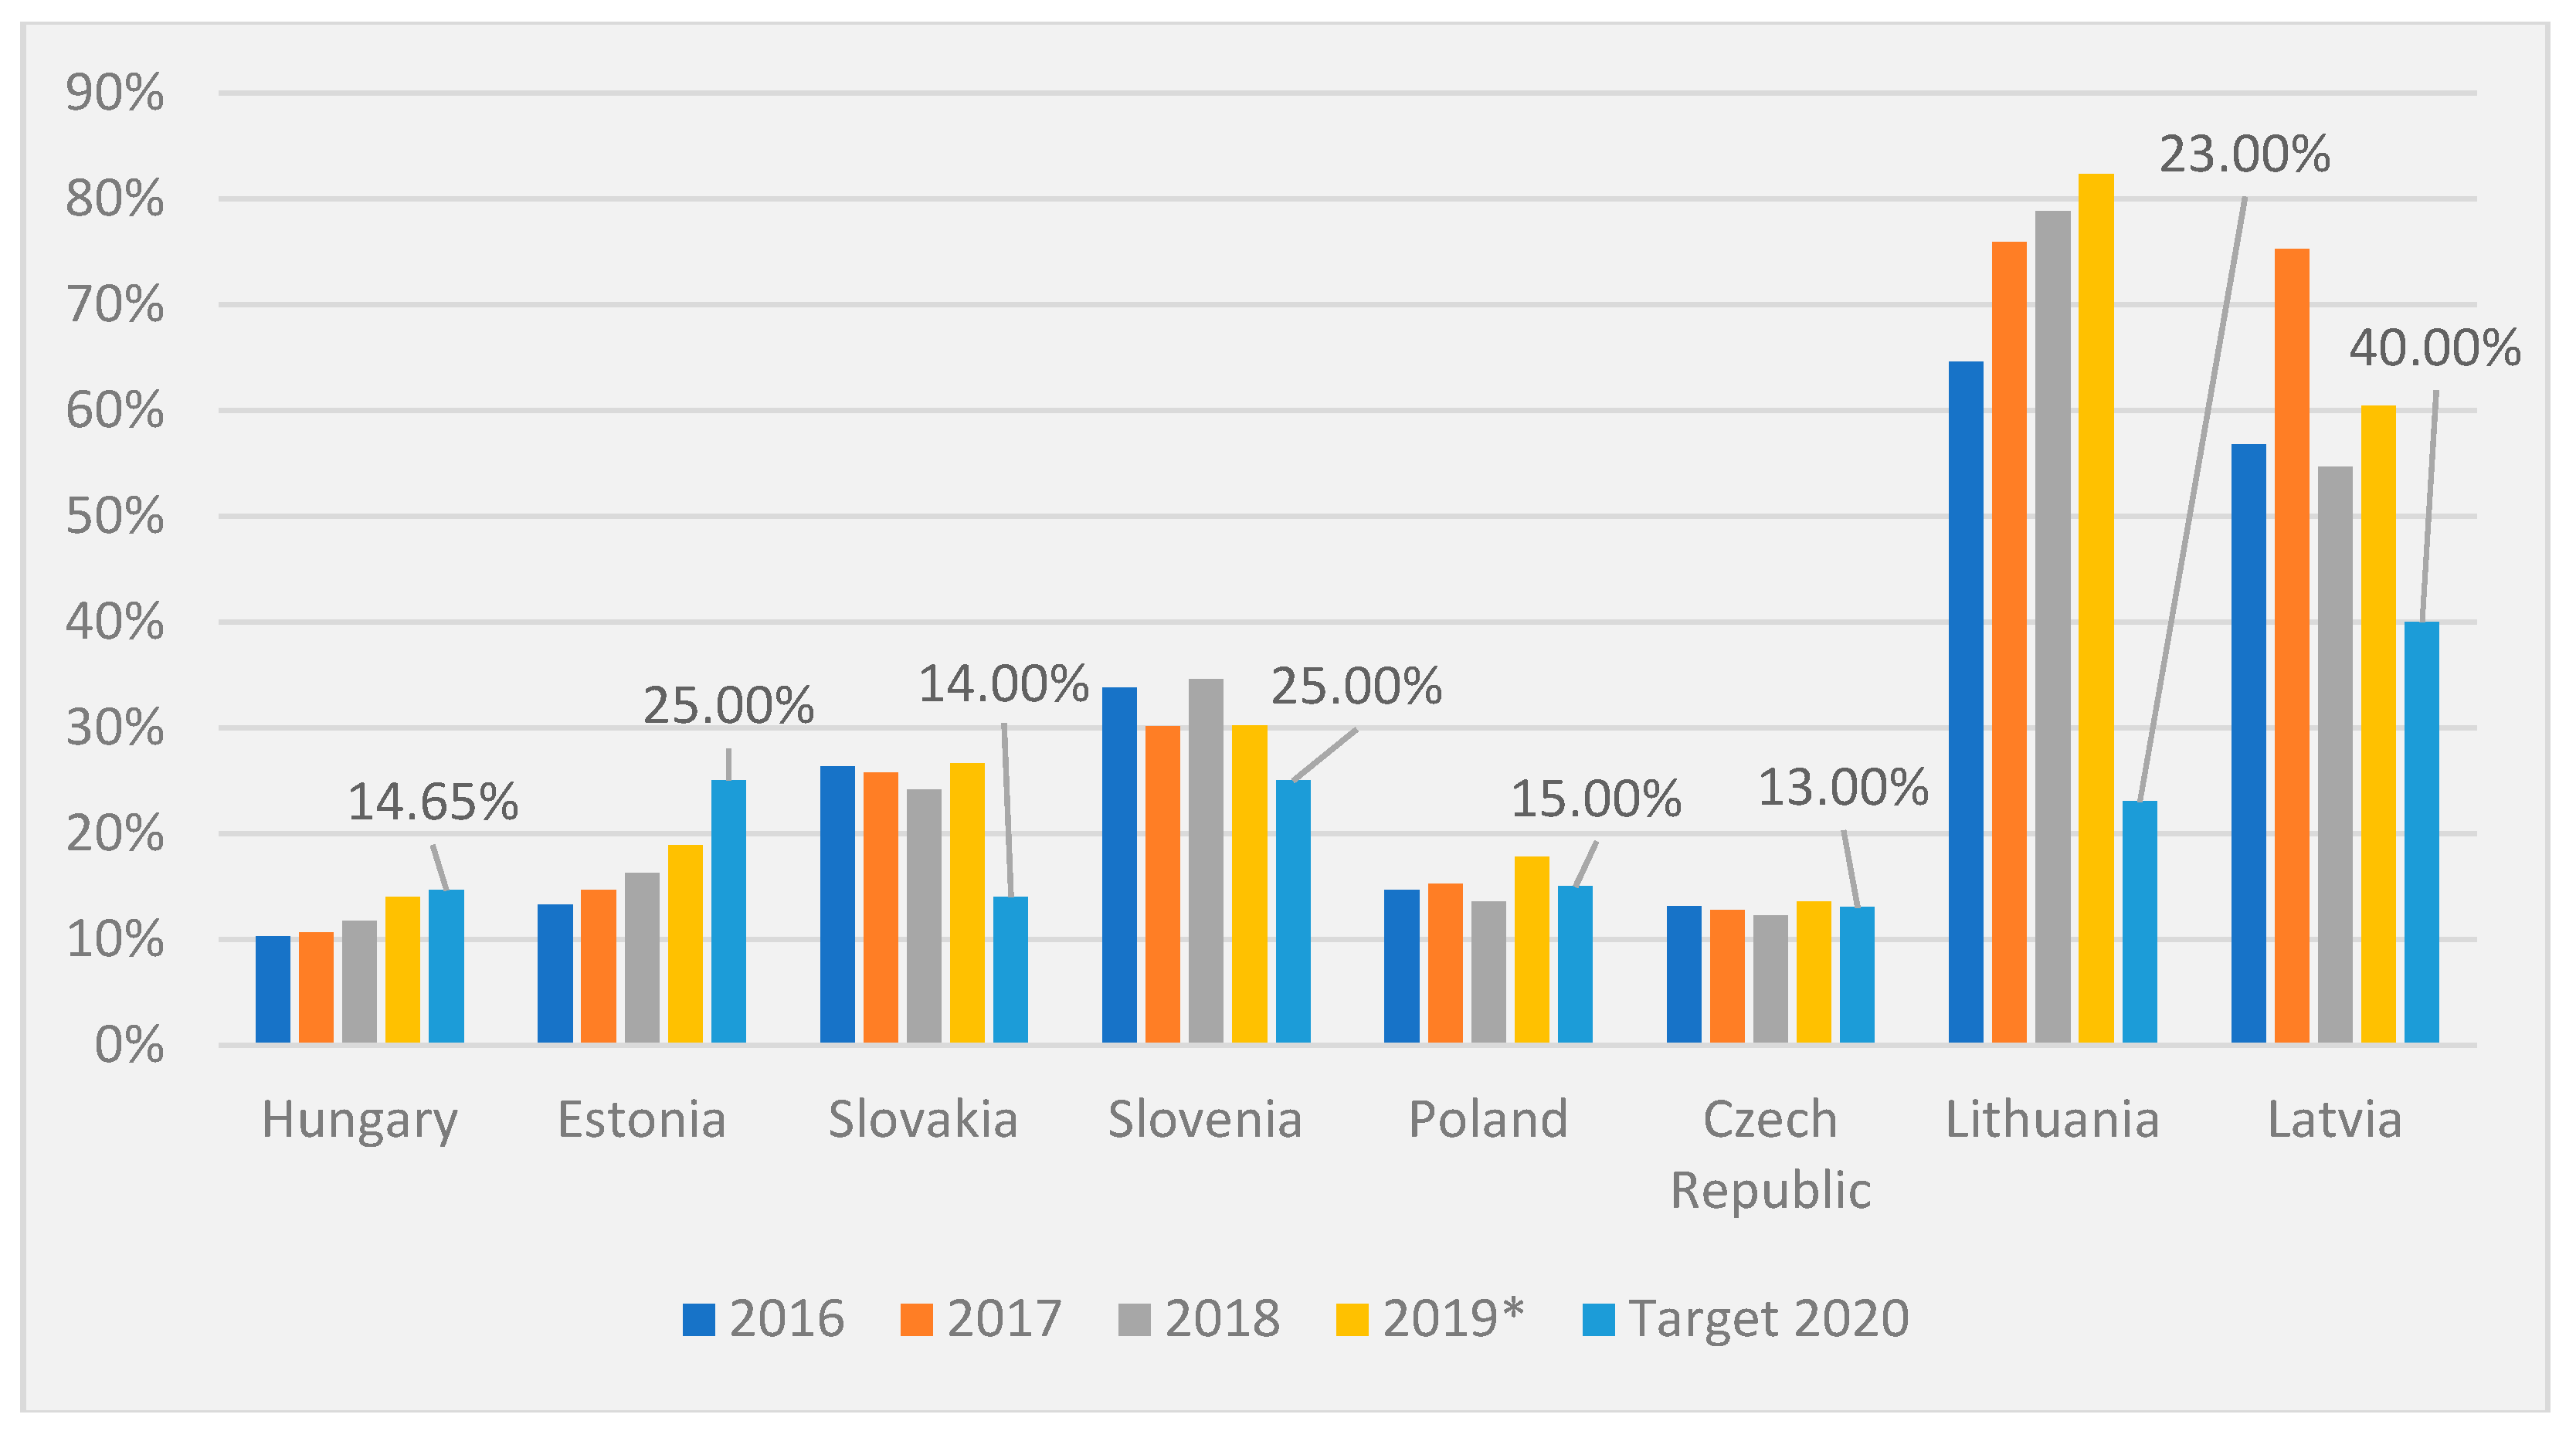
Therefore some countries have decided to increase the share of energy from renewable sources. For instance, the EU countries assumed an obligation to boost by 20% the share of energy from RES in the gross final consumption of energy by 2020. Each EU member established its own target depending on the self-supply and an amount of RES and other conditions. The 20% target represented an average among all EU Member States. Figure 1 shows electricity generation from renewable sources for the Baltic States and Central European countries for the period of 1990–2018. The Baltic States assumed obligations of 23% for Lithuania, 25% for Estonia, and 40% for Latvia. According to data provided by the IEA, Lithuania and Latvia achieved the target for 2020 much earlier, and only Estonia needs to increase its share of RES to fulfil the obligation (see Figure 2). In turn, Central European countries have established the following renewable energy targets: 13% for the Czech Republic, 14.65% for Hungary, 14% for Slovakia, 15% for Poland, and 25% for Slovenia. Slovakia and Slovenia have reached their goals so far. On the other hand, Poland and the Czech Republic are struggling to accomplish their targets on time. The year 2019 is very promising because according to data from January to May they have reached the objective. The share of RES in Hungary is still under the target [3,4].
Thus, there has been increased interest in calculating the returns of the energy sector, especially of RES companies. Some research has examined the relationships among renewable energy stocks, changes in the oil price, other equity indices, carbon prices and carbon pass-through rates, e.g., [5,6,7,8,9,10,11]. Other studies have aimed attention at financial performance [12,13,14,15] and the relationship between corporate environmental performance and financial performance [16,17,18,19]. Work has also been undertaken on corporate social responsibility and competitiveness [20], environmental performance [21,22], productivity and efficiency [23], and corporate failure and financial distress [2,24].
Based on the literature review, it can be stated that the financial performance of electricity producers in most cases was evaluated using profitability ratios e.g., [15,17,18]. Some research added cluster analysis besides ratio analysis [12,13] and the Altman model for non-stock firms [24]. Therefore, the purpose of this article is to assess and compare the financial standing of companies that generate fossil fuel energy with those that generate renewable energy. The fundamental question is whether power plants that are producing energy using renewable energy sources exhibit better financial condition than companies that are producing energy using fossil fuel resources. The approach we take is a new hybrid one that extends prior research by combining a few analyses. The new hybrid approach will help compare and assess the financial condition not only by evaluating the individual values of indicators (ratio analysis), but also by assessing a company as a whole (the Altman model, cluster analysis) as well as checking the statistical significance of differences between the means of analysed groups of companies. The analysis extends prior surveys on the financial performance of power producers, combining analysis of more financial ratios and cluster analysis as well as analysis of the Altman model for emerging markets. Moreover, we adopt a broader approach covering the Baltic States and Central European countries, instead of focusing only on a single country (e.g., Poland). Furthermore, the analysis was made in the period 2008–2017 on 37 power plants (imbalanced data set in each country) that operate in Poland (19), Hungary (6), Slovakia (6), the Czech Republic (2), and one each from Estonia, Latvia, Lithuania, and Slovenia. The companies were divided into two groups: green for RES companies and red for FF companies. For examining dissimilarities between the means in the two groups, the Student’s t-test was applied.
This paper is organized into five sections. Following this introduction, Section 2 characterizes data and methods used to analyse the financial standing of companies. Section 3 shows the results of the analysis. Section 4 provides discussion comparing the results with those gleaned from other studies internationally. Finally, the article ends with conclusions in Section 5.
2. Data and Methods
To assess and compare the financial standing of FF companies (red group) with RES companies (green group), the following methodology was developed and followed in this work. This includes several overall phases. First we collected data from the financial reports of companies. The financial reports were downloaded from the EMIS database (EMIS stands for Emerging Markets Information Service, a Euromoney Institutional Investor Company, www.emis.com). The sample consists of companies that produce energy from coal and companies that produce energy using renewable energy sources (imbalanced data set). The main criterion was to select companies from the following sectors: Fossil Fuel Electric Power Generation; Wind Electric Power Generation; Solar Electric Power Generation; Biomass Electric Power Generation operating in Central-East Europe. Because of this restriction (and the available data), the analysed sample is limited to 37 companies that operate in Poland (19), Hungary (6), Slovakia (6), Czech Republic (2), Estonia (1), Latvia (1), Lithuania (1), and Slovenia (1), see Table 1.
Each company profile was checked to verify which ones produce energy using RES. The RES companies were classified as ‘green’ companies and are listed in Table 2. The remaining companies were labelled ‘red’; two companies, Zvolenska teplarenska and Vertesi Eromu, were excluded from the analysis because it was difficult to classify them to one of the groups. According to the data in Table 2, the most energy from RES was produced by Slovenske Elektrarne. In turn, Energa had the largest RES share in the structure of fuels used to generate electricity.
The second phase was to select and calculate the financial ratios that fully describe the companies based on the gathered financial reports. Sixteen financial ratios were selected from 64 indicators, following the work of Zięba, Tomczak, and Tomczak [25]. The specified indicators were chosen from four groups: liquidity, profitability, turnover, and debt (see Table 3). These ratios have often been used in financial analysis and bankruptcy prediction models.
The final phase was to perform the new hybrid analytic approach, which gives a broader point of view of the assessment of the financial standing of the analysed groups of power plants by taking into account three analyses: the ratio analysis, the Altman model and the cluster analysis, and the Student’s t-test. The Student’s t-test is a commonly applied method for examining dissimilarities between the means in two groups or clusters. In this particular case there were differences in mean values in the two defined groups of values of the indicators. With this test, one can assess whether the existing difference in the means of tested groups is statistically significant.
The ratio analysis was performed on the basis of the 16 financial ratios listed in Table 3. After the analysis, the Altman model was used for the overall assessment of the financial condition of the surveyed enterprises. Note, that in the study, the so-called Z″-Score model for emerging markets was applied. We did not use the first Altman model from 1968 which was constructed for the US market. The Z″-Score model was verified by Altman et al. [26], who analysed the performance of various Altman models for companies from 31 European and three non-European countries (China, Colombia, and the United States). These companies were mostly privately held, and a large number are from non-manufacturing industries. Cross-country studies were very promising. Altman et al. [26] concluded that the general performance of Z″-Score model was quite good for most countries (the prediction accuracy was approximately 75% and it can be boosted to 90% by using country-specific estimation that includes extra ratios).
The Z″-Score model (in the text below referred to as the ‘Altman model’) consists of four ratios [27]:
where:
Z″ = 3.25 + (6.56 × A) + (3.26 × B) + (6.72 × C) + (1.05 × D)
- A = (Current Assets − Current Liabilities)/Total Assets,
- B = Retained Earnings/Total Assets,
- C = Earnings Before Interest and Taxes/Total Assets, and
- D = Book Value of Equity/Total Liabilities.
In the model, if the ZM value is greater than 2.6, then a company is classified as being within a “safe zone” and has a low probability of bankruptcy. However, if the ZM value oscillates between 2.6 and 1.1, then the company falls within a “grey zone”, which means it has an average risk of filing for bankruptcy. On the other hand, if the ZM value is below 1.1, then the company is within a “distress zone”, which means that there is a very high probability of going bankrupt.
In turn, cluster analysis uses the distance between clusters of objects (in this case companies). The two closest clusters merge into a new joint cluster based on the distance between them. Cluster analysis allows one to define the number of classes (in this case the number of classes of the financial condition of companies). For the purpose of this article, the agglomeration methods of cluster analysis were used because the number of classes is not known in advance. The result of this method is a tree of connections, the so-called dendrogram. Using this method, the researcher subjectively determines the number of clusters designating the tree cut-off line. Initially, in the agglomeration methods, it is assumed that each observation is a small concentration, i.e. each company, is an element of the input matrix of distances D. The matrix D is looking for the shortest distance between the clusters of observation.
where:
- = distance r from the r′-group,
- = distance of i object from i′ object,
- = number of elements in group r,
- z = number of groups.
Then, in the next steps, the two closest clusters merge into a new joint cluster. As a result, the number of clusters in the data set is reduced by one in each step. Ultimately, all objects are part of one large cluster. In order to construct this tree of connections, Ward’s method and the Euclidean distance were used, which determined the cluster for the selected financial indicators. In Ward’s method [28], the distance between two clusters of observations cannot be explicitly determined by the distance between observations belonging to these groups. Two clusters of observations, while creating a tree of connections, at any stage, are combined into one cluster in such a way as to minimize the sum of squares of deviations of all observations from these two clusters from the centre of gravity of the new cluster which will result from joining two clusters. The method aims to combine observations in such a way that the resulting variance of the features describing the objects in the new cluster is as low as possible:
where: = distance i″ of the object belonging to the newly formed r″ group from the centre of gravity of this group:
3. Results
The outcome of the research was processed using Statistica 13.3. (StatSoft Polska Sp. z o.o., Cracow, Poland). The values of the analysed indicators used for the Student’s t-test and cluster analysis should have a normal distribution. Therefore, using the filter in Statistica, extreme values and outliers were removed. The new hybrid approach consists of several steps. The first step is to analyse individual groups of financial ratios and the statistical differences between the values. Thus it will be known whether there are statistically significant differences between analysed ratios. This step does not assess the company as a whole. Therefore the second step is to calculate a synthetic ratio that is commonly used in cross-country studies. The results of the synthetic ratio between the groups are also compared statistically. The final step is to check the distance between the groups based on selected financial ratios. This approach provides a broader spectrum of the assessment of the financial condition of the surveyed groups of enterprises.
3.1. Ratio Analysis and Student’s T-Test
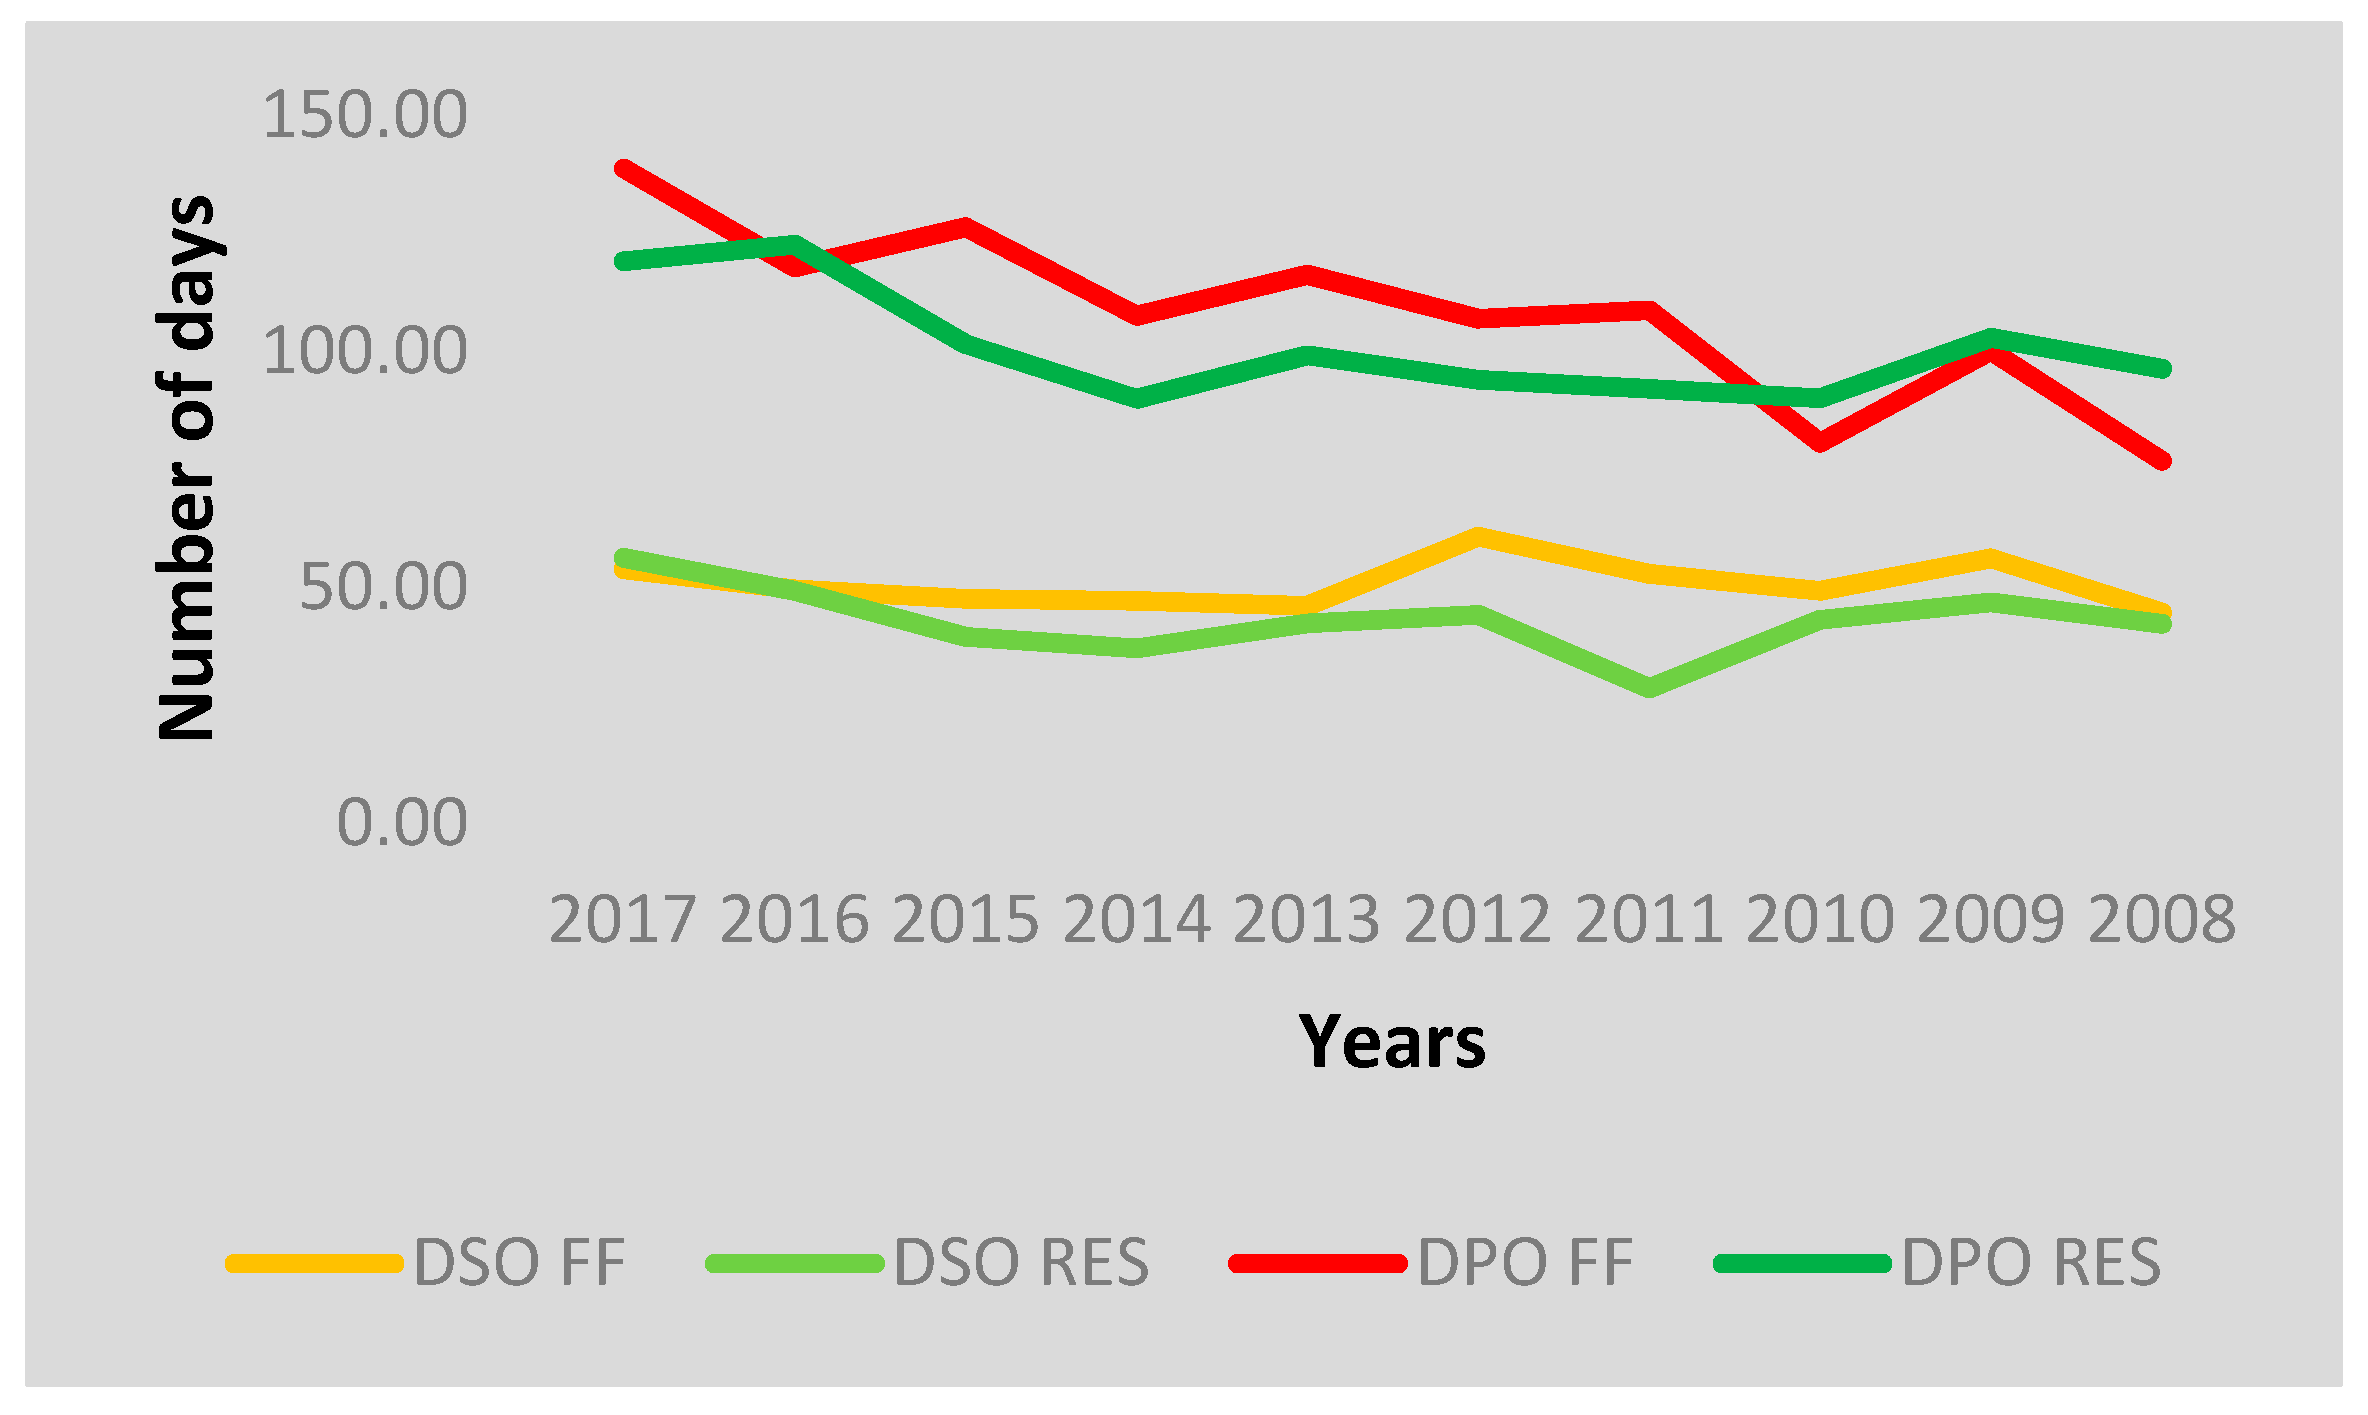
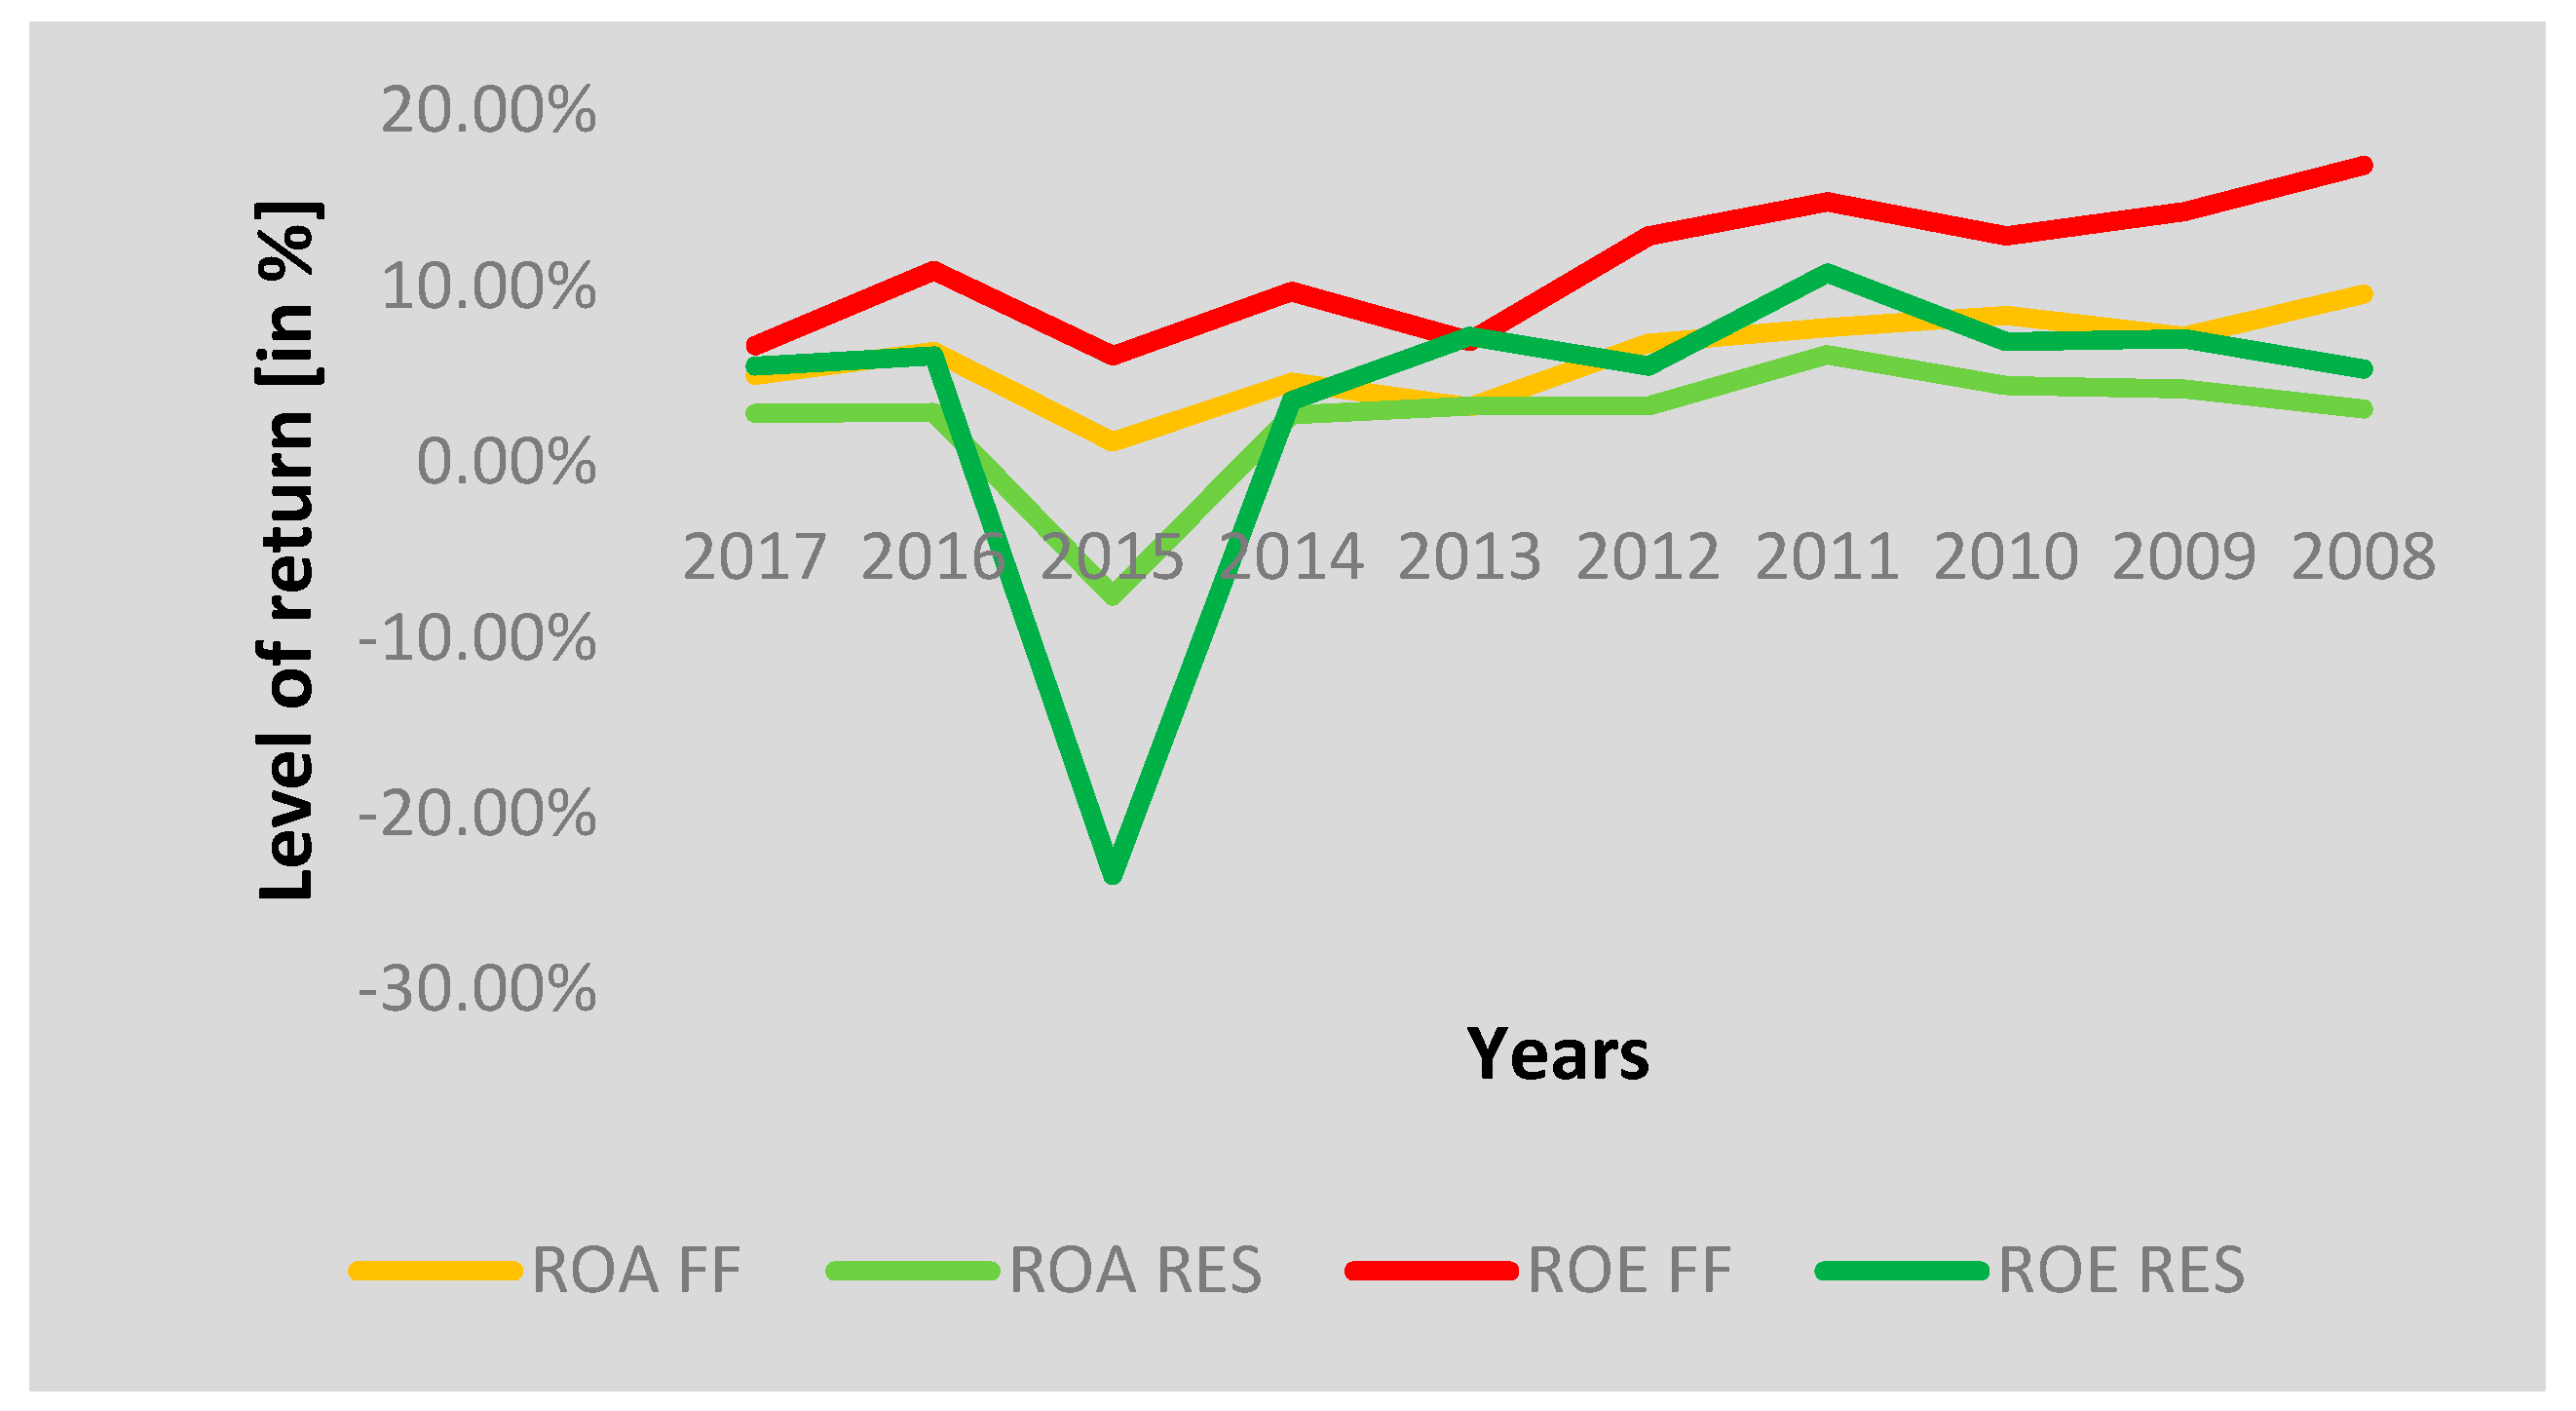
The first step of the new hybrid approach is to apply ratio analysis. Having analysed the liquidity ratios, one can say that FF companies are characterized by higher values of the current ratio (CR) and the size of working capital (SWC) than are RES companies. Nonetheless, they are described by lower values of quick ratio (QR) and cash ratio (CaR). This means that RES companies have more cash in their bank accounts. This is reflected in turnover ratios. Green businesses collected their receivables (DSO) eight days faster per year in the analysed period than did the red ones (see Figure 3). Moreover, the RES companies also paid their current obligations (DPO) faster than did traditional companies in most years in the period (on average by seven days). It is worth noting that there is a significant difference between collecting receivables and paying off liabilities. This situation is very favourable for enterprises in the sector, because first they collect their receivables, and after 58 days green companies (57 days for red companies) pay their liabilities. Thanks to this, enterprises from the sector have free cash that they can place, e.g., in a bank deposit, until their obligations are repaid. RES enterprises also turned their inventories (DSI) faster than FF enterprises. This explains why current ratio values were lower than for the red companies. On the other hand, RES enterprises generated 13 cents less income from sales than traditional ones for every USD 1 invested in their assets (TAT), and thus they manage their assets less well. This can be seen in the values of their profitability ratios. RES companies presented worse (lower) ROA and ROE values than FF enterprises in the whole analysed period (see Figure 4). The annual average ROA value was 2% (lower by 4%) and the ROE value was 3% (lower by 8%). Unfortunately, only very high values are interesting to potential investors, because they want a big return on their investment. This could mean that investing in so-called green companies appears to have little attraction. In addition, they have higher shares of equity in the total assets (DR). This confirms that green companies manage their assets less well than red companies. They use financial leverage to a lesser extent.
The abovementioned differences in the values of individual indicators will be subject to statistical analysis to check whether these differences are statistically significant or not. A summary of the results of the Student’s t-test is shown in Table 4 and detailed results are presented in Table A1, Table A2, Table A3, Table A4, Table A5, Table A6, Table A7, Table A8, Table A9 and Table A10. In the case of missing data, deletion was pairwise. By analysing the results shown in Table 4, one can conclude that the differences between mean values of analysed ratios of electric generators that are producing energy using renewable energy sources and companies that are producing energy using fossil fuel resources in most cases in the period are statistically irrelevant. However, in the period for the LTA ratio, the differences are statistically relevant. Moreover, this situation also applies to five other indicators but for individual periods: CaR in 2013 and 2012; ROA in 2012 and 2008; ROE in 2008; ETA in 2008; DSO in 2011. The results do not confirm statistical significance that electric producers generating energy using renewable energy sources have a better financial condition than those that use only traditional energy sources. In a few cases, it confirms the opposite—that the companies producing energy using fossil fuel resources are characterized by a better financial state.
The results of the analysis using ratio analysis and the Student’s t-test do not allow us to state clearly that RES businesses have a better or worse financial condition than do FF businesses, despite the clear differences in the effective management of assets or financial liquidity. The dissimilarities are irrelevant.
What is more, the ratio analysis can evaluate individual groups of financial ratios. However, this analysis makes it impossible to make a synthetic, comprehensive assessment of the financial condition of the surveyed enterprises. The use of integrated methods (e.g., discriminant analysis methods) gives an advantage over ratio analysis. The implementation of these methods is very easy and fast. Therefore, a second step of the new hybrid approach is to calculate the Altman model. The result of the Altman discriminant model will be presented in Section 3.2.
3.2. Altman Model
The results of the Altman model are presented in Table 5 for the period of 2008–2017. The enterprises were ranked according to their classification into the green or red group. In Table 5, the green colour indicates that the power plant is classified in the “safe zone” class and has a low probability of bankruptcy, whereas the red colour indicates classification in the “distress zone”, meaning a very high probability of going bankrupt. The middle class occupies a “grey zone”. Most of the analysed units fall within the safe zone, with some exceptions. Of the 26 companies, seven had some difficulties in the period, mainly Bratislavska teplarenska and Budapesti Eromu. For three years, Bratislavska teplarenska had a low financial condition, which meant a high probability of bankruptcy. However, the financial condition has improved from very low to average over the past five years. This may indicate that in 2018 the company will be classified in the safe zone. When it comes to green companies, the highest financial state was generated by Energotrans, PGNIG Termika, and PGE Torun. Four of the 12 green companies had troubles with their financial standing, mainly Enefit Energiatootmine and Slovenske Elektrarne. Enefit Energiatootmine, which uses wind for power generation, had big financial troubles in the period; over the past six years it has been in the distressed zone, and no upward trend can be observed. Slovenske Elektrarne, however, which uses solar power generation, had some difficulties at the beginning of the period, but an upward trend can now be seen; at the end of the period it fell within the safe zone.
3.3. Cluster Analysis
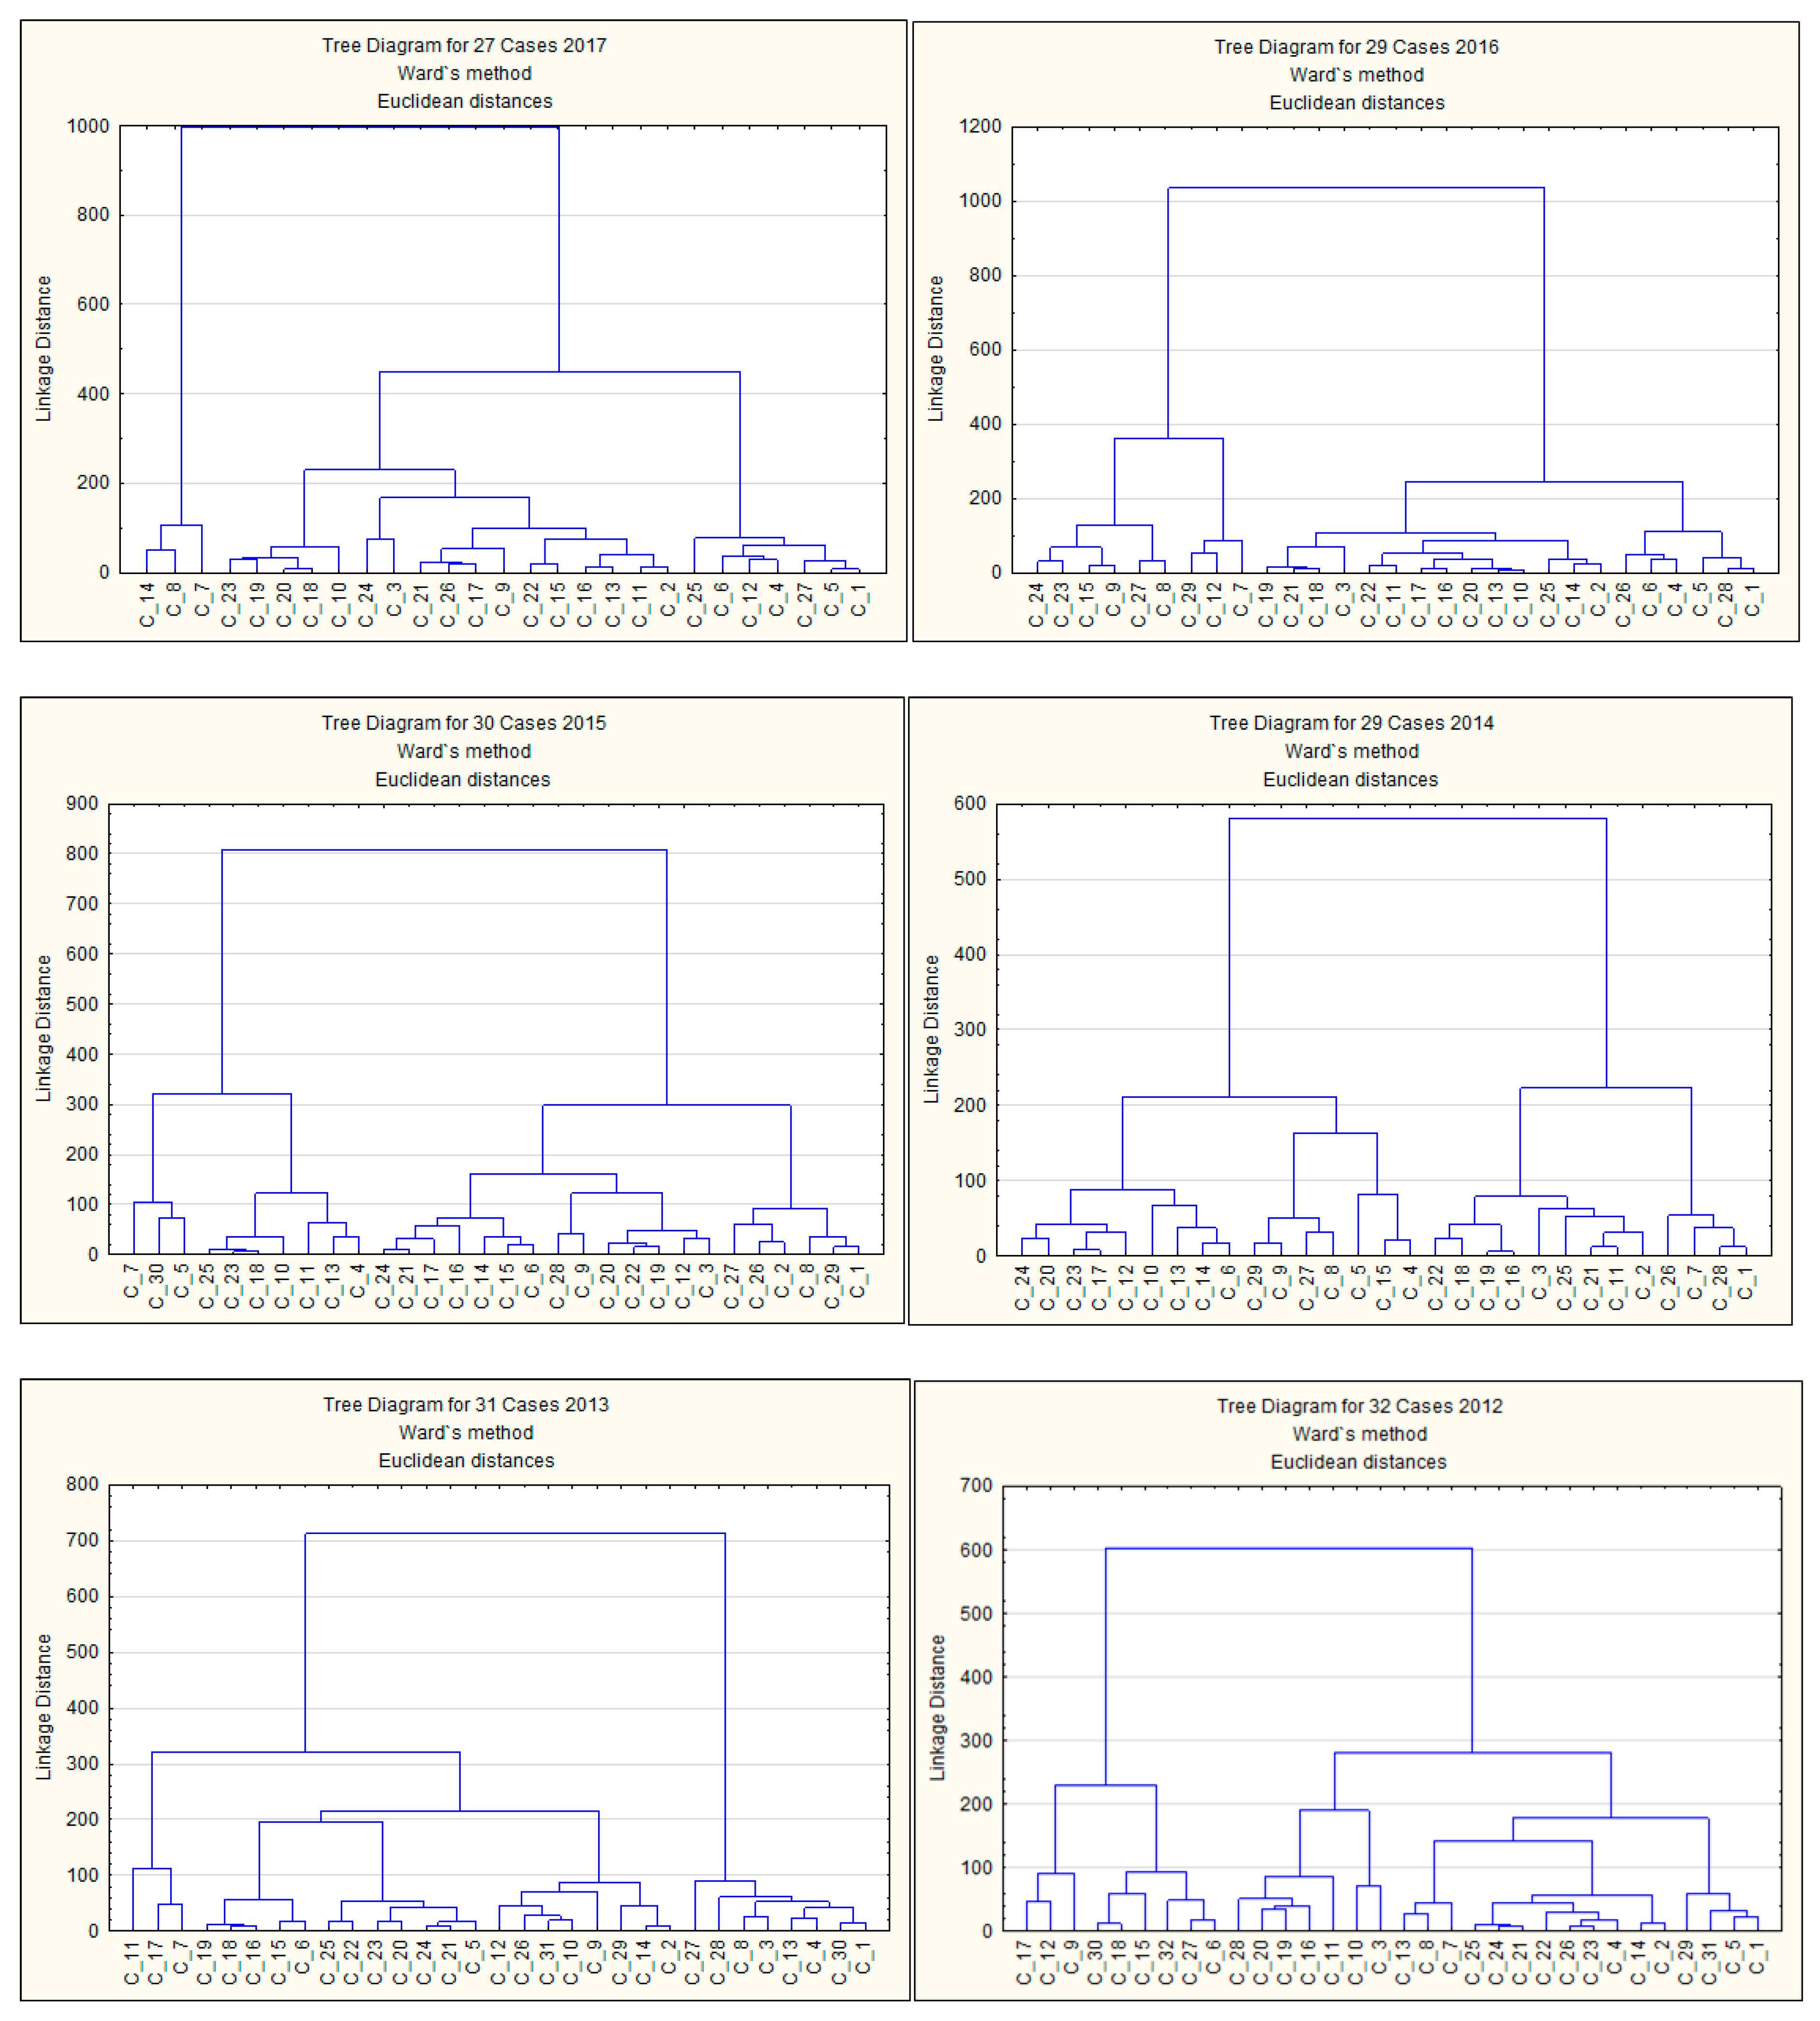
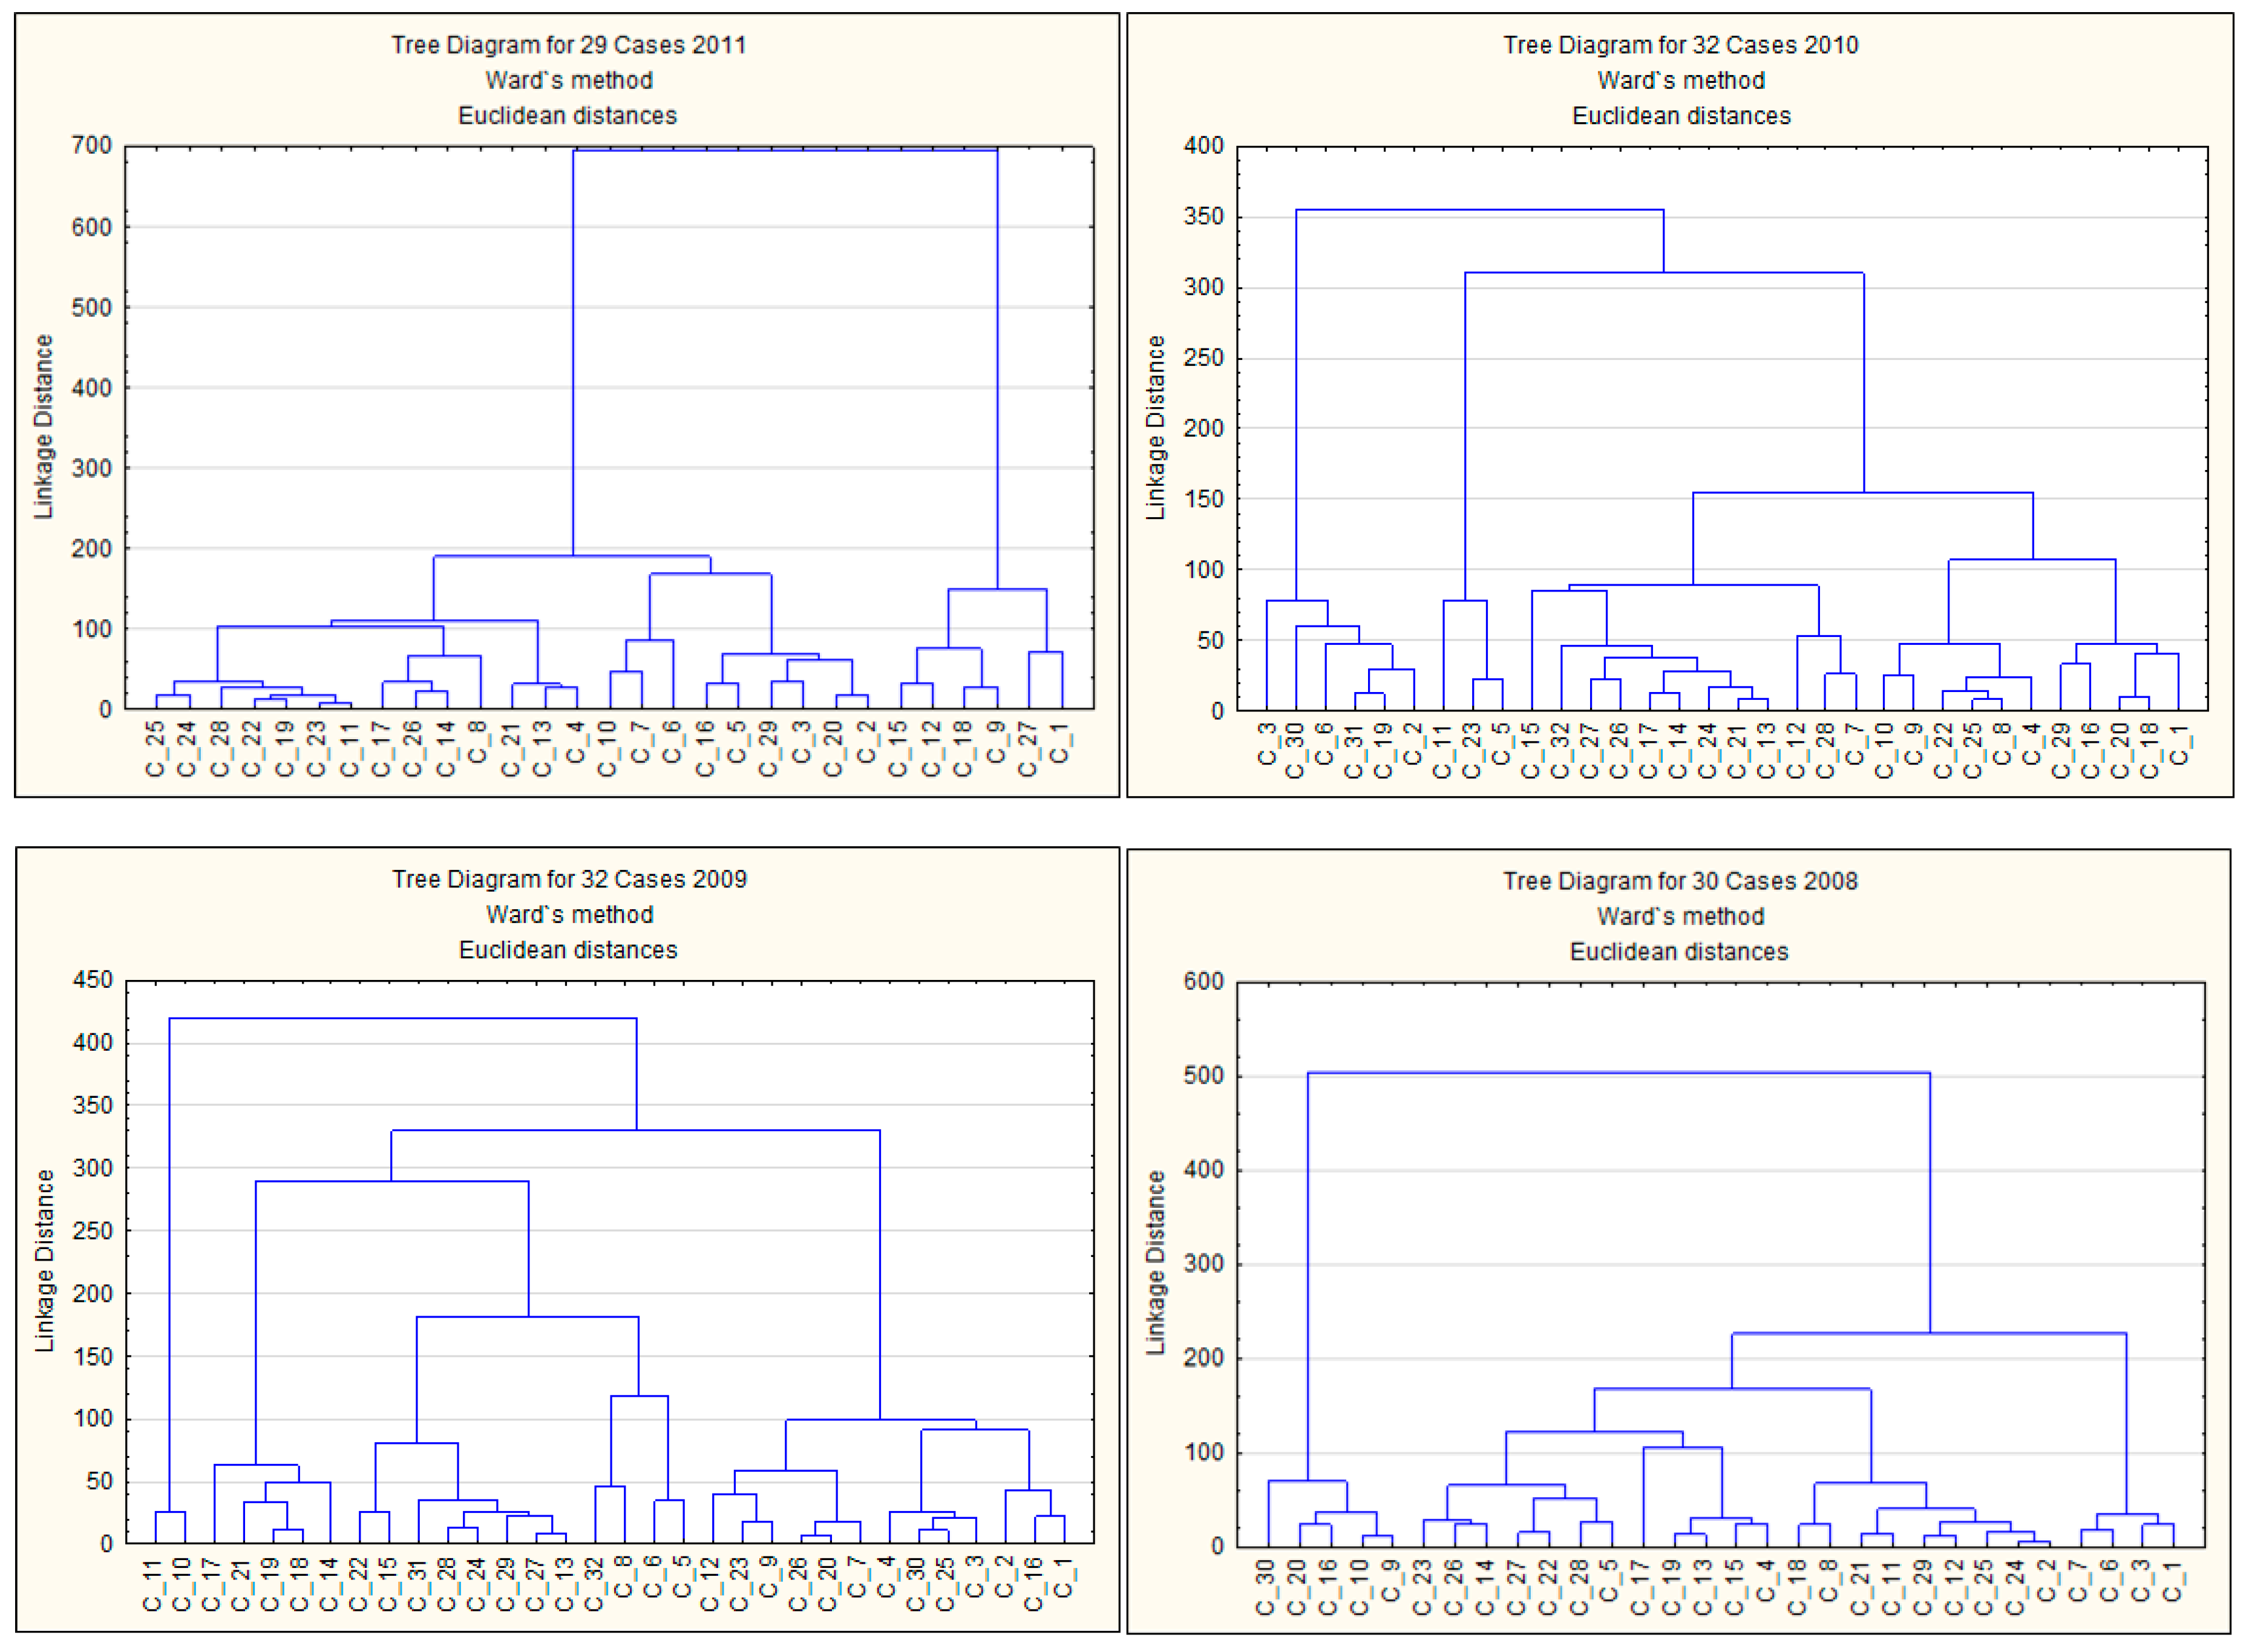
The final step of the new hybrid approach is to calculate the distance between RES companies and FF companies based on selected financial ratios. For this purpose, cluster analysis was applied. Cluster analysis uses the distance between clusters of objects (in this case companies) to form a cluster. The researcher subjectively determines the number of clusters based on distant connections. Bearing in mind that green and red groups are being analysed, the purpose of the analysis is to determine two clusters—one entirely red and one entirely green. For the analysis, the same financial indicators were used as for the ratio analysis. The results of the cluster analysis are shown in Figure 5.
Analysing the 10 dendrograms, it can be observed that they differ in linkage distance values, but these differences in most cases are not large. Differences are also seen in the number of analysed cases (companies) in a given year, ranging from 27 to 32. Based on each dendrogram it was easy to select two clusters. Two clusters in each individual tree were analysed. On the basis of the analysis of clusters, there was no case where only green or red enterprises were found. In some cases, the number of cluster members in the tree varied significantly. Analysing clusters for the tree diagram for 2016, the cut line to select two clusters was at the level of 400 linkage distance. The first cluster consists of 20 enterprises, including seven green enterprises, while the second cluster consists of nine enterprises, including four green ones. The next tree being considered was the dendrogram for 2014. The cut line was at the level of 250 linkage distance. The first cluster consists of 16 businesses, including four green ones. The second one consists of 13 businesses, including seven green ones. The final described tree was the dendrogram for 2011. The cut-off line was at the level of 200 linkage distance. The number of companies in the first cluster was 23, including 10 green ones, and the second one comprised six companies, including one green company.
Given the fact that in each selected cluster there are power plants that are producing energy using renewable energy sources and plants using fossil fuel resources, the earlier results are confirmed: the differences in financial condition between green and red enterprises are statistically insignificant.
4. Discussion
This article investigated whether companies generating green energy have a better financial state than those that generate energy from traditional sources. Results show that in most cases the differences between the values of indicators were statistically irrelevant. The results are similar to those from other recent studies. Paun [15] investigated Romanian companies over a shorter period of time and based only on ratio analysis. He concluded that most Romanian enterprises interested in energy production had a poor financial state and that there were no large differences. I concur in finding differences between the values of ratios of considered companies, but in the case of Baltic State and Central European power plants they were statistically irrelevant. Other research has examined the Baltic States. Bobinaite [24] analysed the financial sustainability of only companies producing electricity from wind resources over a shorter period of time (2009–2013) and based on ratio analysis (a small set of ratios) and integrated analysis. In the case of Estonia, she found that there were high but slowing probabilities of bankruptcy. My research contradicts this result for the case of Energiatootmine, which produces energy from wind and is classified in a distress zone for the 2012–2017 period, which means that there is a very high probability of going bankrupt. Ruggiero and Lehkonen [17] analysed 66 electric utilities from 26 countries (including 80% from developed countries). They found that switching to renewable power production led to a reduction in companies’ long-term financial performance. Results from the current study do not confirm this. Although the study period was 10 years in both studies, the different results may reflect the choice of countries, as Ruggiero and Lehkonen analysed mostly developed countries.
There are several limitations of this study. First, unbalanced data was used, and for this reason some companies might have displayed a larger effect than others. All analysed companies were from emerging markets, but most of them were from Poland. Second, we were able to evaluate only financial performance, and not environmental performance. This has been shown to be significant in some studies [2]. Third, this study examined only a small sample of companies, especially those that are involved in the production of green energy. Moreover, the selected green companies were not entirely green; most of their energy production, in fact, was from fossil fuel resources. Furthermore, cluster analysis was used in this case to distinguish only two groups, but by using a much larger sample it would be possible to identify more than two financial states. Last, there was no national analysis of enterprises due to the number of enterprises in a given country. Future research should be broadened to reduce these limitations.
5. Conclusions
This article examined whether power plants that are producing energy using renewable energy sources have a better financial condition than companies that are producing energy using fossil fuel resources. A new hybrid approach was applied that gives a broader spectrum of the estimated financial standing of the analysed groups of power generators. The approach takes into consideration three analyses: ratio analysis (16 financial ratios were analysed), the Altman model, and cluster analysis, and the Student’s t-test. Based on this approach, the financial standing of a company was assessed not only on the basis of the values of individual ratios (ratio analysis), but also as a whole (Altman model, cluster analysis), and the statistical significance of differences between the means of analysed values was checked. The research looked at the 2008–2017 period using a sample of 37 companies from eight emerging markets in Europe, dividing them into two groups: green (RES enterprises) and red (FF enterprises). The outcome of the research was processed using Statistica 13.3.
The result of ratio analysis and the Altman model showed some differences between the values of ratios of the considered companies. For example, companies that produce fossil fuel energy were characterized by higher profitability but lower turnover ratios than companies that use renewable energy sources. However, these differences in most cases were insignificant according to the results of the Student’s t-test. Cluster analysis confirmed the existence of RES and FF companies in each selected cluster. We conclude that investing in renewable energy sources is not a money-making business. For managers of power plants, this is essential news, because investing in RER is not that profitable. For investors potentially interested in investing in RES companies, the outcomes clearly indicate the need for caution. Investors might better assess investment alternatives. This information is also crucial in the context of achieving the 2020 target, especially for the Czech Republic, Estonia, Hungary, and Poland, which are struggling to achieve their targets. Therefore, policymakers should introduce packages to encourage companies to increase the use of RER.
Funding
This research was funded by Wrocław University of Science and Technology, financed from statutory funds.
Conflicts of Interest
The author declares no conflict of interest.
Nomenclature
| FF | fossil fuels |
| RES | renewable energy sector |
| RER | renewable energy resources |
| EMIS | Emerging Markets Information Service |
| NAICS | North American Industry Classification System |
| ROA | return on assets |
| DR | debt ratio |
| SWC | size of working capital |
| CR | current ratio |
| TAT | total asset turnover |
| ETL | EBIT to total liabilities ratio |
| DSI | days sales in inventory |
| ETA | EBIT to total assets ratio |
| CFA | capital to fixed asset ratio |
| CaR | cash ratio |
| ETS | EBIT to sales ratio |
| DSO | days sales outstanding |
| QR | quick ratio |
| ROE | return on equity |
| DPO | days payable outstanding |
| LTA | logarithm of total assets |
Appendix A

Table A1.
The student’s t-test results for the chosen ratios for green (1) and red (0) companies for 2017.
Table A1.
The student’s t-test results for the chosen ratios for green (1) and red (0) companies for 2017.
| Ratio | M 0 | M 1 | t-Value | df | p | Valid N 0 | Valid N 1 | Std. Dev. 0 | Std. Dev. 1 | F-ratio Variances | p Variances |
|---|---|---|---|---|---|---|---|---|---|---|---|
| ROA | 0.05 | 0.03 | 1.03 | 24.00 | 0.31 | 15.00 | 11.00 | 0.07 | 0.03 | 6.47 | 0.01 |
| DR | 0.50 | 0.49 | 0.10 | 25.0 | 0.92 | 16.00 | 11.00 | 0.18 | 0.17 | 1.12 | 0.88 |
| SWC | 0.06 | 0.07 | −0.16 | 24.00 | 0.88 | 16.00 | 10.00 | 0.16 | 0.09 | 2.75 | 0.13 |
| CR | 1.62 | 1.28 | 0.98 | 24.00 | 0.34 | 16.00 | 10.00 | 0.94 | 0.71 | 1.77 | 0.39 |
| TAT | 0.51 | 0.50 | 0.03 | 23.00 | 0.98 | 14.00 | 11.00 | 0.24 | 0.27 | 1.30 | 0.65 |
| ETL | 0.07 | 0.11 | −0.70 | 24.00 | 0.49 | 15.00 | 11.00 | 0.18 | 0.12 | 2.22 | 0.21 |
| DSI | 27 | 24 | 0.40 | 25.00 | 0.69 | 16.00 | 11.00 | 21.34 | 19.38 | 1.21 | 0.77 |
| ETA | 0.06 | 0.04 | 0.51 | 25.00 | 0.61 | 16.00 | 11.00 | 0.08 | 0.03 | 8.27 | 0.00 |
| CFA | 1.11 | 1.05 | 0.60 | 25.00 | 0.56 | 16.00 | 11.00 | 0.27 | 0.28 | 1.03 | 0.93 |
| CaR | 0.71 | 0.90 | −0.63 | 25.00 | 0.54 | 16.00 | 11.00 | 0.73 | 0.83 | 1.30 | 0.63 |
| ETS | 0.11 | 0.09 | 0.59 | 24.00 | 0.56 | 15.00 | 11.00 | 0.11 | 0.05 | 6.29 | 0.01 |
| DSO | 54 | 56 | −0.20 | 24.00 | 0.84 | 15.00 | 11.00 | 33.30 | 25.94 | 1.65 | 0.43 |
| QR | 0.81 | 0.84 | −0.10 | 23.00 | 0.92 | 15.00 | 10.00 | 0.55 | 0.51 | 1.18 | 0.83 |
| ROE | 0.07 | 0.05 | 0.37 | 22.00 | 0.71 | 13.00 | 11.00 | 0.09 | 0.06 | 2.25 | 0.21 |
| DPO | 139 | 119 | 0.57 | 24.00 | 0.57 | 16.00 | 10.00 | 104.01 | 38.51 | 7.30 | 0.00 |
| LTA | 5.30 | 6.06 | −2.39 | 25.00 | 0.02 | 16.00 | 11.00 | 0.63 | 1.02 | 2.67 | 0.08 |
The red color means that differences in the values of individual indicators are statistically significant.
Table A2.
The student’s t-test results for the chosen ratios for green (1) and red (0) companies for 2016.
Table A2.
The student’s t-test results for the chosen ratios for green (1) and red (0) companies for 2016.
| Ratio | M 0 | M 1 | t-Value | df | p | Valid N 0 | Valid N 1 | Std. Dev. 0 | Std. Dev. 1 | F-ratio Variances | p Variances |
|---|---|---|---|---|---|---|---|---|---|---|---|
| ROA | 0.06 | 0.03 | 1.69 | 27 | 0.10 | 17 | 12 | 0.07 | 0.03 | 6.06 | 0.00 |
| DR | 0.52 | 0.50 | 0.25 | 27 | 0.81 | 17 | 12 | 0.21 | 0.19 | 1.24 | 0.73 |
| SWC | 0.08 | 0.06 | 0.42 | 25 | 0.68 | 16 | 11 | 0.14 | 0.09 | 2.35 | 0.17 |
| CR | 1.48 | 1.18 | 1.11 | 25 | 0.28 | 16 | 11 | 0.73 | 0.56 | 1.72 | 0.39 |
| TAT | 0.63 | 0.51 | 1.50 | 25 | 0.15 | 15 | 12 | 0.18 | 0.23 | 1.62 | 0.39 |
| ETL | 0.15 | 0.11 | 0.80 | 26 | 0.43 | 16 | 12 | 013 | 0.11 | 1.53 | 0.48 |
| DSI | 26 | 22 | 0.61 | 27 | 0.55 | 17 | 12 | 17.60 | 17.60 | 1.00 | 0.97 |
| ETA | 0.09 | 0.05 | 1.61 | 27 | 0.12 | 17 | 12 | 0.08 | 0.04 | 5.06 | 0.01 |
| CFA | 1.09 | 1.03 | 0.63 | 27 | 0.53 | 17 | 12 | 0.29 | 0.25 | 1.39 | 0.59 |
| CaR | 0.61 | 0.63 | −0.08 | 26 | 0.94 | 17 | 11 | 0.62 | 0.38 | 2.75 | 0.11 |
| ETS | 0.14 | 0.09 | 1.44 | 27 | 0.16 | 17 | 12 | 0.10 | 0.06 | 2.95 | 0.07 |
| DSO | 50 | 49 | 0.03 | 26 | 0.98 | 16 | 12 | 26.36 | 21.99 | 1.44 | 0.55 |
| QR | 0.85 | 0.77 | 0.39 | 25 | 0.70 | 16 | 11 | 056 | 0.39 | 2.08 | 0.24 |
| ROE | 0.11 | 0.06 | 1.23 | 25 | 023 | 15 | 12 | 0.12 | 0.08 | 2.32 | 0.17 |
| DPO | 109 | 122 | −0.44 | 29 | 0.66 | 20 | 11 | 84.69 | 62.00 | 1.87 | 0.31 |
| LTA | 5.24 | 6.08 | −2.88 | 30 | 0.01 | 20 | 12 | 0.65 | 1.00 | 2.33 | 0.10 |
The red color means that differences in the values of individual indicators are statistically significant.
Table A3.
The student’s t-test results for the chosen ratios for green (1) and red (0) companies for 2015.
Table A3.
The student’s t-test results for the chosen ratios for green (1) and red (0) companies for 2015.
| Ratio | M 0 | M 1 | t-Value | df | p | Valid N 0 | Valid N 1 | Std. Dev. 0 | Std. Dev. 1 | F-ratio Variances | p Variances |
|---|---|---|---|---|---|---|---|---|---|---|---|
| ROA | 001 | −0.08 | 1.57 | 28 | 0.13 | 18 | 12 | 0.14 | 0.16 | 1.28 | 0.63 |
| DR | 0.58 | 0.52 | 0.64 | 28 | 0.53 | 18 | 12 | 0.24 | 0.24 | 1.01 | 1.00 |
| SWC | −0.02 | 0.00 | −0.15 | 28 | 0.88 | 18 | 12 | 0.26 | 0.28 | 1.17 | 0.74 |
| CR | 1.45 | 1.27 | 0.53 | 27 | 0.60 | 18 | 11 | 0.91 | 0.92 | 1.03 | 0.92 |
| TAT | 0.64 | 0.54 | 1.18 | 26 | 0.25 | 16 | 12 | 0.21 | 0.23 | 1.22 | 0.71 |
| ETL | 0.05 | −0.05 | 0.97 | 27 | 0.34 | 17 | 12 | 0.23 | 0.34 | 2.19 | 0.15 |
| DSI | 32 | 27 | 057 | 27 | 0.57 | 17 | 12 | 25.83 | 18.07 | 2.04 | 0.23 |
| ETA | 0.02 | −0.06 | 1.42 | 28 | 0.17 | 18 | 12 | 0.15 | 0.19 | 1.63 | 0.36 |
| CFA | 0.99 | 1.04 | −0.33 | 28 | 0.74 | 18 | 12 | 0.42 | 0.34 | 1.50 | 0.50 |
| CaR | 0.54 | 0.62 | −0.36 | 27 | 0.72 | 18 | 11 | 0.61 | 0.67 | 1.23 | 0.68 |
| ETS | 0.06 | −0.11 | 1.74 | 28 | 0.09 | 18 | 12 | 0.20 | 0.32 | 2.45 | 0.09 |
| DSO | 48 | 40 | 0.86 | 27 | 0.40 | 17 | 12 | 27.89 | 20.08 | 1.93 | 0.27 |
| QR | 0.90 | 1 | 0.23 | 27 | 0.82 | 18 | 11 | 0.67 | 0.70 | 1.08 | 0.85 |
| ROE | 0.06 | −0.24 | 1.63 | 27 | 0.12 | 17 | 12 | 0.46 | 0.51 | 1.23 | 0.69 |
| DPO | 126 | 102 | 0.93 | 27 | 0.36 | 18 | 11 | 76.62 | 56.08 | 1.87 | 0.32 |
| LTA | 5.25 | 6.06 | −2.61 | 28 | 0.01 | 18 | 12 | 0.69 | 1.01 | 2.13 | 0.16 |
The red color means that differences in the values of individual indicators are statistically significant.
Table A4.
The student’s t-test results for the chosen ratios for green (1) and red (0) companies for 2014.
Table A4.
The student’s t-test results for the chosen ratios for green (1) and red (0) companies for 2014.
| Ratio | M 0 | M 1 | t-Value | df | p | Valid N 0 | Valid N 1 | Std. Dev. 0 | Std. Dev. 1 | F-ratio Variances | p Variances |
|---|---|---|---|---|---|---|---|---|---|---|---|
| ROA | 0.05 | 0.03 | 0.94 | 26 | 0.36 | 16 | 12 | 0.06 | 0.04 | 1.95 | 0.27 |
| DR | 0.53 | 0.48 | 0.59 | 27 | 0.56 | 17 | 12 | 0.20 | 0.23 | 1.35 | 0.57 |
| SWC | 0.00 | 0.02 | −0.33 | 27 | 0.74 | 17 | 12 | 0.23 | 0.23 | 1.06 | 0.89 |
| CR | 1.40 | 1.40 | −0.01 | 26 | 0.99 | 17 | 11 | 0.85 | 0.74 | 1.31 | 0.68 |
| TAT | 0.70 | 0.55 | 1.87 | 26 | 0.07 | 16 | 12 | 0.23 | 0.19 | 1.49 | 0.51 |
| ETL | 0.10 | 0.13 | −0.66 | 24 | 0.52 | 15 | 11 | 0.12 | 0.13 | 1.28 | 0.65 |
| DSI | 36 | 29 | 0.82 | 27 | 0.42 | 17 | 12 | 27.87 | 17.77 | 2.46 | 0.13 |
| ETA | 0.05 | 0.05 | 0.13 | 25 | 0.90 | 15 | 12 | 0.05 | 0.04 | 1.73 | 0.37 |
| CFA | 1.02 | 1.00 | 0.14 | 27 | 0.89 | 17 | 12 | 0.36 | 0.36 | 1.03 | 099 |
| CaR | 0.40 | 0.80 | −1.80 | 25 | 0.08 | 17 | 10 | 0.52 | 0.59 | 1.29 | 0.63 |
| ETS | 008 | 0.10 | −0.34 | 26 | 0.74 | 16 | 12 | 0.09 | 0.08 | 1.16 | 0.82 |
| DSO | 47 | 37 | 1.24 | 24 | 0.23 | 15 | 11 | 24.11 | 13.96 | 2.98 | 0.09 |
| QR | 0.77 | 1 | −1.19 | 25 | 0.25 | 17 | 10 | 0.58 | 0.56 | 1.08 | 0.94 |
| ROE | 0.10 | 0.04 | 1.24 | 26 | 0.23 | 16 | 12 | 0.13 | 0.13 | 1.10 | 0.89 |
| DPO | 108 | 90 | 107 | 25 | 0.29 | 16 | 11 | 44.46 | 37.45 | 1.41 | 0.59 |
| LTA | 5.41 | 610 | −2.42 | 27 | 0.02 | 17 | 12 | 0.51 | 1.02 | 4.08 | 0.01 |
The red color means that differences in the values of individual indicators are statistically significant.
Table A5.
The student’s t-test results for the chosen ratios for green (1) and red (0) companies for 2013.
Table A5.
The student’s t-test results for the chosen ratios for green (1) and red (0) companies for 2013.
| Ratio | M 0 | M 1 | t-Value | df | p | Valid N 0 | Valid N 1 | Std. Dev. 0 | Std. Dev. 1 | F-ratio Variances | p Variances |
|---|---|---|---|---|---|---|---|---|---|---|---|
| ROA | 0.03 | 0.03 | −0.02 | 25 | 0.98 | 15 | 12 | 0.05 | 0.03 | 1.98 | 0.26 |
| DR | 0.47 | 0.45 | 0.22 | 29 | 0.83 | 19 | 12 | 0.20 | 0.23 | 1.31 | 0.59 |
| SWC | 0.07 | 0.00 | 0.81 | 29 | 0.42 | 19 | 12 | 0.24 | 0.22 | 1.16 | 0.82 |
| CR | 1.27 | 1.24 | 0.12 | 26 | 0.91 | 17 | 11 | 0.64 | 0.68 | 1.12 | 0.81 |
| TAT | 0.69 | 0.54 | 1.51 | 28 | 0.14 | 18 | 12 | 0.32 | 0.19 | 2.98 | 0.07 |
| ETL | 0.07 | 0.15 | −1.10 | 26 | 0.28 | 16 | 12 | 0.20 | 0.11 | 3.49 | 0.04 |
| DSI | 40 | 30 | 0.96 | 29 | 0.35 | 19 | 12 | 33.60 | 19.18 | 3.07 | 0.06 |
| ETA | 0.03 | 0.05 | −0.81 | 26 | 0.43 | 16 | 12 | 0.08 | 0.04 | 3.80 | 0.03 |
| CFA | 1.03 | 1.02 | 0.08 | 27 | 0.94 | 17 | 12 | 0.22 | 0.25 | 1.36 | 0.56 |
| CaR | 0.23 | 0.54 | −2.45 | 26 | 0.02 | 17 | 11 | 0.25 | 0.42 | 2.82 | 0.06 |
| ETS | 0.06 | 0.10 | −0.77 | 29 | 0.45 | 19 | 12 | 0.18 | 0.10 | 3.61 | 0.03 |
| DSO | 46 | 42 | 0.59 | 26 | 0.56 | 16 | 12 | 15.06 | 18.99 | 1.59 | 0.40 |
| QR | 0.59 | 0.79 | −1.22 | 26 | 0.23 | 17 | 11 | 0.43 | 0.44 | 1.06 | 0.88 |
| ROE | 0.07 | 0.07 | −0.06 | 27 | 0.96 | 17 | 12 | 0.16 | 0.10 | 2.59 | 0.12 |
| DPO | 116 | 99 | 0.85 | 28 | 0.40 | 19 | 11 | 59.34 | 38.79 | 2.34 | 0.17 |
| LTA | 5.42 | 6.13 | −2.60 | 29 | 0.01 | 19 | 12 | 0.51 | 1.02 | 4.03 | 0.01 |
The red color means that differences in the values of individual indicators are statistically significant.
Table A6.
The student’s t-test results for the chosen ratios for green (1) and red (0) companies for 2012.
Table A6.
The student’s t-test results for the chosen ratios for green (1) and red (0) companies for 2012.
| Ratio | M 0 | M 1 | t-Value | df | p | Valid N 0 | Valid N 1 | Std. Dev. 0 | Std. Dev. 1 | F-ratio Variances | p Variances |
|---|---|---|---|---|---|---|---|---|---|---|---|
| ROA | 0.07 | 0.03 | 2.38 | 27 | 0.02 | 17 | 12 | 0.05 | 0.03 | 3.20 | 0.06 |
| DR | 0.45 | 0.44 | 0.12 | 30 | 0.91 | 20 | 12 | 0.22 | 0.25 | 1.33 | 0.57 |
| SWC | 0.04 | 0.06 | −0.72 | 27 | 0.48 | 18 | 11 | 0.11 | 0.08 | 1.88 | 0.31 |
| CR | 1.39 | 1.25 | 0.60 | 27 | 0.55 | 18 | 11 | 0.60 | 0.61 | 1.04 | 0.91 |
| TAT | 0.78 | 0.58 | 1.79 | 30 | 0.08 | 20 | 12 | 0.35 | 0.21 | 2.72 | 0.09 |
| ETL | 0.21 | 0.16 | 0.93 | 27 | 0.36 | 17 | 12 | 0.16 | 0.09 | 2.95 | 0.07 |
| DSI | 38 | 28 | 0.96 | 30 | 0.35 | 20 | 12 | 32.75 | 17.55 | 3.48 | 0.04 |
| ETA | 0.07 | 0.05 | 0.59 | 30 | 0.56 | 20 | 12 | 0.09 | 0.03 | 10.44 | 0.00 |
| CFA | 1.07 | 1.08 | −0.20 | 26 | 0.85 | 17 | 11 | 0.12 | 0.10 | 1.35 | 0.65 |
| CaR | 0.28 | 0.57 | −2.26 | 27 | 0.03 | 18 | 11 | 0.26 | 0.43 | 2.75 | 0.06 |
| ETS | 0.12 | 0.11 | 0.19 | 30 | 0.85 | 20 | 12 | 0.13 | 0.11 | 1.58 | 0.44 |
| DSO | 61 | 44 | 1.49 | 29 | 0.15 | 19 | 12 | 34.30 | 21.77 | 2.48 | 0.13 |
| QR | 0.76 | 0.82 | −0.34 | 28 | 0.73 | 19 | 11 | 0.52 | 0.45 | 1.32 | 0.67 |
| ROE | 0.13 | 0.06 | 1.18 | 30 | 0.25 | 20 | 12 | 0.21 | 0.07 | 9.65 | 0.00 |
| DPO | 107 | 94 | 0.67 | 29 | 051 | 20 | 11 | 57.43 | 36.87 | 2.43 | 0.15 |
| LTA | 5.42 | 6.09 | −2.53 | 30 | 0.02 | 20 | 12 | 0.48 | 1.00 | 4.30 | 0.01 |
The red color means that differences in the values of individual indicators are statistically significant.
Table A7.
The student’s t-test results for the chosen ratios for green (1) and red (0) companies for 2011.
Table A7.
The student’s t-test results for the chosen ratios for green (1) and red (0) companies for 2011.
| Ratio | M 0 | M 1 | t-Value | df | p | Valid N 0 | Valid N 1 | Std. Dev. 0 | Std. Dev. 1 | F-ratio Variances | p Variances |
|---|---|---|---|---|---|---|---|---|---|---|---|
| ROA | 0.08 | 0.06 | 0.69 | 25 | 0.50 | 16 | 11 | 0.07 | 0.03 | 5.21 | 0.01 |
| DR | 0.45 | 0.40 | 0.60 | 27 | 0.55 | 18 | 11 | 0.19 | 0.21 | 1.18 | 0.74 |
| SWC | 0.05 | 0.04 | 0.12 | 27 | 0.91 | 18 | 11 | 0.23 | 0.17 | 1.90 | 0.30 |
| CR | 1.51 | 1.34 | 0.55 | 26 | 0.59 | 18 | 10 | 0.77 | 0.71 | 1.16 | 0.86 |
| TAT | 0.80 | 0.71 | 0.88 | 25 | 0.38 | 16 | 11 | 0.26 | 0.23 | 1.30 | 0.69 |
| ETL | 0.29 | 0.22 | 0.85 | 25 | 0.41 | 16 | 11 | 0.25 | 0.12 | 4.67 | 0.02 |
| DSI | 34 | 26 | 1.01 | 27 | 0.32 | 18 | 11 | 22.27 | 17.16 | 1.68 | 0.40 |
| ETA | 0.10 | 0.08 | 0.86 | 25 | 0.40 | 16 | 11 | 0.08 | 0.03 | 5.92 | 0.01 |
| CFA | 1.08 | 1.06 | 0.18 | 25 | 0.86 | 16 | 11 | 0.17 | 0.21 | 1.52 | 0.45 |
| CaR | 0.49 | 0.68 | −0.96 | 26 | 0.35 | 18 | 10 | 0.43 | 0.58 | 1.78 | 0.29 |
| ETS | 0.09 | 0.12 | −0.53 | 27 | 0.60 | 18 | 11 | 0.19 | 0.07 | 7.97 | 0.00 |
| DSO | 53 | 29 | 2.70 | 27 | 0.01 | 18 | 11 | 26.02 | 18.38 | 2.00 | 0.26 |
| QR | 0.89 | 0.98 | −0.37 | 26 | 0.72 | 18 | 10 | 0.59 | 0.66 | 1.26 | 0.65 |
| ROE | 0.15 | 0.11 | 0.84 | 25 | 0.41 | 16 | 11 | 0.15 | 0.06 | 6.90 | 0.00 |
| DPO | 109 | 92 | 0.77 | 27 | 0.45 | 18 | 11 | 59.68 | 51.54 | 1.34 | 0.65 |
| LTA | 5.40 | 6,16 | −3.01 | 27 | 0.01 | 18 | 11 | 0.46 | 0.90 | 3.77 | 0.02 |
The red color means that differences in the values of individual indicators are statistically significant.
Table A8.
The student’s t-test results for the chosen ratios for green (1) and red (0) companies for 2010.
Table A8.
The student’s t-test results for the chosen ratios for green (1) and red (0) companies for 2010.
| Ratio | M 0 | M 1 | t-Value | df | p | Valid N 0 | Valid N 1 | Std. Dev. 0 | Std. Dev. 1 | F-ratio Variances | p Variances |
|---|---|---|---|---|---|---|---|---|---|---|---|
| ROA | 0.08 | 0.04 | 1.95 | 28 | 0.06 | 19 | 11 | 0.06 | 0.02 | 7.09 | 0.00 |
| DR | 0.40 | 0.35 | 0.86 | 30 | 0.40 | 21 | 11 | 0.16 | 0.16 | 1.03 | 1.00 |
| SWC | 0.12 | 0.09 | 0.66 | 28 | 0.52 | 20 | 10 | 0.12 | 0.08 | 2.24 | 0.22 |
| CR | 1.75 | 1.53 | 0.74 | 28 | 0.47 | 20 | 10 | 0.74 | 0.80 | 1.17 | 0.74 |
| TAT | 0.74 | 0.59 | 1.46 | 29 | 0.16 | 20 | 11 | 0.30 | 0.19 | 2.44 | 0.15 |
| ETL | 0.26 | 0.22 | 0.62 | 27 | 0.54 | 18 | 11 | 0.19 | 0.09 | 4.05 | 0.03 |
| DSI | 30 | 29 | 0.05 | 30 | 0.96 | 21 | 11 | 20.01 | 22.29 | 1.24 | 0.65 |
| ETA | 0.11 | 0.07 | 1.66 | 28 | 0.11 | 19 | 11 | 0.08 | 0.03 | 6.93 | 0.00 |
| CFA | 1.12 | 1.07 | 0.54 | 30 | 0.59 | 21 | 11 | 0.30 | 0.17 | 2.91 | 0.09 |
| CaR | 0.71 | 0.78 | -0.33 | 28 | 0.74 | 20 | 10 | 0.53 | 0.68 | 1.63 | 0.35 |
| ETS | 0.14 | 0.12 | 0.63 | 29 | 0.53 | 20 | 11 | 0.12 | 0.05 | 5.32 | 0.01 |
| DSO | 49 | 43 | 0.82 | 29 | 0.42 | 20 | 11 | 21.17 | 17.84 | 1.41 | 0.59 |
| QR | 1.08 | 1.04 | 0.17 | 28 | 0.87 | 20 | 10 | 0.63 | 0.63 | 1.00 | 0.94 |
| ROE | 0.13 | 0.07 | 1.92 | 27 | 0.07 | 18 | 11 | 0.10 | 0.04 | 5.18 | 0.01 |
| DPO | 81 | 90 | −0.66 | 28 | 0.52 | 20 | 10 | 38.43 | 33.54 | 1.31 | 0.70 |
| LTA | 5.46 | 6.28 | −3.07 | 30 | 0.00 | 21 | 11 | 0.43 | 1.07 | 6.29 | 0.00 |
The red color means that differences in the values of individual indicators are statistically significant.
Table A9.
The student’s t-test results for the chosen ratios for green (1) and red (0) companies for 2009.
Table A9.
The student’s t-test results for the chosen ratios for green (1) and red (0) companies for 2009.
| Ratio | M 0 | M 1 | t-Value | df | p | Valid N 0 | Valid N 1 | Std. Dev. 0 | Std. Dev. 1 | F-ratio Variances | p Variances |
|---|---|---|---|---|---|---|---|---|---|---|---|
| ROA | 0.07 | 0.04 | 1.56 | 29 | 0.13 | 21 | 10 | 0.05 | 0.04 | 1.98 | 0.29 |
| DR | 0.40 | 0.31 | 1.33 | 30 | 0.19 | 22 | 10 | 0.19 | 0.14 | 1.81 | 0.36 |
| SWC | 0.13 | 0.06 | 1.18 | 30 | 0.25 | 22 | 10 | 0.16 | 0.08 | 3.83 | 0.04 |
| CR | 2.17 | 1.52 | 1.19 | 30 | 0.24 | 22 | 10 | 1.66 | 0.62 | 7.26 | 0.00 |
| TAT | 0.65 | 0.55 | 1.13 | 29 | 0.27 | 21 | 10 | 0.26 | 0.15 | 2.90 | 0.10 |
| ETL | 0.29 | 0.25 | 0.72 | 29 | 0.48 | 21 | 10 | 0.19 | 0.12 | 2.56 | 0.15 |
| DSI | 48 | 26 | 1.77 | 30 | 0.09 | 22 | 10 | 35.46 | 17.80 | 3.97 | 0.04 |
| ETA | 0.11 | 0.07 | 1.68 | 30 | 0.10 | 22 | 10 | 0.08 | 0.05 | 2.59 | 0.14 |
| CFA | 1.21 | 1.03 | 1.72 | 30 | 0.10 | 22 | 10 | 0.30 | 0.21 | 2.13 | 0.24 |
| CaR | 0.82 | 0.75 | 0.21 | 29 | 0.84 | 21 | 10 | 1.07 | 0.59 | 3.28 | 0.07 |
| ETS | 0.16 | 0.14 | 0.63 | 29 | 0.53 | 21 | 10 | 0.09 | 0.10 | 1.13 | 0.78 |
| DSO | 56 | 47 | 1.23 | 30 | 0.23 | 22 | 10 | 22.90 | 9.88 | 5.37 | 0.01 |
| QR | 1.51 | 1.02 | 1.01 | 30 | 0.32 | 22 | 10 | 1.50 | 0.55 | 7.54 | 0.00 |
| ROE | 0.14 | 0.07 | 1.71 | 30 | 0.10 | 22 | 10 | 0.12 | 0.08 | 2.62 | 0.14 |
| DPO | 100 | 103 | −0.16 | 30 | 0.88 | 22 | 10 | 51.30 | 31.84 | 2.60 | 0.14 |
| LTA | 5.56 | 6.35 | −2.86 | 30 | 0.01 | 22 | 10 | 0.48 | 1.09 | 5.07 | 0.00 |
The red color means that differences in the values of individual indicators are statistically significant.
Table A10.
The student’s t-test results for the chosen ratios for green (1) and red (0) companies for 2008.
Table A10.
The student’s t-test results for the chosen ratios for green (1) and red (0) companies for 2008.
| Ratio | M 0 | M 1 | t-Value | df | p | Valid N 0 | Valid N 1 | Std. Dev. 0 | Std. Dev. 1 | F-ratio Variances | p Variances |
|---|---|---|---|---|---|---|---|---|---|---|---|
| ROA | 0.10 | 0.03 | 2.67 | 28 | 0.01 | 20 | 10 | 0.07 | 0.03 | 7.36 | 0.00 |
| DR | 0.39 | 0.35 | 0.58 | 28 | 0.57 | 20 | 10 | 0.18 | 0.17 | 1.11 | 0.92 |
| SWC | 0.13 | 0.05 | 1.27 | 28 | 0.21 | 20 | 10 | 0.19 | 0.09 | 4.46 | 0.03 |
| CR | 1.46 | 1.39 | 0.27 | 24 | 0.79 | 16 | 10 | 0.60 | 0.65 | 1.16 | 0.77 |
| TAT | 0.86 | 0.66 | 1.57 | 28 | 0.13 | 20 | 10 | 0.38 | 0.22 | 3.08 | 0.09 |
| ETL | 0.29 | 0.20 | 1.15 | 27 | 0.26 | 19 | 10 | 0.20 | 0.19 | 1.05 | 0.98 |
| DSI | 33 | 25 | 0.84 | 28 | 0.41 | 20 | 10 | 26.00 | 22.54 | 1.33 | 0.68 |
| ETA | 0.11 | 0.05 | 2.31 | 27 | 0.03 | 19 | 10 | 0.07 | 0.04 | 3.05 | 0.09 |
| CFA | 1.10 | 1.01 | 1.28 | 26 | 0.21 | 18 | 10 | 0.16 | 0.19 | 1.47 | 0.48 |
| CaR | 0.49 | 0.66 | −0.79 | 24 | 0.44 | 16 | 10 | 0.49 | 0.60 | 1.47 | 0.49 |
| ETS | 0.13 | 0.08 | 1.56 | 27 | 0.13 | 19 | 10 | 0.08 | 0.07 | 1.33 | 0.68 |
| DSO | 45 | 42 | 0.34 | 27 | 0.74 | 19 | 10 | 20.54 | 10.75 | 3.65 | 0.05 |
| QR | 1.33 | 0.90 | 1.06 | 27 | 0.30 | 19 | 10 | 1.21 | 0.59 | 4.31 | 0.03 |
| ROE | 0.17 | 0.05 | 2.72 | 28 | 0.01 | 20 | 10 | 0.13 | 0.05 | 7.21 | 0.00 |
| DPO | 77 | 96 | −1.29 | 28 | 0.21 | 20 | 10 | 39.01 | 38.97 | 1.00 | 1.00 |
| LTA | 5.47 | 6.30 | −2.99 | 28 | 0.01 | 20 | 10 | 0.44 | 1.10 | 6.38 | 0.00 |
The red color means that differences in the values of individual indicators are statistically significant.
References
- Aslani, A.; Mohaghar, A. Business structure in renewable energy industry: Key areas. Renew. Sustain. Energy Rev. 2013, 27, 569–575. [Google Scholar] [CrossRef]
- Doumpos, M.; Andriosopoulos, K.; Galariotis, E.; Makridou, G.; Zopounidis, C. Corporate failure prediction in the European energy sector: A multicriteria approach and the effect of country characteristics. Eur. J. Oper. Res. 2017, 262, 347–360. [Google Scholar] [CrossRef]
- The International Energy Agency. Available online: https://www.iea.org/statistics (accessed on 14 August 2019).
- The National Renewable Energy Action Plan of Czech. Republic, Estonia, Hungary, Lithuania, Latvia, Poland, Slovakia and Slovenia. Available online: http://ec.europa.eu/energy/renewables (accessed on 14 August 2019).
- Trück, S.; Weron, R. Convenience yields and risk premiums in the EU-ETS—Evidence from the Kyoto commitment period. J. Futures Mark. 2016, 36, 587–611. [Google Scholar] [CrossRef]
- Bohl, M.T.; Kaufmann, P.; Stephan, P.M. From hero to zero: Evidence of performance reversal and speculative bubbles in German renewable energy stocks. Energy Econ. 2013, 37, 40–51. [Google Scholar] [CrossRef] [Green Version]
- Henriques, I.; Sadorsky, P. Oil prices and the stock prices of alternative energy companies. Energy Econ. 2008, 30, 998–1010. [Google Scholar] [CrossRef]
- Inchauspe, J.; Ripple, R.D.; Truck, S. The dynamics of returns on renewable energy companies: A state-space approach. Energy Econ. 2015, 48, 325–335. [Google Scholar] [CrossRef]
- Kumar, S.; Managi, S.; Matsuda, A. Stock prices of clean energy firms, oil and carbon markets: A vector autoregressive analysis. Energy Econ. 2012, 34, 215–226. [Google Scholar] [CrossRef]
- Managi, S.; Okimoto, T. Does the price of oil interact with clean energy prices in the stock market? Japan World Econ. 2013, 27, 1–9. [Google Scholar] [CrossRef] [Green Version]
- Maryniak, P.; Trück, S.; Weron, R. Carbon pricing and electricity markets—The case of the Australian Clean Energy Bill. Energy Econ. 2019, 79, 45–58. [Google Scholar] [CrossRef]
- Capece, G.; Cricelli, L.; Di Pillo, F.; Levialdi, N. A cluster analysis study based on profitability and financial indicators in the Italian gas retail market. Energy Policy 2010, 38, 3394–3402. [Google Scholar] [CrossRef]
- Capece, G.; Cricelli, L.; Di Pillo, F.; Levialdi, N. New regulatory policies in Italy: Impact on financial results, on liquidity and profitability of natural gas retail companies. Util. Policy 2012, 23, 90–98. [Google Scholar] [CrossRef]
- Halkos, G.E.; Tzeremes, N.G. Analyzing the Greek renewable energy sector: A Data Envelopment Analysis approach. Renew. Sustain. Energy Rev. 2012, 16, 2884–2893. [Google Scholar] [CrossRef]
- Paun, D. Sustainability and financial performance of companies in the energy sector in Romania. Sustainability 2017, 9, 1722. [Google Scholar] [CrossRef]
- Clarkson, P.M.; Li, Y.; Richardson, G.D.; Vasvari, F.P. Does it really pay to be green? Determinants and consequences of proactive environmental strategies. J. Account. Public Policy 2011, 30, 122–144. [Google Scholar] [CrossRef]
- Ruggiero, S.; Lehkonen, H. Renewable energy growth and the financial performance of electric utilities: A panel data study. J. Clean. Prod. 2017, 142, 3676–3688. [Google Scholar] [CrossRef] [Green Version]
- Sueyoshi, T.; Goto, M. Can environmental investment and expenditure enhance financial performance of US electric utility firms under the Clean Air Act amendment of 1990? Energy Policy 2009, 37, 4819–4826. [Google Scholar] [CrossRef]
- Telle, K. “It pays to be green”—A premature conclusion? Environ. Resour. Econ. 2006, 35, 195–220. [Google Scholar] [CrossRef]
- Pätäri, S.; Arminen, H.; Tuppura, A.; Jantunen, A. Competitive and responsible? The relationship between corporate social and financial performance in the energy sector. Renew. Sustain. Energy Rev. 2014, 37, 142–154. [Google Scholar] [CrossRef]
- Arslan-Ayaydin, Ö.; Thewissen, J. The financial reward for environmental performance in the energy sector. Energy Environ. 2016, 27, 389–413. [Google Scholar] [CrossRef]
- Sueyoshi, T.; Goto, M. Data envelopment analysis for environmental assessment: Comparison between public and private ownership in petroleum industry. Eur. J. Oper. Res. 2012, 216, 668–678. [Google Scholar] [CrossRef]
- Jamasb, T.; Pollitt, M.; Triebs, T. Productivity and efficiency of US gas transmission companies: A European regulatory perspective. Energy Policy 2008, 36, 3398–3412. [Google Scholar] [CrossRef] [Green Version]
- Bobinaite, V. Financial sustainability of wind electricity sectors in the Baltic States. Renew. Sustain. Energy Rev. 2015, 47, 794–815. [Google Scholar] [CrossRef]
- Zięba, M.; Tomczak, S.K.; Tomczak, J.M. Ensemble boosted trees with synthetic features generation in application to bankruptcy prediction. Expert Syst. Appl. 2016, 58, 93–101. [Google Scholar] [CrossRef]
- Altman, E.I.; Iwanicz-Drozdowska, M.; Laitinen, E.K.; Suvas, A. Financial distress prediction in an international context: A review and empirical analysis of Altman’s Z-score model. J. Int. Financ. Manag. Account. 2017, 28, 131–171. [Google Scholar] [CrossRef]
- Altman, E.I.; Hotchkiss, E. Corporate Financial Distress and Bankruptcy, 3rd ed.; John Wiley & Sons: Hoboken, NJ, USA, 2006. [Google Scholar]
- Ward, J.H., Jr. Hierarchical grouping to optimize an objective function. J. Am. Stat. Assoc. 1963, 58, 236–244. [Google Scholar] [CrossRef]
- Anderberg, M.R. Cluster Analysis for Applications; Academic Press: New York, NY, USA, 1973. [Google Scholar]
- Everitt, B.S.; Landau, S.; Leese, M. Cluster Analysis; Arnold: London, UK, 2001. [Google Scholar]
- Kaufman, L.; Rousseeuw, P.J. Finding Groups in Data: An Introduction to Cluster Analysis; John Wiley & Sons: New York, NY, USA, 1990. [Google Scholar]
- Tryon, R.C.; Bailey, D.E. Cluster Analysis; McGraw Hill: New York, NY, USA, 1970. [Google Scholar]
Figure 1.
Electricity generation from renewable sources for selected EU countries, 1990–2018. Data source: [3].
Figure 1.
Electricity generation from renewable sources for selected EU countries, 1990–2018. Data source: [3].

Figure 2.
Electricity generation from renewable sources; share in the overall energy production for selected countries, 1990–2018 (in %). Data source: [3,4]. * The data for 2019 covers only the period from January to May.

Figure 3.
Yearly values of DSO and DPO for two groups of analysed companies, 2008–2017. Source: Own calculations based on data from EMIS database.
Figure 3.
Yearly values of DSO and DPO for two groups of analysed companies, 2008–2017. Source: Own calculations based on data from EMIS database.

Figure 4.
Yearly values of ROA and ROE for two groups of analysed companies, 2008–2017. Source: Own calculations based on data from EMIS database.
Figure 4.
Yearly values of ROA and ROE for two groups of analysed companies, 2008–2017. Source: Own calculations based on data from EMIS database.

Figure 5.
Cluster analysis for the analysed sample of companies, 2008–2017.


Table 1.
The sample of 37 energy companies analysed in this paper. The last column includes NAICS (North American Industry Classification System) codes for easier identification.
Table 1.
The sample of 37 energy companies analysed in this paper. The last column includes NAICS (North American Industry Classification System) codes for easier identification.
| No. | Country | Company | Industry (NAICS) |
|---|---|---|---|
| 1 | Czech Republic | Alpiq Generation (CZ) s.r.o. | Fossil Fuel Electric Power Generation (221,112) |
| 2 | Hungary | Alteo Nyrt. | Wind Electric Power Generation (221,115); Fossil Fuel Electric Power Generation (221,112) |
| 3 | Slovakia | Bratislavska teplarenska, a.s. | Fossil Fuel Electric Power Generation (221,112) |
| 4 | Hungary | Budapesti Eromu Zrt. | Fossil Fuel Electric Power Generation (221,112) |
| 5 | Slovakia | Bytkomfort, s.r.o. | Biomass Electric Power Generation (221,117); Fossil Fuel Electric Power Generation (221,112) |
| 6 | Poland | Cez Skawina S.A. | Fossil Fuel Electric Power Generation (221,112) |
| 7 | Hungary | Dunamenti Eromu Zrt. | Fossil Fuel Electric Power Generation (221,112) |
| 8 | Poland | Elektrocieplownia Chorzow Elcho Sp. z o.o. | Fossil Fuel Electric Power Generation (221,112) |
| 9 | Poland | Elektrocieplownia Zielona Gora S.A. | Fossil Fuel Electric Power Generation (221,112) |
| 10 | Poland | Elektrownia Stalowa Wola S.A. | Fossil Fuel Electric Power Generation (221,112) |
| 11 | Poland | Enea S.A. | Electric Power Generation (22,111) |
| 12 | Poland | Enea Wytwarzanie Sp. z o.o. | Fossil Fuel Electric Power Generation (221,112) |
| 13 | Estonia | Enefit Energiatootmine AS | Wind Electric Power Generation (221,115); Fossil Fuel Electric Power Generation (221,112) |
| 14 | Poland | Energa S.A. | Fossil Fuel Electric Power Generation (221,112); Electric Power Transmission, Control, and Distribution (22,112) |
| 15 | Czech Republic | Energotrans a.s. | Fossil Fuel Electric Power Generation (221,112) |
| 16 | Poland | Kogeneracja S.A. | Fossil Fuel Electric Power Generation (221,112) |
| 17 | Lithuania | Lietuvos elektrine AB | Fossil Fuel Electric Power Generation (221,112) |
| 18 | Hungary | Matrai Eromu Zrt. | Fossil Fuel Electric Power Generation (221,112) |
| 19 | Poland | PGE Elektrownia Opole S.A. | Fossil Fuel Electric Power Generation (221,112) |
| 20 | Poland | PGE Energia Ciepla S.A. | Fossil Fuel Electric Power Generation (221,112) |
| 21 | Poland | PGE S.A. | Biomass Electric Power Generation (221,117); Wind Electric Power Generation (221,115); Fossil Fuel Electric Power Generation (221,112) |
| 22 | Poland | PGE Torun S.A. | Fossil Fuel Electric Power Generation (221,112) |
| 23 | Poland | PGNIG Termika S.A. | Fossil Fuel Electric Power Generation (221,112) |
| 24 | Poland | Polenergia Elektrocieplownia Nowa Sarzyna Sp. z o.o. | Fossil Fuel Electric Power Generation (221,112) |
| 25 | Slovakia | PPC Power, a.s. | Fossil Fuel Electric Power Generation (221,112) |
| 26 | Latvia | Rigas Siltums AS | Fossil Fuel Electric Power Generation (221,112) |
| 27 | Slovakia | Slovenske Elektrarne, a.s. | Solar Electric Power Generation (221,114); Fossil Fuel Electric Power Generation (221,112) |
| 28 | Slovakia | STEFE Banska Bystrica, a.s. | Fossil Fuel Electric Power Generation (221,112) |
| 29 | Poland | Tauron Polska Energia S.A. | Fossil Fuel Electric Power Generation (221,112); Electric Power Transmission, Control, and Distribution (22,112) |
| 30 | Poland | Tauron Wytwarzanie S.A. | Fossil Fuel Electric Power Generation (221,112) |
| 31 | Slovenia | Teb d.o.o. | Solar Electric Power Generation (221,114); Fossil Fuel Electric Power Generation (221,112) |
| 32 | Hungary | Tisza Eromu Kft. | Fossil Fuel Electric Power Generation (221,112) |
| 33 | Poland | Veolia Energia Lodz S.A. | Fossil Fuel Electric Power Generation (221,112) |
| 34 | Poland | Veolia Energia Poznan Zec S.A. | Fossil Fuel Electric Power Generation (221,112) |
| 35 | Hungary | Vertesi Eromu Zrt. | Fossil Fuel Electric Power Generation (221,112) |
| 36 | Poland | Zespol Elektrowni PAK S.A. | Biomass Electric Power Generation (221,117); Fossil Fuel Electric Power Generation (221,112); Electric Power Transmission, Control, and Distribution (22,112) |
| 37 | Slovakia | Zvolenska teplarenska, a.s. | Fossil Fuel Electric Power Generation (221,112) |
Table 2.
Companies using renewable energy sources to produce energy.
| No. | Company | Energy Production from RES in TWh | RES Share in the Structure of Fuels Used to Generate Electricity | ||||||
|---|---|---|---|---|---|---|---|---|---|
| 2015 | 2016 | 2017 | 2018 | 2015 | 2016 | 2017 | 2018 | ||
| 1 | Alteo Nyrt. | 0.28 | 0.3 | n.d. | n.d. | 3.40% | 3.40% | n.d. | n.d. |
| 2 | Enefit Energiatootmine AS | 0.36 | 0.38 | 0.4 | n.d. | n.d. | n.d. | n.d. | n.d. |
| 3 | Bytkomfort, s.r.o. | 0.03 | n.d. | n.d. | n.d. | n.d. | n.d. | n.d. | n.d. |
| 4 | Slovenske Elektrarne, a.s. | 4.56 | 4.21 | 4.36 | 3.80 | 12.33% | 11.32% | 10.29% | 9.14% |
| 5 | Teb d.o.o. | 2 × 10⁻³ | n.d. | n.d. | n.d. | n.d. | n.d. | n.d. | n.d. |
| 6 | Enea S.A. | 0.85 | 0.54 | 1.83 | 2.03 | 16.55% | 19.94% | 17% | 11% |
| 7 | Enea Wytwarzanie Sp. z o.o. | 0.85 | 0.54 | 0.44 | 0.44 | 6.46% | 3.97% | 3% | 2% |
| 8 | Energa S.A. | 1.74 | 1.22 | 1.55 | 1.19 | 41% | 38% | 36% | 31% |
| 9 | PGE S.A. | 2.41 | 2.24 | 2.08 | 1.82 | n.d. | n.d. | 2.13% | n.d. |
| 10 | Tauron Polska Energia S.A. | 1.63 | 1.32 | 1.3 | 0.74 | n.d. | n.d. | n.d. | 11.19% |
| 11 | Tauron Wytwarzanie S.A. | n.d. | n.d. | 1 × 10⁻⁴ | n.d. | n.d. | n.d. | n.d. | 1.86% |
| 12 | Zespol Elektrowni PAK S.A. | 0.47 | 0.39 | n.d. | n.d. | n.d. | n.d. | n.d. | n.d. |
Table 3.
Set of chosen ratios considered in the analysis.
| ID | Description | Group |
|---|---|---|
| ROA | net profit/total assets | profitability |
| DR | total liabilities/total assets | debt |
| SWC | working capital/total assets | liquidity |
| CR | current assets/short-term liabilities | liquidity |
| TAT | sales/total assets | turnover |
| ETL | EBIT/total liabilities | debt |
| DSI | (inventory ×365)/sales | turnover |
| ETA | EBIT/total assets | profitability |
| CFA | constant capital/fixed assets | debt |
| CaR | (current assets - inventory - receivables) / short-term liabilities | liquidity |
| ETS | EBIT/sales | profitability |
| DSO | (receivables × 365)/sales | turnover |
| QR | (current assets - inventory)/short-term liabilities | liquidity |
| ROE | net profit/equity | profitability |
| DPO | (short-term liabilities × 365)/sales | turnover |
| LTA | logarithm of total assets | other |
Table 4.
Summary of results of Student’s t-test, 2008–2017.
| Ratio | 2017 | 2016 | 2015 | 2014 | 2013 | 2012 | 2011 | 2010 | 2009 | 2008 |
|---|---|---|---|---|---|---|---|---|---|---|
| ROA | no | no | no | no | no | yes | no | no | no | yes |
| DR | no | no | no | no | no | no | no | no | no | no |
| SWC | no | no | no | no | no | no | no | no | no | no |
| CR | no | no | no | no | no | no | no | no | no | no |
| TAT | no | no | no | no | no | no | no | no | no | no |
| ETL | no | no | no | no | no | no | no | no | no | no |
| DSI | no | no | no | no | no | no | no | no | no | no |
| ETA | no | no | no | no | no | no | no | no | no | yes |
| CFA | no | no | no | no | no | no | no | no | no | no |
| CaR | no | no | no | no | yes | yes | no | no | no | no |
| ETS | no | no | no | no | no | no | no | no | no | no |
| DSO | no | no | no | no | no | no | yes | no | no | no |
| QR | no | no | no | no | no | no | no | no | no | no |
| ROE | no | no | no | no | no | no | no | no | no | yes |
| DPO | no | no | no | no | no | no | no | no | no | no |
| LTA | yes | yes | yes | yes | yes | yes | yes | yes | yes | yes |
Table 5.
Results of Altman model, 2008–2017.
| Company name | 2017 | 2016 | 2015 | 2014 | 2013 | 2012 | 2011 | 2010 | 2009 | 2008 |
|---|---|---|---|---|---|---|---|---|---|---|
| Alpiq Generation (CZ) | 5.17 | 5.19 | 4.85 | 4.78 | 4.24 | 4.84 | 5.01 | 3.85 | 5.65 | 4.55 |
| Bratislavska teplarenska | 1.71 | 1.62 | 0.67 | 0.10 | −2.23 | 5.02 | 5.23 | 4.68 | 6.94 | 8.87 |
| Budapesti Eromu | 5.84 | 5.47 | −1.87 | 1.26 | 4.81 | 4.28 | −2.62 | 1.92 | 4.84 | 4.39 |
| Cez Skawina | 6.19 | 6.23 | 5.07 | 7.09 | 6.92 | 8.37 | 8.26 | 7.73 | 6.63 | 6.29 |
| Dunamenti Eromu | 5.57 | 6.04 | 0.72 | −5.93 | 3.22 | 4.86 | 5.32 | 6.41 | 9.19 | 10.53 |
| Elektrocieplownia Chorzow Elcho | - | - | - | - | 7.96 | 7.53 | 8.13 | 6.55 | 8.11 | 5.39 |
| Elektrocieplownia Zielona Gora | 6.68 | 5.80 | 5.81 | 5.37 | 6.74 | 6.26 | 6.29 | 6.40 | 6.02 | 5.41 |
| Elektrownia Stalowa Wola | - | - | - | - | - | - | - | 6.52 | 7.27 | 6.87 |
| Energotrans | 10.20 | 10.62 | 12.18 | 11.88 | 17.89 | 17.75 | 13.19 | 15.98 | 14.20 | 15.00 |
| Kogeneracja | 7.14 | 7.06 | 6.38 | 6.16 | 6.28 | 5.64 | 6.27 | 6.21 | 6.24 | 5.71 |
| Matrai Eromu | 8.65 | 10.35 | 8.34 | 8.52 | 8.73 | 8.52 | 8.76 | 7.55 | 7.12 | 6.67 |
| PGE Elektrownia Opole | - | - | - | - | - | - | 3.04 | 5.04 | 5.70 | 5.64 |
| PGE Energia Ciepla | - | 1.51 | 0.91 | 4.29 | 3.11 | 5.68 | 9.55 | 9.06 | 9.06 | 8.70 |
| PGE Torun | - | - | - | - | - | - | 11.61 | 12.13 | 10.30 | 6.35 |
| PGNIG Termika | - | - | - | - | - | - | - | - | 14.79 | 16.85 |
| Polenergia Elektrocieplownia Nowa Sarzyna | 5.44 | 4.78 | 5.55 | 3.86 | 3.34 | 4.17 | 4.38 | 5.99 | 4.95 | 5.67 |
| PPC Power | - | 0.92 | 0.65 | 8.85 | 19.51 | 3.48 | 6.14 | 5.23 | 3.74 | 15.98 |
| Rigas Siltums | 5.63 | 5.79 | 5.91 | 5.79 | 5.98 | 5.70 | - | - | - | - |
| STEFE Banska Bystrica | 4.45 | 3.76 | 4.35 | 4.59 | 4.67 | 4.85 | 4.95 | 5.15 | 5.10 | 5.10 |
| Tisza Eromu | 4.79 | 5.80 | 10.39 | 10.42 | 8.48 | 7.32 | 0.29 | 6.74 | 6.03 | 4.90 |
| Veolia Energia Lodz | 4.55 | 4.66 | 5.15 | 4.48 | 4.67 | 6.64 | 8.14 | 8.55 | 7.93 | 8.07 |
| Veolia Energia Poznan Zec | - | 5.27 | 5.50 | 4.45 | 4.74 | 5.39 | 4.84 | 6.52 | 6.24 | 5.51 |
| Alteo Nyrt | 6.00 | 5.27 | 5.24 | 4.67 | 3.46 | 3.90 | - | - | - | - |
| Bytkomfort | 8.74 | 7.62 | 8.48 | 7.93 | 7.48 | 7.21 | 5.71 | 7.68 | 6.24 | 6.47 |
| Energa | 5.93 | 5.40 | 6.08 | 6.24 | 5.85 | 6.05 | 6.60 | 6.74 | 7.75 | 8.05 |
| Enefit Energiatootmine | 0.51 | 0.80 | −1.71 | −0.14 | 0.67 | 0.05 | 2.75 | 3.61 | - | - |
| Enea Wytwarzanie | 4.89 | 4.65 | 3.98 | 5.69 | 6.60 | 10.49 | 10.58 | 8.92 | 8.42 | 8.03 |
| Enea | 6.08 | 6.39 | 6.07 | 7.93 | 7.99 | 8.61 | 8.93 | 9.54 | 9.30 | 8.90 |
| PGE | 5.98 | 6.35 | 5.78 | 7.53 | 7.80 | 7.67 | 7.42 | 6.98 | 7.77 | 5.93 |
| Slovenske Elektrarne | - | - | - | - | 3.26 | 3.63 | 3.35 | 2.55 | 2.28 | 1.42 |
| Tauron Polska Energia | 4.73 | 4.37 | 2.77 | 4.99 | 4.79 | 4.97 | 5.05 | 5.64 | 5.12 | 4.62 |
| Tauron Wytwarzanie | 3.26 | 2.97 | −0.37 | 3.97 | 4.81 | 4.96 | 5.35 | 5.85 | - | 5.23 |
| Teb | 8.97 | 15.77 | 29.50 | 20.98 | 23.39 | 17.12 | 15.04 | 20.56 | 13.25 | 11.08 |
| Zespol Elektrowni PAK | 5.53 | 5.11 | 0.89 | 5.33 | 5.90 | 5.89 | 6.85 | 6.44 | 6.77 | 4.27 |
The green colour means that the power plant is classified in the “safe zone” class, whereas the red colour indicates classification in the “distress zone” and the grey colour means the “grey zone”. Green colour of names of companies means that power plants are using renewable energy sources to produce energy. The values of the Altman model also differ for individual analysed enterprises. Therefore, the differences in the values were investigated to check whether these differences are statistically significant. The results of the Student’s t-test are presented in Table 6. The test results clearly indicate that the differences between the financial condition of green and red enterprises are statistically insignificant.
Table 6.
Student’s t-test results for Altman model values, 2008–2017.
| Year | M 0 | M 1 | t-Value | df | p | Valid N 0 | Valid N 1 | Std. Dev. 0 | Std. Dev. 1 | F-ratio Variances | p Variances |
|---|---|---|---|---|---|---|---|---|---|---|---|
| 2017 | 5.62 | 5.17 | 0.56 | 25 | 0.58 | 17 | 10 | 1.91 | 2.14 | 1.25 | 0.66 |
| 2016 | 5.42 | 4.89 | 0.59 | 28 | 0.56 | 20 | 10 | 2.44 | 1.92 | 1.63 | 0.46 |
| 2015 | 4.79 | 3.72 | 0.83 | 28 | 0.41 | 20 | 10 | 3.39 | 3.26 | 1.08 | 0.95 |
| 2014 | 5.96 | 5.42 | 0.50 | 27 | 0.62 | 19 | 10 | 2.93 | 2.39 | 1.50 | 0.54 |
| 2013 | 6.66 | 6.83 | −0.09 | 31 | 0.93 | 21 | 12 | 4.75 | 5.63 | 1.41 | 0.49 |
| 2012 | 6.43 | 6.71 | −0.22 | 31 | 0.83 | 21 | 12 | 3.00 | 4.22 | 1.99 | 0.18 |
| 2011 | 6.19 | 7.06 | −0.68 | 31 | 0.50 | 22 | 11 | 3.45 | 3.48 | 1.02 | 0.93 |
| 2010 | 6.73 | 6.39 | 0.32 | 31 | 0.75 | 23 | 10 | 2.96 | 2.16 | 1.89 | 0.33 |
| 2009 | 6.92 | 7.43 | −0.41 | 31 | 0.68 | 24 | 9 | 3.26 | 3.01 | 1.18 | 0.86 |
| 2008 | 7.42 | 6.40 | 0.79 | 32 | 0.44 | 24 | 10 | 3.69 | 2.74 | 1.81 | 0.36 |
| 2017 | 5.62 | 5.17 | 0.56 | 25 | 0.58 | 17 | 10 | 1.91 | 2.14 | 1.25 | 0.66 |
© 2019 by the author. Licensee MDPI, Basel, Switzerland. This article is an open access article distributed under the terms and conditions of the Creative Commons Attribution (CC BY) license (http://creativecommons.org/licenses/by/4.0/).
Share and Cite
MDPI and ACS Style
Tomczak, S.K. Comparison of the Financial Standing of Companies Generating Electricity from Renewable Sources and Fossil Fuels: A New Hybrid Approach. Energies 2019, 12, 3856. https://doi.org/10.3390/en12203856
AMA Style
Tomczak SK. Comparison of the Financial Standing of Companies Generating Electricity from Renewable Sources and Fossil Fuels: A New Hybrid Approach. Energies. 2019; 12(20):3856. https://doi.org/10.3390/en12203856
Chicago/Turabian StyleTomczak, Sebastian Klaudiusz. 2019. "Comparison of the Financial Standing of Companies Generating Electricity from Renewable Sources and Fossil Fuels: A New Hybrid Approach" Energies 12, no. 20: 3856. https://doi.org/10.3390/en12203856
Note that from the first issue of 2016, this journal uses article numbers instead of page numbers. See further details here.