Planning of the Charging Station for Electric Vehicles Utilizing Cellular Signaling Data


1
School of Transportation Engineering, Shandong Jianzhu University, Jinan 250101, China
2
Civil, Construction and Environmental Engineering, Iowa State University, Ames, IA 50011, USA
3
Tianjin Urban Planning & Design Institute, Tianjin 300201, China
*
Author to whom correspondence should be addressed.
Sustainability 2019, 11(3), 643; https://doi.org/10.3390/su11030643
Submission received: 17 December 2018
/
Revised: 22 January 2019
/
Accepted: 23 January 2019
/
Published: 26 January 2019
(This article belongs to the Special Issue Sustainable Transportation for Sustainable Cities)
Abstract
:Electric Vehicles (EVs), by reducing the dependency on fossil fuel and minimizing the traffic-related pollutants emission, are considered as an effective component of a sustainable transportation system. However, the massive penetration of EVs brings a big challenge to the establishment of charging infrastructures. This paper presents the approach to locate charging stations utilizing the reconstructed EVs trajectory derived from the Cellular Signaling Data (CSD). Most previous work focused on the commute trips estimated from the number of jobs and households between traffic analysis zones (TAZs). This paper investigated the large-scale CSD and illustrated the method to generate the 24-hour travel demand for each EV. The complete trip in a day for EV was reconstructed through merging the time sequenced trajectory derived from simulation. This paper proposed a two-step model that grouped the charging demand location into clusters and then identified the charging station site through optimization. The proposed approach was applied to investigate the charging behavior of medium-range EVs with Cellular Signaling Data collected from the China Unicom in Tianjin. The results indicate that over 50% of the charging stations are located within the central urban area. The developed approach could contribute to the planning of future charging stations.
1. Introduction
According to statistics, the transportation sector contributes over a half of the oil consumption and a quarter of the CO2 emissions, which is considered one of the factors resulting in the Greenhouse effect [1]. Electric vehicles (EVs), by reducing the dependency on crude oil and minimizing the transportation-related pollutants emission, are regarded as an effective component in a sustainable transportation system and are becoming increasing popular [2,3,4]. China produced 794,000 new energy vehicles in 2017, a substantial rise of 53.8% from a year earlier, including 478,000 battery-electric passenger vehicles, 114,000 plug-in hybrid passenger vehicles, and 188,000 battery-electric commercial vehicles [5]. However, the massive penetration of EVs brings the big challenge of EV recharge–related issues.
Therefore, to provide electrical energy for EVs, charging stations and battery technology considering actual EV field trips are attracting more and more attention from researchers [6,7]. Appropriate planning of charging station sites and scales is critical to reduce the adverse impacts and improve the service quality of EVs. Basically, there are two types of charging station: slow and fast. Slow charging infrastructure can be easily installed at home or the workplace, and the EV charger is regarded as a household appliance. Therefore, existing research mainly focuses on fast charging infrastructure, which is open for public use. This paper illustrates the approach to locate the public charging stations utilizing the reconstructed EVs trajectory derived from simulation. In order to capture the real-world travel patterns, a method to generate 24-hour travel demand with cellular signaling data (CSD) was proposed. For each EV, the complete trip was reconstructed by merging the time sequenced trajectory exported from simulation. Additionally, a two-step optimization model considering driver convenience was developed to determine the sites of the charging stations was developed, and then the effective charging station layouts based on a different clustering approach were compared with a real-world case study. The abbreviations and variables used in the paper were illustrated in Table 1.
2. Literature Review
Generally, the placement of EV charging stations is a typical facility locating and sizing problem from the point of view of mathematics. Therefore, mathematical programming (MP) was commonly utilized to deal with the charging station locating problem when considering various impacts, such as economic impacts, environmental impacts, and traffic impacts [8,9,10,11].
Travel demand is the indispensable component to generate the travel routes of EVs, which provide the basic geographic information to locate charging stations. Several studies conducted the planning of EV charging stations with assumed traffic flow and network [12,13,14]. Among them, Ge et al. [13] proposed the optimization model considering both the benefits of the power company and the electric vehicle users. The results demonstrate traffic flow’s influence on the site and service area of charging stations. Since the assumed schemes would be impractical from transportation perspective, the travel demand model was introduced. Wang et al. [15] developed an optimization model to reduce power loss and voltage deviation in a distribution system. With the traffic flow data generated artificially by the gravity spatial interaction model, the data-envelopment analysis (DEA) method was used to evaluate the alternatives. Liu et al. [16] adopted a two-stage screening approach with environmental impacts and coverage radius to identify the effective locations of EV charging stations. The scale of the charging station was optimized based on the total cost, including investment, operation, and maintenance costs. In He et al. [17], an equilibrium framework for coupled transportation and power network was developed. A given number of public charging stations were allocated to a set of potential locations through maximizing social welfare associated with both the transportation and power networks. The travel demand was estimated based on the trip production table. In a study of the Ohio central region [18], the demographic, socioeconomic, and vehicle ownership in each Traffic Analysis Zone (TAZ) were collected to generate the EVs trips. The optimization model was built to maximize the number of EVs that charge. To optimize the locations and size of charging stations, Sadeghi-Barzani et al. [19] proposed a Mixed-Integer Non-Linear (MINLP) model in terms of the station development cost, EV energy loss, electric gird loss, and the location of electric substations and urban roads. By considering the minimization of two factors in distribution system—voltage deviation and power loss—Hanabusa et al. [20] and Jia et al. [21] conducted the optimization of charging stations planning problem in diverse countries. However, the travel demand model mainly captured the commute trips.
With the development of information technology, researchers started to explore the trajectory data in the locating problems of charging station on the basis of the floating vehicles, such as taxis, with Global Positioning System (GPS) devices [22]. Several researchers investigated how to maximize the electrification of itineraries. Long-term trajectory data were collected by Dong et al. [23] to simulate the trips of EVs, and the objective function was to minimize the total number of the missed trips. Shahraki et al. [24] proposed optimizing charging station locations with real-world taxi trajectory. The Mixed-Integer Non-Linear Programming (MINLP) model is implemented to optimize the charging station locations by considering the amount of recharge electricity and travel distance. Li et al. [25] proposed a multi-period multi-path refueling location model to capture the dynamics in the topological structure of the network. Yang et al. [26] illustrated a data-driven optimization-based approach by considering the goal of reducing investment. Tu et al. [27] developed a spatial–temporal demand coverage approach for optimizing the placement of Electric Taxi (ET) charging stations in the space–time context. The location model is built in terms of the performance of the taxi and the charging station. Simultaneously, some researchers also explored how to adopt more objectives in the optimal problem for EV charging stations. Cai et al. [28] adopted large-scale taxi trajectory data to present the public travel demand. The environmental impacts were also assessed for different charging infrastructure siting scenarios. He et al. [29] aimed at incorporating the local constraints of supply and demand on public EV charging stations into facility location models by considering the construction costs and service area of charging station. Liu et al. [30] investigated an optimization model with multi-objectives, such as economic, environmental, and social factors. One-month taxi trajectory data were collected to locate the charging station locations based on the parking placement of taxis. However, the travel patterns of EV taxis may not fully represent the travel patterns of private vehicles.
Additionally, the simulation approach was also developed to predict the trips of private vehicles [31,32,33,34]. Hiwatari et al. [31] attempted to analyze EVs’ trajectories based on a proposed traffic simulator. The simulator assumed all the EVs to be household vehicle and to have started from the house through the Origin-Destination (OD) algorithm. The travel route was determined through Dijkstra’s algorithm with shortest travel time path. To assist the decision-making process of the governor, Hiwatari et al. [34] proposed an algorithm to identify the effective charging stations sites. The OD data for the traffic simulation is estimated based on the number of population and business facilities in each zone. Nevertheless, the other purposes of trips made by EVs were not considered in these studies. To be more accurate, the long-term charging demand of individual EVs was investigated in [35,36] with an improved probabilistic model. The peak and variation problems in both the transportation system and power system were explored. Moreover, Hernández et al. [37] proposed the model for EVs and charging stations operated in the vehicle-to-grid (V2G) mode, which could improve the stability of the power system with primary frequency control (PFC) and dynamic grid support (DGS).
In summary, mathematical programming (MP) is still an effective approach to deal with the charging station location problem. The travel demand model can provide quick estimation of EV trips, while the trajectory data, such as the taxi GPS data, would better represent the real-world travel patterns of EVs.
3. Data Preprocess and Development of the Two-Step Optimization Model
3.1. Cellular Signaling Data Collection and Preprocess
Real-world vehicle travel patterns, especially for EVs, can provide abundant information to investigate charging demand. Nevertheless, it is impractical to adopt the travel information from all private vehicles. Therefore, cellular signaling data (CSD) was considered to provide the travel information.
In recent years, with the development of cellular positioning technology, CSD has been used to infer Origin-Destination (OD) trips [38,39]. CSD contains time-stamped coordinates whenever the cellphone is in calling, texting or surfing the internet. Thus, spatio-temporal information about the customers’ daily travel pattern can be collected by the cellphone carrier automatically. Alexander et al. [38] provided a method to estimate average daily OD trips from mobile phone records. The activity locations are inferred to be home, work, and other purposes depending on the observation frequency, day of week, and time of day. The trips can be constructed for each user between two consecutive observations in a day. The results obtained were consistent with the National Household Travel Survey. Widhalm et al. [39] proposed a method to identify the activity patterns using activity time, duration, and land use. The activity location is detected through the minimum stay duration and trip distance. The interaction between activity purpose, land use feature, and trip schedule was analyzed through the Relational Markov Network, and the activities were able to be inferred through merging the trip chains.
In this paper, the activity locations for each cellular customer were inferred based on the collected CSD. The data pre-process procedures containing Data Cleansing, Identification of Activity Location, and Inference of Activity Purpose are illustrated in the following section.
3.1.1. Data Cleansing
The CSD dataset, containing the geographic information of coordinates, was arranged by time sequence. Table 2 demonstrates a sample of the CSD dataset. The number represents the anonymous customer ID. Lac and ci represent the cellphone signal station ID. Time_start and Time_end represent the start and end time stamp for each signal station. Longi and Lati represent the coordinate information.
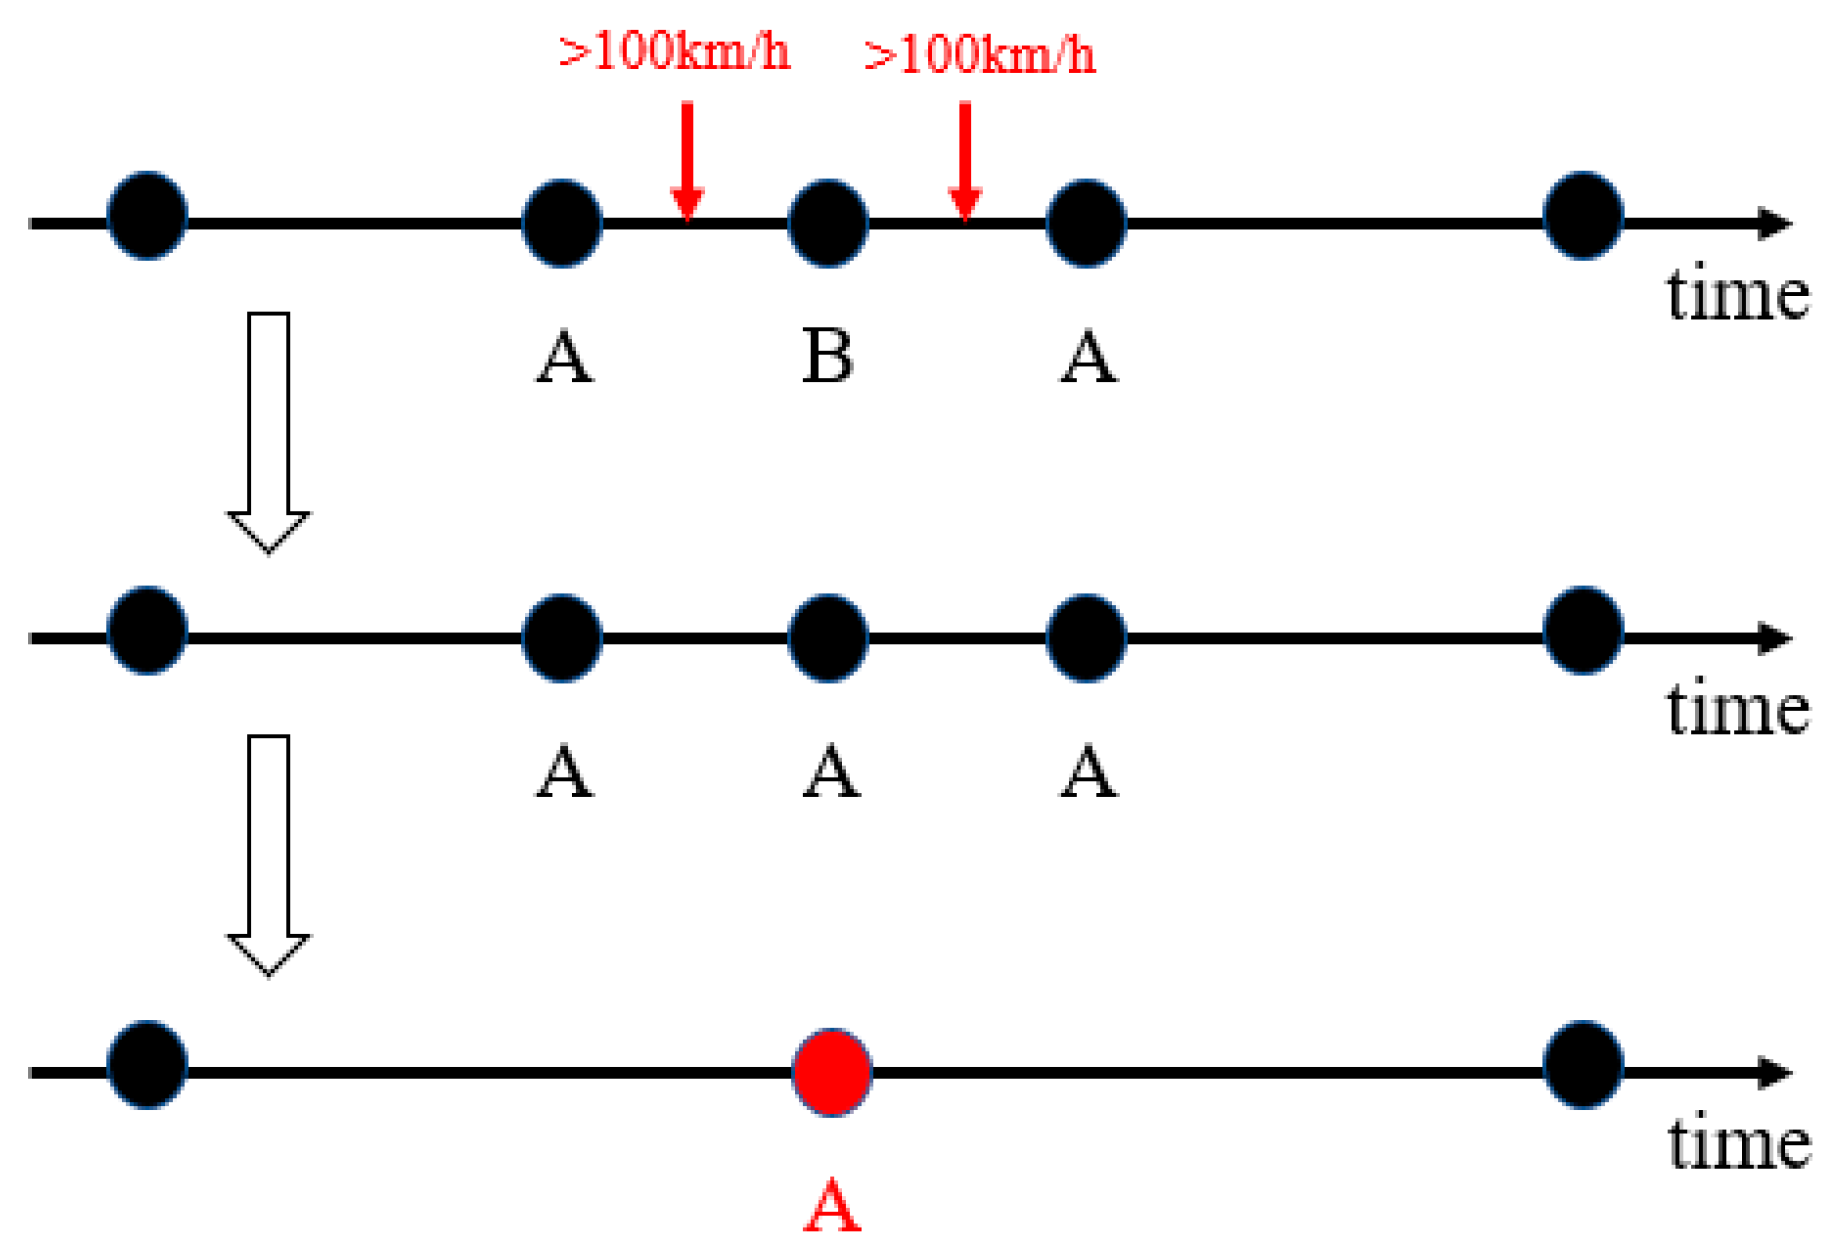
The data cleansing process aims at clearing the invalid data. The NULL value records, lacking time records or coordinates, are removed. Duplicated records are merged as new records with an updated time stamp. The “ping-pang” data records, defined as the noise data, are influenced by the communication technology. This illustrates the signal transmission between adjacent cellular stations in a short time while the customer is close to the service edge of the cellular station.
As shown in Figure 1, the continuous records with signal station ID “A-B-A” is considered to be the “ping-pang” data records. If the signal transmitting speed is over 100km/h, the B station will be assigned the new ID A, and a new record would be created by merging the records with signal ID A.
3.1.2. Identification of Activity Location
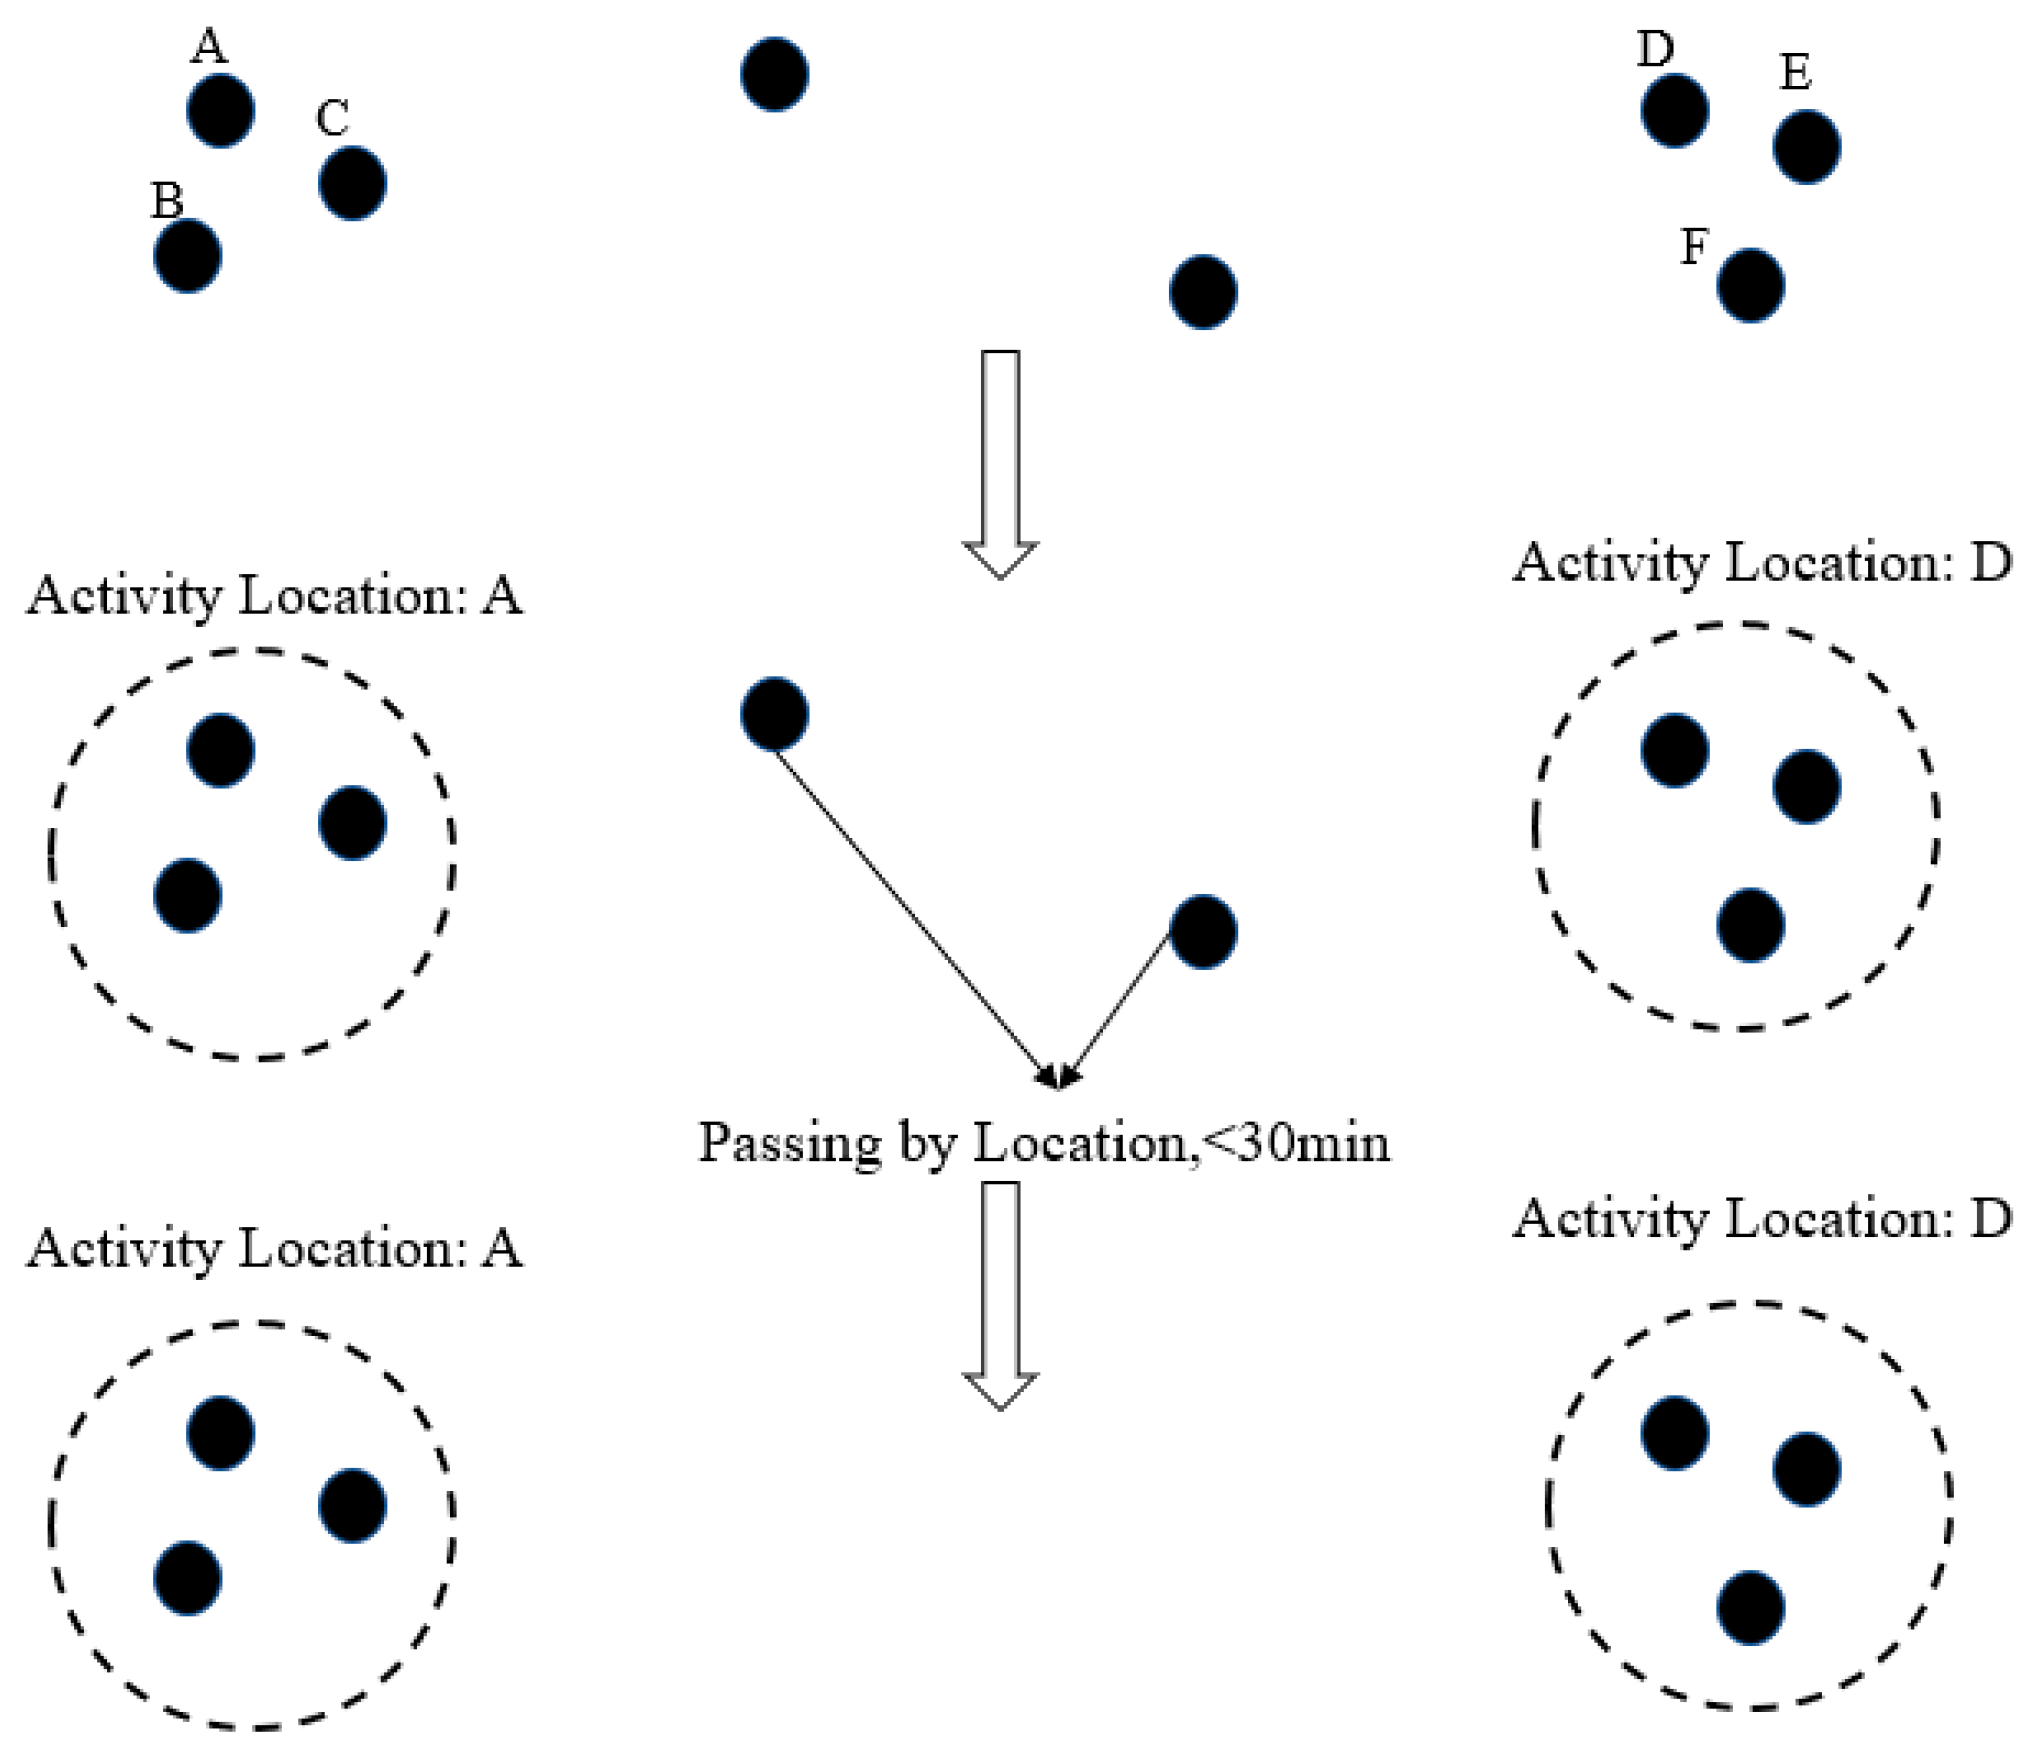
This section proposed to identify the activity locations for a cellular customer according to the CSD records. Since the CSD records are spatial-temporally discrete, the effective activity information can be inferred through data aggregation analysis. For instance, while the cellular customer is working, a series of CSD records would be generated with different signal stations. Thus, it is necessary to combine these CSD records representing the same activity.
The activity duration and activity radius are the two main principles to identify the activity locations. As Figure 2 presents, the CSD records can be identified as the same activity if the distance is within the activity radius. The new CSD records can be created by merging these records. In order to validate the activity, a time threshold was also utilized. The passing by location records are removed if the activity duration is too short. Various threshold values for activity radius and duration were tested in this research, which generate a trip rate ranging from 1.63 to 3.91. The 30 min activity duration and 1 km activity radius are regarded as the effective threshold value, as the trip rate is 2.13, which is consistent with the travel survey in Tianjin [40].
3.1.3. Inference of Activity Purpose
Besides the commute trips, the other purpose trips were also considered in the paper. The purpose of activity locations was determined by the time of day. For instance, the cellular customer’s “home” location is defined as the place with the most visits between 8 pm and 8 am for each day during the observation period, while the “work” location is defined as the place with the most visits on weekdays between 8 am and 8 pm during the observation period. The “other” purpose trips, such as shopping and recreation, can be inferred based on the land use information adjacent to the activity location. Since the detailed land use information was not collected in the paper, the rest of the locations are regarded as the “other” purpose place.
With the activity location and purpose inferred from the Cellular Signaling Data, the 24-hour travel demand for the cellular customer is able to generate based on the time sequence of each activity.
3.2. Reconstruction of EV’s Trip Based on the Simulated Trajectory
Network EXplorer for Traffic Analysis (NEXTA) is an open-source Graphic User Interface (GUI) that aims to facilitate the preparation, post-processing, and analysis of transportation assignment, simulation, and scheduling datasets [41]. NEXTA is a mesoscopic simulation tool, which is able to monitor the trajectory of the simulated vehicle. The exported trajectory contains the detailed information of the nodes that the vehicles pass by in the network.
In the paper, the trajectory of the EV was generated by NEXTA. Since the exported EV trajectory from NEXTA presents the one-way trip with one starting point and one ending point for a unique vehicle ID in the simulation, an EV trip containing several discrete trips can be reconstructed through merging them. The detailed procedure is described as follows:
- Step 1: Obtain all the activity locations of one EV in a day according to the CSD records.
- Step 2: Match the start activity location and end activity location to OD pairs in the NEXTA network by coordinates and timestamps. Assign the vehicle trajectory between OD pairs to corresponding start and end activity locations.
- Step 3: Combine the discrete vehicle trajectory between activity locations in terms of the time sequence for one EV.
- Step 4: Repeat Step 1 to Step 3.
3.3. Two-Step Optimization Model
A two-step optimization model to locate the charging station was developed in this section. For the first step, the spatial data derived from the EV trajectory was grouped into charging demand clusters through clustering analysis. The generated clusters provide the potential location for charging stations. An optimization model was then utilized to solve the charging station location problem with the charging demand clusters in the first stage. The detailed procedures are described in the following sections.
3.3.1. Clustering Analysis
Clustering analysis aims to combine the objects with similar attributes into a group. In this area, the spatial data of EV charging demand locations is grouped into clusters through clustering analysis. Traditionally, each cluster corresponds to one charging station. To distinguish the charging demand clusters, existing clustering approaches can be utilized to conduct the analysis in the paper [42,43].
Density-based spatial clustering of applications with noise (DBSCAN) is a well-known clustering algorithm in machine learning. Unlike other clustering algorithms, DBSCAN generates a propriate number of clusters. Moreover, it groups neighbor points based on a Euclidean distance (Eps) and a minimum number of points (MinPts), which are the two predetermined parameters. The basic steps of DBSCAN are
- Randomly select an initial point from the spatial database,
- If another point from the primary point is within the Eps and MinPts requirements—this point would be merge with the initial point into a cluster,
- A cluster is created if the initial point is a core point,
- DBSCAN visits the next point of the database if the initial point is a border point and no points are density-reachable from it,
- Repeat steps 1–4 until all of the points have been processed.
Hierarchical clustering (HClust), also known as hierarchical cluster analysis, is able to produce a number of clusters organized as a hierarchical tree, which can be illustrated in the dendrogram. HClust requires the initial number for cluster at the beginning. Traditionally, similarity or distance matrix is adopted in the hierarchical algorithms. The basic steps of HClust are
- Assign each point to a cluster such that all the points belong to a unique cluster, respectively,
- Find the closest pair of clusters and merge them into single cluster,
- Compute the Euclidean distance between new cluster and each of old clusters,
- Repeat steps 1–3 until all points are clustered into the initial number of clusters.
K-means clustering is a type of partitional clustering approach. The goal of this algorithm is to assign the points to the cluster with the centroid, whose number must be determined in advance. Subsequently, minimizing the sum of the distance for the points to their respective centroid is the objective. The basic steps of K-means are
- Partition the spatial dataset into the predetermined number of clusters randomly,
- Calculate the Euclidean distance from an initial point to each cluster. If its own cluster is the closest to the initial point, the initial point would be reserved in this cluster. Otherwise, the initial point would be moved into the cluster that is the closest to the initial point,
- Repeat step 2 until all the data point is reached, and no point would move from one cluster to another.
In this paper, data normalization is needed since the charging demand location is represented by the longitude and latitude coordinates that are on the elliptical earth. Therefore, the longitude and latitude coordinates were converted to x- and y-coordinates on a flat surface utilizing the Python pyproj package [44]. The Euclidean distance is used as the similarity measure, which is computed as
where, represent the horizonal coordinates and represent the vertical coordinates.
3.3.2. Optimization Model for Charging Station
The optimization model can be applied to the charging demand clusters produced in the clustering analysis section. The objective of optimization is to minimize the total operating costs by assigning the charging station to the selected charging demand cluster. To consider the convenience of drivers, the travel time to the charging station is utilized to represent the operating costs. The notations used in the paper are listed as follows:
Notations:
The mathematical model considers the decision variable:
The formulation of the optimization model is as follows:
The optimization model is a linear programming problem that each charging station is assigned to one charging demand cluster, and each charging demand cluster is served by one charging station. Therefore, the number of stations I and the number of charging demand clusters J are the same.
3.4. Parameters Setting and Charging Behavior of EV
In terms of market statistics, electric vehicles may have driving ranges over 400 km with the development of battery technology. This paper focuses on the medium range (around 100 km) EVs that are more likely to generate charging demand.
Based on the survey from [31], the battery capacity of a medium range EV is assumed to be 12 kwh, while the average energy consumption is 6.7 km/kwh. The state of charge (SOC) determines the location where the charging alarm is generated. The SOC is set to 30% in the paper, and the battery could be charged by 80% of SOC in 15 min while the charging station accepts a high C-rates at 2C. The function for SOC can be expressed as
where t is the time and is the remaining battery state. is equal to 30%. is the battery capacity and 12 kwh. is the cumulative vehicle travelled distance of EV. is the average energy consumption of EV, 6.7 km/kwh.
In fact, the driver can decide to recharge the EV at the adjacent charging station or continue the trip based on the distance to the destination, while the . If the remaining energy is sufficient to the destination, the EV can continue the trip. Otherwise, the EV can receive a recharge. This principle is implemented to search for the charging demand sites among the charging alarm sites.
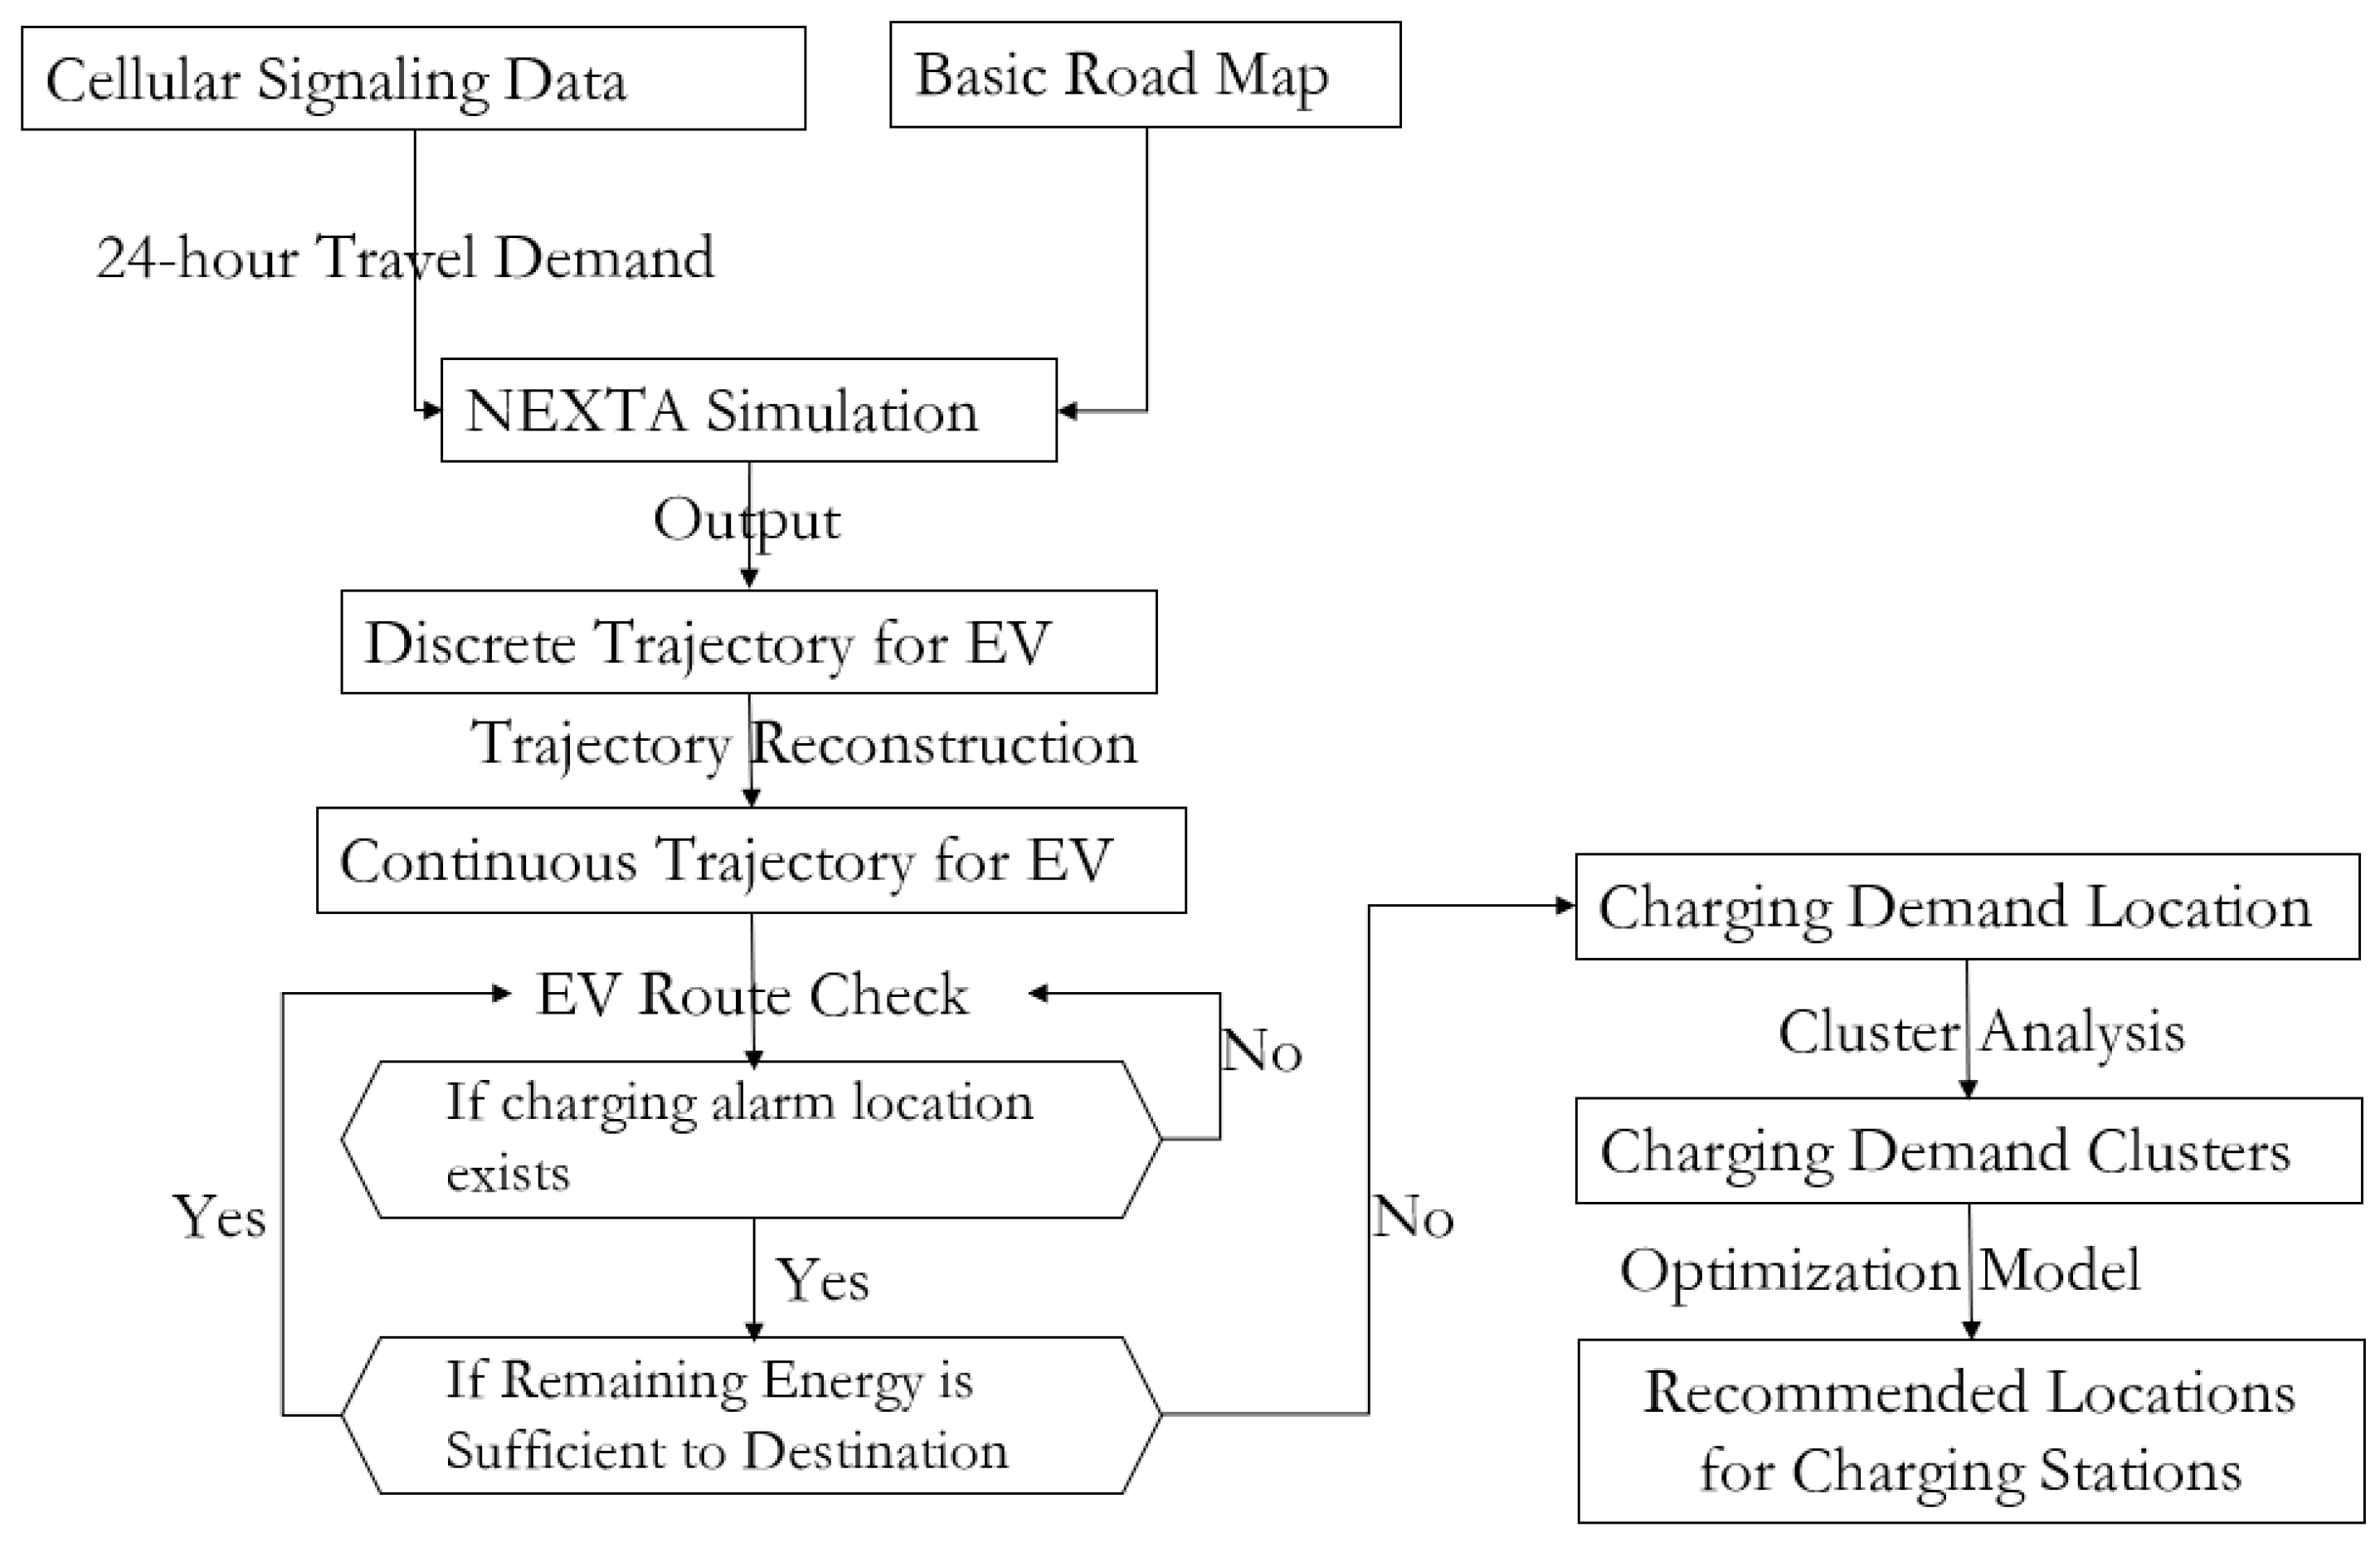
As discussed above, the procedures to identify the charging station location are demonstrated in the following flow chart in Figure 3.
4. Case Study and Results
4.1. Real-World Travel Patterns of EVs Derived from Cellular Signalling Data (CSD)
In this paper, the planning of EV charging stations in Tianjin was investigated. To capture the real-world travel patterns of EVs, the CSD of Tianjin for one week, 18 September 2016 to 24 September 2016, was collected from China Unicom, which is one of three mobile telecom carriers. Around 175,000 active cellular customers emerged in the dataset. According to the existing research, travel demand of EVs usually refers to commute trips, and the number of household and job opportunities were commonly used to estimate the travel demand without considering the travel patterns. This paper proposed to generate the hourly travel demand for EV with all the purpose of activity locations.
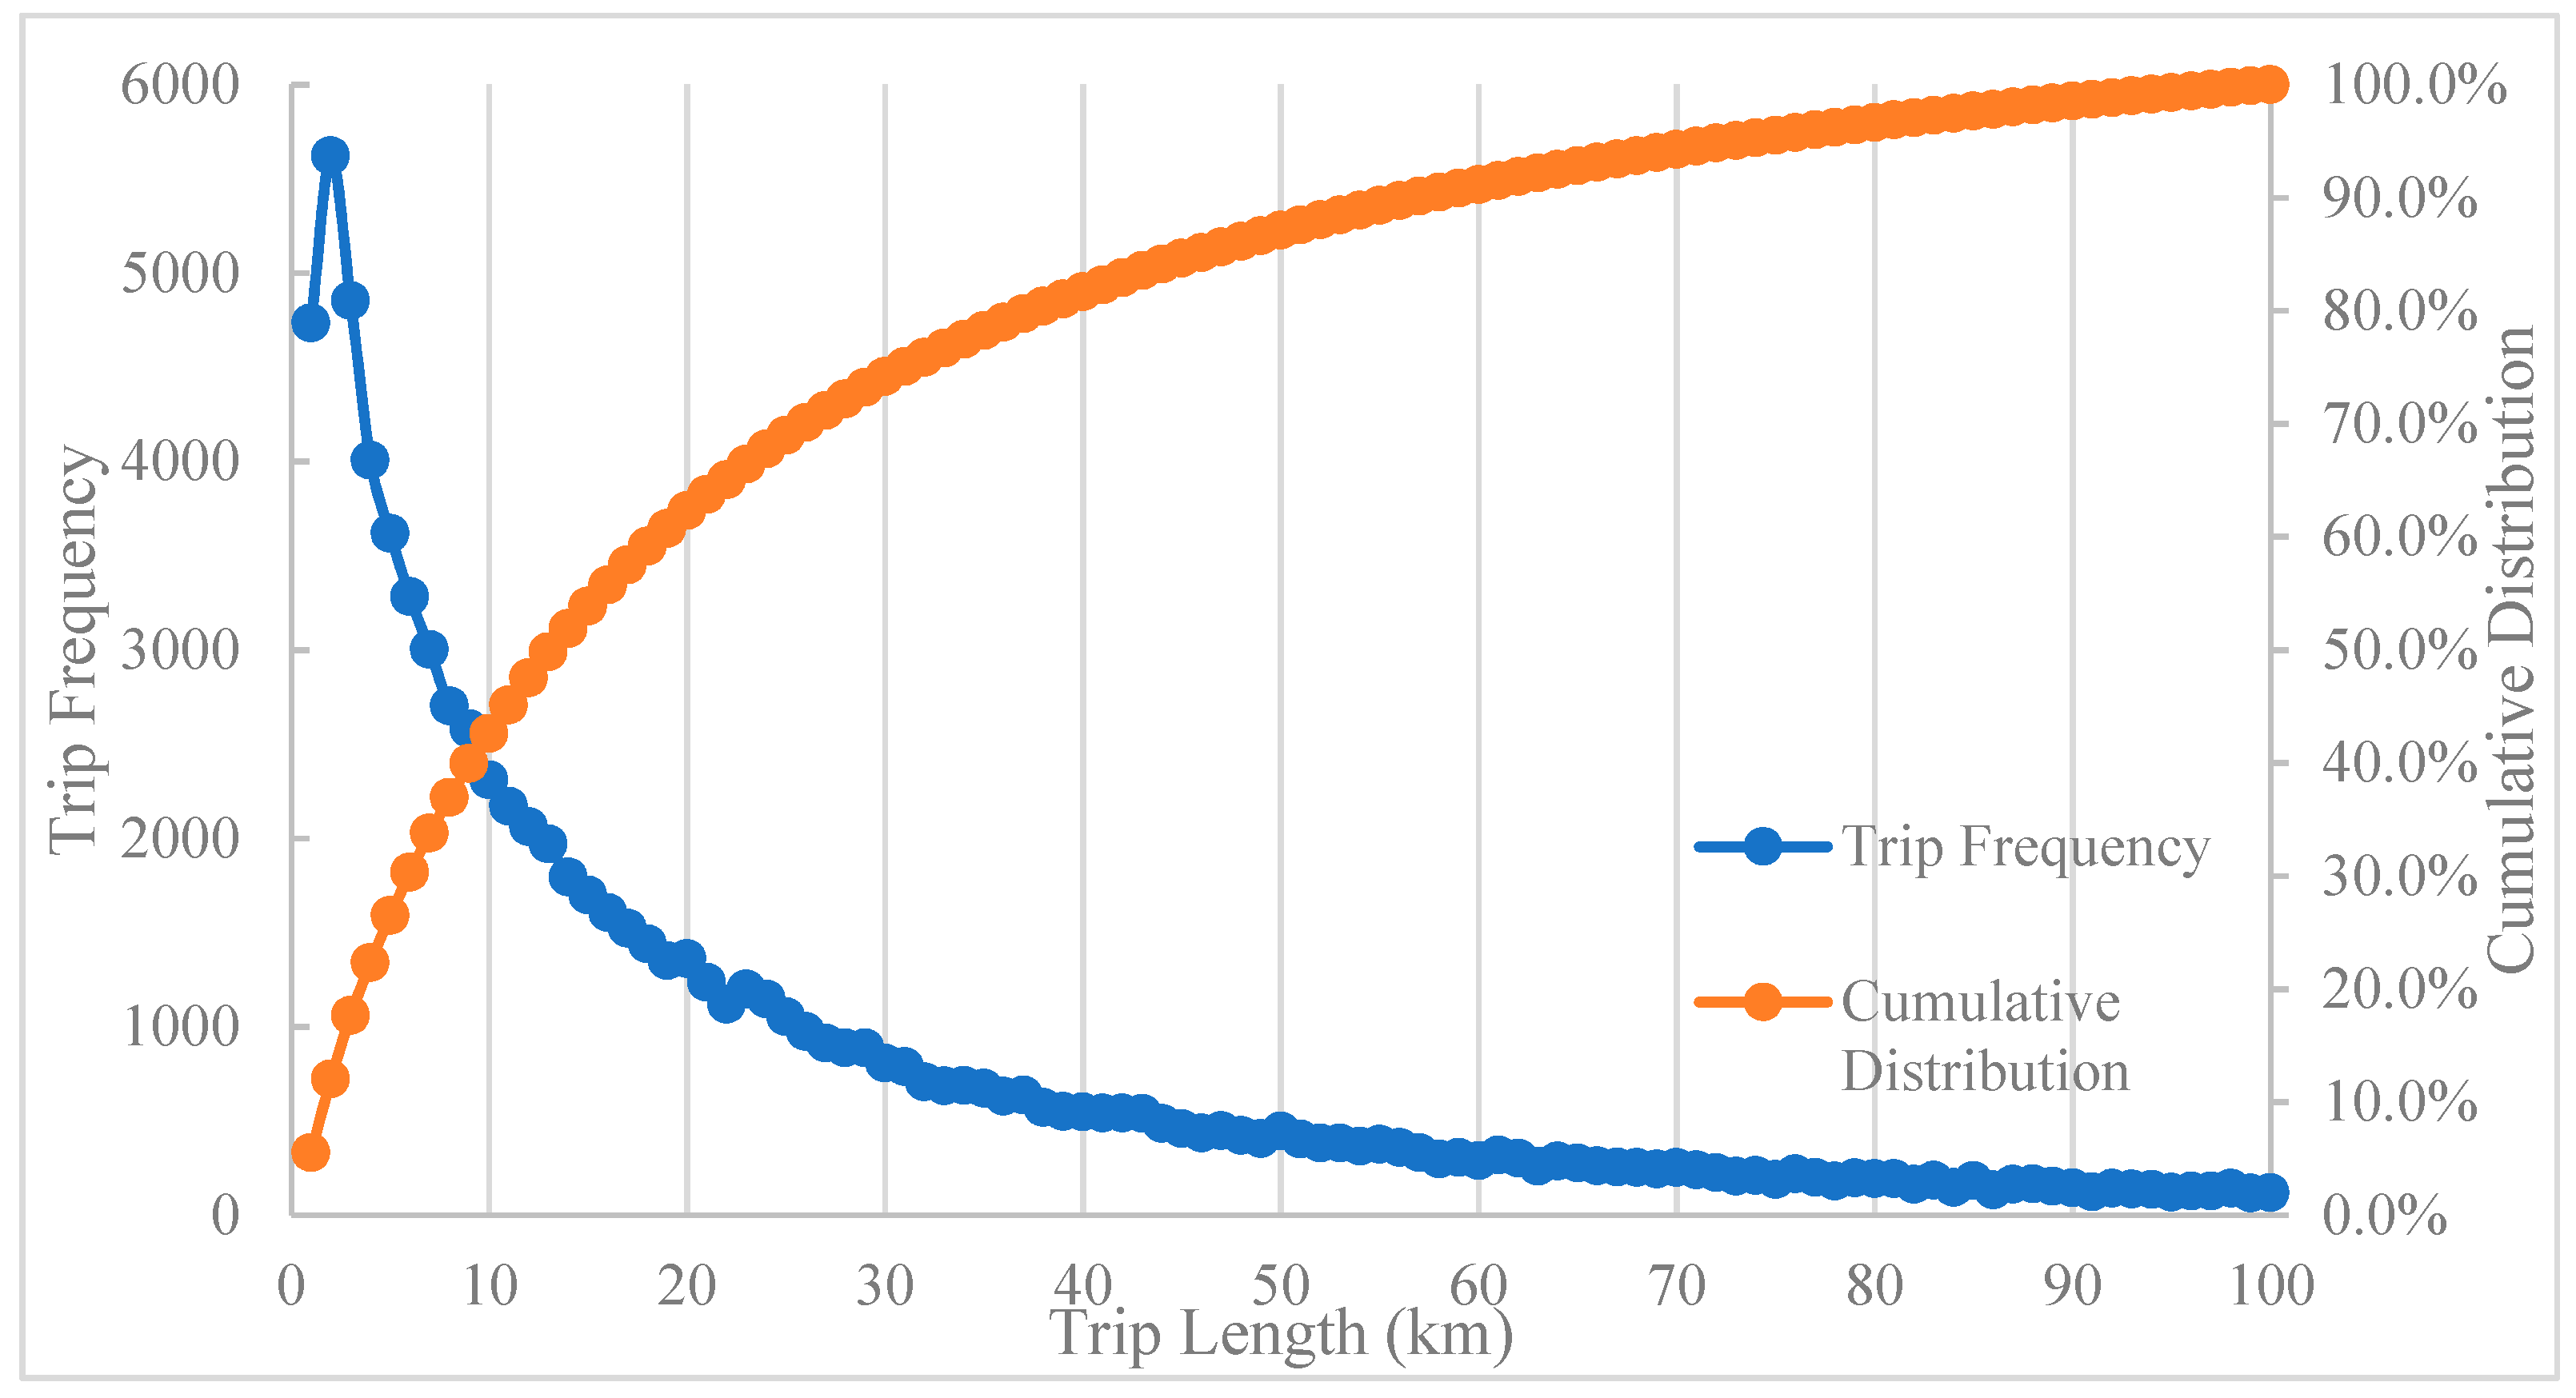
The CSD only covered one or several days for a cellular customer in the observed week, since the cellular customer may not use their cellphone every day. In terms of the statistical analysis, there were 118,245, active cellular customers on 19 September 2016. In addition, multiday trips were not considered in the paper, as most of the EVs would get recharge at night. In order to cover more cellular customers, the data on 19 September 2016 was utilized to generate the travel demand. Figure 4 presents the distribution of trip frequency by the cumulative trip length for each customer on 19 September 2016. The cumulative trip length was computed based on the continuous distance between origins and destinations.
It can be noted from Figure 4 that most of the trips are shorter than 30 km. Generally, the travel modes of trips consist of walking, riding a bicycle, using public transit, and using a private car. In terms of the travel survey of Tianjin [45], the walk and bicycle travel modes have short trip lengths mainly under 10 km. This trip length is the one-way trip compared to the cumulative trip length in Figure 4. Due to the fuzzy positioning technology of each cellular station, it is difficult to distinguish the trips whose length is over 10 km using public transit and private car according to driving behavior and speed. Therefore, the daily trips whose length is over 20 km are assumed to be EV trips in the paper, and these trips were used to generate basic travel demand.
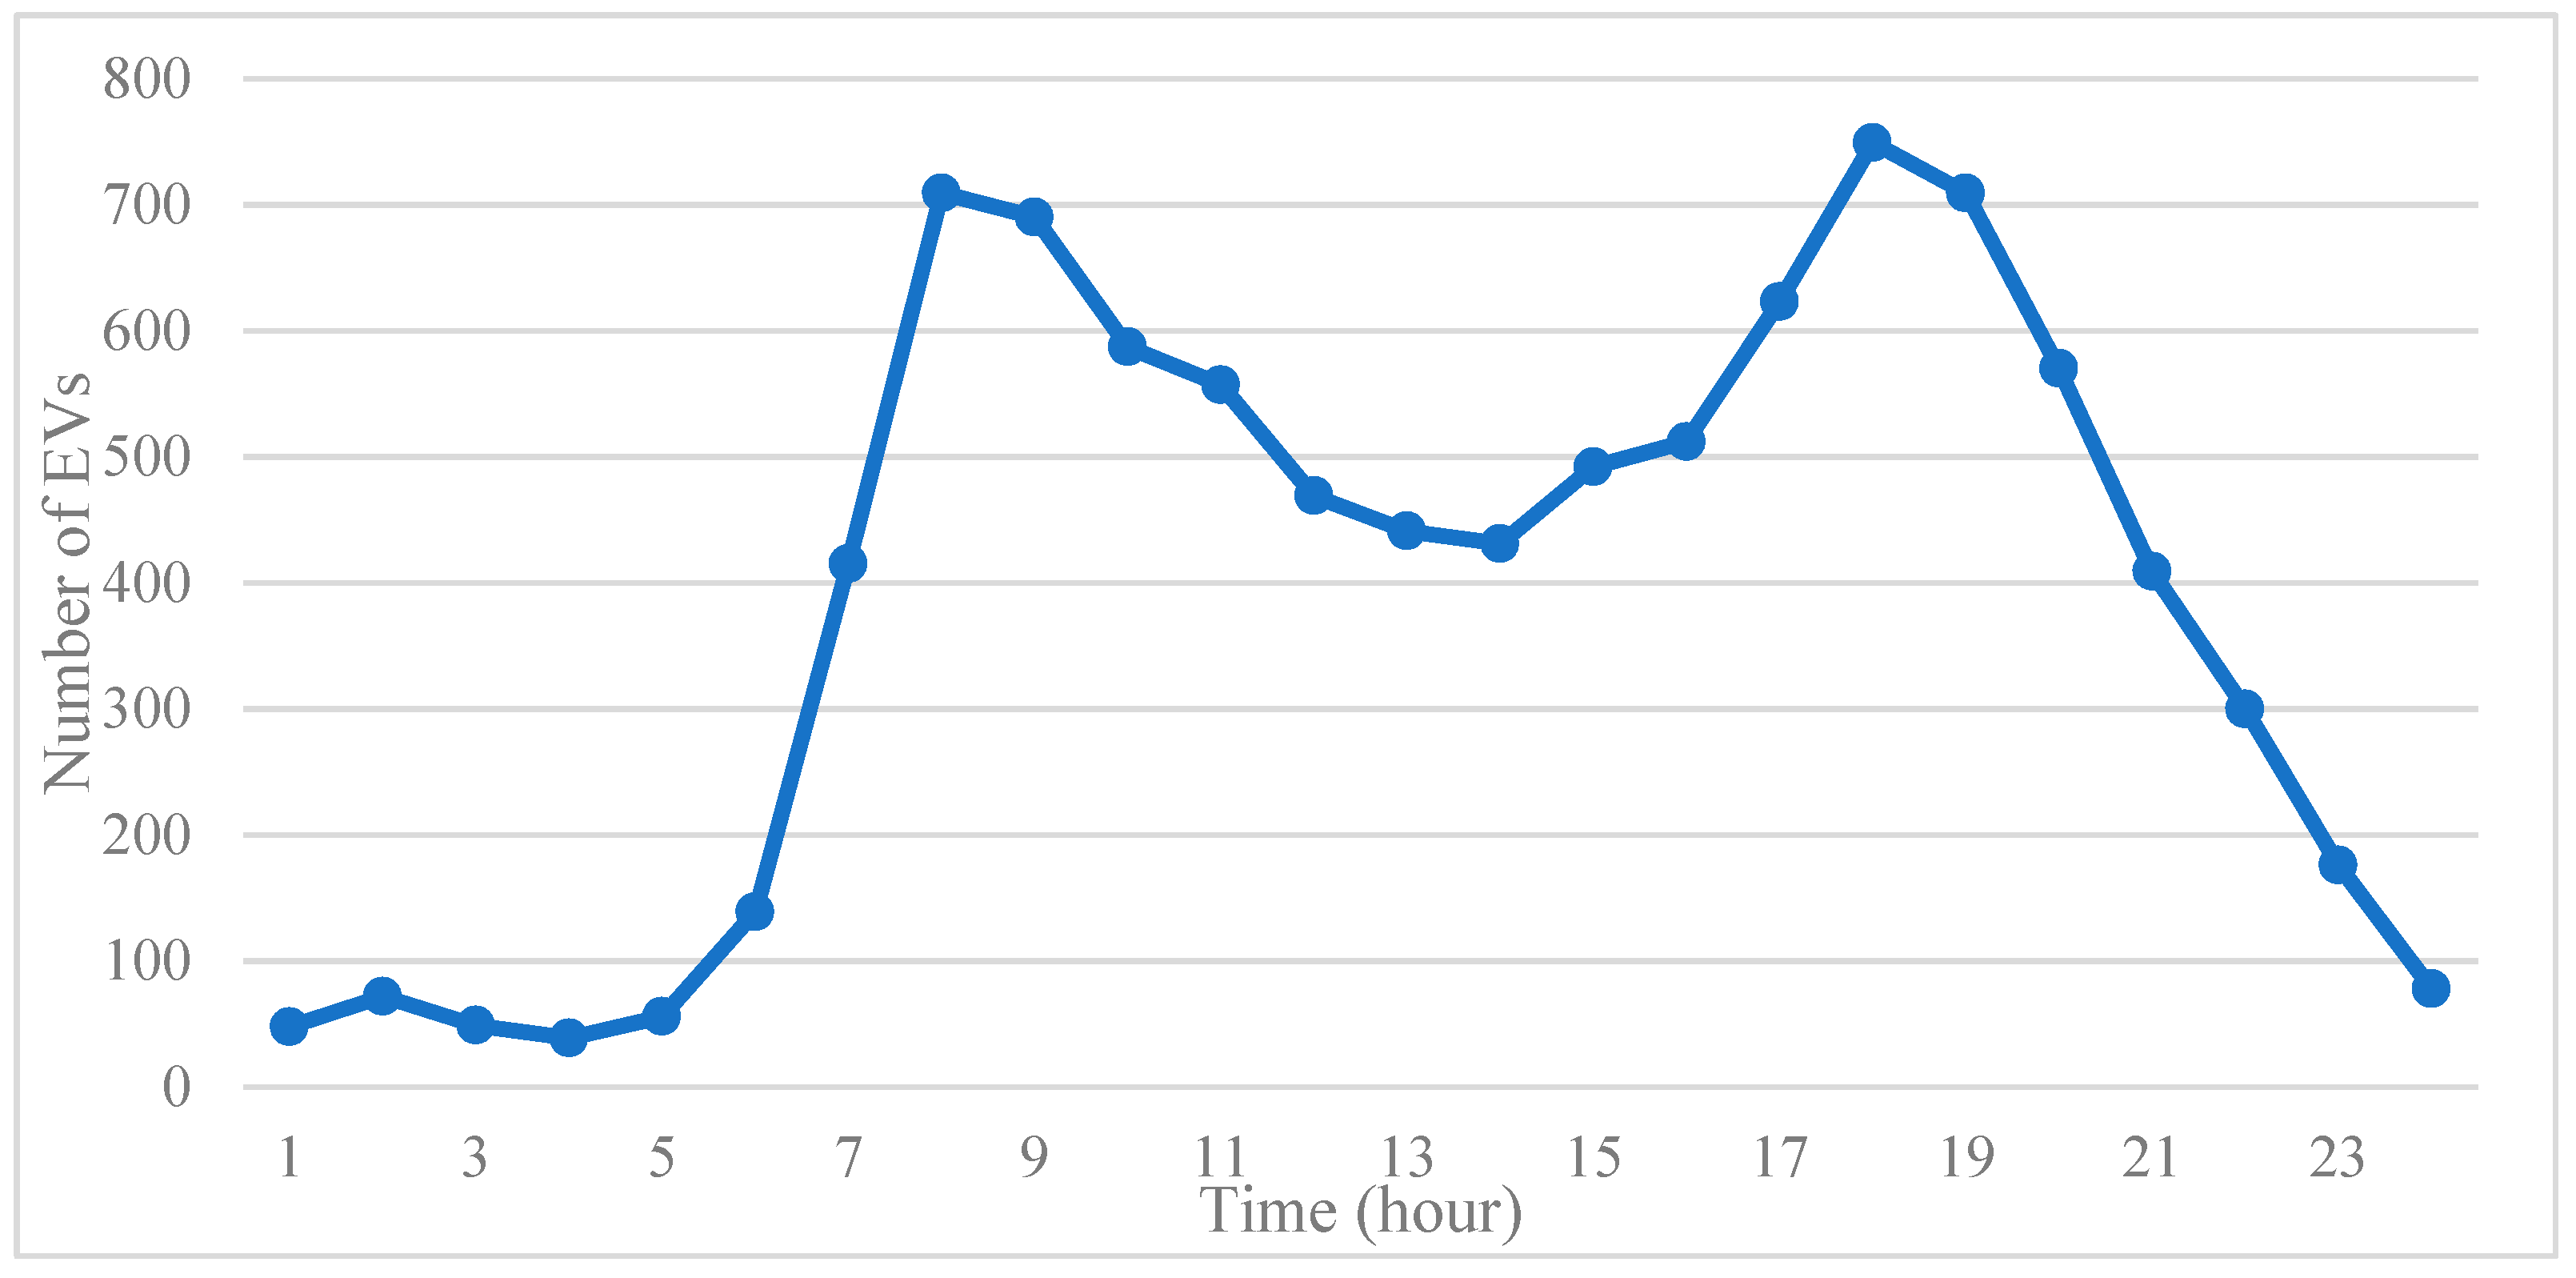
In order to emulate the trips with different purposes in real-world conditions and differentiate the trips by time period, the hourly travel demand matrix was created as the input for simulation. As a result, the hourly travel demand of EVs on 19 September 2016 is shown in Figure 5. It can be seen that two peak periods, am peak and pm peak, have apparently higher travel demand than any other period.
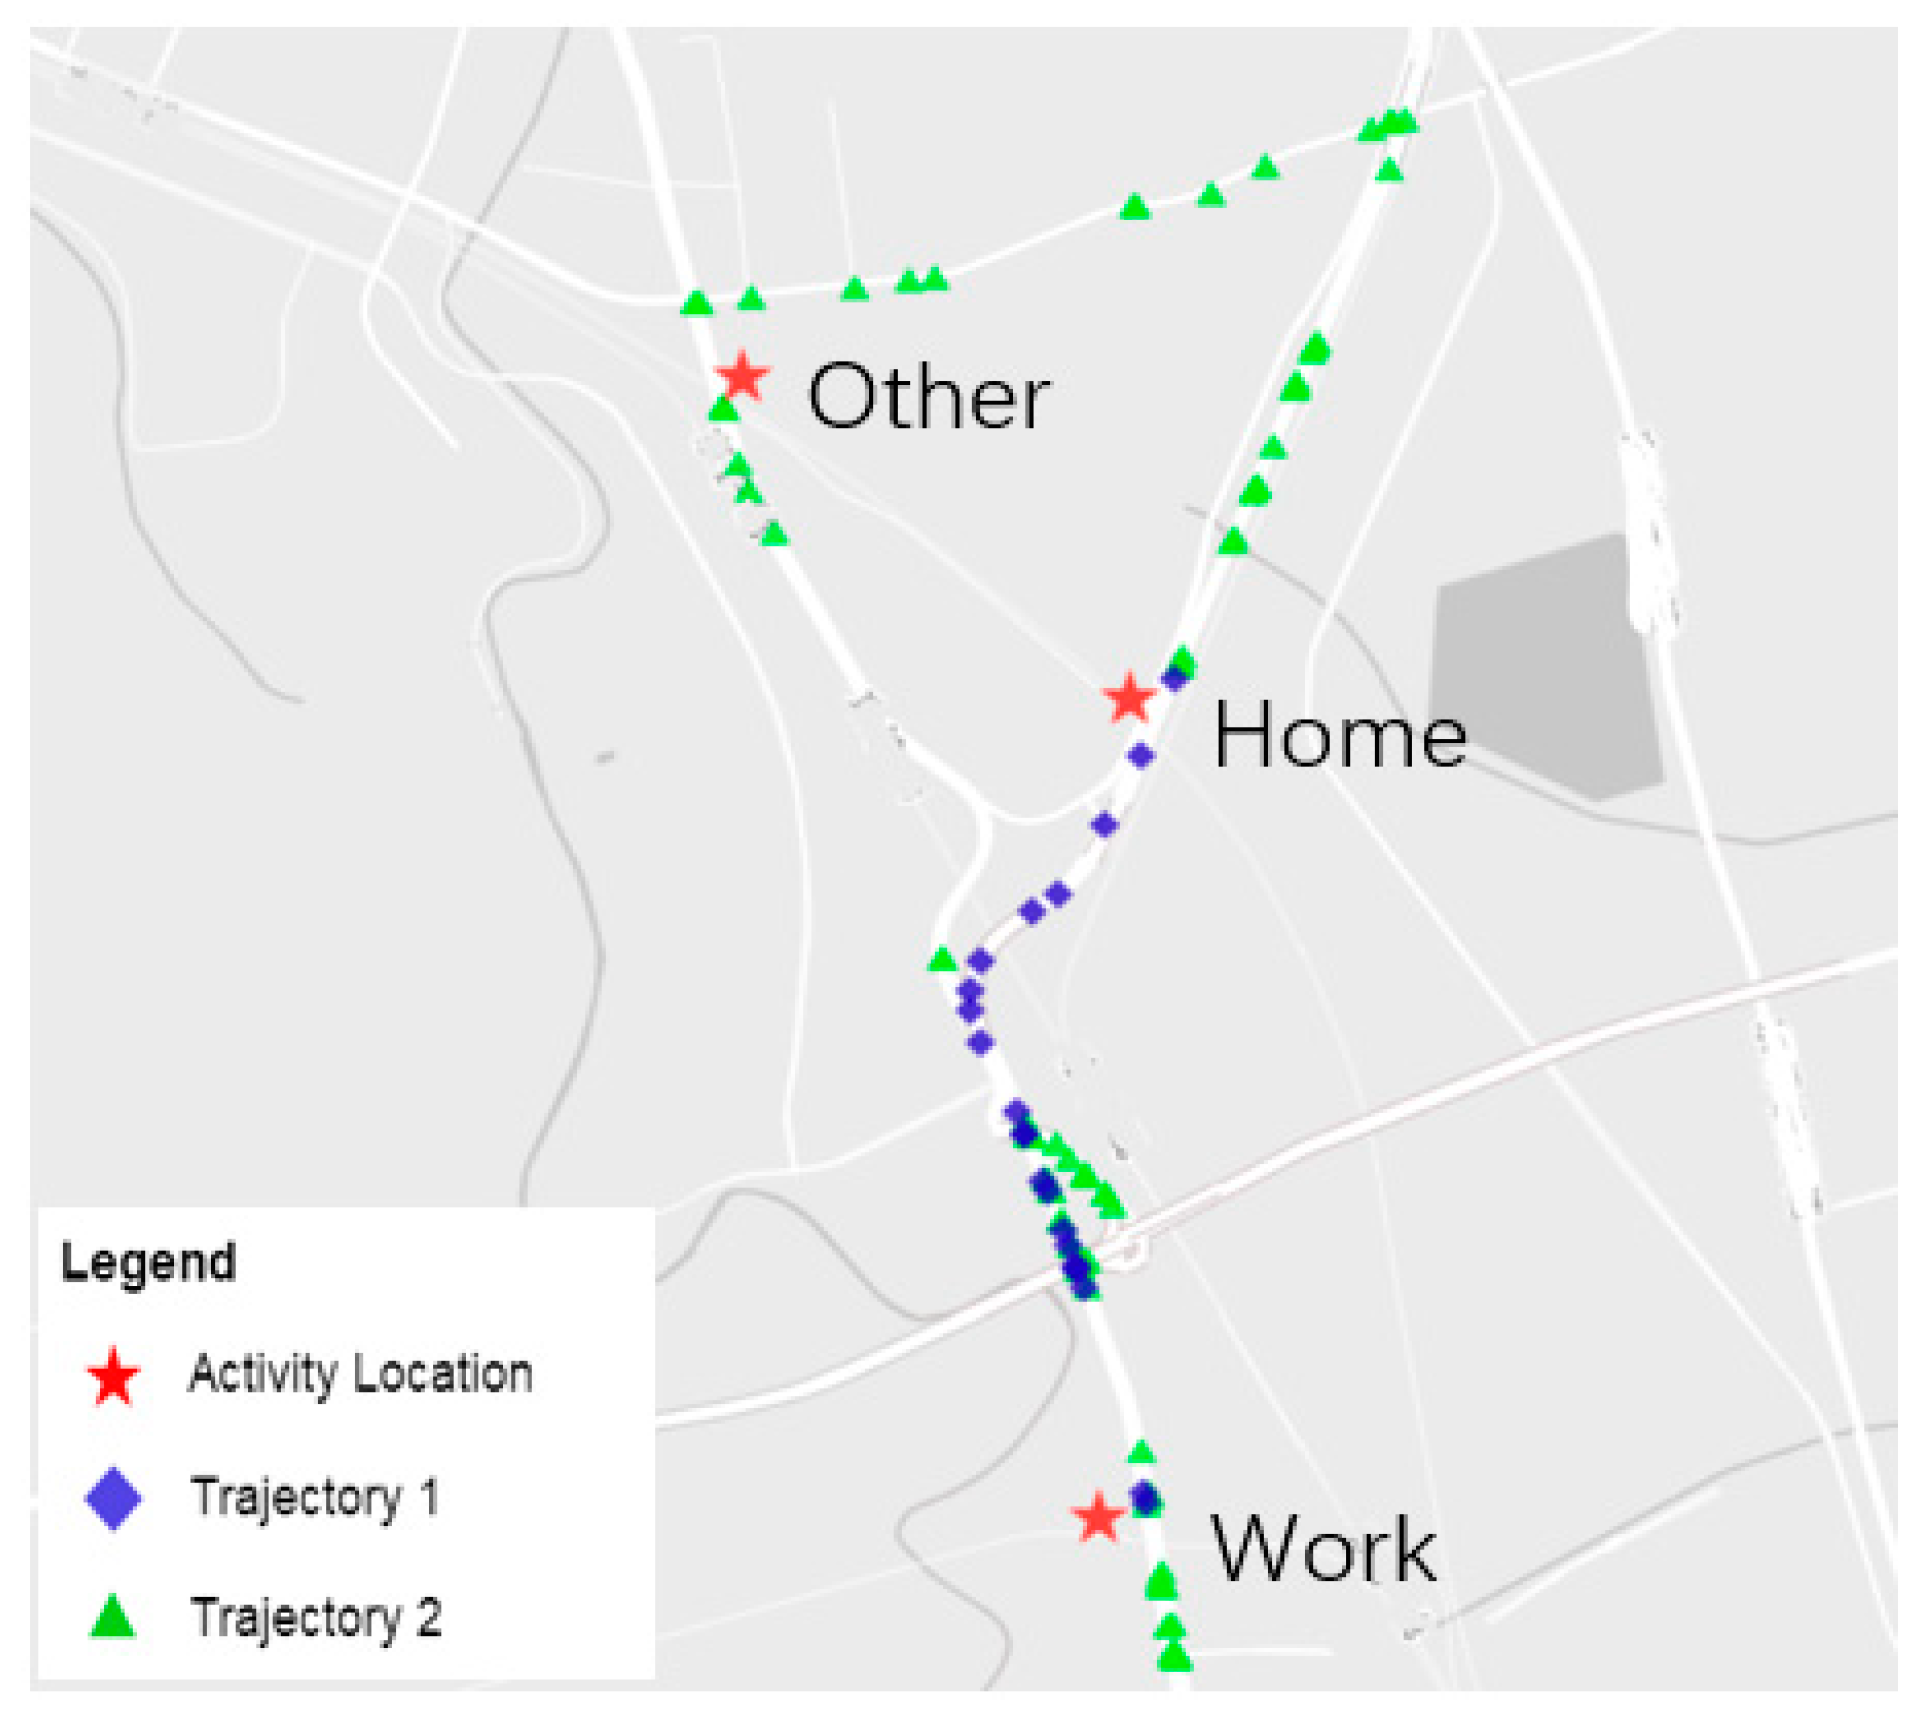
The hourly travel demand was imported into NEXTA software version 3 Beta (Arizona State University, USA) to generate the trajectory of the EVs. Since the EV may have multiple trips in a day, the time sequenced trajectories between different activity locations for one EV were merged to reconstruct the complete daily trip. Figure 6 illustrates an EV trajectory example simulated by NEXTA. Trajectory 1 illustrates the route from home to work, while trajectory 2 illustrates a different route since the EV travelled to other purpose activity place during the trip from work to home. Both trajectory 1 and trajectory 2 make up the complete daily trip for one EV.
4.2. Optimization for EV Charging Station Layout
As described above, the battery capacity of the medium range EV is assumed to be 12 kwh, while the average energy consumption is 6.7 km/kwh. The start condition of SOC for each EV is 100%, and the EV would receive a charging alarm when the SOC is lower than 30%. The basic road map of Tianjin used in NEXTA only contains expressways, national roads, and major local roads due to the limits of software and PC performance.
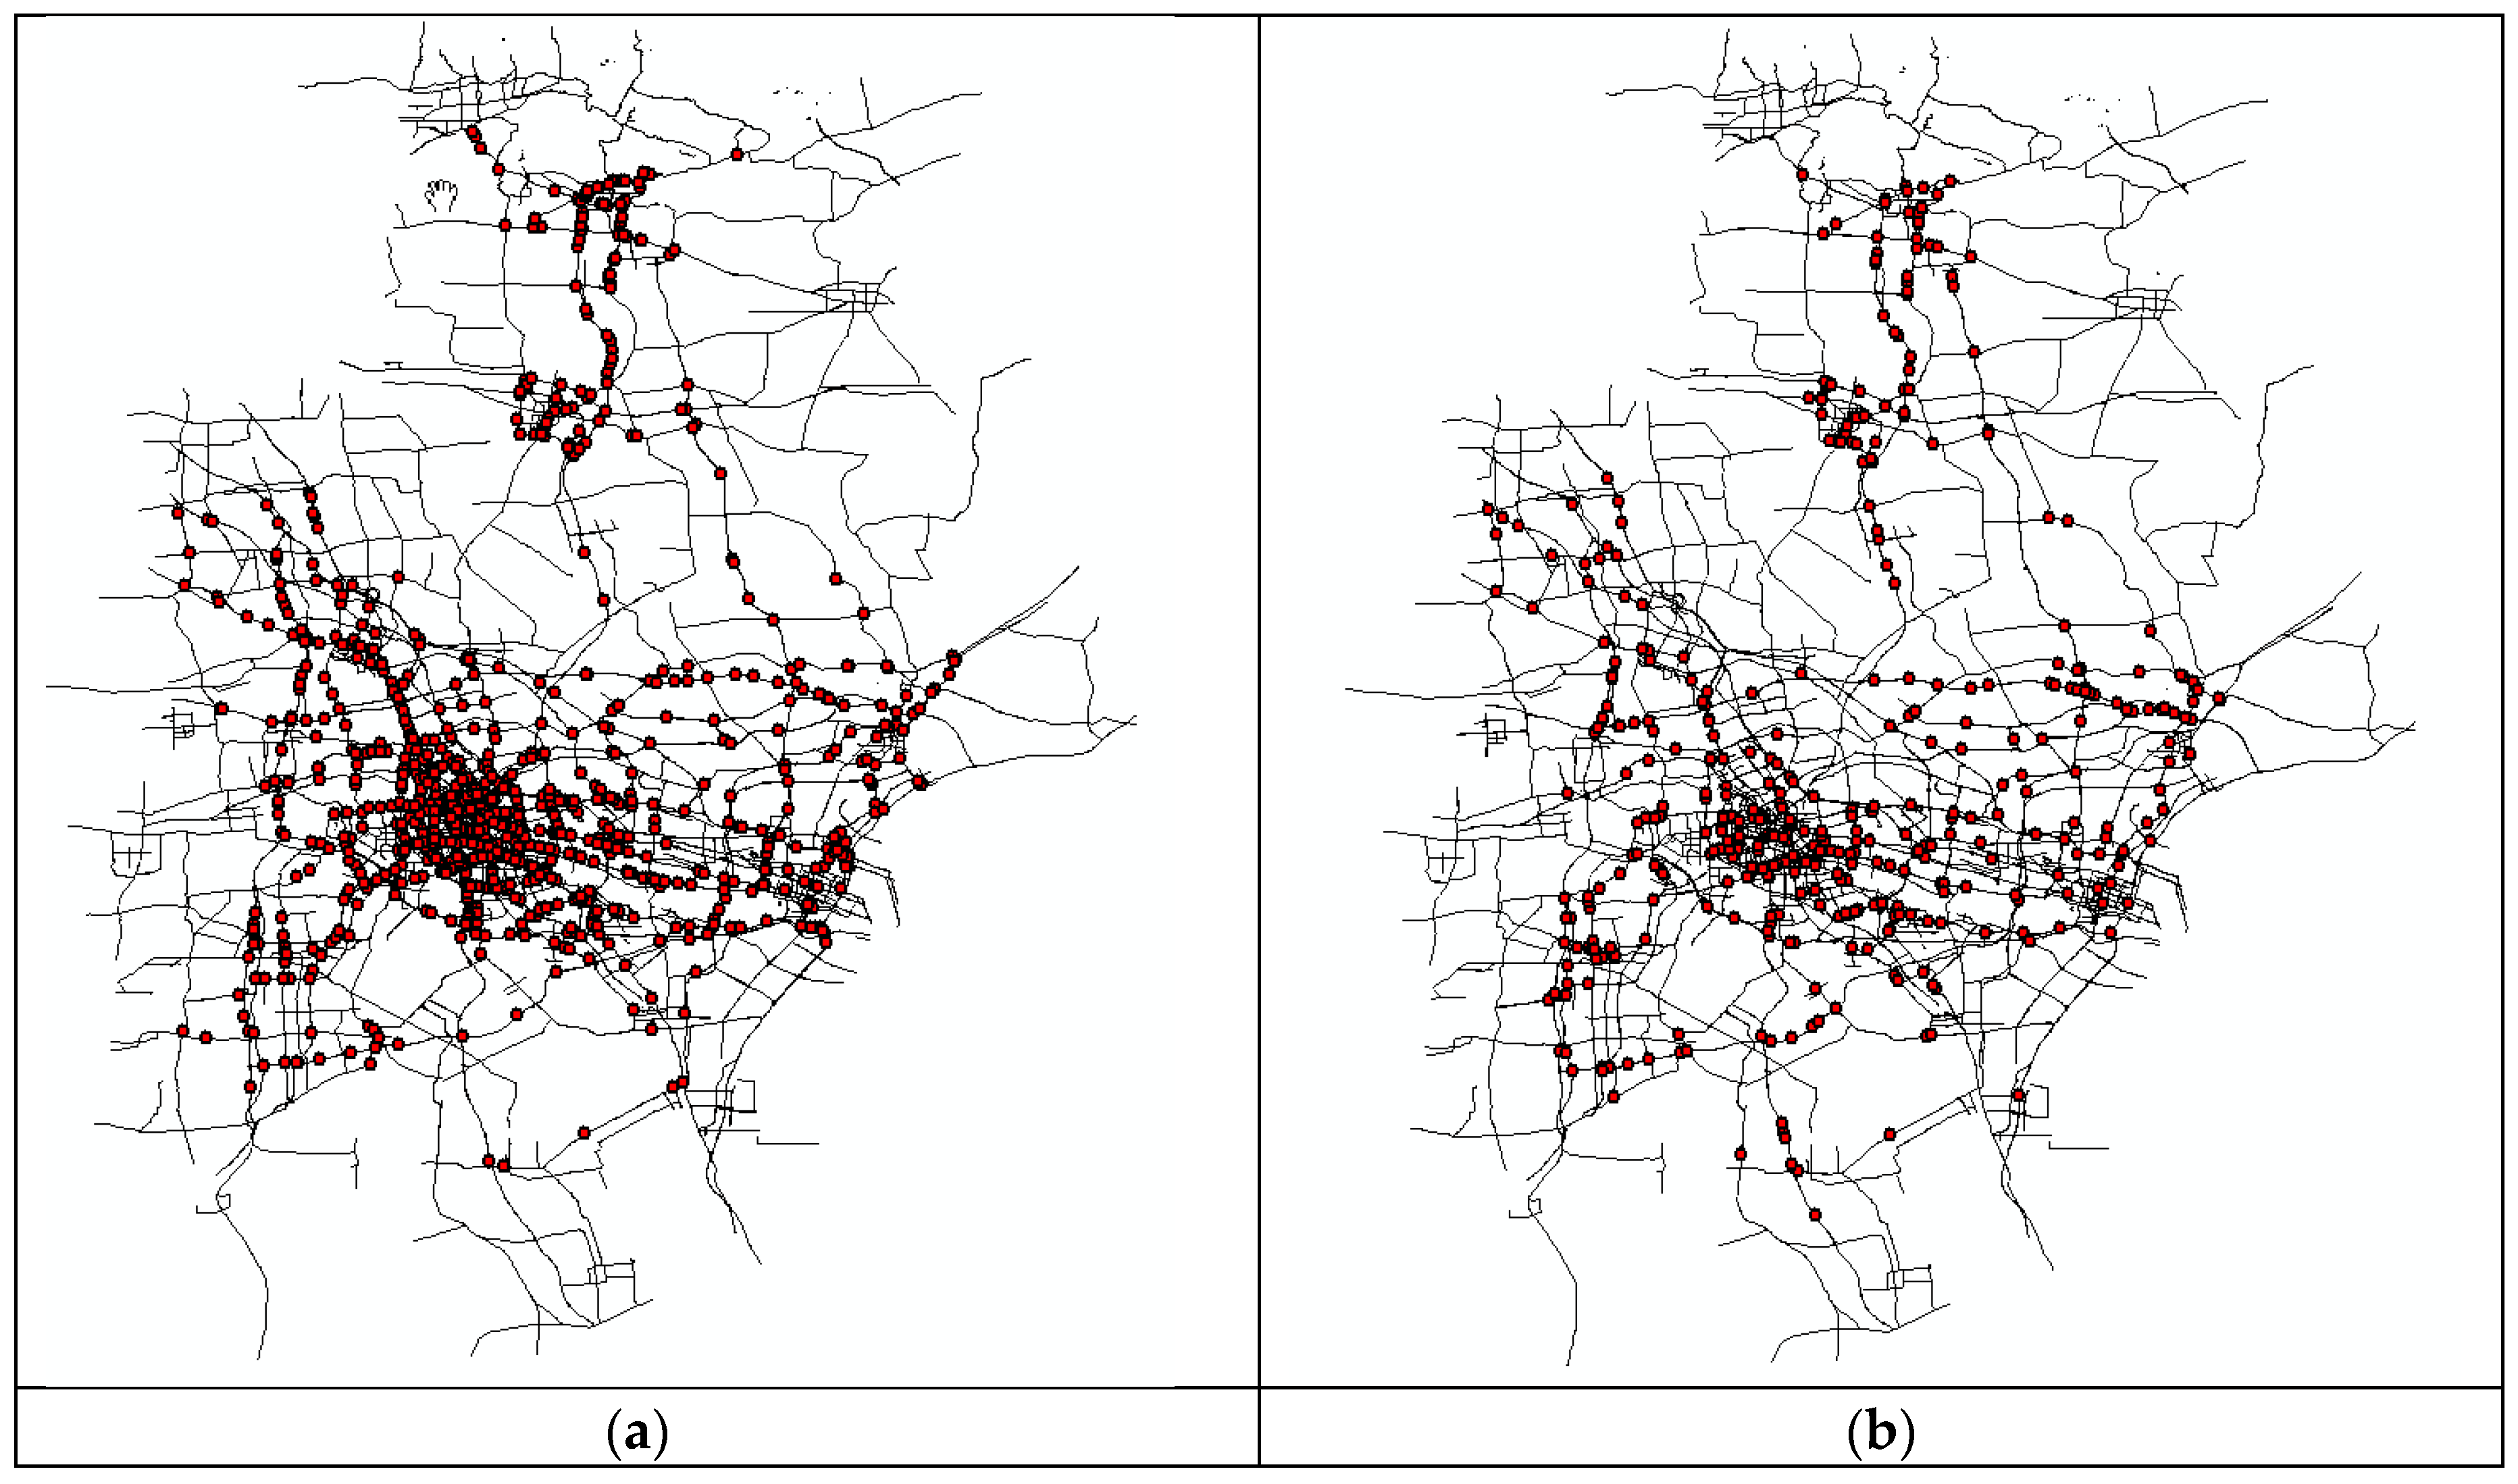
Note that while the SOC of EV is below 30%, the EV would receive charging alarm and decide whether to make a recharge based on the remaining distance to the destination. There are 1307 charging alarm points marked in Figure 7a. It can be note that most of the charging alarm locations are suited within the central urban area. Through the decision process, 493 charging demand points are kept in Figure 7b.
To locate the charging station, the charging demand points shown in Figure 7b were conducted with the two-step optimization model. In the first step, three traditional clustering approaches—DBSCAN, HCluster, and K-means—were utilized to build the comparative cases and produce the charging demand clusters for charging stations. The detailed parameter setting for each clustering approach is described as follows:
- Case 1: DBSCAN algorithm basically requires 2 parameters: minimum distance between two points and minimum number of points to form a region. According to the development plan from Tianjin government, the coverage radius of charging station is around 5 km~7 km. The minimum distance is set as 7km and minimum number of points is 2.
- Case 2: HCluster method requires the number of initial cluster centers. To keep the same coverage radius 7 km, the service area of a charging station is around 150 km2 while the urban area of Tianjin is 4276 km2. Thus, the number of cluster centers is set as 30.
- Case 3: K-means method is similar to HCluster method. The initial number of cluster centers is set as 30.
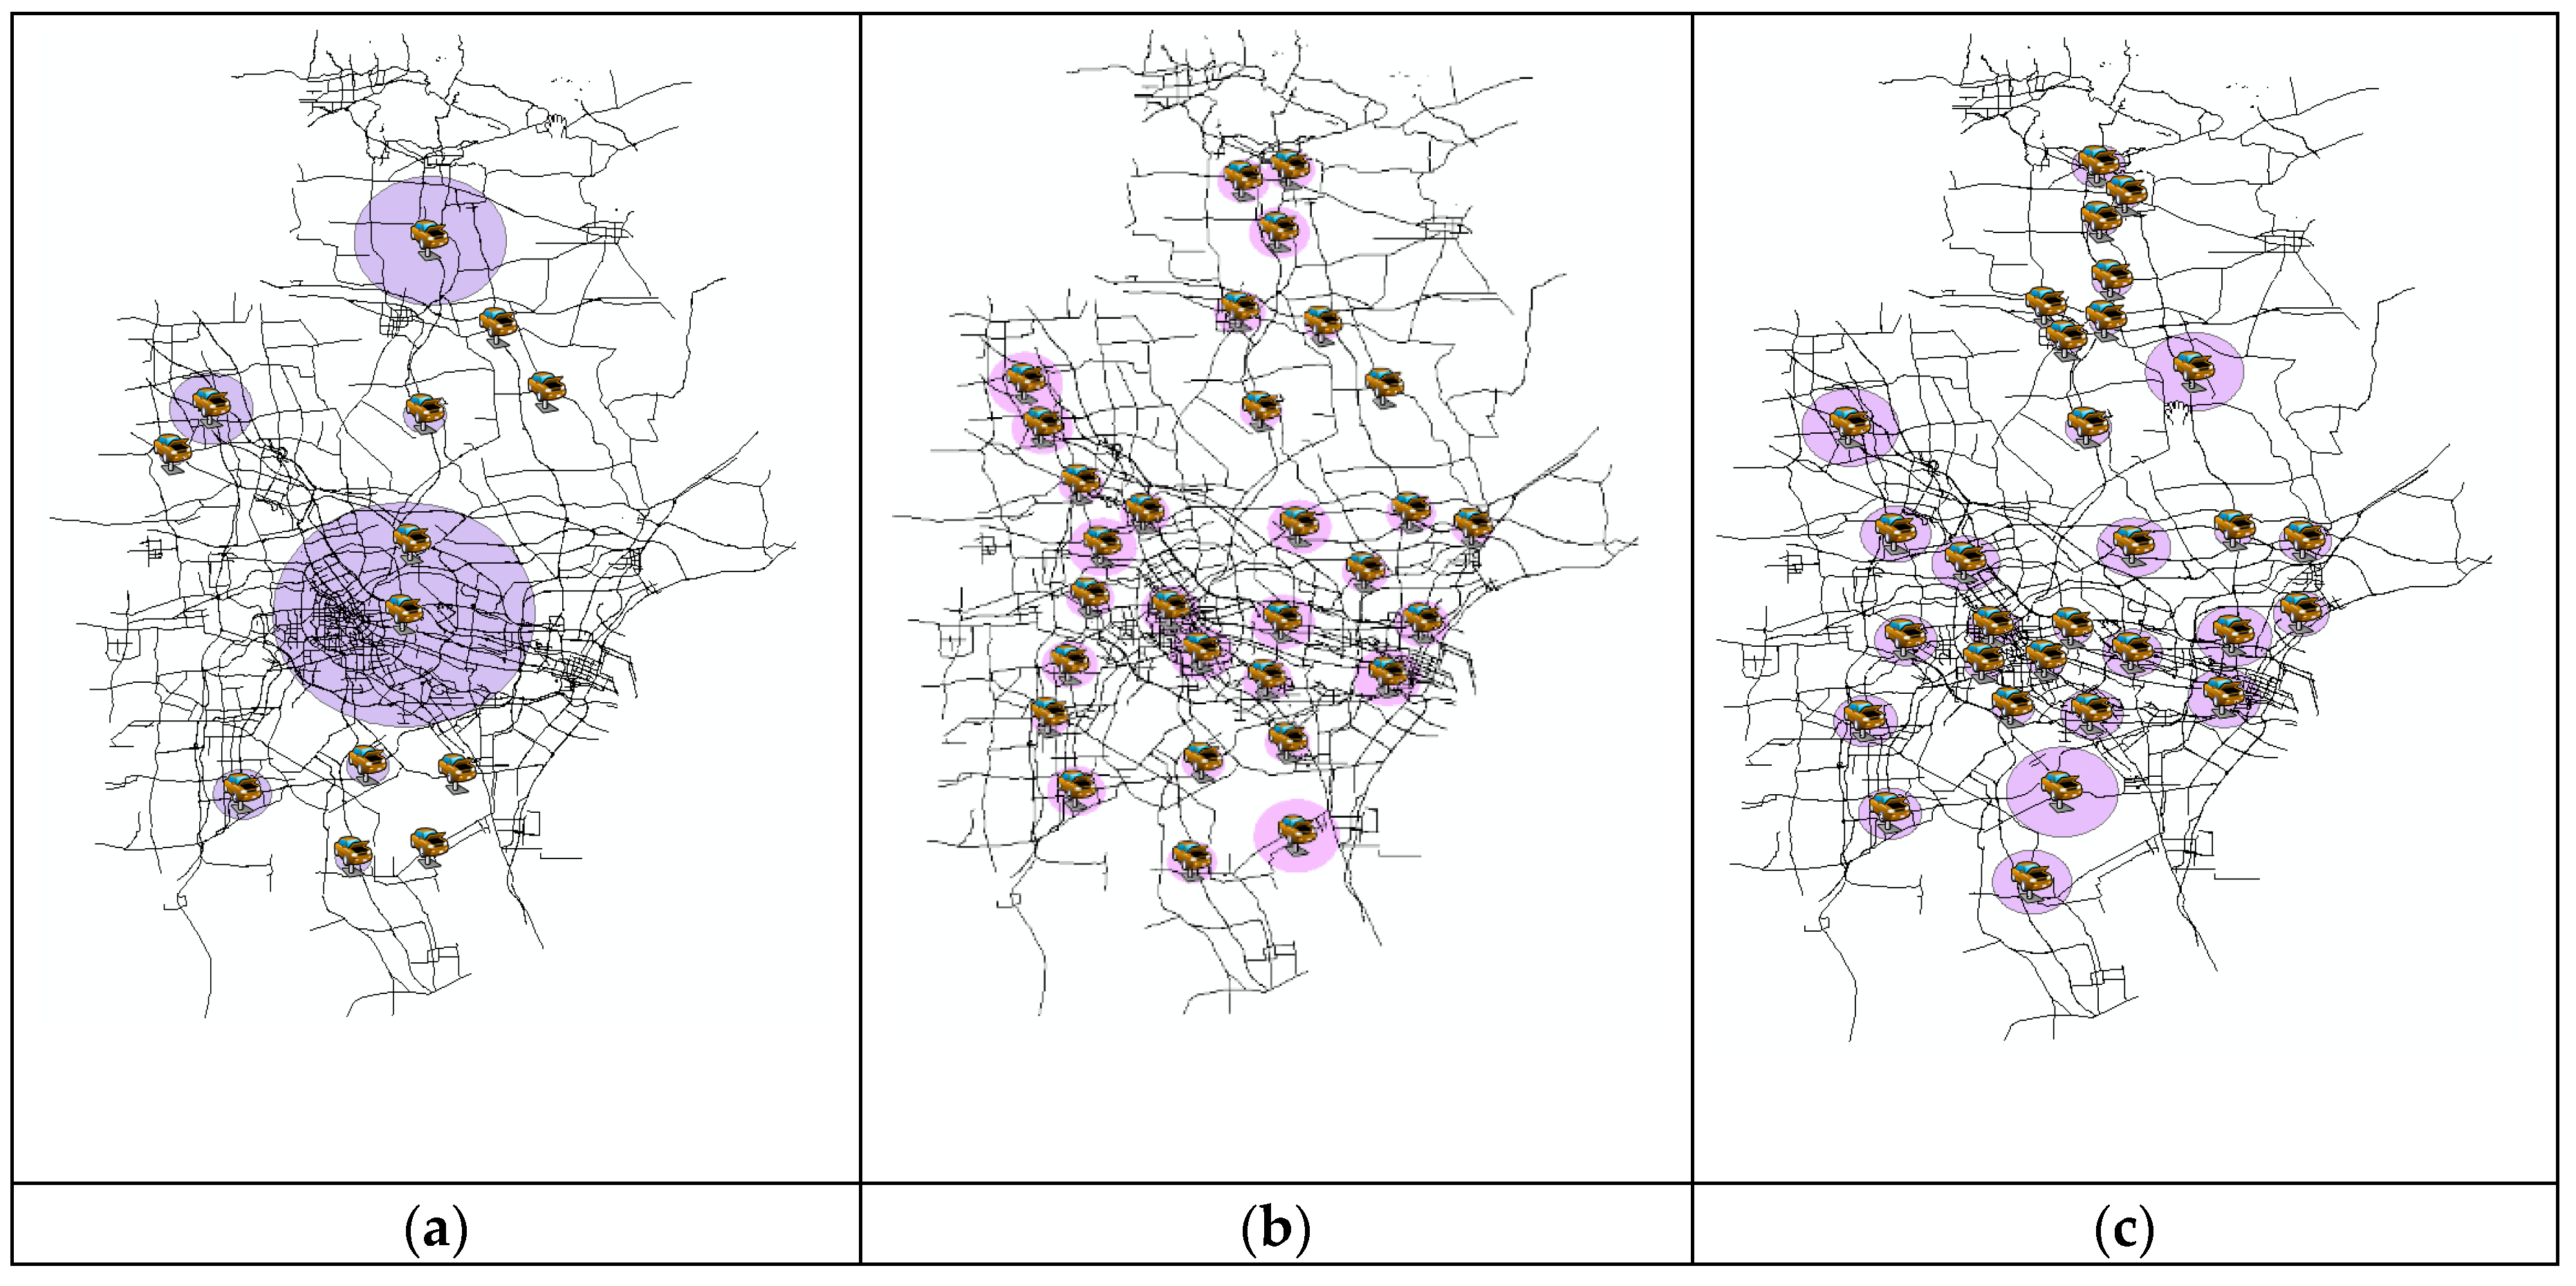
The charging demand clusters were used in the second step, and the locations of charging stations were determined through the optimization model described above. Figure 8 illustrate the charging station layout and their buffer area for the different cases. It can be noted that the charging stations are evenly distributed in both urban and rural area utilizing each clustering approach.
In order to assess the performance of charging station layout, the critera, including service area, scale, and accessibility of charging stations, were compared among the three cases, respectively. The service area was computed based on the distance between charging demand location and charging station location. The scale of charging station was identified based on the number of EVs that charge at the station. For the accessibility of each charging station, the total cumulative Vehicle Kilometers Traveled (VKT) to the charging station was utilized for assessment.
As the results present in Table 3 and Figure 8, the maximum and minimum service radius using DBSCAN method are 50 km and 0.38 km, which demonstrates the huge difference of service area for different charging stations. For instance, only two charging stations cover the large central urban area as shown in Figure 8a. In addition, 11 out of 13 charging stations are charging stations with small charging demand (<10 EVs) and large charging demand (>50EVs). Thus, the DBSCAN method was not able to provide an effective layout of charging stations, mainly because the DBSCAN algorithm failed to identify the clusters with various densities.
Through the HCluster method, there is no charging station with an extremely huge service area. However, some of the charging stations did not provide sufficient charging service, since the minimum service radius is 1.29 km. What is more, there are still two charging stations that would recharge over 50 EVs, which may lead to the congestion at that charging station.
Similarly, K-means method did not generate the charging station with extreme huge service area. The service radius of charging station, from 4.1 km to 13.7 km, is evenly distributed, which conforms to the development plan from the government. The total cumulative Vehicle Kilometers Travelled (VKT) to charging station is lowest when implementing the charging station plan generated from K-means method. Additionally, the charging stations, mainly small and medium scale, improve the potential charging service while at the charging station. Thus, the charging stations plan derived from the K-means method is recommended in this paper.
5. Conclusions
The massive penetration of electric vehicle (EV) brings in a big challenge for the planning of charging stations. In order to deal with the placement issues of EV charging stations, this paper presents a two-step optimization model to locate the charging stations utilizing the reconstructed EV trajectories derived from simulation. To capture the real-world travel patterns of EVs, the large-scale Cellular Signaling Data (CSD) was collected and processed to generate the travel demand besides the commute trips. This study also demonstrated the approach to conduct the data cleansing and identification of activity purpose.
Then, the charging behavior of medium range EVs was analyzed in the two-step optimization model. In the first step, the charging demand locations derived from the trajectory dataset were grouped into clusters through clustering analysis. Three common clustering algorithms were utilized. Second, the optimization model for each charging demand cluster was proposed considering the driver convenience. The results from all the three cases indicate that over 50% of the charging stations were within the central urban area. Through comparative analysis, the charging station sites derived from the K-means approach provide better performance than other approaches in terms of service area, scale, and accessibility of charging stations.
This paper provided a quick and efficient way to solve the location problem of charging stations. However, this approach is based on the assumption that the EVs will take the route derived from the simulation, which can be verified under the connected vehicle environment in the future. It can also be further improved if more research can be carried out to investigate the deployment of the local institutional and spatial settings.
Author Contributions
In this paper, author J.J. developed the research ideas and designed the research programs, analyzed the results, and completed the original writing of the paper. Author C.L. wrote the summary and reviewed the paper. Author T.W. developed the method to manipulate the cellular signaling data and data acquisition.
Funding
This research received no external funding.
Acknowledgments
The cellular signaling data used in this research was collected with the support of the Tianjin Urban Planning and Design Institute.
Conflicts of Interest
The authors declare no conflict of interest.
References
- Guo, Z.X.; Zhang, D.Q.; Liu, H.T.; He, Z.G.; Shi, L.Y. Green transportation scheduling with pickup time and transport mode selections using a novel multi-objective memetic optimization approach. Transp. Res. Part D Transp. Environ. 2018, 60, 137–152. [Google Scholar] [CrossRef]
- Kong, F.X.; Xue, L. Sustainable Transportation with Electric Vehicles. Found. Trends Electr. Energy Syst. 2017, 2, 1–132. [Google Scholar] [CrossRef] [Green Version]
- Statistics, I.E. CO2 Emissions from Fuel Combustion-Highlights. Available online: http://www.iea.org/co2highlights/co2highlights.pdf (accessed on 23 August 2018).
- Liu, L.; Kong, F.; Liu, X.; Peng, Y.; Wang, Q. A review on electric vehicles interacting with renewable energy in smart grid. Renew. Sustain. Energy Rev. 2015, 51, 648–661. [Google Scholar] [CrossRef]
- Research and Markets. China EV Charging Station and Charging Pile Market Report, 2018–2025. Available online: https://www.researchandmarkets.com/research/xvn269/china_ev_charging?w=5 (accessed on 23 August 2018).
- Panchal, S.; Mathew, M.; Dincer, I.; Agelin-Chaab, M.; Fraser, R.; Fowler, M. Thermal and electrical performance assessments of lithium-ion battery modules for an electric vehicle under actual drive cycles. Electr. Power Syst. Res. Part A 2018, 163, 18–27. [Google Scholar] [CrossRef]
- Panchal, S.; McGrory, J.; Kong, J.; Fraser, R.; Fowler, M.; Dincer, I.; Agelin-Chaab, M. Cycling degradation testing and analysis of a lifepo4 battery at actual conditions. Int. J. Energy Res. 2017, 41, 2565–2575. [Google Scholar] [CrossRef]
- Wang, C.J.; Liu, Q.; Guo, Z. Green Project Planning with Realistic Multi-Objective Consideration in Developing Sustainable Port. Sustainability 2018, 10, 2385. [Google Scholar] [CrossRef]
- Guo, Z.X.; Liu, H.T.; Zhang, D.Q.; Yang, J. Green Supplier Evaluation and Selection in Apparel Manufacturing Using a Fuzzy Multi-Criteria Decision-Making Approach. Sustainability 2017, 9, 650. [Google Scholar] [Green Version]
- Zhang, H.; Zhuge, C.; Yu, X. Identifying hub stations and important lines of bus networks: A case study in Xiamen, China. Phys. A Stat. Mech. Appl. 2018, 502, 394–402. [Google Scholar] [CrossRef]
- Shareef, H.; Islam, M.M.; Mohamed, A. A review of the stage-of-the-art charging technologies, placement methodologies, and impacts of electric vehicles. Renew. Sustain. Energy Rev. 2016, 64, 403–420. [Google Scholar] [CrossRef]
- Kou, L.F.; Liu, Z.F.; Zhou, H. Modeling algorithm of charging station planning for regional electric vehicle. Mod. Electr. Power 2010, 27, 44–48. [Google Scholar]
- Ge, S.Y.; Liang, F.E.; Hong, L.; Long, W.A. The planning of electric vehicle charging stations in the urban area. In Proceedings of the Electric & Mechanical Engineering and Information Technology (EMEIT) Conference, Yichang, China, 16–18 September 2011. [Google Scholar]
- Wu, C.Y.; Li, C.B.; Du, L.; Cao, Y.J. A method for electric Charging infrastructure planning. Autom. Electr. Power Syst. 2010, 34, 36–39. [Google Scholar]
- Wang, G.B.; Zhao, X.; Wen, F.S.; Kit, P.W. Traffic-constrained multiobjective planning of electric-vehicle charging stations. IEEE Trans. Power Deliv. 2013, 28, 2363–2372. [Google Scholar] [CrossRef]
- Liu, Z.; Wen, F.; Ledwich, G. Optimal planning of electric-vehicle charging stations in distribution systems. IEEE Trans. Power Deliv. 2013, 28, 102–110. [Google Scholar] [CrossRef]
- He, F.; Di, W.; Yin, Y.F.; Guan, Y.P. Optimal deployment of public charging stations for plug-in hybrid electric vehicles. Transp. Res. Part B Methodol. 2013, 47, 87–101. [Google Scholar] [CrossRef]
- Xi, X.; Sioshansi, R.; Marano, V. Simulation–optimization model for location of a public electric vehicle charging infrastructure. Transp. Res. Part D Transp. Environ. 2013, 22, 60–69. [Google Scholar] [CrossRef]
- Sadeghi-Barzani, P.; Abbas, R.G.; Hosein, K.K. Optimal fast charging station placing and sizing. Appl. Energy 2014, 125, 289–299. [Google Scholar] [CrossRef]
- Hanabusa, H.; Horiguchi, R. A study of the analytical method for the location planning of charging stations for electric vehicles. In Proceedings of the International Conference on Knowledge-Based and Intelligent Information and Engineering Systems, San Sebastián, Spain, 10–12 September 2011. [Google Scholar]
- Jia, L.; Hu, Z.; Song, Y.; Luo, Z. Optimal siting and sizing of electric vehicle charging stations. In Proceedings of the Electric Vehicle Conference (IEVC), Greenville, SC, USA, 4–8 March 2012. [Google Scholar]
- Zhang, H.; Shi, B.; Zhuge, C.; Wang, W. Detecting Taxi Travel Patterns using GPS Trajectory Data: A Case Study of Beijing. KSCE J. Civ. Eng. 2019, 1–9. [Google Scholar] [CrossRef]
- Dong, J.; Liu, C.; Lin, Z. Charging infrastructure planning for promoting battery electric vehicles: An activity-based approach using multiday travel data. Transp. Res. Part C Emerg. Technol. 2014, 38, 44–55. [Google Scholar] [CrossRef]
- Shahraki, N.; Hua, C.; Metin, T.; Xu, M. Optimal locations of electric public charging stations using real world vehicle travel patterns. Transp. Res. Part D Transp. Environ. 2015, 41, 165–176. [Google Scholar] [CrossRef] [Green Version]
- Li, S.; Huang, Y.; Mason, S.J. A multi-period optimization model for the deployment of public electric vehicle charging stations on network. Transp. Res. Part C Emerg. Technol. 2016, 65, 128–143. [Google Scholar] [CrossRef]
- Yang, J.; Dong, J.; Hu, L. A data-driven optimization-based approach for siting and sizing of electric taxi charging stations. Transp. Res. Part C Emerg. Technol. 2017, 77, 462–477. [Google Scholar] [CrossRef]
- Tu, W.; Li, Q.; Fang, Z.; Shaw, S.-L.; Zhou, B.; Chang, X. Optimizing the locations of electric taxi charging stations: A spatial–temporal demand coverage approach. Transp. Res. Part C Emerg. Technol. 2016, 65, 172–189. [Google Scholar] [CrossRef] [Green Version]
- Cai, H.; Jia, X.; Chiu, A.S.; Hu, X.; Xu, M. Siting public electric vehicle charging stations in Beijing using big-data informed travel patterns of the taxi fleet. Transp. Res. Part D Transp. Environ. 2014, 33, 39–46. [Google Scholar] [CrossRef]
- He, S.Y.; Kuo, Y.H.; Wu, D. Incorporating institutional and spatial factors in the selection of the optimal locations of public electric vehicle charging facilities: A case study of Beijing, China. Transp. Res. Part C Emerg. Technol. 2016, 67, 131–148. [Google Scholar] [CrossRef]
- Liu, Q.; Liu, J.; Liu, D. Intelligent Multi-Objective Public Charging Station Location with Sustainable Objectives. Sustainability 2018, 10, 3760. [Google Scholar] [CrossRef]
- Hiwatari, R.; Tomohiko, I.; Kunihiko, O. A road traffic simulator to analyze layout and effectiveness of rapid charging infrastructure for electric vehicle. In Proceedings of the Vehicle Power and Propulsion Conference (VPPC), Chicago, IL, USA, 6–9 September 2011. [Google Scholar]
- Hiwatari, R.; Tomohiki, I.; Kunihiko, O.; Hiromi, Y.; Tomohiro, I.; Masaaki, T.; Yumiko, I.; Kenji, Y. A New Approach to Analyze Effectiveness of Charging Infrastructure for Electric Vehicle by Road Traffic Simulator. SAE Tech. Pap. 2011, 39, 7216. [Google Scholar]
- Hiwatari, R.; Tomohiki, I.; Kunihiko, O. A Design system for layout of Charging infrastructure for Electric Vechicle. Des. Innov. Value Towards Sustain. Soc. 2012, 1026–1031. [Google Scholar] [CrossRef]
- Hiwatari, R.; Tetsushiro, I.; Tomohiko, I. A Layout Method of Quick Charging Infrastructure for Electric Vehicle by Road Traffic Simulation: Japanese Model Plan of Quick Charging Infrastructure Network. In Proceedings of the Vehicle Power and Propulsion Conference (VPPC), Coimbra, Portugal, 27–30 October 2014. [Google Scholar]
- Hernández, J.C.; Ruiz-Rodriguez, F.J.; Jurado, F. Modelling and assessment of the combined technical impact of electric vehicles and photovoltaic generation in radial distribution systems. Energy 2017, 141, 316–332. [Google Scholar] [CrossRef]
- Ruiz-Rodriguez, F.J.; Hernández, J.C.; Jurado, F. Voltage behaviour in radial distribution systems under the uncertainties of photovoltaic systems and electric vehicle charging loads. Int. Trans. Electr. Energy Syst. 2018, 28, e2490. [Google Scholar] [CrossRef]
- Hernández, J.C.; Sanchez-Sutil, F.; Vidal, P.G.; Rus-Casas, C. Primary frequency control and dynamic grid support for vehicle-to-grid in transmission systems. Int. J. Electr. Power Energy Syst. 2018, 100, 152–166. [Google Scholar] [CrossRef]
- Widhalm, P.; Yang, Y.X.; Ulm, M.; Athavale, S.; González, M.C. Discovering urban activity patterns in cell phone data. Transportation 2015, 42, 597–623. [Google Scholar] [CrossRef] [Green Version]
- Alexander, L.; Jiang, S.; Murga, M.; González, M.C. Origin–destination trips by purpose and time of day inferred from mobile phone data. Transp. Res. Part C Emerg. Technol. 2015, 58, 240–250. [Google Scholar] [CrossRef]
- Zhu, H.M.; Yu, C.Q.; Jiang, Y. Application of GPS Technology in Tianjin Household Travel Survey. In Proceedings of the China Urban Transport Planning 2012 Annual Meeting, Fuzhou, China, 8 November 2012. (In Chinese). [Google Scholar]
- Zhou, X.S.; Taylor, J. DTALite: A queue-based mesoscopic traffic simulator for fast model evaluation and calibration. Cogent Eng. 2014, 1, 961345. [Google Scholar] [CrossRef]
- Joshi, A.; Kaur, R. A review: Comparative study of various clustering techniques in data mining. Int. J. Adv. Res. Comput. Sci. Softw. Eng. 2013, 3, 3. [Google Scholar]
- Verma, M.; Srivastava, M.; Chack, N.; Diswar, A.K.; Gupta, N. A comparative study of various clustering algorithms in data mining. Int. J. Eng. Res. Appl. 2012, 2, 1379–1384. [Google Scholar]
- Github. Available online: https://jswhit.github.io/pyproj/ (accessed on 16 January 2019).
- Ma, K.P.; Cao, B.H.; Fan, X.Y. Analysis for Household Travel Characteristics in Tianjin. Technol. Econ. Areas Commun. 2007, 9, 112–113. (In Chinese) [Google Scholar]
Figure 1.
“Ping-pang” data records.

Figure 2.
Clustering and filtering process.

Figure 3.
Flow chart for the planning of EV charging stations.

Figure 4.
Distribution of trip frequencies by cumulative trip length.

Figure 5.
Hourly travel demand for EVs.

Figure 6.
An example of EV trajectory with other purpose trips.

Figure 7.
(a) Spatial distribution of charging alarm points; (b) spatial distribution of charging demand points.
Figure 7.
(a) Spatial distribution of charging alarm points; (b) spatial distribution of charging demand points.

Figure 8.
Charging sation layout (a) Case 1: utilizing DBSCAN method; (b) Case 2: utilizing HCluster method; (c) Case 3: utilizing K-means method.
Figure 8.
Charging sation layout (a) Case 1: utilizing DBSCAN method; (b) Case 2: utilizing HCluster method; (c) Case 3: utilizing K-means method.


Table 1.
Nomenclature.
| Nomenclature | |
|---|---|
| Abbreviations | |
| EV | Electric Vehicle |
| CSD | Cellular Signaling Data |
| TAZ | Traffic Analysis Zone |
| MP | Mathematical Programming |
| MINLP | Mixed-Integer Non-Linear |
| GPS | Global Positioning System |
| ET | Electric Taxi |
| OD | Origin-Destination |
| V2G | Vehicle-to-Grid |
| PFC | Primary Frequency Control |
| DGS | Dynamic Grid Support |
| NEXTA | Network EXplorer for Traffic Analysis |
| GUI | Graphic User Interface |
| DBSCAN | Density-Based Spatial Clustering of Applications with Noise |
| Eps | Epsilon |
| MinPts | Minimum Number of Points |
| Hclust | Hierarchical clustering |
| SOC | State of Charge |
| Variables | |
| I | |
| J | |
| the remaining battery state | |
| the battery capacity | |
| the average energy consumption of EV | |
Table 2.
Sample data of cellular signaling data (CSD).
| Number | lac | ci | Time_start | Time_end | Longi | Lati |
|---|---|---|---|---|---|---|
| 1460011710043460 | 8578 | 12502 | 20160808072230 | 20160808072230 | 117.10860 | 36.66470 |
| 1460011710043460 | 8578 | 12502 | 20160808072233 | 20160808072233 | 117.10860 | 36.66470 |
| 1460011710043460 | 8578 | 196609 | 20160808072617 | 20160808072627 | 117.11092 | 36.66752 |
Table 3.
Comparison of clustering analysis.
| Comparison of Clustering Analysis | Case 1: DBSCAN | Case 2: HClust | Case 3: K-means |
|---|---|---|---|
| Number of Stations | 13 | 30 | 30 |
| Max Service Radius (km) | 51.29 | 13.83 | 13.73 |
| Min Service Radius (km) | 0.38 | 1.29 | 4.18 |
| No. of Stations (Charging Demand <10 EV) | 9 | 12 | 6 |
| No. of Stations (Charging Demand 10~50 EV) | 2 | 16 | 24 |
| No. of Stations (Charging Demand >50 EV) | 2 | 2 | 0 |
| Cumulative VKT to Charging Station (km) | 9654.3 | 2502.6 | 2344.3 |
© 2019 by the authors. Licensee MDPI, Basel, Switzerland. This article is an open access article distributed under the terms and conditions of the Creative Commons Attribution (CC BY) license (http://creativecommons.org/licenses/by/4.0/).
Share and Cite
MDPI and ACS Style
Jia, J.; Liu, C.; Wan, T. Planning of the Charging Station for Electric Vehicles Utilizing Cellular Signaling Data. Sustainability 2019, 11, 643. https://doi.org/10.3390/su11030643
AMA Style
Jia J, Liu C, Wan T. Planning of the Charging Station for Electric Vehicles Utilizing Cellular Signaling Data. Sustainability. 2019; 11(3):643. https://doi.org/10.3390/su11030643
Chicago/Turabian StyleJia, Jianmin, Chenhui Liu, and Tao Wan. 2019. "Planning of the Charging Station for Electric Vehicles Utilizing Cellular Signaling Data" Sustainability 11, no. 3: 643. https://doi.org/10.3390/su11030643
Note that from the first issue of 2016, this journal uses article numbers instead of page numbers. See further details here.