Article

Synergistic Impacts of China’s Subsidy Policy and New Energy Vehicle Credit Regulation on the Technological Development of Battery Electric Vehicles

1
State Key Laboratory of Automotive Safety and Energy, Tsinghua University, Beijing 100084, China
2
Tsinghua Automotive Strategy Research Institute, Tsinghua University, Beijing 100084, China
3
China Automotive Energy Research Center, Tsinghua University, Beijing 100084, China
*
Author to whom correspondence should be addressed.
Energies 2018, 11(11), 3193; https://doi.org/10.3390/en11113193
Submission received: 29 October 2018 / Revised: 10 November 2018 / Accepted: 11 November 2018 / Published: 17 November 2018
(This article belongs to the Section C: Energy Economics and Policy)

Abstract

:
With the phasing down of subsidies, China has launched the new energy vehicle (NEV) credit regulation to continuously promote the penetration of electric vehicles. The two policies will coexist through 2020 and definitely pose a dramatic impact on the development of the Chinese and even the global electric vehicle market. However, few studies have systematically investigated the relationship between the two policies as well as the synergistic impacts during the overlap period. This paper interprets the rationales of China’s subsidy policy and NEV credit regulation and establishes a bottom-up model to estimate the synergistic impacts of the two policies on the technological trends of battery electric vehicles (BEVs) from the perspective of credit cost-effectiveness. The results suggest that the subsidy policy still maintains strong support for the development of electric vehicles in China. For small BEVs whose driving ranges are higher than 300 km, subsidies even account for 40–50% of the manufacturing cost. In addition, we conclude that the two policies will complement each other in the transitional period and small BEVs are preferred by both policies. Under the NEV credit regulation, 350 km will consistently be the optimal driving range, which will definitely limit the development of other ranges. With the addition of the subsidy, the limitation will be amended in the short run. However, the effect of the subsidy is decreasing and is going to be canceled after 2020, so the focus should be on the optimization of the NEV credit regulation.

1. Introduction

With the boom of the vehicle market in the past decade, China is facing severe energy and environmental problems simultaneously [1,2,3]. Over the past few years, China’s external dependence on crude oil has continually increased, reaching 67.4% in 2017 [4], which is far beyond the international safety warning line. Moreover, China has accounted for approximately 27.6% of global carbon dioxide emissions [5], and haze and particulate matter (PM) have become society-wide concerns [6]. Because the capacity of the environment to absorb these pollutants is limited, environmental protection will become increasingly important and considered an indispensable assessment criterion for the automotive industry [7,8].
As promising technologies for addressing oil security, air pollution, and greenhouse gas emissions, new energy vehicles (NEVs) have gained high priority in China and even worldwide [9]. According to the definition issued by the Chinese State Council, NEVs include battery electric vehicles (BEVs), plug-in hybrid electric vehicles (PHEVs), and fuel cell vehicles (FCVs) [10]. The objective of the Chinese government is that the cumulative sales of BEVs and PHEVs reach 5 million by 2020 [10], with the sales of all NEVs accounting for 7% of the entire vehicle market in 2020, 20% in 2025, and 40% in 2030 [11]. To promote the penetration of NEVs, China launched a package of incentive programs and policies from 2000 to 2018, including development and popularization projects, preferential tax and subsidy policies, regulatory incentives, and privilege in registration and usage [12]. Among these policies, the subsidy scheme has played a critical part in starting up China’s NEV market [13] and the NEV credit regulation, which was launched in April 2018, is considered a great impetus for the development of NEVs accompanied by the decrease of subsidies in the near future [14,15]. These two policies represent fiscal and non-fiscal incentives, respectively, and are definitely of great significance to the sustainable development of NEVs in China.
As the most representative fiscal policy for promoting the penetration of NEVs, subsidies, as well as tax exemptions, have been adopted in many countries [13]. In the US, the government offered $2500–$7500 tax credits for the purchase of BEVs and PHEVs depending on the battery capacity from 2010 [16], and $800 billion was allocated by the American Recovery and Reinvestment Act to invest in renewable energy and energy efficiency in 2012, including tax credits for the purchase of BEVs and PHEVs [12]. In the UK, the subsidy for EVs covers approximately 25% of the price and the upper limit was £5000 in 2014 [17]. In France, the subsidy is based on type-approval CO2 emissions. The subsidy of vehicles with CO2 emissions between 0 and 20 g/km covers 27% of the price, with an upper limit of €6300. The subsidy of vehicles with CO2 emissions between 21 and 60 g/km covers 20% of the price, with an upper limit of €4000 [17]. In Japan, subsidies up to 100,000 Yen were offered to environmentally friendly vehicles in 2009 [18], and a maximum 850,000 Yen subsidy was offered in 2013 [13]. In addition, the total budget of the subsidy was phased down from 2015 [19].
China’s subsidy and purchase tax exemption policies will introduce a benefit of approximately $10,000 for BEVs, which is higher than that offered in America and next to the benefits offered in Norway and the Netherlands [20]. The total values of incentives in Chinese cities, such as Beijing, Shanghai, and Shenzhen, are higher than those in other cities, and only inferior to those in Oslo, Norway [21].
Extensive research has suggested that subsidies and feebates are the most effective measures for improving the market share of new energy vehicles [22]. Burak et al. built an agent-based model to estimate the future market shares of EVs under different policies. The authors found that financial incentives (up to $7500 in the United States) would increase the EV market share by up to 25% in the year 2030 and that the implementation of the Corporate Average Fuel Economy (CAFE) regulation in conjunction with financial incentives for EVs is the most effective policy measure for the market penetration of EVs [23]. Hao et al. estimated the impacts of China’s two-phase electric vehicle subsidy scheme from 2009 to 2015 and concluded that subsidies are highly necessary for EVs to be cost-competitive with conventional internal combustion engine (ICE) vehicles [13].
Some studies have evaluated the subsidy policy with respect to the total costs of ownership. Palmer et al. built a panel regression model and compared the total cost of ownership for hybrid electric vehicles in England, the United States, and Japan from 1997 to 2015. The results show that the total cost of ownership was strongly linked to the market share of HEVs and that financial subsidies have enabled EVs to reach cost parity in the UK, California, and Texas [24]. Petra Zsuzsa Lévay et al. conducted calculations of the total cost of ownership to reveal the role of subsidies in reducing the total cost of ownership and increasing EV sales. The results suggest that large EVs have a lower total cost of ownership, higher sales, and a lower price responsiveness than small EVs, compared with their ICE vehicle equivalents. Moreover, exemptions from flat taxes are beneficial for large EVs and subsidies are beneficial for small EVs [25]. Harvey concluded that HEVs are close to cost-competitive, while PHEVs and BEVs require large subsidies by projecting the net present value and total cost of ownership [26].
Among all the non-fiscal policies that have an obvious bias towards NEVs, the zero emission vehicle (ZEV) credit mandate in California is the most representative. California launched a plan to reduce vehicle emissions to zero through the introduction of the ZEV regulation in 1990 [27]. The regulation has been modified several times over the years and has been adopted by 11 states in the US, covering approximately 30% of the American vehicle market [28,29]. The regulation set minimum sale percentages of ZEVs, e.g., BEVs and FCVs, for manufacturers, and credits are determined based on the type of vehicle and the all-electric range [30,31]. Other advanced near-zero emission vehicles, such as transitional zero emission vehicles (TZEVs), partial zero emission vehicles (PZEVs), advanced technology partial zero emission vehicles (AT PZEVs), and neighborhood electric vehicles also have corresponding credits [32,33]. Under the ZEV credit regulation, automakers must produce as many ZEV credits as possible to meet the minimum requirements of the policy. Generally, the design concept of China’s NEV credit regulation is very similar to California’s ZEV mandate.
Technology-forcing regulations are shown to be effective tools for driving innovation but also involve a high uncertainty. Extensive research has studied the impacts of ZEV regulation. Sierzchula et al. studied the ZEV regulation and the impact on electric technology development from the perspective of patents and prototypes and concluded that automakers still invested heavily in electric mobility R&D even if they already meet the minimum limits of the regulation [31]. Greene et al. investigated the types, timing, and intensity of California’s ZEV mandate and concluded that the ZEV regulation is the key policy in promoting the early sales of EVs in California. Implementing strong temporary policies is also necessary to address the coevolution of the vehicle and fuels markets [34]. Wesseling et al. established a conceptual framework to study the response of manufacturers to ZEV mandates over the period of 1990–2013. The results suggested that manufacturers combine and change their innovation and political strategies in response to technology-forcing regulations depending on their value maintenance [35].
In addition, the price of credit and the transparency of the credit trading market determine the compliance of regulations. The amount of traded credits and the credit changes of manufacturers were announced in California instead of the price of credit. However, many researchers have stressed that the price of credit is more important for the strategies of manufacturers than the number of credits traded. Furthermore, the lack of an effective credit trading platform has also increased the cost of trading [36]. Moreover, to balance the relationship between the minimum requirement of regulations and the value of credits, it is important to establish a dynamic regulatory mechanism [37].
Few studies have focused on China’s NEV credit regulation because it was launched only five months ago. Liu et al. analyzed the relationships among the CAFC, NEV, and carbon credit regulations and projected the development of NEVs based on the draft of the dual-credit regulation [38]. Zou et al. established a compliance model to meet the requirements of the dual-credit regulation with a minimum number of NEVs and fix the trading price of NEV credits [39]. Wang et al. analyzed the most cost-effective strategies for complying with the regulation for four typical automakers [15]. Ou et al. simulated and compared different policy scenarios (CAFC only, NEV only, CAFC and NEV) from 2016 to 2020 and quantitatively analyzed the impacts of the dual-credit regulation on BEV and PHEV sales and industry profits [40].
However, although extensive research has been carried out on subsidy and credit regulations, no single study has analyzed the synergistic impacts of China’s subsidy policy and NEV credit regulation, especially with respect to the technological development of vehicles. On the one hand, the NEV credit regulation was first adopted in China and newly issued. The relevant research has not yet caught up. On the other hand, although the NEV credit regulation is going to replace the subsidy policy to continuously promote the penetration of NEVs, an overlap period still exists and will definitely pose a significant impact through 2020, something that has not received sufficient attention.
To fill these research gaps, the rationales of China’s subsidy policy and NEV credit regulation are interpreted, and a bottom-up model based on the credit cost-effectiveness method is established to provide comprehensive policy insights regarding two policies and estimate the synergistic impacts on the technological development of BEVs. This study includes a policy simulation, predictions of technical trends, and an explicit assessment of policy implications. This paper is organized as follows. Section 2 interprets the rationales and relationships of China’s subsidy policy and NEV credit regulation and describes the methodology, accounting framework, key assumptions, and data. Section 3 analyzes different scenarios and estimates the synergistic impacts of the two policies. Section 4 presents the policy implications and proposes recommendations for the government and manufacturers. Section 5 draws conclusions from the whole study.

2. Materials and Methods

2.1. Materials

2.1.1. The Rationale of China’s Subsidy Schemes

As one of the earliest fiscal incentives in China, the first phase of the electric vehicle subsidy scheme was launched in 2009 with a duration spanning from 2009 to 2012 [41]. Initially, subsidies for electric vehicles had been implemented for only public procurement in 13 pilot cities in 2009. Later, subsidies based on battery capacity were extended to private purchases in 25 cities in 2010 [42].
The second phase of the subsidy scheme was issued in 2013 and continued to 2015. The scope of the policy was extended to the whole country and the basis of the subsidy was changed to the all-electric range [43]. Considering the technological evolution and the scale effect of cost, these subsidies are being phased down over time. The subsidies were reduced at rates of 5% and 10% in 2014 and 2015, respectively, based on the 2013 level [44].
Given the satisfactory effect of the subsidy policy, the Chinese government launched the third phase of the subsidy scheme in 2015 with a duration spanning from 2016 to 2020 [45], followed by updates in 2016 and 2018 [46,47]. The thresholds of the subsidies have been improved continuously since 2016. For example, minimum all-electric ranges were required in 2016 [45]. After that, the requirements of the electricity consumption rate and energy density were added, and adjusting multipliers were applied in 2017 [46]. In the newly issued subsidy scheme of 2018, the thresholds of the all-electric range, energy density, and electricity consumption rate were improved, and electricity consumption multipliers were added [47]. Additionally, the subsidies were planned to be reduced every two years through 2017–2020 at rates of 20% and 40% based on the 2016 level [45]. Later, the subsidies were planned to be reduced further in 2019–2020 at a phasing down rate of 20% [46]. Furthermore, the upper limits of the subsidies from the central and local governments were changed starting in 2017, when the local subsidies could not exceed 50% of the central subsidies [46].
The development of the subsidy scheme in China is shown in Figure 1. Some trends in the development of the scheme can be observed. First, the types of vehicles subsidized were changed. Hybrid electric vehicles were gradually removed from the list, and only new energy vehicles (PHEVs, BEVs, and FCVs) were able to obtain the subsidies. Second, the scope of the subsidy was changed from some pilot cities to the whole country and the application field was extended from public procurement to private purchase. Third, the determinant of the subsidy was adjusted from hybridization degree to battery capacity in 2010 and then to all-electric range in 2014. Fourth, the thresholds of the subsidies were improved continuously over time considering the progress of technologies. Fifth, the amount of the subsidy was adjusted continuously. The speed of phasing down decreased in 2014 and 2015, while the adjustments in 2016 and 2018 directly accelerated the decrease of most subsidies. However, the subsidies of BEVs with a driving range over 300 km were improved in 2018, which reflects an encouragement of high driving ranges.
According to the trends, a subsidy scheme involving the standard of subsidies and regional supporting ratios from 2019 to 2025 is predicted. As previously mentioned, although the subsidy scheme played an essential part in the penetration of electric vehicles, as a fiscal policy incentive, the subsidy scheme will eventually be mitigated and ultimately removed. Indeed, with the rapid development of the EV market in China, the Chinese government is planning to cancel the subsidy of new energy vehicles completely by 2020 and promote the penetration of EVs by the NEV credit regulation [48]. Nevertheless, in order to fully evaluate the substitution effect of NEV credit regulations, we still construct two scenarios with and without subsidies in 2025.
The final subsidy consists of the standard subsidy and two adjusting multipliers, i.e., an energy density multiplier and an electricity consumption multiplier. The standard subsidy is determined by the driving range of BEVs, as shown in Figure 1. The energy density multiplier is determined by the energy density of the battery. Batteries with energy densities of 105–120 Wh/kg, 120–140 Wh/kg, 140–160 Wh/kg, and beyond 160 Wh/kg can obtain 0.6, 1, 1.1, and 1.2 times the subsidy, respectively, in 2018 [47]. However, considering the constantly improving policy standard, the average energy density multiplier α in this study is set to 1 through 2025.
Another key factor is the electricity consumption multiplier, which is determined by the electricity consumption rate [47]. The calculation method of the electricity consumption multiplier is concluded and indicated in Equation (1):
β = { { 1.1 , Y 0.75 × ( 0.0126 × m + 0.45 ) 1 , 0.75 × ( 0.0126 × m + 0.45 ) < Y 0.95 × ( 0.0126 × m + 0.45 )     m 1000 0.5 , 0.95 × ( 0.0126 × m + 0.45 ) < Y 0.0126 × m + 0.45 { 1.1 , Y 0.75 × ( 0.0108 × m + 2.25 ) 1 , 0.75 × ( 0.0108 × m + 2.25 ) < Y 0.95 × ( 0.0108 × m + 2.25 )     1000 m 1600 0.5 , 0.95 × ( 0.0108 × m + 2.25 ) < Y 0.0108 × m + 2.25 { 1.1 , Y 0.75 × ( 0.0045 × m + 12.33 ) 1 , 0.75 × ( 0.0045 × m + 12.33 ) < Y 0.95 × ( 0.0045 × m + 12.33 )     m 1600 0.5 , 0.95 × ( 0.0045 × m + 12.33 ) < Y 0.0045 × m + 12.33
where β denotes the electricity consumption multiplier, Y denotes the electricity consumption rate of EVs (kWh/100 km), and m denotes the curb weight of the vehicle (kg).
In addition, the total subsidies of vehicles can be divided into national subsidies and local subsidies. The local government usually determines the amount of subsidy according to the national standard and sets a regional supporting ratio. The ratios in different regions are usually consistent except for those in certain cities such as Beijing. To obtain a general result, the regional supporting ratio used in this study is set as shown in Figure 1. Thus, the final subsidy can be obtained by Equation (2).
S = S 0 × ( 1 + ε ) × α × β
where S denotes the total subsidy, S0 denotes the standard subsidy, ε denotes the regional supporting ratio, and α denotes the energy density multiplier.

2.1.2. The Rationale of China’s NEV Credit Regulation

The NEV credit regulation was newly issued by the Ministry of Industry and Information Technology (MIIT) of China in September 2017 and implemented from April 2018 [14]. By including the corporate average fuel consumption (CAFC) credit regulation, China has become the global leader in establishing a nationwide credit management scheme, also widely called the dual-credit regulation scheme for energy saving and new energy passenger vehicles. The aim of the NEV credit regulation is to promote the penetration and guarantee the market size of NEVs by setting a proportional NEV credit requirement for traditional automakers, which is similar to the ZEV mandate passed in California. The NEV credit is becoming extremely valuable because it can not only be sold to other manufacturers but can also unilaterally compensate for CAFC credits in China’s dual-credit scheme.
According to the rules of the NEV credit regulation, different vehicles have different credits with different determinants [14]. Furthermore, the final credit for BEVs consists of the basic credit and the multiplier, as indicated in Equation (3), which depends on the curb weight, electric driving range, battery capacity, and energy-saving technology. According to the NEV credit scheme, the basic vehicle credit is determined by the electric range of the BEV, and the credit multiplier is determined by the electricity consumption rate and the curb weight of the vehicle. The credit calculation methods are shown in Equations (3)–(5):
C = C S × γ  
C S = { 0 A E R < 100   km 0.012 × A E R + 0.8 A E R > 100   km C S 5
γ = { { 1.2 , Y 0.7 × ( 0.014 × m + 0.5 ) 1 , 0.7 × ( 0.014 × m + 0.5 ) < Y 0.014 × m + 0.5     m 1000 0.5 , Y > 0.014 × m + 0.5 { 1.2 , Y 0.7 × ( 0.012 × m + 2.5 ) 1 , 0.7 × ( 0.012 × m + 2.5 ) < Y 0.012 × m + 2.5     1000 m 1600 0.5 , Y > 0.012 × m + 2.5 { 1.2 , Y 0.7 × ( 0.005 × m + 13.7 ) 1 , 0.7 × ( 0.005 × m + 13.7 ) < Y 0.005 × m + 13.7     m 1600 0.5 , Y > 0.005 × m + 13.7
where CS denotes the basic credit, all-electric range (AER) (based on the mode method of the NEDC cycle) denotes the all-electric range of the vehicle (km), γ denotes the credit multiplier, Y denotes the electricity consumption rate of the vehicle (kWh/100 km), m denotes the curb weight of the vehicle (kg), and C denotes the final credit of the vehicle. It is worth mentioning that the driving range of a BEV should be higher than 100 km; otherwise, the vehicle will not receive credit. The upper limit of basic credits for all NEVs is 5.
The basic credit and multiplier vary significantly among different types of NEVs. The maximum basic credits of BEV and FCV are 5 while the basic credit of PHEV is fixed at 2. For the credit multiplier, BEVs have 3 values, namely, 0.5, 1, and 1.2, as indicated in Equation (5), and PHEVs and FCVs have two, 0.5 and 1 [14,40]. Thus, the maximum final credits of BEVs, FCVs, and PHEVs are 6, 5, and 2, respectively, which reflect the strong support for BEVs from the Chinese government.

2.1.3. Theoretical Analysis of the Chinese BEV Market

● Database and Vehicle Distribution
The MIIT of China had issued 15 catalogs of NEVs that were exempt from purchase taxes from 2014 to 2017 and 12 catalogs of NEVs that were subsidized in 2017 [49,50]. The catalogs contain a large number of detailed technical attributes of different vehicle models, such as the curb weight, all-electric range, battery capacity, fuel consumption rate, and electricity consumption rate. This enormous mass of data was derived and further processed using Python. The market data in China, such as prices and sales, were also investigated. Based on the data collected, a large database covering all BEVs in the Chinese market was established, and the features of BEVs were analyzed in this study.
The distribution of vehicles in the Chinese market exhibits a skewed normal feature, which suggests that the BEVs in China mainly lie in the small and midsize segments [51]. Additionally, with the rapid progress of battery technology, the driving ranges of electric vehicles in the Chinese market are continuously increasing. According to the distributions of BEVs in 2016 and 2017, the minimum ranges of BEVs were 120 km in 2016 and 150 km in 2017, and the maximum ranges of BEVs were 380 km and 450 km, respectively.
● Battery Technology Roadmap
As the heart of the BEV, the battery determines the development of BEVs and the entire new energy vehicle industry. To catch up with the world’s most advanced technology level, China issued the technology roadmap for energy-saving and new energy vehicles in 2016 [52]. According to the plan, the industry-wide unit cost of a battery pack will be reduced to 1 ¥/Wh in 2020 and to 0.9 ¥/Wh in 2025, and the energy density will be improved to 260 Wh/kg in 2020 and to 300 Wh/kg in 2025, which are similar to the forecasts reported by major international agencies and analysts [53,54]. The analysis in this study is based on that plan.

2.2. Methods

In this section, the overarching methodology and data are introduced first. Then, the landscape of the Chinese BEV market is presented from three perspectives: the distribution of vehicles, the average electricity consumption rate and technology roadmap. The database established is also introduced, the cost model of the electric vehicle is discussed and the calculation methods are presented. Finally, the contribution rate and credit cost-effectiveness are defined.
Figure 2 presents the framework of the bottom-up model established in this study. The subsidies, credits and manufacturing costs of different BEVs are studied in our analysis. The three most important attributes of BEVs, the driving range, curb weight and electricity consumption rate, determine the subsidy and credit of a vehicle directly, and these three attributes are determined by the technology of the battery and other components. The manufacturing cost, as an important factor, determines the strategy of automakers and the rationality of policies. The interrelationships among the various attributes and factors will be interpreted later, and the impacts of policies will be analyzed from the perspectives of the contribution rate and credit cost-effectiveness.

2.2.1. Average Electricity Consumption Rate

Due to the limitations of the vehicle model and data, little research has elucidated the relationship between the electricity consumption rate and the curb weight of BEVs. The United States Environmental Protection Agency previously estimated the relationships of BEVs by converting the fuel economy of conventional vehicles to gross energy [55], which is not precise. Based on the database built in this research, the relationship of BEVs in the Chinese market can be derived by a cubic polynomial regression and the trendline is shown in Figure 3 and Figure 4. The regression formula is indicated in Equation (6).
Y = 0.0000000036 · m 3 0.0000183543 · m 2 + 0.0343450347 · m 6.7939  
The distribution of BEVs and the framework of the multiplier β in China’s subsidy scheme are shown in Figure 3. The figure shows that the average multiplier of vehicles with a curb weight greater than 1200 kg is 1, while most of the small vehicles had a multiplier of 0 or 0.5 in 2017, which indicates that the investment in energy-saving technologies in midsize BEVs is higher than that in small BEVs in China.
The distribution of BEVs and the framework of the multiplier γ in the NEV credit regulation are shown in Figure 4. All BEVs can receive a multiplier of 1 or 1.2 in 2017. The average multiplier of vehicles with a curb weight less than 1200 kg is 1, while other vehicles receive a multiplier of 1 or 1.2.
Furthermore, to predict the relationship in the near future, a conservative annual technological progress rate of 3% was established for China. According to the fuel economy and greenhouse gas emission standards of the United States and Europe [55,56], technological progress rates between 3% and 6% are reasonable; thus, a conservative scenario is used in this study.

2.2.2. Vehicle Cost Model

As Figure 2 shows, the vehicle cost is made up of the glider cost, battery cost, and the incremental energy-saving technology cost.
● Glider Cost
For most Chinese OEMs, the battery system is usually outsourced, with the retail price estimated at 1.5 times that of the manufacturing cost, while non-battery components are manufactured internally, and the retail price is estimated to be 2 times the manufacturing cost. Based on the manufacturer’s suggested retail price (MSRP) of all BEVs in the Chinese market, the relationship between the glider cost and glider weight is linearly fitted, and the regression formula for the glider cost is indicated in Equation (7).
c g = ( 0.0042 · m g + 2.4122 ) · 10000  
where c g denotes the cost of the glider (¥).
The anticipated reduction in manufacturing costs resulting from improvements in the product design or manufacturing is also considered in this study and the learning curve factor is applied to the glider cost. According to the learning factor developed by the EPA [57], a flat learning rate of 3 percent per year is applied until 2025.
● Battery Cost
The curb weights of different BEVs are determined by the weight of the glider and battery. For a vehicle with a certain glider, battery matching depends on the energy density of the battery and the driving range requirement. The relationship among the electricity consumption rate, the capacity of the battery, the weight, and the all-electric range (AER) are indicated in Equation (8).
A E R = ρ × ( m m g ) 10 × Y  
where m g denotes the weight of the glider (kg) and ρ denotes the energy density of the battery (Wh/kg).
As previously mentioned, the average rate of electricity consumption is derived from the regression. An annual technological progress rate of 3% was set in China. For a BEV with a certain gilder weight and driving range, the energy-saving technology, and battery technology determine the average battery matching, and the results can be obtained via an iterative procedure.
The relationship among the total battery cost, energy density, and unit cost of the battery pack is indicated in Equation (9).
c b = m b · ρ · τ  
where, c b denotes the total cost of the battery (¥) and τ denotes the unit cost of the battery pack (¥/Wh).
● Incremental Energy-saving Technology Cost
Based on the distribution of vehicles in the Chinese market, BEVs are classified into 6 classes considering the European classification method, namely, A00, A0, A, B, C, and D, based on different glider weights, which are indicated in Table 1.
Besides, Table 1 presents estimates of the incremental energy-saving technology cost associated with progressively reduced electricity consumption for a single BEV relative to the level in 2017. The cost is modified based on estimates of the US National Highway Traffic Safety Administration (NHTSA) [53] and major automakers in the Chinese market.

2.2.3. Contribution Rate of Subsidy

As the most effective measure for promoting the penetration of electric vehicles, subsidies directly reduce the purchase costs of consumers and improve the market acceptance of electric vehicles [58]. Additionally, subsidies reduce the cost of manufacturers by offsetting a part of the manufacturing cost. The proportion of subsidies in manufacturing costs, which is defined as the contribution rate, reflects the preference of the policy. For vehicles with different vehicle segments and driving ranges, the contribution rates are indicated in Equation (10). The higher the contribution rate is, the stronger the support from the policy becomes.
C R i j = S i j c g , i j + c b , i j + c t e s , i j × 100 %  
where C R i j denotes the contribution rate for a vehicle in class i with a driving range j; S i j denotes the total subsidy for a vehicle in class i with a driving range j; and c g , i j , c b , i j and c t e s , i j denote the glider cost, battery cost and incremental energy-saving technology cost for a vehicle in class i with a driving range j.

2.2.4. Credit Cost-Effectiveness

To obtain the optimal product features and technologies under the NEV credit regulation, the credit cost-effectiveness values of all BEVs with different glider weights and driving ranges are calculated and compared based on the calculation framework indicated in Equation (11).
C E i j = 10000 · C i j c g , i j + c b , i j + c t e s , i j  
where C E i j denotes the credit cost-effectiveness for vehicles with a glider weight i and range j (credit/¥10,000). The results are used to determine the most economic pathway for receiving credits.

3. Results

To systematically estimate the impacts of the subsidy scheme and NEV credit regulation, the policies are first evaluated separately. Then the synergistic impacts of the two policies on the technological development of BEVs are analyzed from the perspective of the credit cost-effectiveness.

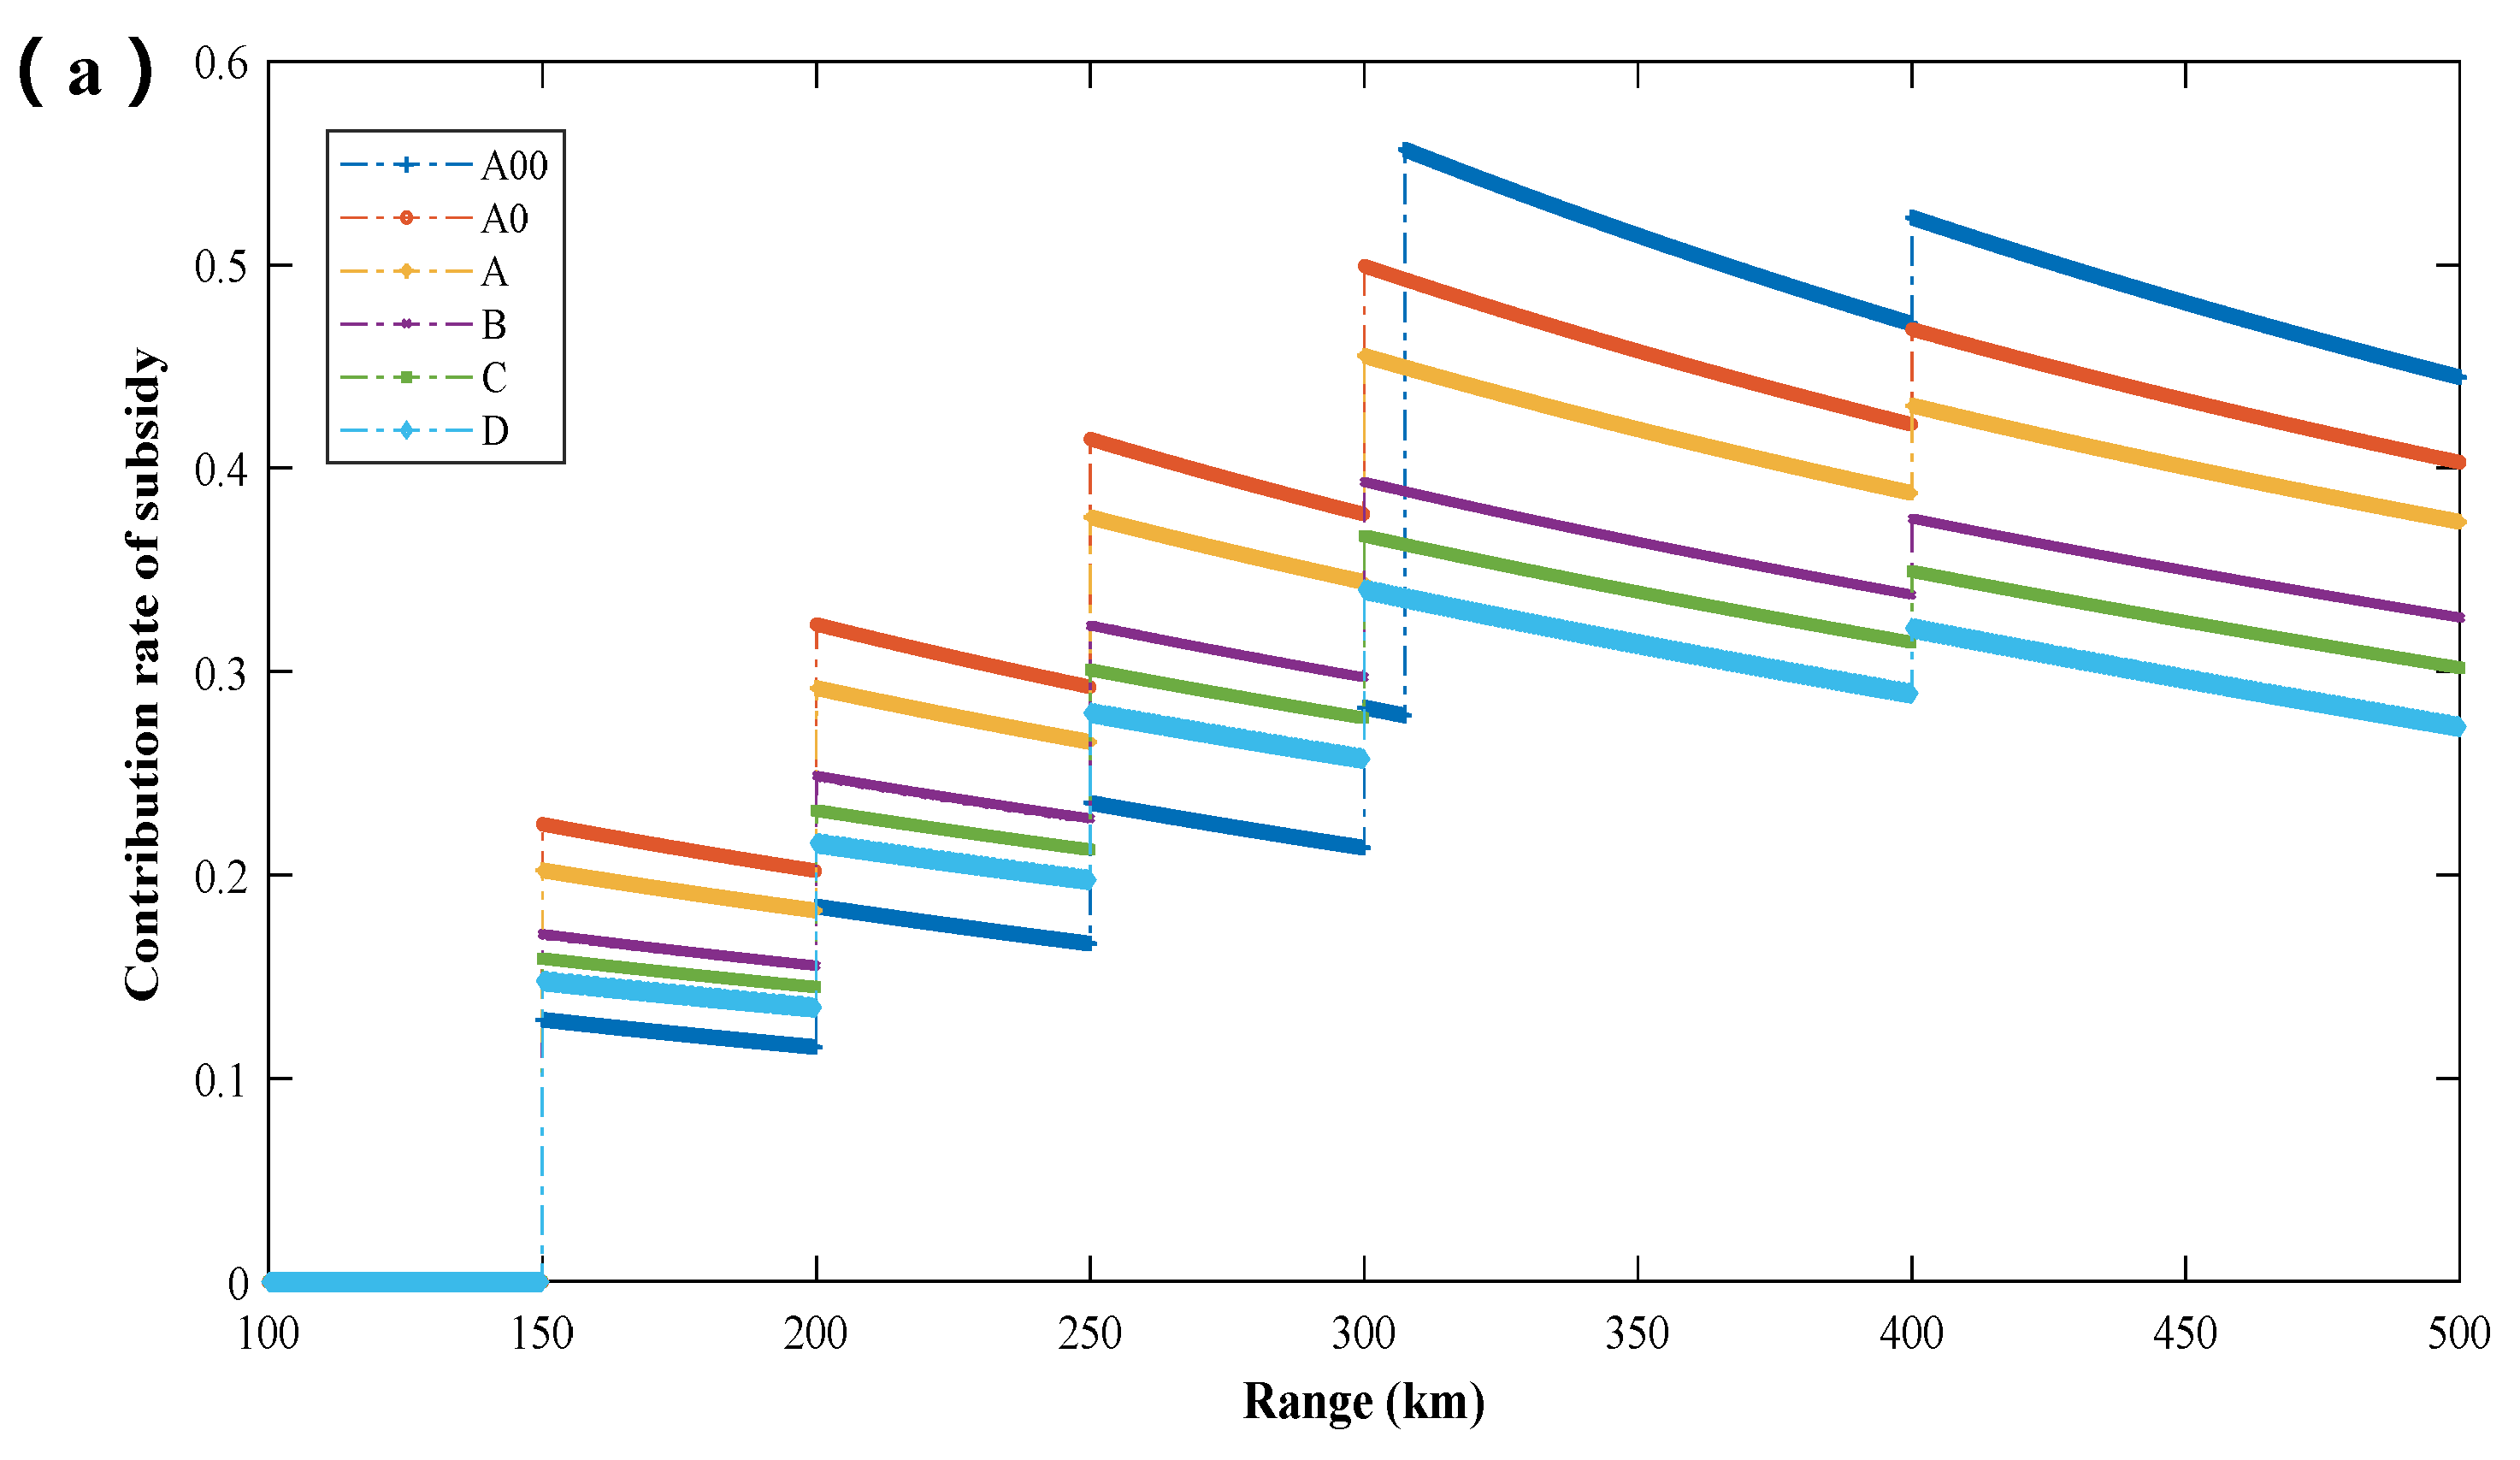
3.1. Contribution Rate of Subsidy

Based on the calculation framework, the contribution rates of subsidies in 2018, 2020, and 2025 are estimated and presented in Figure 5a–c.
According to the policy, subsidies are sectionalized based on the different sections of driving ranges. Therefore, the contribution rates of subsidy exhibit step features, which are shown by dotted lines in Figure 5.
As shown in Figure 5a, the subsidy policy still provides a strong support for the development of electric vehicles in 2018 and for small vehicles whose driving ranges are longer than 300 km, subsidies even account for 40–50% of the manufacturing cost. For BEVs in the A00 class, the contribution rate is the lowest when the driving range is below 308 km, which is mainly because an electricity consumption multiplier of 0.5 is obtained. Except for BEVs in the A00 class, the smaller the vehicle is, the higher the contribution rate becomes.
As is clearly shown in Figure 5b, the threshold of the subsidy will be improved continually, and 200 km will become a new threshold of the driving range to obtain the subsidy. Small vehicles will consistently obtain a higher contribution rate than that of large vehicles. The highest contribution rate in 2020 is 56%, obtained by an A00 BEV with a driving range of 300 km.
In addition, vehicles with a driving range of 300–400 km will obtain the highest preference in the scheme, which reflects the government’s encouragement of BEVs with a high driving range. However, as shown in Figure 5c, if the subsidy policy still exists in 2020–2025, the encouraged driving range will still be 300–400 km under current trends of the subsidy scheme. The highest contribution rate in 2025 is 36%, which is obtained by A00 BEVs with a driving range of 300 km.
Overall, small vehicles and vehicles with a high driving range are encouraged by the subsidy policy. Under the subsidy, the smaller the vehicle type is, the greater the relative manufacturing costs offset by the subsidies will be. The ideal circumstance is that the contribution rate decreases over time and BEVs achieve competence compared with internal combustion engine (ICE) vehicles without the subsidy of the government.

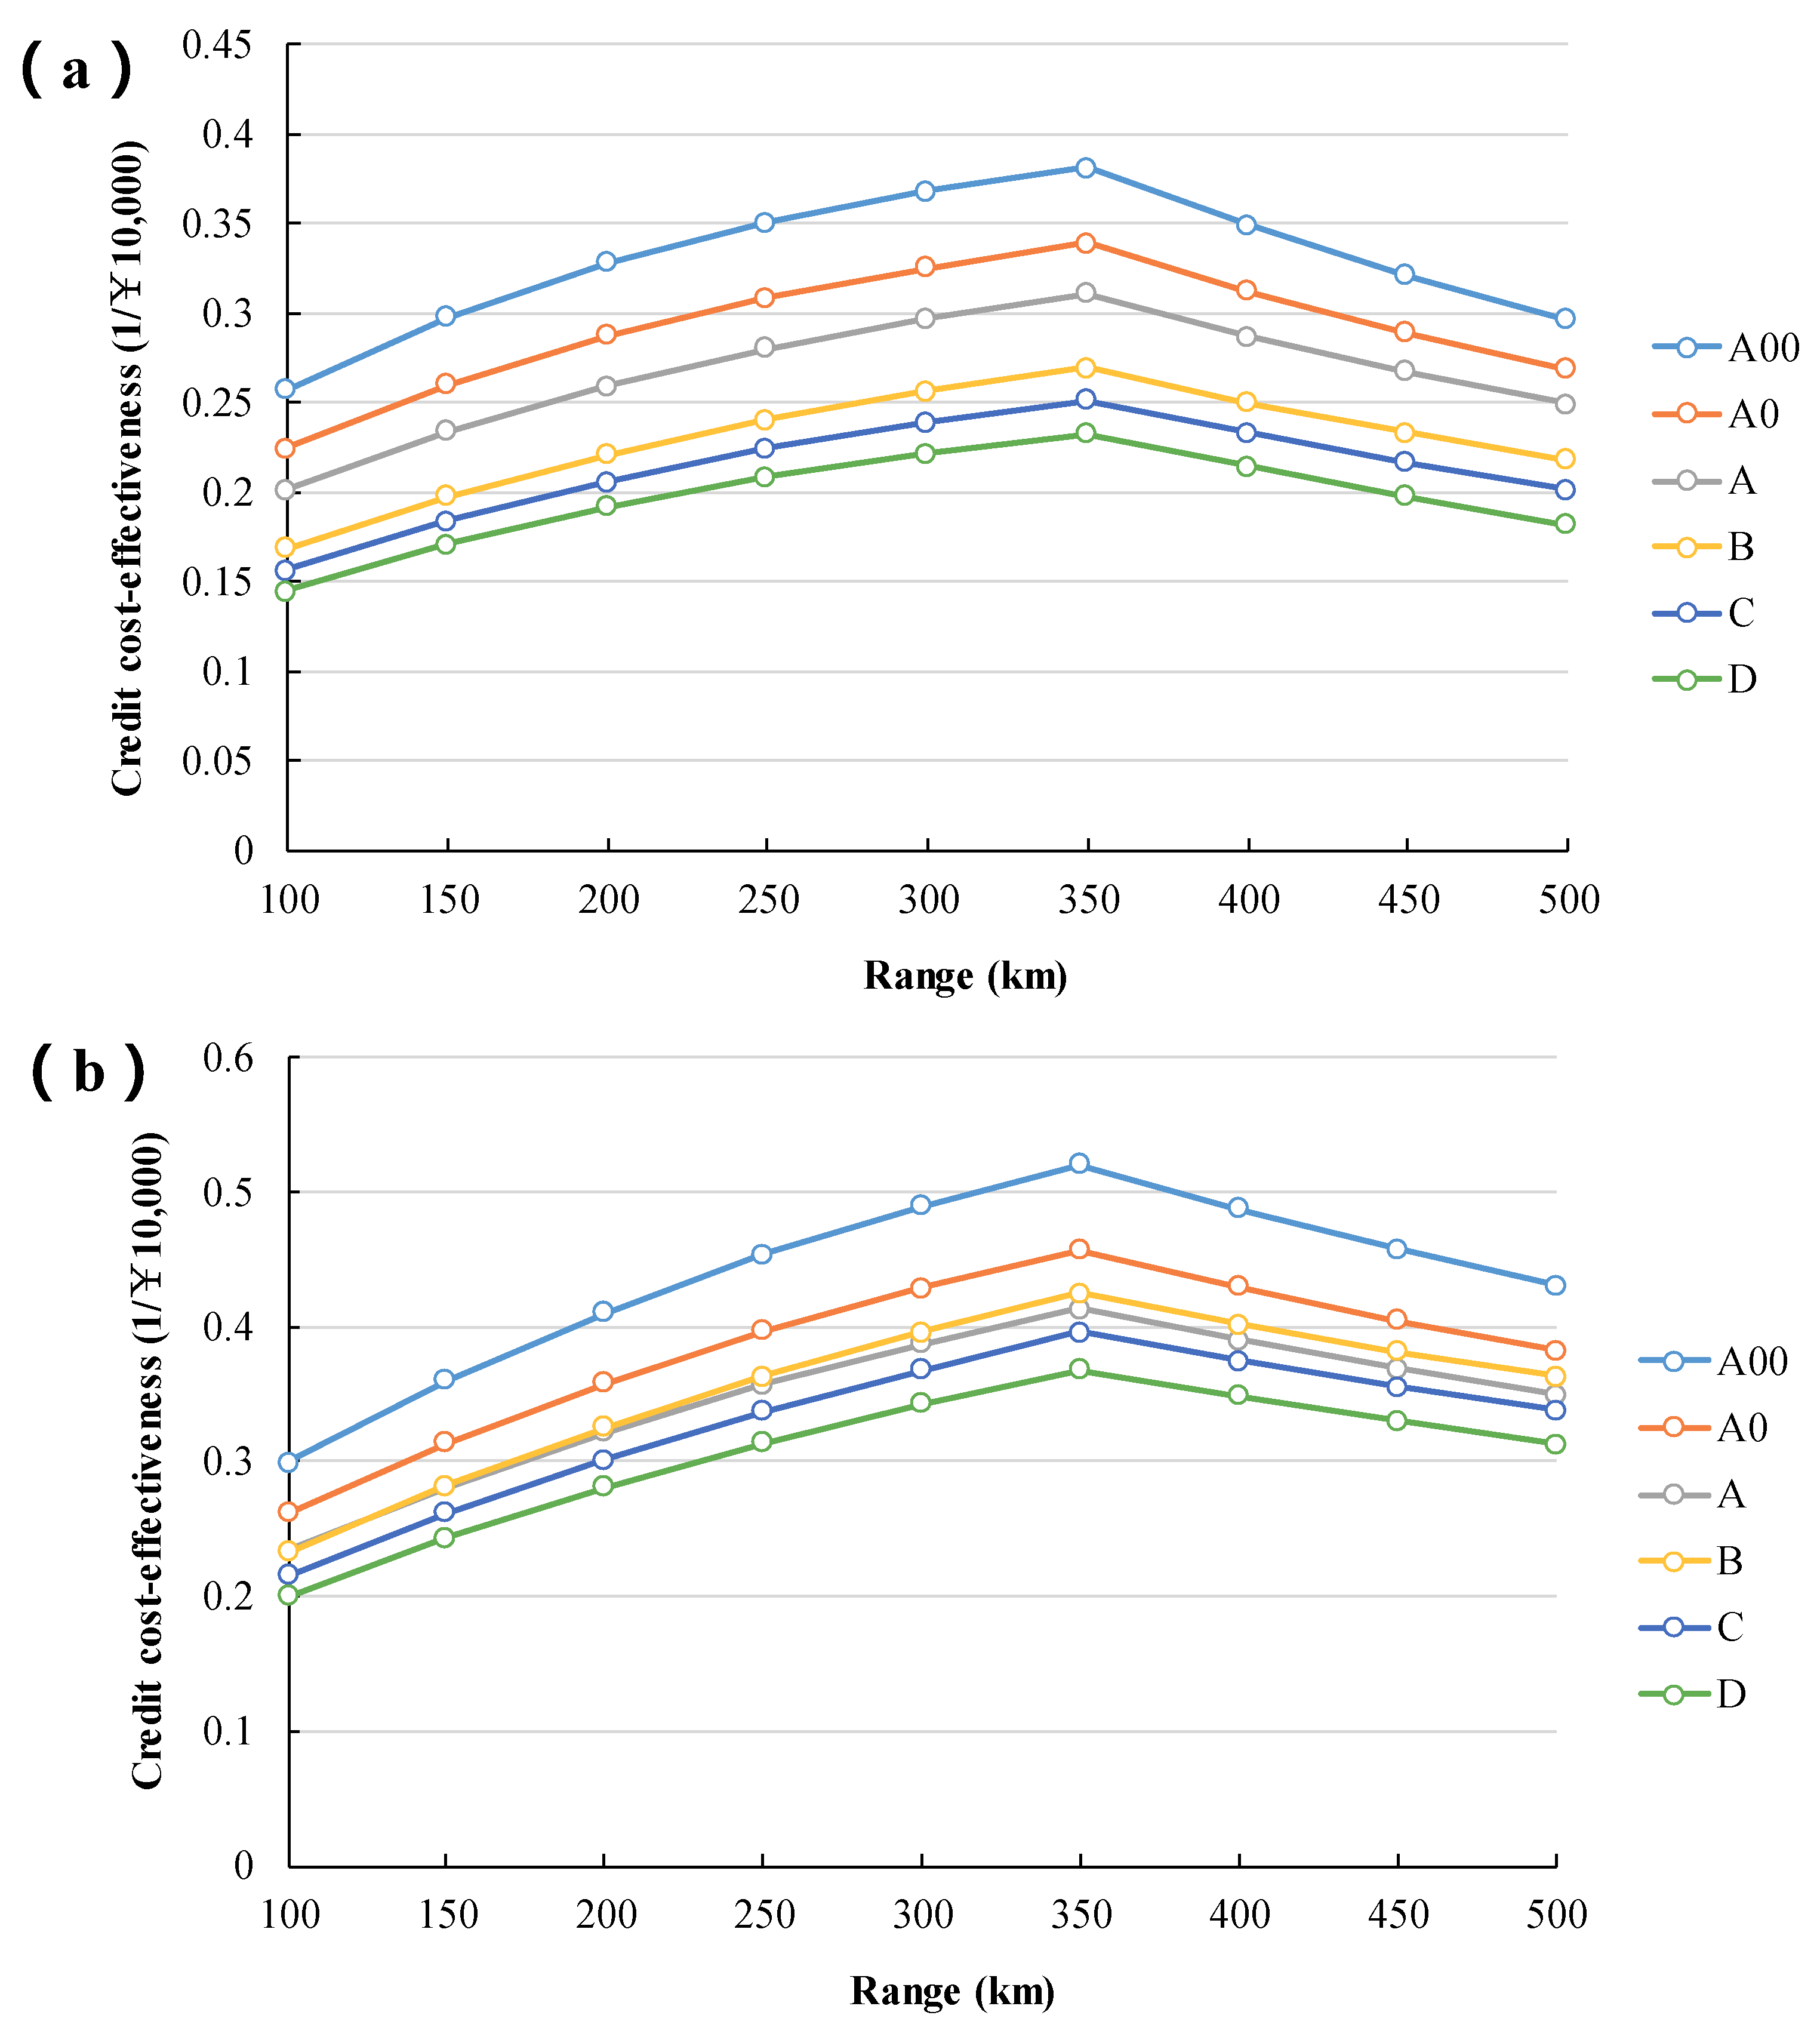
3.2. Credit Cost-Effectiveness under the NEV Credit Regulation

The credit cost-effectiveness of different BEVs in 2018, 2020, and 2025 are estimated and presented in Figure 6a–c.
Under the NEV credit regulation, 350 km will consistently be the optimal driving range, and small BEVs will consistently have the highest credit cost-effectiveness. The A00 BEV with a driving range of 350 km has the highest effectiveness of 0.3811/¥10,000 in 2018. In addition, the smaller the segment is, the higher the cost-effectiveness becomes.
With the progress of technology and the decrease in manufacturing costs, the credit cost-effectiveness of BEVs constantly increase. As shown in Figure 6b, the highest cost-effectiveness in 2020 is 0.5203/¥10,000 and will still be obtained by the A00 BEVs with a driving range of 350 km. The credit cost-effectiveness of vehicles in the B segment will be higher than those of vehicles in the A segment in 2020 because the midsize BEVs take the lead in obtaining the multiplier of 1.2 and the highest credit of 6, which indicates that the midsize BEVs will gain priority before 2020.
Figure 6c shows the credit cost-effectiveness of different BEVs under the NEV credit regulation in 2025. Nearly all BEVs in 2025 will obtain 1.2 times the basic credit except for BEVs in the A00 segment. The highest cost-effectiveness in 2025 is 0.6242/¥10,000 and will be obtained by the A0 BEVs with a driving range of 350 km. After 2025, all BEVs will obtain a multiplier of 1.2 and the regulation will face the risk of losing its effect on the promotion of energy-saving and battery technologies.

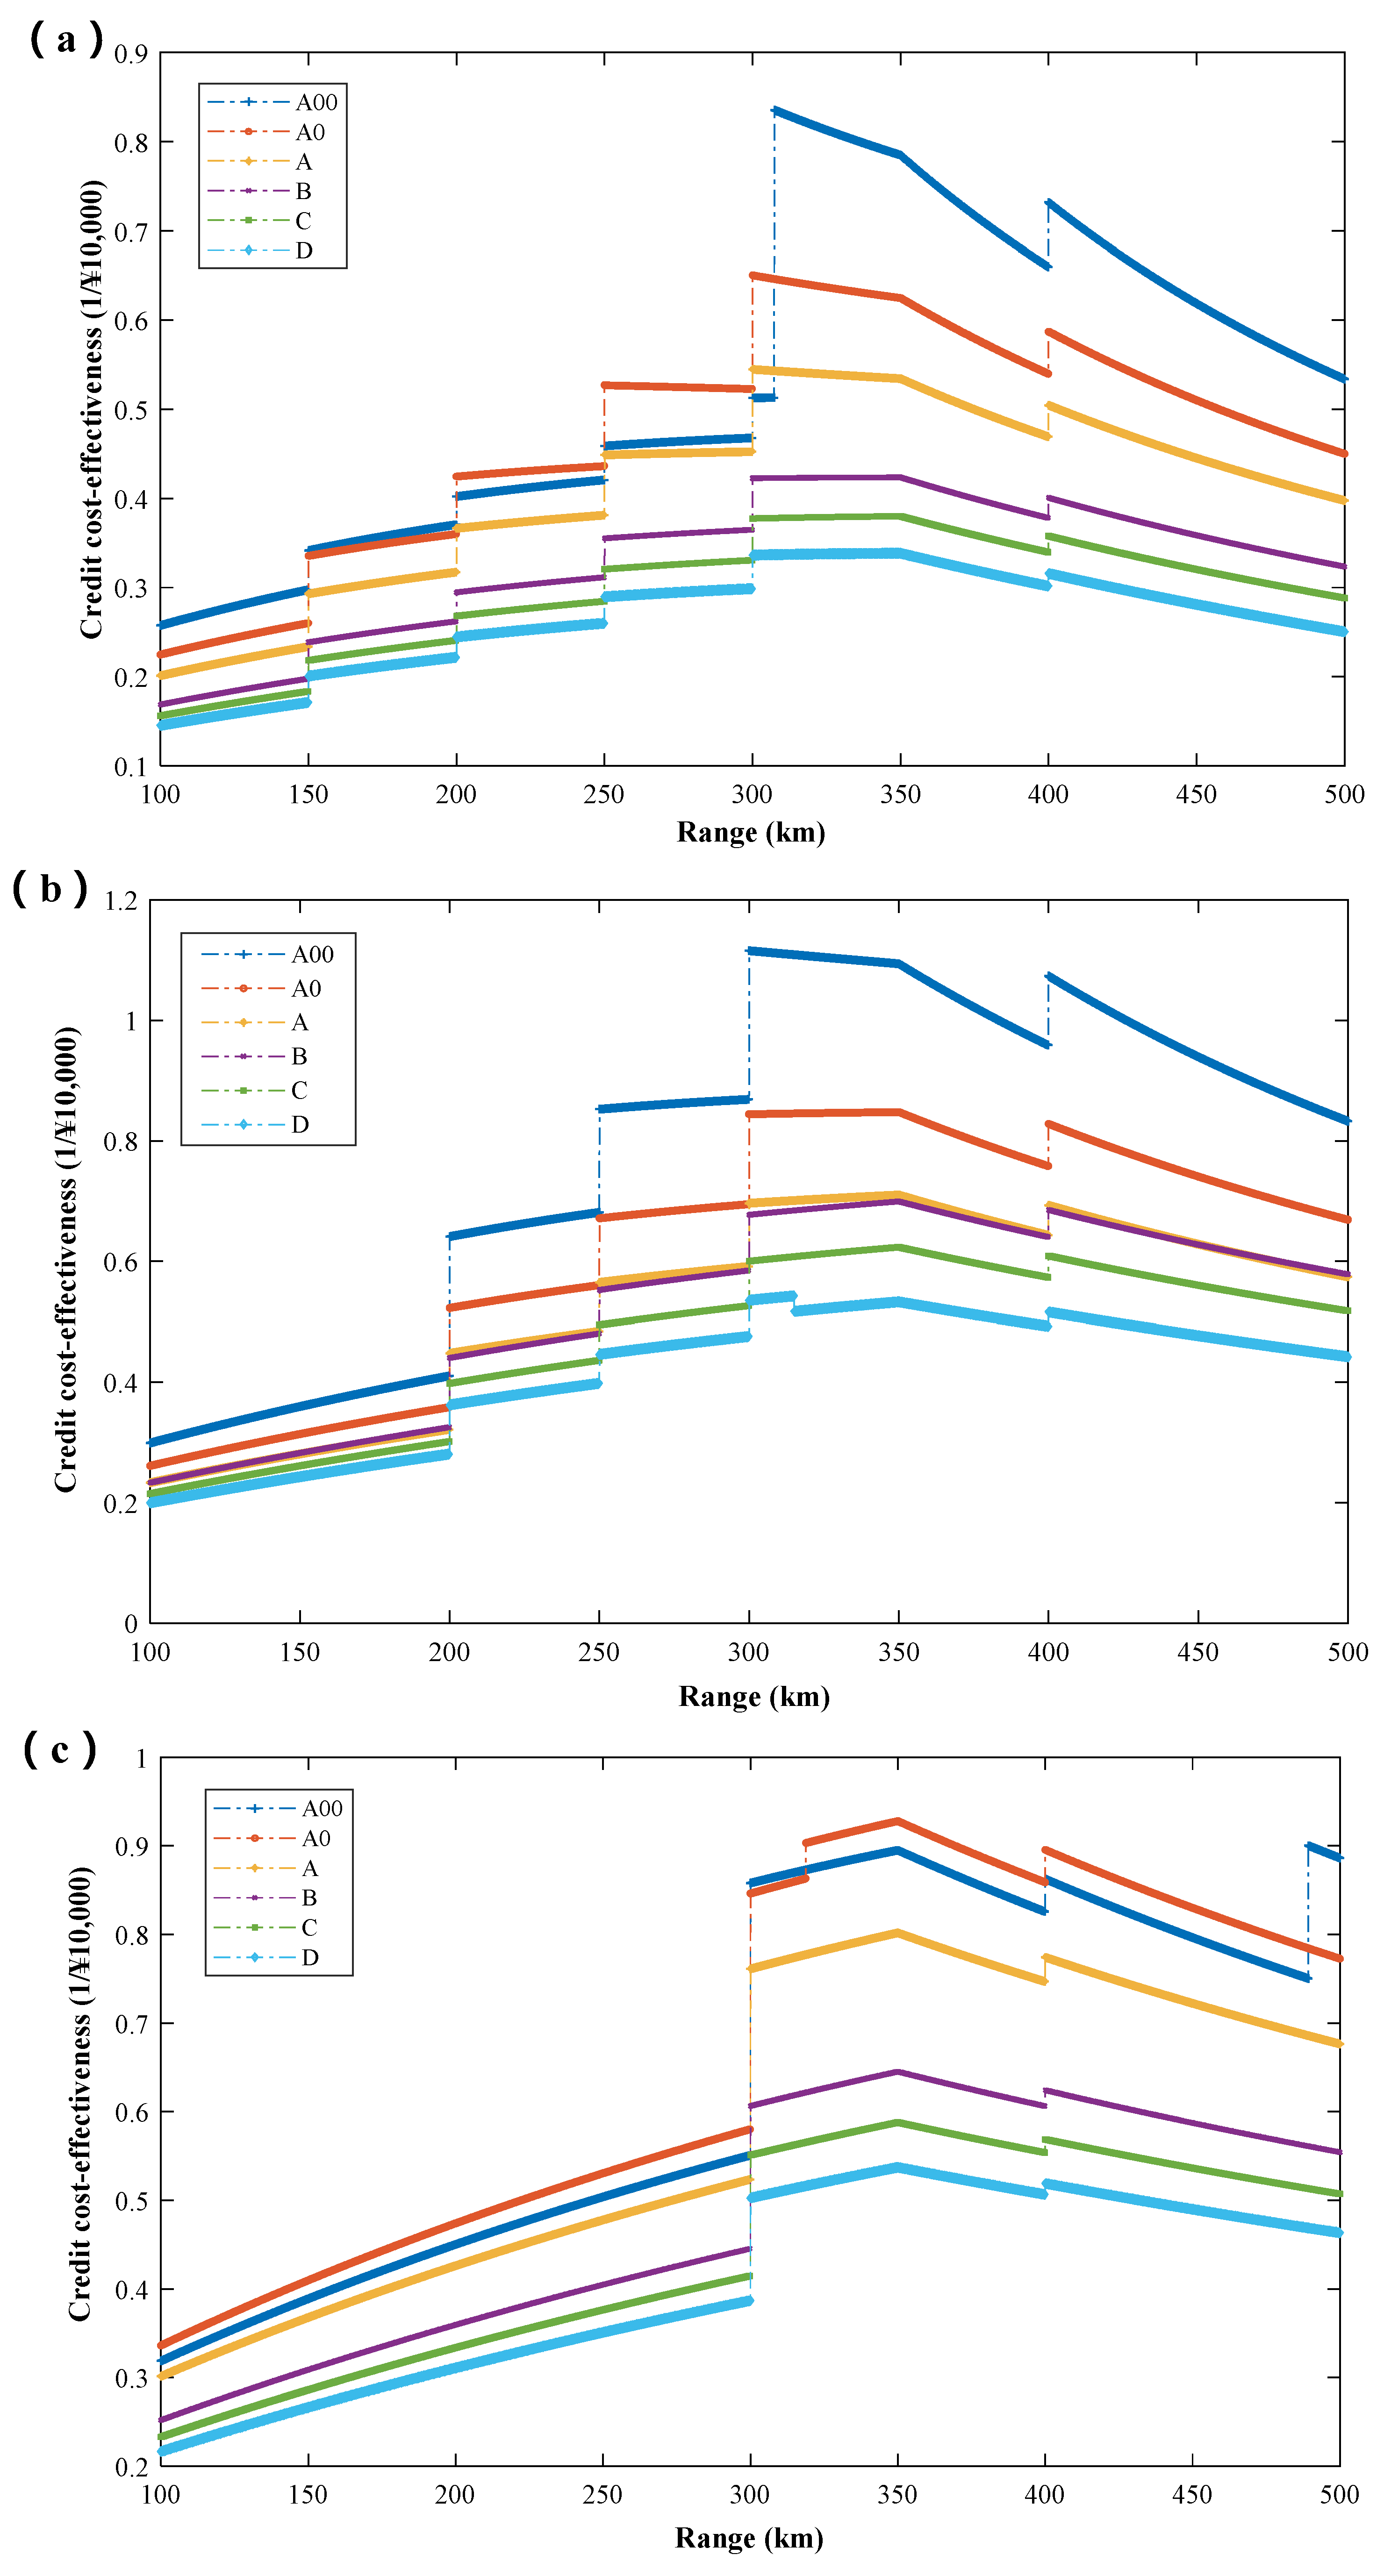
3.3. Credit Cost-Effectiveness under the Subsidy Scheme and NEV Credit Regulation

Taking the subsidy scheme and credit regulation into consideration simultaneously, estimates of the credit cost-effectiveness are shown in Figure 7a–c.
As shown in Figure 7a, the credit cost-effectiveness of small BEVs (A00, A0, and A) is consistently higher than that of midsize and large BEVs in 2018. However, the cost-effectiveness of the A00 BEV with a short driving range is lower than that of the BEVs in the A0 and A segments, which is mainly due to the A00 BEVs receiving a subsidy multiplier of 0.5.
Based on comparisons of different scenarios, an important finding is that with the addition of subsidies, the optimal driving ranges of some small BEVs decrease from 350 km to 300 km through 2020. The highest cost-effectiveness in 2020 is 1.1156/¥10,000 and is obtained by the A00 BEV with a driving range of 300 km. Moreover, the disparities in the cost-effectiveness among the different BEVs are increased.
With the phasing down of the subsidy, the credit cost-effectiveness will decrease after 2020 and the highest credit cost-effectiveness in 2025 will be 0.9279/¥10,000. Moreover, the addition of the subsidy improves the credit cost-effectiveness of BEVs, especially those with a high driving range. However, the optimal driving range will again be 350 km. So from the perspective of technological development, the impact of the subsidy is no longer obvious compared to that of the NEV credit regulation.

4. Discussion and Policy Implications

As the most representative fiscal and non-fiscal policies for the promotion of NEVs, the subsidy policy has played a critical part in the past few decades and the NEV credit regulation will take the place of that policy in the near future and provide a continuous impetus in China. In this regard, the overlap period from 2018 to 2020 will be key to the development of China’s NEV industry.
The phasing down of the subsidies will be inevitable. As a fiscal policy incentive, the subsidy scheme will greatly promote development during the infancy of the industry. However, the subsidy will increase the burden of national finance and limit the selection of the market [59]. The NEV credit regulation aims to establish a long-term manage system by non-fiscal incentives. Due to the differences in the forms and schemes, the effects of subsidy and credit regulation on the technological development of BEVs will be different.
This study contains the policy simulations, predictions of technical trends, and the explicit assessment of policy implications. The results of this study show that there are some correlations between the design of two policies and they will complement each other in the transitional period, which have not been revealed by existing studies [13,15,40,51].
Generally, small BEVs are preferred by both policies. Subsidies will offset the manufacturing costs and improve the credit cost-effectiveness of vehicles. As shown in Figure 5b, for small BEVs with high ranges, subsidies still account for 40–50% of the manufacturing cost and, for midsize and large BEVs, the value will be 20–40% in 2020. Thus, the phasing down of the subsidy will have a greater impact on small BEVs. Nevertheless, as presented in Figure 6, the preference of the NEV credit regulation for small BEVs will successively provide an impetus.
In addition, the optimal driving range for BEVs under the NEV credit regulation will consistently be 350 km, which will definitely limit the development of other ranges and products. Nevertheless, with the addition of subsidies, the credit cost-effectiveness of BEVs, especially those with a driving range from 300 km to 500 km, is adjusted. The encouragement of BEVs with key range sections definitely amends the impacts of the NEV credit regulation and has a positive guiding effect on the development of BEVs.
After 2020, the effect of the subsidy is no longer obvious. From the perspective of technological development, the cancellation of the subsidy policy has a small impact on BEVs after 2020 and the focus of the policy should be on the perfection of the NEV credit regulation.
Therefore, from the perspective of the government, the policy can be developed in two major directions. First, it is important to determine whether to continuously implement the subsidy policy and the schedule should be issued ahead of time to provide enough time for manufacturers and consumers to prepare. The cost and range competence of BEVs should be assessed, and the influence should be considered if the benefit that accounts for approximately 20–50% of the manufacturing cost is removed. Second, the encouragement of the NEV credit regulation for BEVs with a driving range of 350 km should be eliminated, especially if the subsidy policy is canceled after 2020. The optimal driving range for different types of BEVs should be chosen by consumers. Additionally, a larger driving range is not always better because large batteries will also introduce unnecessary energy waste and environmental pollution.
For manufacturers, small vehicles with high driving ranges are preferred by the subsidy policy. Small BEVs currently obtain a higher relative benefit; therefore, the cancellation of the subsidy will have a strong influence on those vehicles. For the NEV credit regulation, in the short run, the midsize BEVs may be a good choice if credit is lacking because midsize BEVs can obtain the highest credit of 6. In the long run, small BEVs will consistently be the most cost-effective. Moreover, regardless of whether the subsidy policy will be implemented continuously after 2020, the investment in the battery technology and energy-saving technology of BEVs should still receive more attention because the subsidy will be quickly reduced.

5. Conclusions

With the phasing down of subsidies, China has launched the NEV credit regulation to continuously promote the penetration of NEVs, where the two policies will coexist through 2020 or even longer and definitely pose a dramatic impact on the development of the Chinese and even the global electric vehicle market. However, few studies have systematically investigated the relationship between these two policies as well as the synergistic impacts during the overlap period.
This paper focuses on China’s subsidy policy and NEV credit regulation in the next few years. To estimate the synergistic impacts of the two policies on the technological trends of BEVs, the rationales of China’s subsidy policy and NEV credit regulation are interpreted and a bottom-up model based on the most recent data from the Chinese market is established.
The results suggest that the subsidy policy still maintains strong support for the development of electric vehicles in China and for small vehicles whose driving ranges are higher than 300 km, subsidies even account for 40–50% of the manufacturing cost. Moreover, based on comparisons of different scenarios, we conclude that the two policies will complement each other in the transitional period and that small BEVs are preferred by both policies. Under the NEV credit regulation, small electric vehicles will be the most credit cost-effective and 350 km will consistently be the optimal driving range. With the addition of the subsidy, the credit cost-effectiveness of all high range vehicles will be improved and the disparities will be reduced, which amends the effects of the NEV credit regulation. The maximum credit cost-effectiveness in 2020 is 1.1156/¥10,000 and is obtained by the A00 BEV with a driving range of 300 km. However, from the perspective of technological development, the effect of the subsidy is no longer obvious after 2020 and the focus should be on the adjustment of the NEV credit regulation. Additionally, it is worth mentioning that a larger driving range is not always better because excessive batteries will also introduce unnecessary energy waste and environmental pollution.
Based on this study, several topics can be studied further. First, this study focuses on the synergistic impacts of subsidy policy and NEV credit regulation on the technical development of BEVs. Further investigation is needed considering the two policies’ impacts on other NEVs, i.e., PHEVs and FCVs. Second, the choices of consumers and the corresponding impacts should also be considered in future studies.

Author Contributions

K.C., F.Z. and Z.L. designed the whole study; K.C. conducted data collection, modeling, results analysis and wrote the paper; H.H. and Z.L. revised and edited the paper.

Funding

This study is supported by the National Natural Science Foundation of China (71403142, 71774100, 71690241) and the Ministry of Science and Technology of China (ZLY2015017).

Acknowledgments

The authors would like to thank the anonymous reviewers for their reviews and comments.

Conflicts of Interest

The authors declare no conflict of interest.

Abbreviations

AERAll-Electric Range
BEVBattery Electric Vehicle
CAFCCorporate Average Fuel Consumption
CAFECorporate Average Fuel Economy
CATCChina Automotive Test Cycle
EPAEnvironmental Protection Agency
EVElectric Vehicle
FCVFuel Cell Vehicle
ICEInternal Combustion Engine
MIITMinistry of Industry and Information Technology
MSRPManufacturer’s Suggested Retail Price
NEDCNew European Driving Cycle
NEVNew Energy Vehicle
NHTSANational Highway Traffic Safety Administration
OEMOriginal Equipment Manufacturer
PCPassenger Car
PEVPlug-in Electric Vehicle
PHEVPlug-in Hybrid Electric Vehicle
PMParticulate Matter
ZEVZero Emission Vehicle

References

  1. CAAM; CATARC; Toyota. Annual Report on Automotive Industry in China (2018); Social Sciences Academic Press: Beijing, China, 2018. [Google Scholar]
  2. Hao, H.; Geng, Y.; Wang, H.; Ouyang, M. Regional disparity of urban passenger transport associated GHG (greenhouse gas) emissions in China: A review. Energy 2014, 68, 783–793. [Google Scholar] [CrossRef]
  3. Wang, H.; Zhang, X.; Ouyang, M. Energy consumption of electric vehicles based on real-world driving patterns: A case study of Beijing. Appl. Energy 2015, 157, 710–719. [Google Scholar] [CrossRef]
  4. ETRI. Oil and Gas Industry Development Report at Home and Abroad in 2017; Petroleum Industry Press: Beijing, China, 2018. [Google Scholar]
  5. IEA. World Energy Outlook Special Report 2015: Energy and Climate Change. 2015. Available online: https://www.iea.org/publications/freepublications/publication/WEO2015SpecialReportonEnergyandClimateChange.pdf (accessed on 18 September 2018).
  6. Zhao, F.; Hao, H.; Liu, Z. Technology strategy to meet China’s 5 L/100 km fuel consumption target for passenger vehicles in 2020. Clean Technol. Environ. Policy 2016, 18, 7–15. [Google Scholar] [CrossRef]
  7. Chen, L.; Zhang, H.; Guo, Y. Estimating the economic cost of emission reduction in Chinese vehicle industry based on multi-objective programing. Clean Technol. Environ. Policy 2013, 15, 727–734. [Google Scholar] [CrossRef]
  8. De Schepper, E.; Van Passel, S.; Lizin, S.; Achten, W.M.; Van Acker, K. Cost-efficient emission abatement of energy and transportation technologies: Mitigation costs and policy impacts for Belgium. Clean Technol. Environ. Policy 2014, 16, 1107–1118. [Google Scholar] [CrossRef]
  9. CAAM. Press Conference. 2018. Available online: http://nev.ofweek.com/2018-01/ART-71008-12008-30188460.html (accessed on 15 February 2018).
  10. State Council. Industry Development Plan of Energy Saving and New Energy Vehicles 2012–2020. 2012. Available online: http://www.gov.cn/zhengce/content/2012-07/09/content_3635.htm (accessed on 15 February 2018).
  11. MIIT. Technology Roadmap for Energy Saving and New Energy Vehicles; China Machine Press: Beijing, China, 2016. [Google Scholar]
  12. Zhou, Y.; Wang, M.; Hao, H.; Johnson, L.; Wang, H. Plug-in electric vehicle market penetration and incentives: A global review. Mitig. Adapt. Strateg. Glob. Chang. 2015, 20, 777–795. [Google Scholar] [CrossRef]
  13. Hao, H.; Ou, X.; Du, J.; Wang, H.; Ouyang, M. China’s electric vehicle subsidy scheme: Rationale and impacts. Energy Policy 2014, 73, 722–732. [Google Scholar] [CrossRef]
  14. MIIT. The Parallel Scheme of Corporate Average Fuel Consumption of the Passenger Car and New Energy Vehicle Credits. 2017. Available online: http://www.miit.gov.cn/n1146290/n4388791/c5826378/content.html (accessed on 15 February 2018).
  15. Wang, Y.; Zhao, F.; Yuan, Y.; Hao, H.; Liu, Z. Analysis of Typical Automakers’ Strategies for Meeting the Dual-Credit Regulations Regarding CAFC and NEVs. Automot. Innov. 2018, 1, 15–23. [Google Scholar] [CrossRef] [Green Version]
  16. Internal Revenue Service. Plug-In Electric Drive Vehicle Credit. Available online: http://www.irs.gov/Businesses/Plug-In-Electric-Vehicle-Credit-%28IRC-30-and-IRC-30D%29 (accessed on 18 September 2018).
  17. ACEA. ACEA Tax Guide; ACEA: Brussels, Belgium, 2015. [Google Scholar]
  18. JAMA. Fact Sheet—Japanese Government Incentives for the Purchase of Environmentally Friendly Vehicles; Japan Automobile Manufacturers Association: Tokyo, Japan, 2010. [Google Scholar]
  19. China Automotive Technology & Research Center. Development Report on New Energy Vehicle Industry of China; Social Sciences Academic Press: Beijing, China, 2016. [Google Scholar]
  20. Hardman, S.; Chandan, A.; Tal, G.; Turrentine, T. The effectiveness of financial purchase incentives for battery electric vehicles–A review of the evidence. Renew. Sustain. Energy Rev. 2017, 80, 1100–1111. [Google Scholar] [CrossRef]
  21. Hall, D.; Moultak, M.; Lutsey, N. Electric Vehicle Capitals of the World: Demonstrating the Path to Electric Drive; International Council on Clean Transportation: Washington, DC, USA, 2017. [Google Scholar]
  22. Shafiei, E.; Davidsdottir, B.; Fazeli, R.; Leaver, J.; Stefansson, H.; Asgeirsson, E.I. Macroeconomic effects of fiscal incentives to promote electric vehicles in Iceland: Implications for government and consumer costs. Energy Policy 2018, 114, 431–443. [Google Scholar] [CrossRef]
  23. Sen, B.; Noori, M.; Tatari, O. Will Corporate Average Fuel Economy (CAFE) Standard help? Modeling CAFE’s impact on market share of electric vehicles. Energy Policy 2017, 109, 279–287. [Google Scholar] [CrossRef]
  24. Palmer, K.; Tate, J.E.; Wadud, Z.; Nellthorp, J. Total cost of ownership and market share for hybrid and electric vehicles in the UK, US and Japan. Appl. Energy 2018, 209, 108–119. [Google Scholar] [CrossRef]
  25. Lévay, P.Z.; Drossinos, Y.; Thiel, C. The effect of fiscal incentives on market penetration of electric vehicles: A pairwise comparison of total cost of ownership. Energy Policy 2017, 105, 524–533. [Google Scholar] [CrossRef]
  26. Harvey, L.D. Cost and energy performance of advanced light duty vehicles: Implications for standards and subsidies. Energy Policy 2018, 114, 1–12. [Google Scholar] [CrossRef]
  27. California Air Resource Board (CARB). Zero-Emission Vehicle Legal and Regulatory Activities and Background. 2014. Available online: https://www.arb.ca.gov/msprog/zevprog/zevregs/zevregs.htm (accessed on 18 September 2018).
  28. CARB. Zero Emission Vehicle Credits. 2015. Available online: https://www.arb.ca.gov/msprog/zevprog/zevcredits/2015zevcredits.htm (accessed on 18 September 2018).
  29. China EV100. Tracking and Evaluation of Major New Energy Vehicle Market Policies in the World; China EV100 Forum: Beijing, China, 2016. [Google Scholar]
  30. CARB. California exhaust emission standards and test procedures for 2009 through 2017 model zero-emission vehicles and hybrid electric vehicles, in the passenger car, light-duty truck and medium-duty vehicle classes. 2012. Available online: https://www.arb.ca.gov/regact/2012/zev2012/zevpt2.pdf (accessed on 18 September 2018).
  31. Sierzchula, W.; Nemet, G. Using patents and prototypes for preliminary evaluation of technology-forcing policies: Lessons from California’s Zero Emission Vehicle regulations. Technol. Forecast. Soc. Chang. 2015, 100, 213–224. [Google Scholar] [CrossRef]
  32. CARB. 2015 Zero Emission Vehicle Credits. 2016. Available online: https://www.arb.ca.gov/msprog/zevprog/zevcredits/2015zevcredits.htm (accessed on 18 September 2018).
  33. CARB. California Exhaust Emission Standards and Test Procedures for 2018 and Subsequent Model Zero-Emission Vehicles and Hybrid Electric Vehicles, in the Passenger Car, Light-Duty Truck and Medium-Duty Vehicle Classes. 2012. Available online: https://www.arb.ca.gov/msprog/levprog/cleandoc/2018+%20my%20hevtps_clean%20complete_12-12.pdf (accessed on 18 September 2018).
  34. Greene, D.L.; Park, S.; Liu, C. Public policy and the transition to electric drive vehicles in the US: The role of the zero emission vehicles mandates. Energy Strat. Rev. 2014, 5, 66–77. [Google Scholar] [CrossRef]
  35. Wesseling, J.H.; Farla, J.C.M.; Hekkert, M.P. Exploring car manufacturers’ responses to technology-forcing regulation: The case of California’s ZEV mandate. Environ. Innov. Soc. Trans. 2015, 16, 87–105. [Google Scholar] [CrossRef]
  36. Leard, B.; McConnell, V. New Markets for Pollution and Energy Efficiency: Credit Trading under Automobile Greenhouse Gas and Fuel Economy Standards. 2015. Available online: https://ssrn.com/abstract=2622698 (accessed on 18 September 2018).
  37. Murray, B.C.; Newell, R.G.; Pizer, W.A. Balancing cost and emissions certainty: An allowance reserve for cap-and-trade. Rev. Environ. Econ. Policy 2009, 3, 84–103. [Google Scholar] [CrossRef]
  38. Liu, Z.; Liu, F.; Wang, Y.; Hao, H.; Zhao, F. Integrated Study and Combined Policy Suggestions on CAFC, NEV and Carbon Credits. Chin. J. Automot. Eng. 2017, 1, 1–9. (In Chinese) [Google Scholar]
  39. Zou, Y.; Chen, C.; Su, H. Development and Application of the Corporate Compliance Calculation Model in CAFC and NEV Credit Management. Auto Eng. 2017, 11, 50–53. [Google Scholar]
  40. Ou, S.; Lin, Z.; Qi, L.; Li, J.; He, X.; Przesmitzki, S. The dual-credit policy: Quantifying the policy impact on plug-in electric vehicle sales and industry profits in China. Energy Policy 2018, 121, 597–610. [Google Scholar] [CrossRef]
  41. Ministry of Finance (MOF) and Ministry of Science & Technology (MOST). Notice about the demonstration work of promoting energy efficient and new energy vehicles. 2009. Available online: http://www.most.gov.cn/fggw/zfwj/zfwj2009/200902/t20090224_67588.htm (accessed on 18 September 2018).
  42. Ministry of Finance (MOF) and Ministry of Science & Technology (MOST). Notice on pilot implementation of subsidies on privately purchasing new energy vehicles. 2010. Available online: http://www.miit.gov.cn/n1146295/n1146592/n3917132/n4061919/n4061921/n4061926/n4061927/c4173089/content.html (accessed on 18 September 2018).
  43. Ministry of Finance (MOF) and Ministry of Science & Technology (MOST). Notice on further promoting the adoption of new energy vehicles. 2013. Available online: http://www.gov.cn/zwgk/2013-09/17/content_2490108.htm (accessed on 18 September 2018).
  44. Ministry of Finance (MOF) and Ministry of Science & Technology (MOST). Notice on further enhancement of promoting the adoption of new energy vehicles. 2014. Available online: http://www.gov.cn/gzdt/2014-02/08/content_2581804.htm (accessed on 18 September 2018).
  45. Ministry of Finance (MOF) and Ministry of Science & Technology (MOST). Notice on fiscal policies of promoting the adoption of new energy vehicles during year 2016 to 2020. 2015. Available online: http://jjs.mof.gov.cn/zhengwuxinxi/zhengcefagui/201504/t20150429_1224515.html (accessed on 18 September 2018).
  46. Ministry of Finance (MOF) and Ministry of Science & Technology (MOST). Notice on adjusting and improving the financial subsidy policy for the promotion and application of new energy vehicles. 2016. Available online: http://jjs.mof.gov.cn/zhengwuxinxi/tongzhigonggao/201612/t20161229_2508628.html (accessed on 18 September 2018).
  47. MOF; MIIT; MOST; NDRC. Notice on adjusting and improving the financial subsidy policy for the promotion and application of new energy vehicles. 2018. Available online: http://jjs.mof.gov.cn/zhengwuxinxi/zhengcefagui/201802/t20180213_2815574.html (accessed on 18 September 2018).
  48. MIIT. Subsidies for New Energy Vehicles will Phase Down after 2020. 2018. Available online: http://www.xinhuanet.com/auto/2018-01/20/c_1122289000.htm (accessed on 18 September 2018).
  49. MIIT. New Energy Vehicles Exempted from Vehicle Purchase Tax: 10th–15th Batches. 2017. Available online: http://www.miit.gov.cn/n1146285/n1146352/n3054355/n3057585/n3057592/c5965520/content.html (accessed on 18 September 2018).
  50. MIIT. Manufacturers and Products of Road Motor Vehicle: 1st–12th batches in 2017. 2017. Available online: http://www.miit.gov.cn/n1146285/n1146352/n3054355/n3057585/n3057592/c5996875/content.html (accessed on 18 September 2018).
  51. Zhao, F.; Chen, K.; Hao, H.; Wang, S.; Liu, Z. Technology development for electric vehicles under new energy vehicle credit regulation in China: scenarios through 2030. Clean Technol. Environ. Policy 2018, 1–15. [Google Scholar] [CrossRef]
  52. MIIT, SAE-China. The technology roadmap for energy-saving and new energy vehicles. 2016. Available online: https://www.sohu.com/a/117879979_386926 (accessed on 18 September 2018).
  53. International Energy Agency (IEA). Global EV Outlook 2017; IEA: Paris France, 2017. [Google Scholar]
  54. Nykvist, B.; Nilsson, M. Rapidly falling costs of battery packs for electric vehicles. Nat. Clim. Chang. 2015, 5, 329–332. [Google Scholar] [CrossRef] [Green Version]
  55. EPA; NHTSA. Draft Technical Assessment Report: Midterm Evaluation of Light-Duty Vehicle Greenhouse Gas Emission Standards and Corporate Average Fuel Economy Standards for Model Years 2022-2025; U.S. EPA, NHTSA: Washington, DC, USA, 2016.
  56. International Council on Clean Transportation (ICCT). Passenger Car Fuel-Efficiency, 2020-2025 Comparing Stringency and Technology Feasibility of the Chinese and US Standards; ICCT: Washington, DC, USA, 2013. [Google Scholar]
  57. EPA; NHTSA. Joint Technical Support Document: Final Rulemaking for 2017-2025 Light-Duty Vehicle Greenhouse Gas Emission Standards and Corporate Average Fuel Economy Standards; U.S. EPA, NHTSA: Washington, DC, USA, 2012.
  58. Liu, Z.; Zhao, F. Insights on Automotive Industry; China Machine Press: Beijing, China, 2017; Volume 1. [Google Scholar]
  59. Liu, Z.; Hao, H.; Cheng, X.; Zhao, F. Critical issues of energy efficient and new energy vehicles development in China. Energy Policy 2018, 115, 92–97. [Google Scholar] [CrossRef]
Figure 1. The development and prediction of the subsidy scheme in China. Notes. (1) The subsidies in 2019, 2020, and 2025 are all predicted based on the historical plan from 2016–2018. (2) In order to fully evaluate the substitution effect, two scenarios with and without subsidies are constructed in 2025.
Energies 11 03193 g001
Figure 2. The accounting framework of the bottom-up model.
Energies 11 03193 g002
Figure 3. The electricity consumption rate and the multiplier β in China’s subsidy scheme. Notes. (1) The blue points are BEVs in the Chinese market. The red line represents the average electricity consumption rate in 2017. (2) The market is divided into four regions by three boundaries and the vehicles in each region receive a certain subsidy multiplier, i.e., 0, 0.5, 1, or 1.1, as indicated in Equation (1).
Energies 11 03193 g003
Figure 4. The electricity consumption rate and the multiplier γ in the NEV credit regulation. Notes. (1) The market is divided into three regions by the green and blue boundaries, and the vehicles in each region receive a certain credit multiplier, i.e., 0.5, 1, or 1.2, as indicated in Equation (5).
Energies 11 03193 g004
Figure 5. (ac) The contribution rate of subsidy in 2018, 2020, and 2025.
Energies 11 03193 g005aEnergies 11 03193 g005b
Figure 6. (ac) The credit cost-effectiveness under NEV credit regulation in 2018, 2020, and 2025.
Energies 11 03193 g006aEnergies 11 03193 g006b
Figure 7. (ac) The credit cost-effectiveness under two policies in 2018, 2020, and 2025.
Energies 11 03193 g007
Table 1. The incremental energy-saving technology costs for different BEVs.
ClassGlider Weight (kg)Technology Cost per % Electricity Consumption Improvement (yuan/%)Incremental Technology Cost in 2020 (2017¥)Incremental Technology Cost in 2025 (2017¥)
A008004483897.69676.8
A01000480417610368
A12005124454.411,059.2
B16005765011.212,441.6
C18006085289.613,132.8
D2000640556813824

