
Large-Scale Oil Palm Trees Detection from High-Resolution Remote Sensing Images Using Deep Learning

Abstract
:1. Introduction
2. Materials and Methods
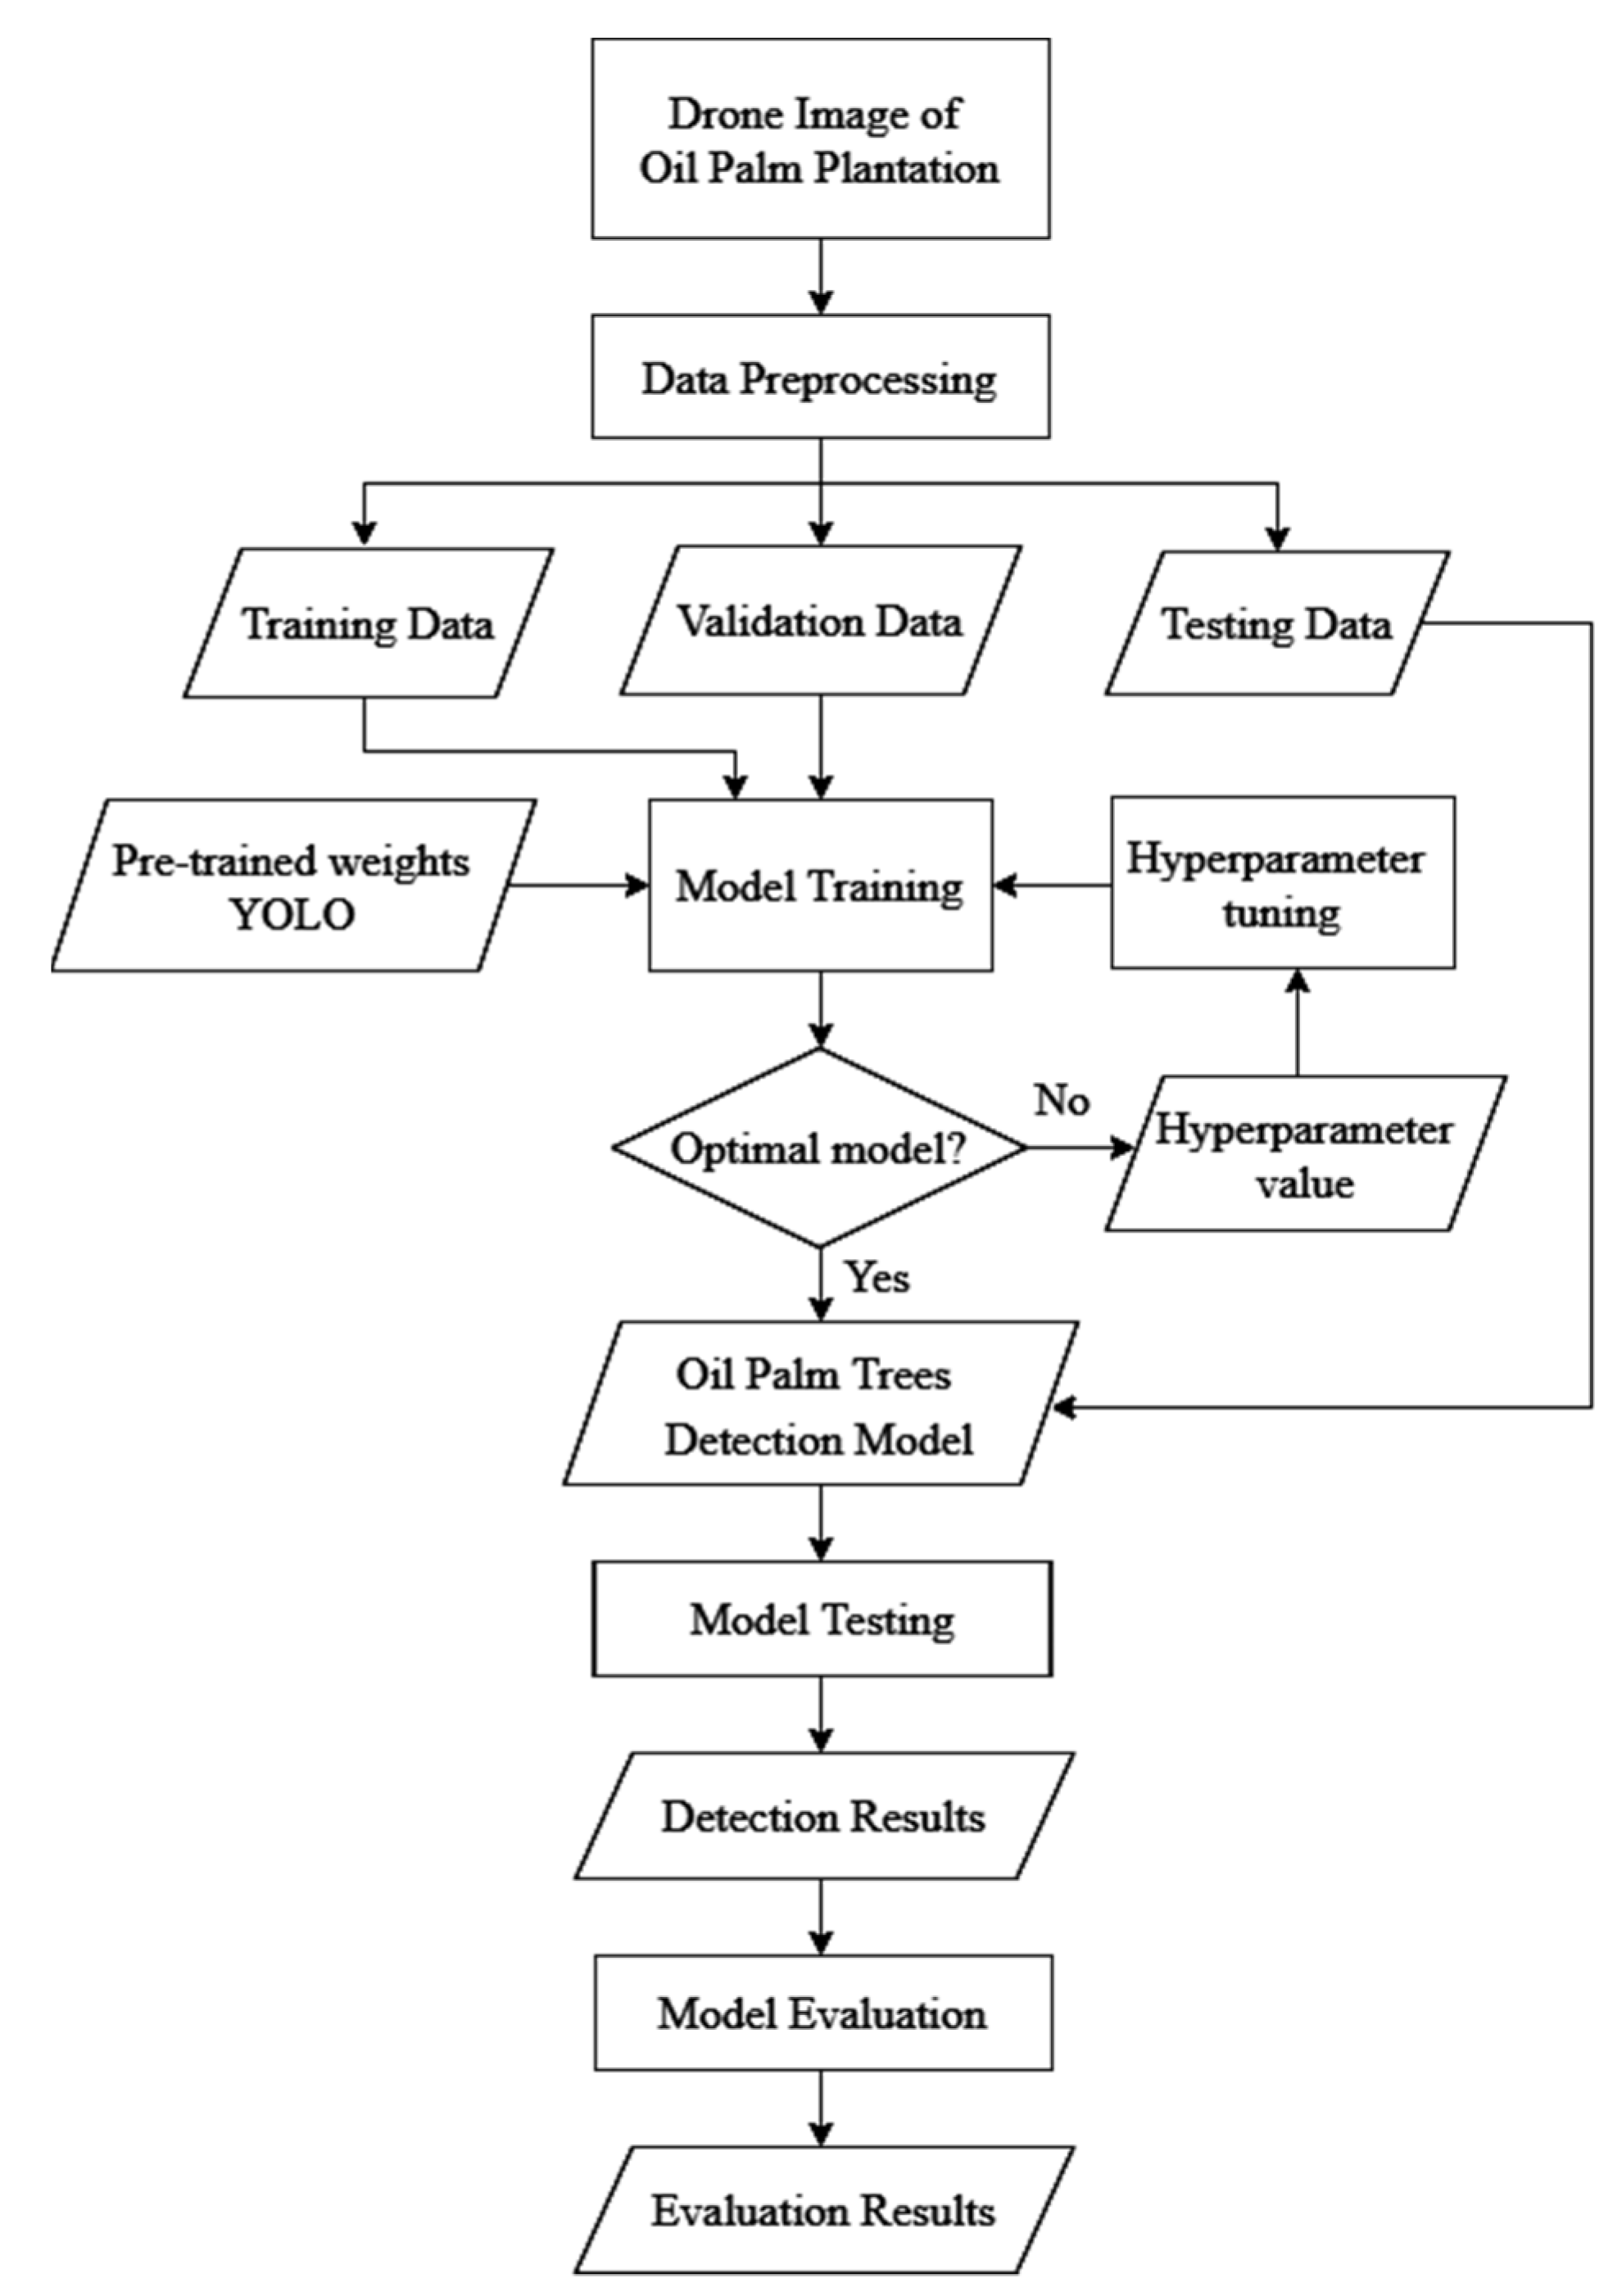
2.1. Overview
2.2. Study Area and Datasets
2.3. Data Preprocessing
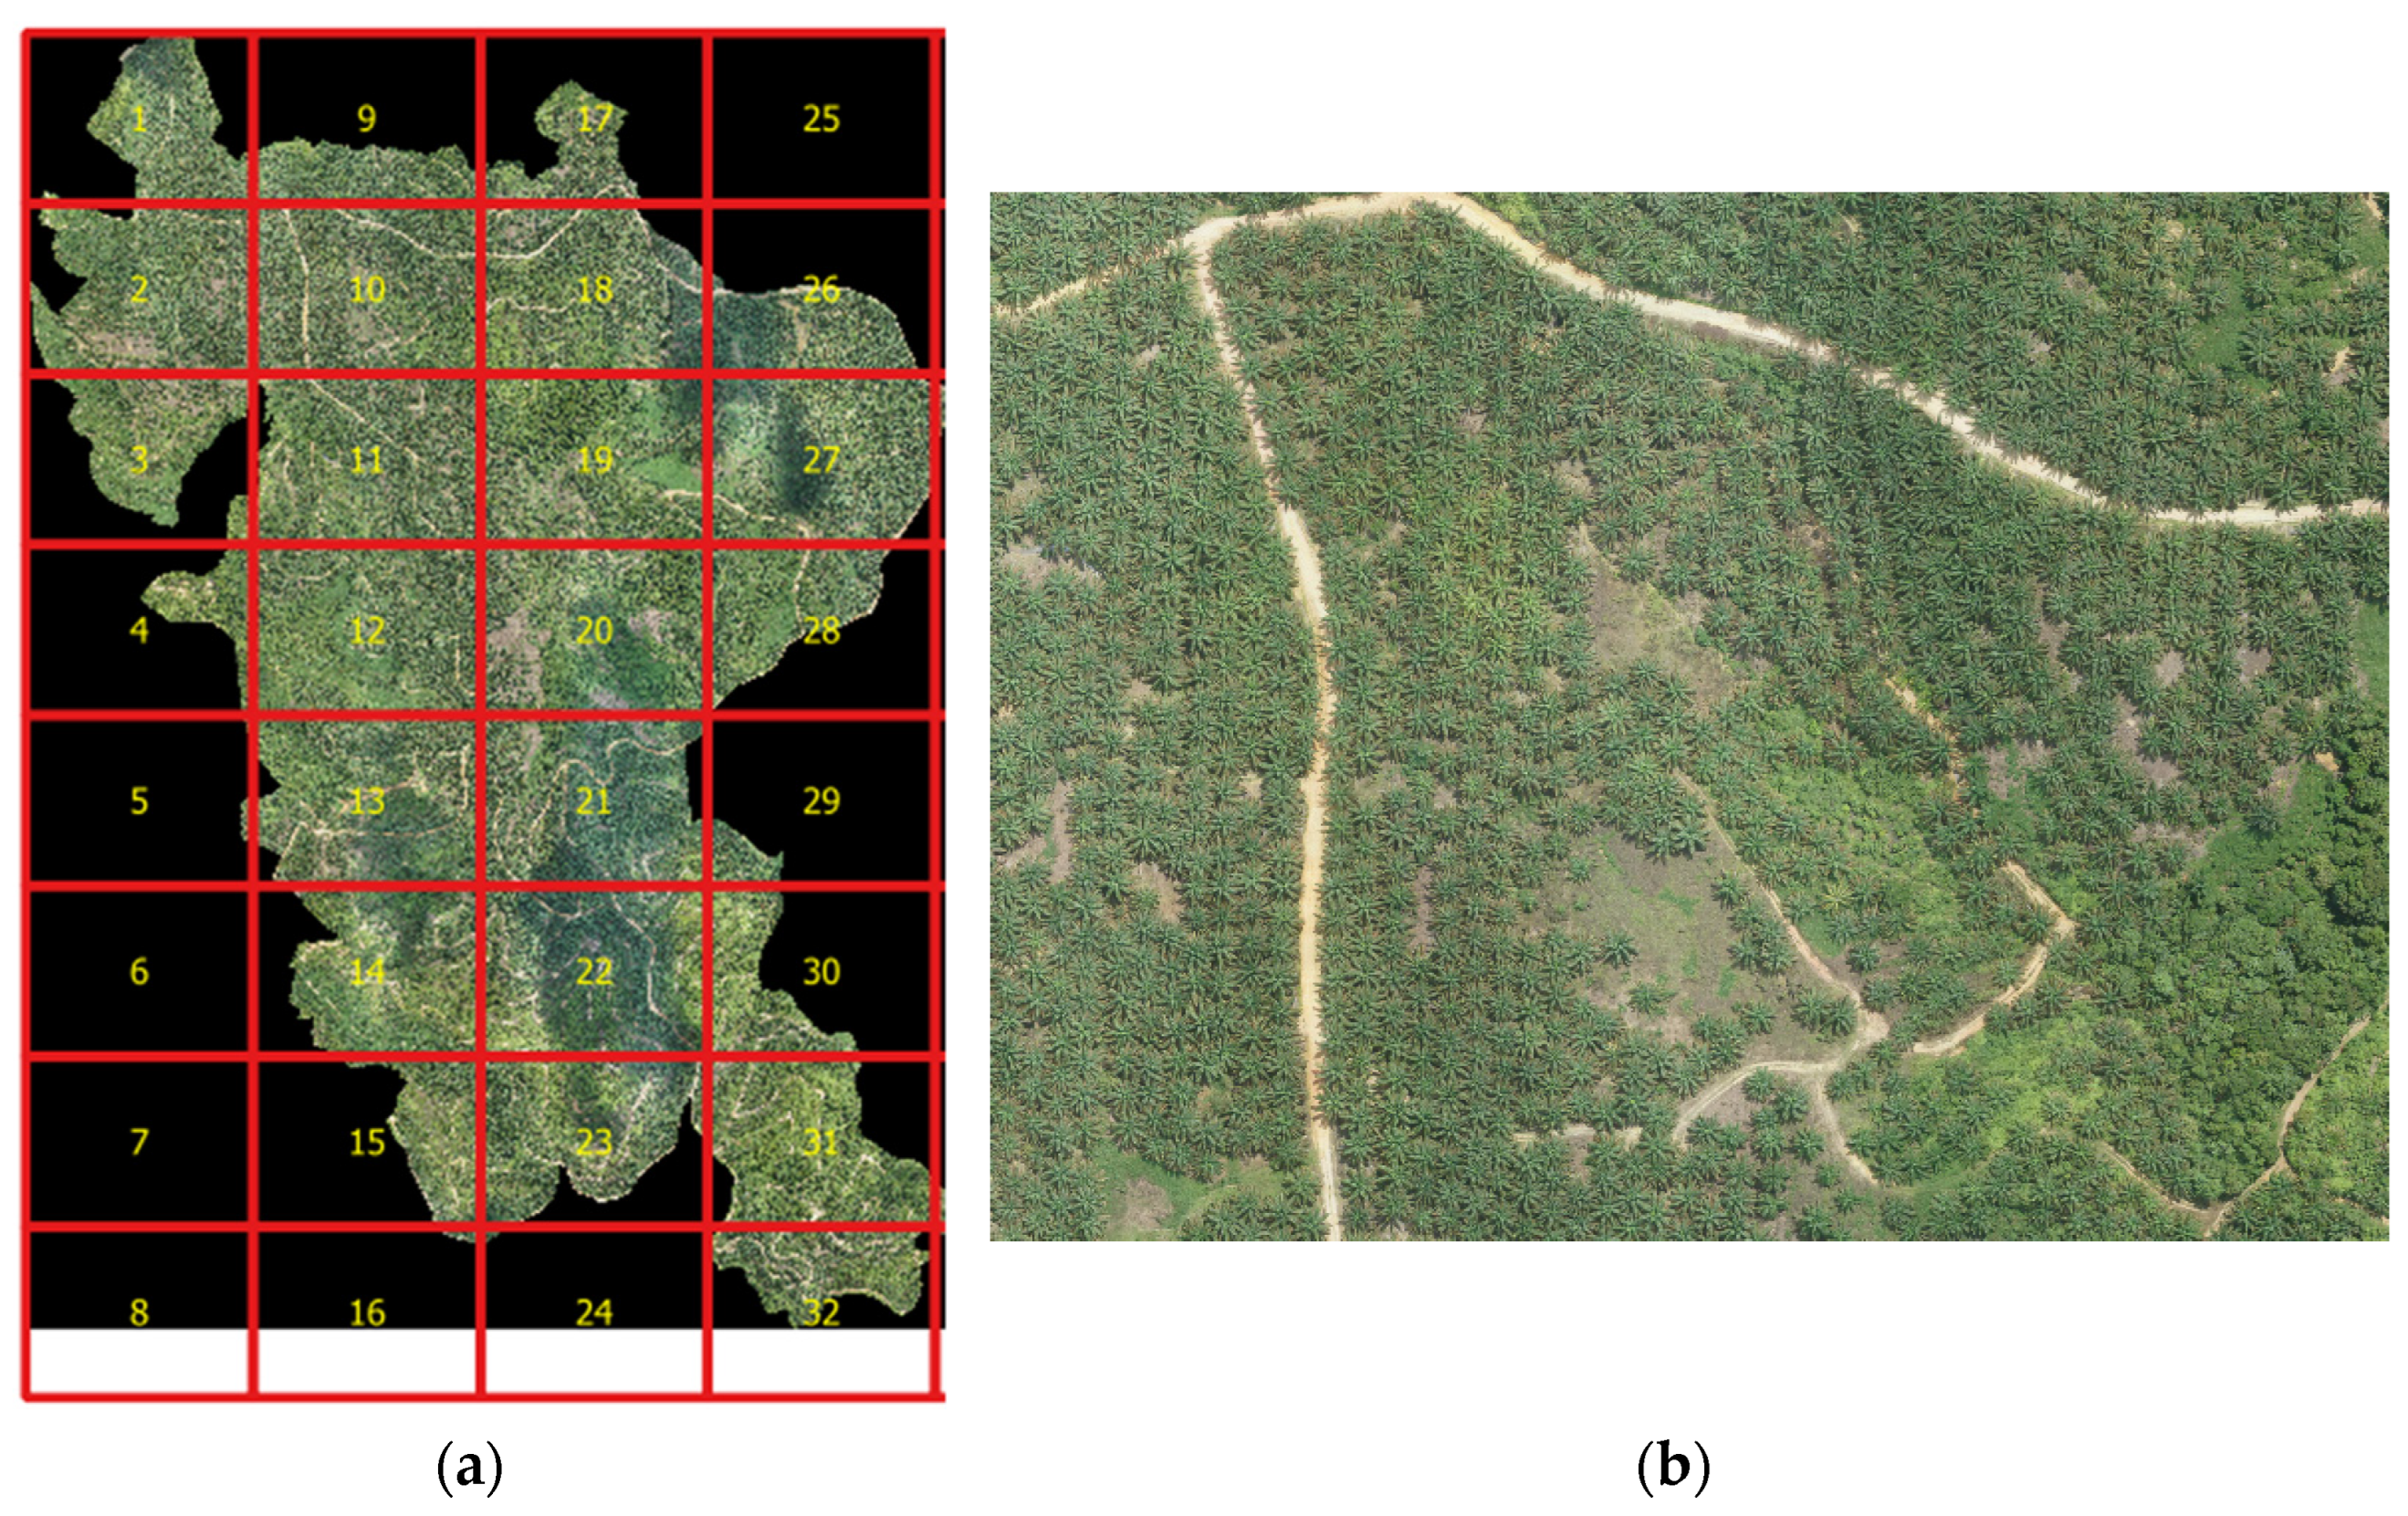
- Cropping the drone images for the training (311 images) and validation (66 images) datasets into grids with a size of 3943 × 3943 pixels, which corresponds to 200 m × 200 m (4 ha) using QGIS. An example of the image can be seen in Figure 4.
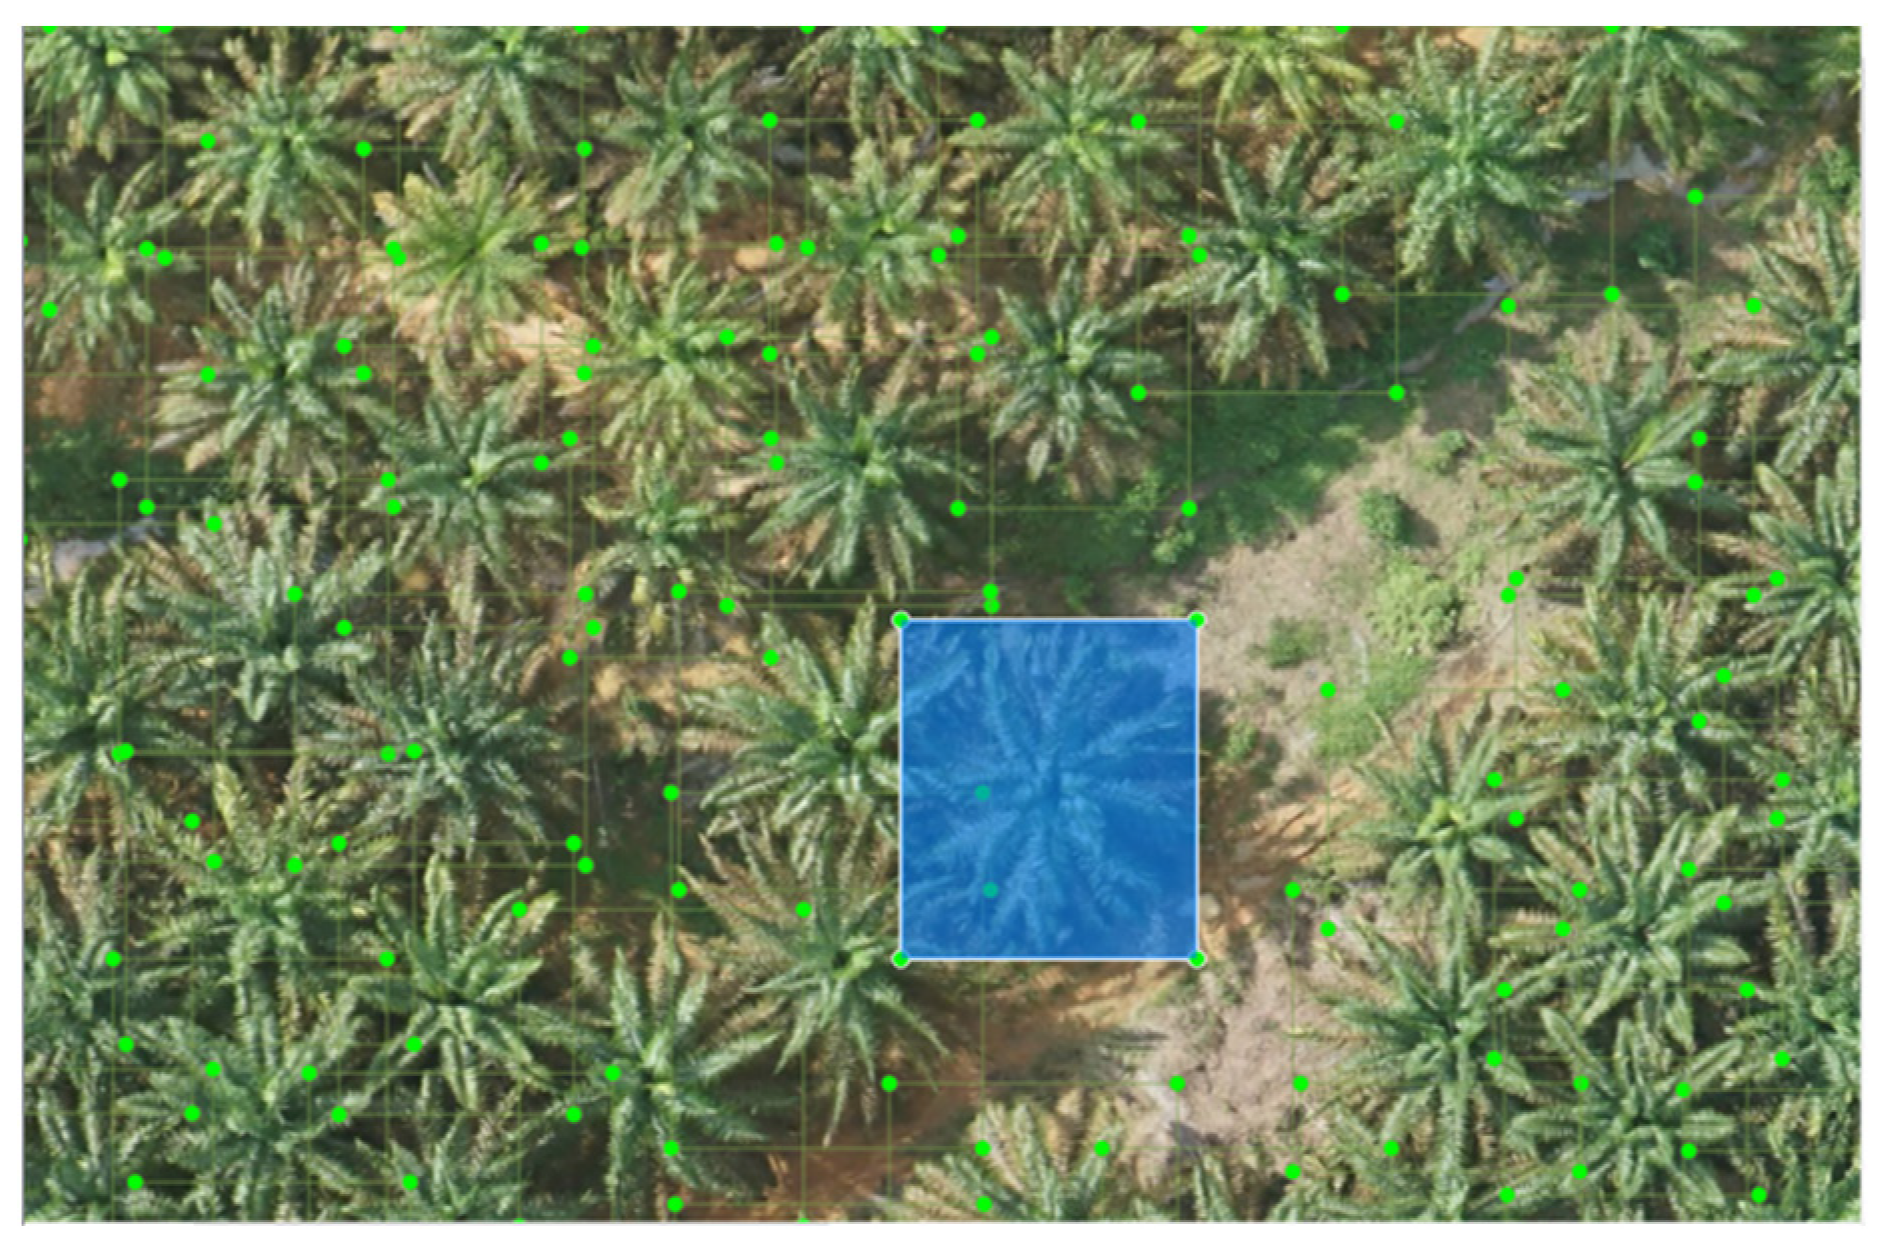
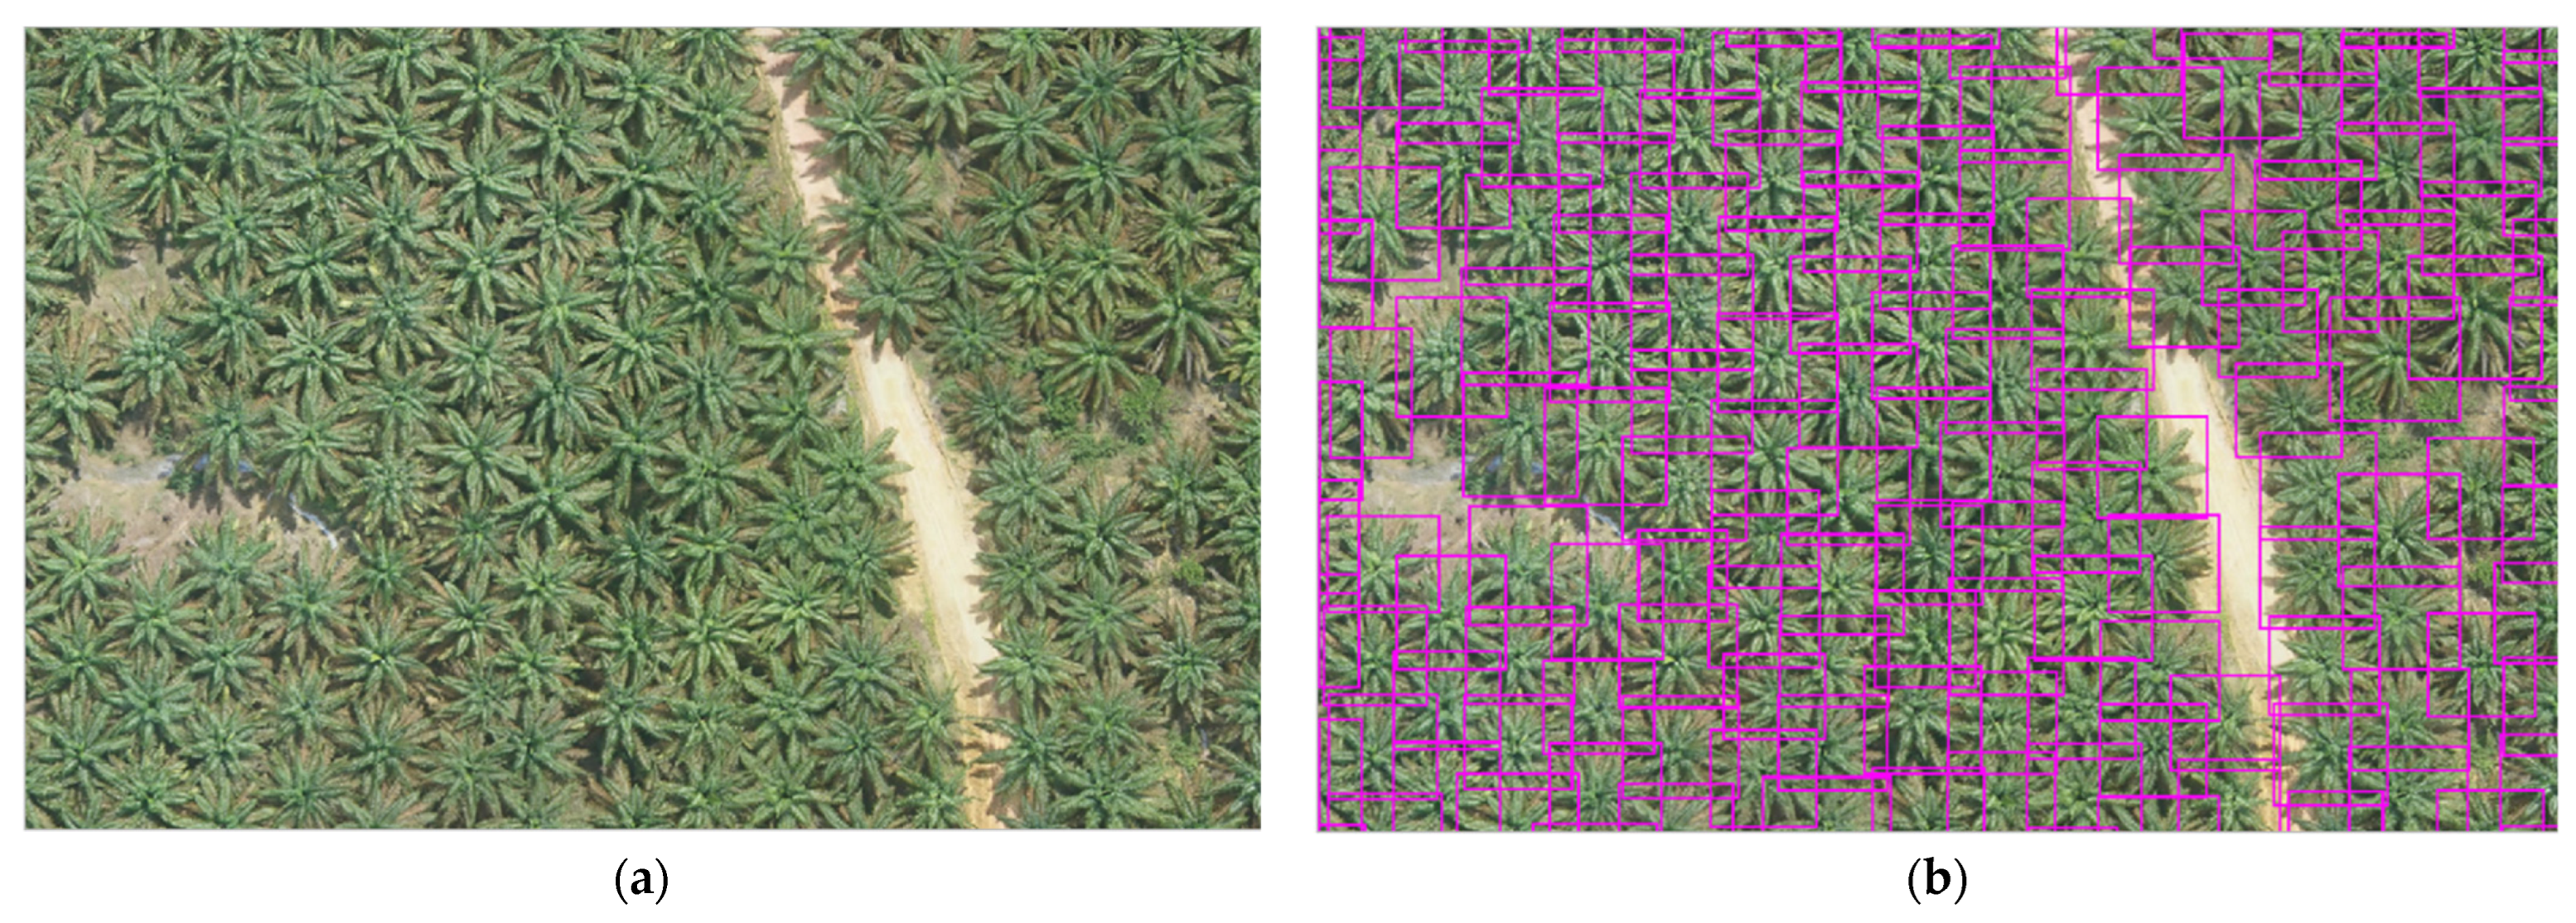
- Manually identifying and labeling 56,614 oil palm trees in the training and validation datasets using LabelImg. The composition of the training data is 80% (45,290), and that of the validation data is 20% (11,324). An example of image labeling can be seen in Figure 5.
- Cropping 24 drone images on the testing data block into grids with an image size of 7886 × 5914 pixels, which corresponds to 400 m × 300 m (12 ha) using QGIS. An example of the image can be seen in Figure 6.
2.4. Model Development
2.5. Evaluation Metrics

3. Results
3.1. Training Results
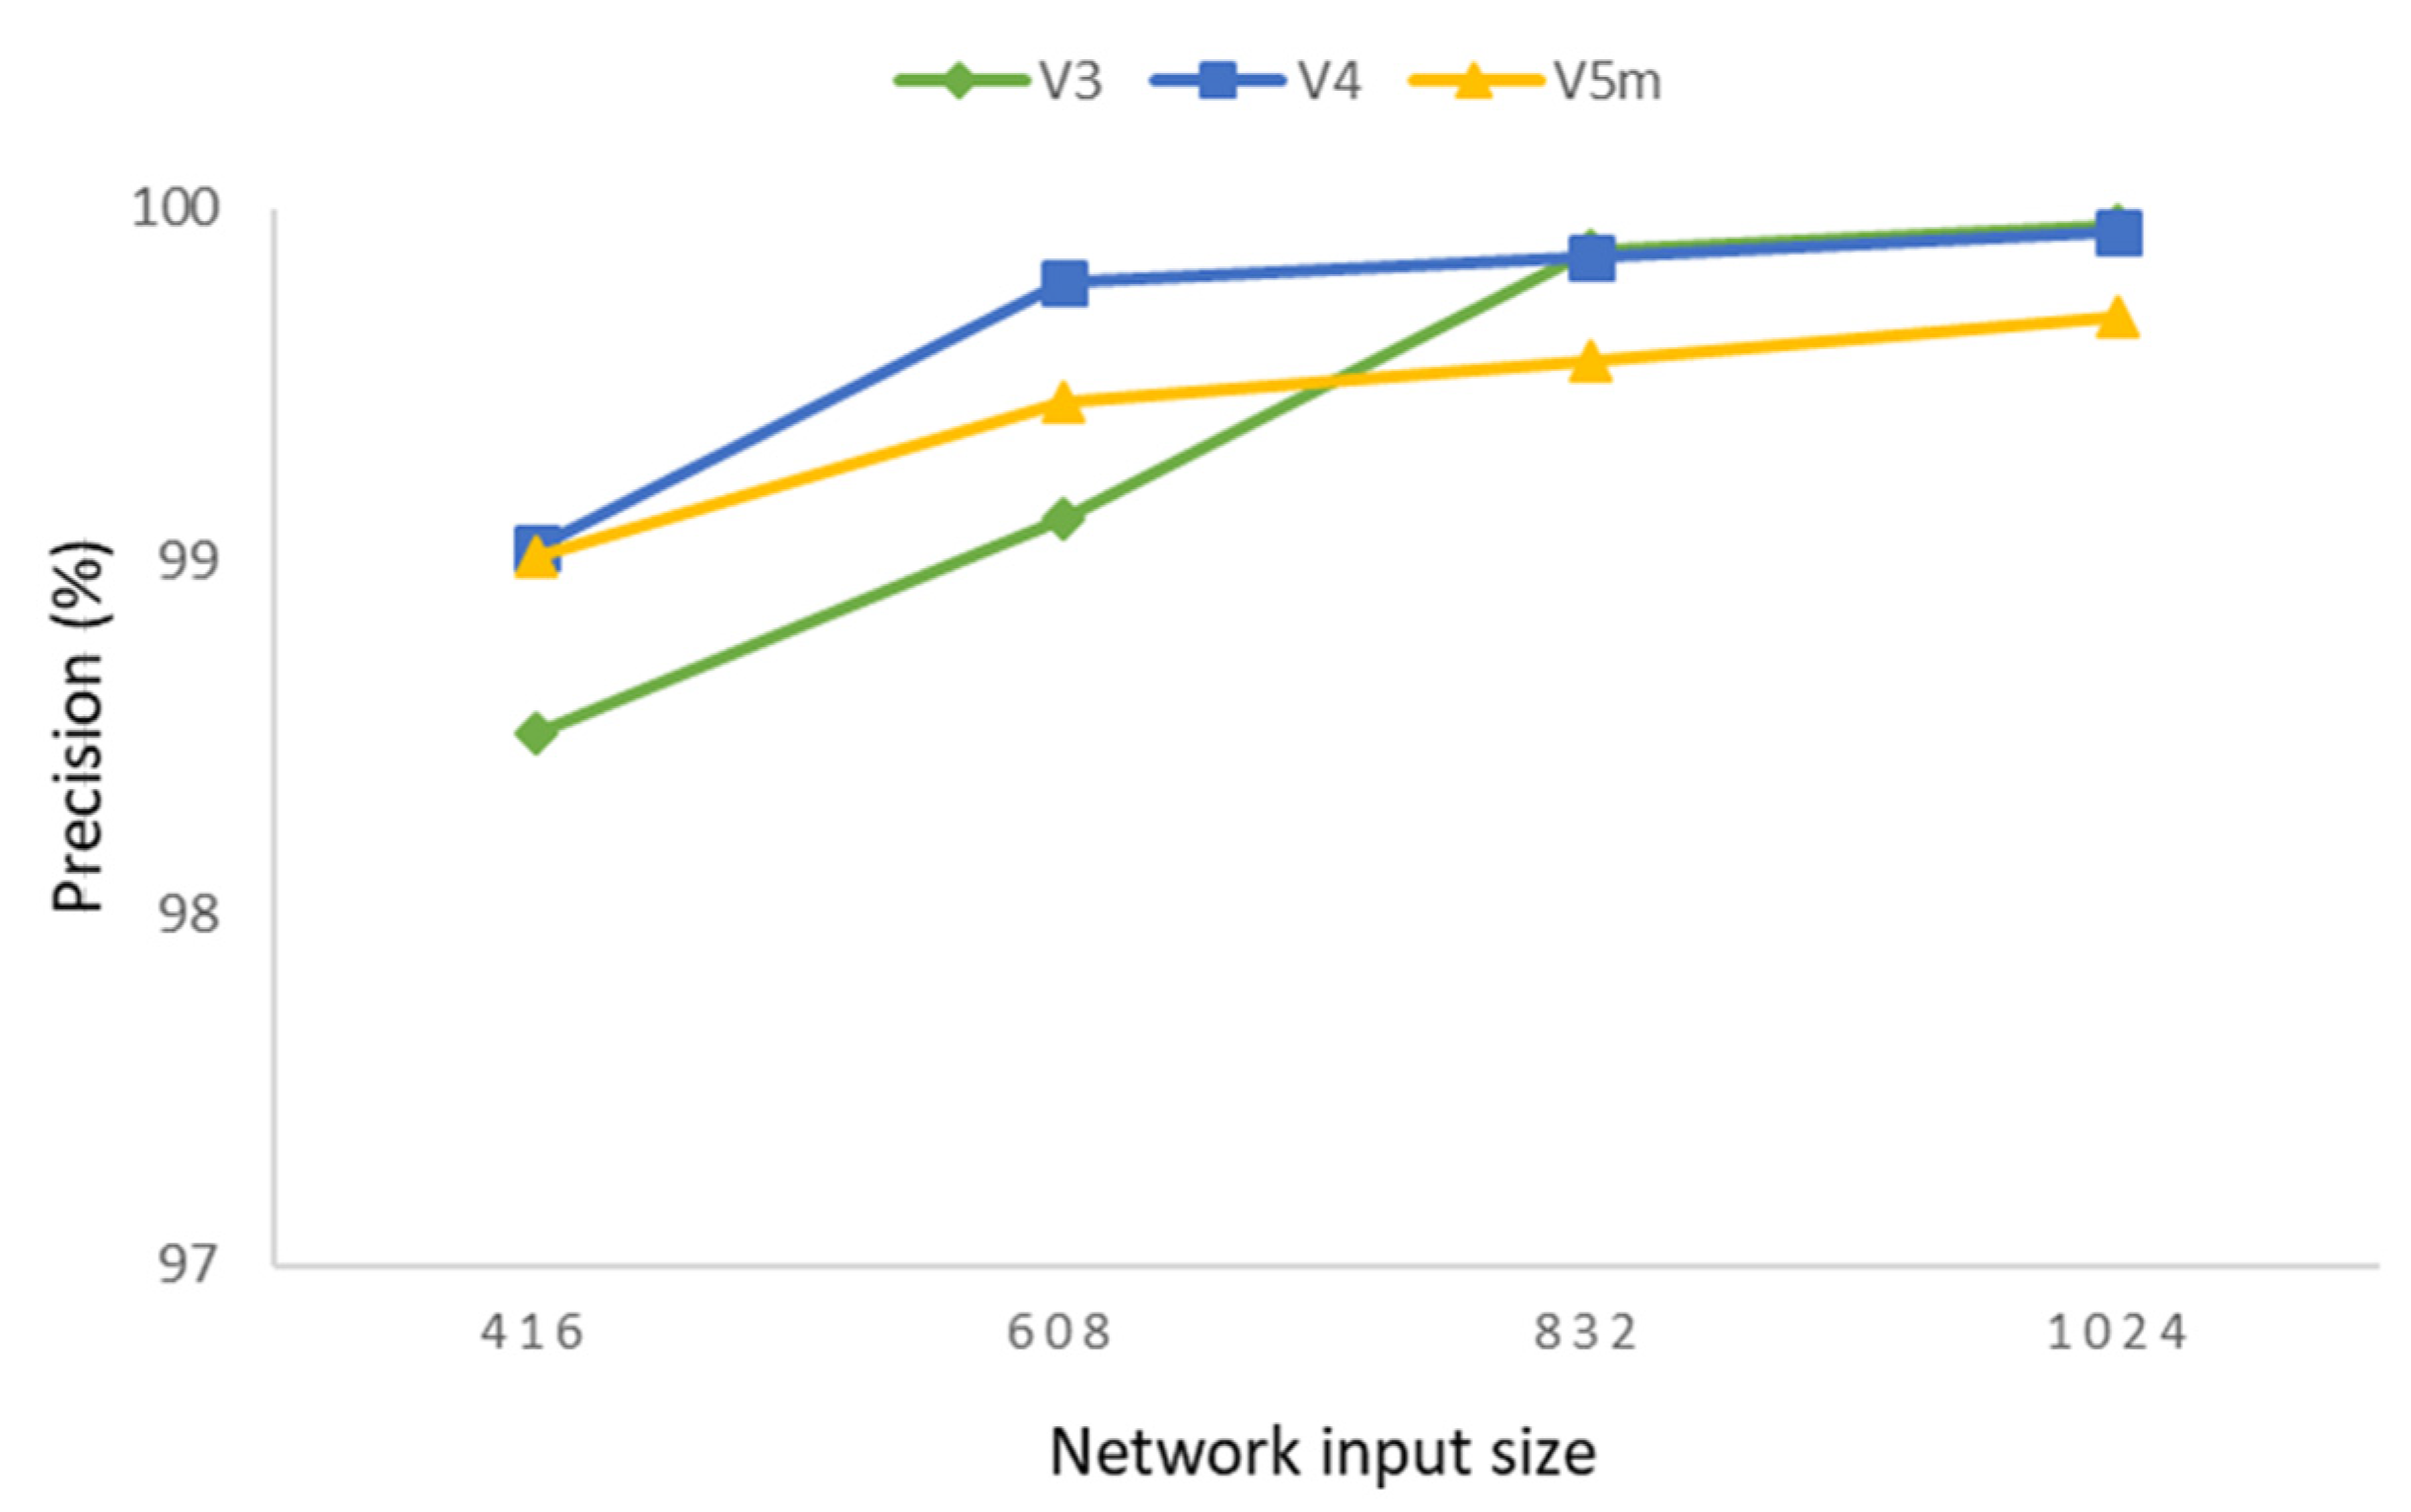
3.2. Testing Results
4. Discussion
5. Conclusions
Supplementary Materials
Author Contributions
Funding
Institutional Review Board Statement
Informed Consent Statement
Data Availability Statement
Acknowledgments
Conflicts of Interest
References
- Global Oilseed Demand Growth Forecast to Outpace Production. Available online: https://apps.fas.usda.gov/PSDOnline/CircularDownloader.ashx?year=2017&month=05&commodity=Oilseeds (accessed on 23 September 2021).
- Consumption of Vegetable Oils Worldwide from 2013/14 to 2021/2022, by Oil Type. Available online: https://www.statista.com/statistics/263937/vegetable-oils-global-consumptions (accessed on 23 June 2022).
- Voora, V.; Larrea, C.; Bermudez, S.; Baliño, S. Global Market Report: Palm Oil; International Institute for Sustainable Development: Manitoba, Canada, 2019; p. 16. Available online: https://www.iisd.org/publications/global-market-report-palm-oil (accessed on 27 July 2021).
- Chong, K.L.; Kanniah, K.D.; Pohl, C.; Tan, K.P. A review of remote sensing applications for oil palm studies. Geo-Spat. Inf. Sci. 2017, 20, 184–200. [Google Scholar] [CrossRef]
- Yin, N.; Liu, R.; Zeng, B.; Liu, N. A review: UAV-based Remote Sensing. In Proceedings of the IOP Conference Series: Materials Science and Engineering, Kazimierz Dolny, Poland, 21–23 November 2019; p. 490. [Google Scholar] [CrossRef]
- Kattenborn, T.; Sperlich, M.; Bataua, K.; Koch, B. Automatic single palm tree detection in plantations using UAV-based photogrammetric point clouds. Int. Arch. Photogramm. Remote Sens. Spat. Inf. Sci.-ISPRS Arch. 2014, 40, 139–144. [Google Scholar] [CrossRef]
- Rizky, A.P.P.; Liyantono; Solahudin, M. Analysis of aerial photo for estimating tree numbers in oil palm plantation. In Proceedings of the IOP Conference Series: Earth and Environmental Science, Moscow, Russia, 27 May–6 June 2019; p. 284. [Google Scholar] [CrossRef]
- Chen, Z.Y.; Liao, I.Y. Improved Fast R-CNN with Fusion of Optical and 3D Data for Robust Palm Tree Detection in High Resolution UAV Images. Int. J. Mach. Learn. Comput. 2020, 10, 122–127. [Google Scholar] [CrossRef]
- Jupriyanto; Bura, R.O.; Apriyani, S.W.; Ariwibawa, K.; Adharian, E. UAV application for oil palm harvest prediction. J. Phys. Conf. Ser. 2018, 1130, 012001. [Google Scholar] [CrossRef]
- Suyuthi, M.; Seminar, K.; Sudradjat. Estimation of Calcium, Magnesium and Sulfur Content in Oil Palm using Multispectral Imagery based UAV. In Proceedings of the 2nd SEAFAST International Seminar, Bogor, Indonesia, 4–5 September 2019; pp. 127–134. [Google Scholar] [CrossRef]
- Nur Anisa, M.; Rokhmatuloh; Hernina, R. UAV application to estimate oil palm trees health using Visible Atmospherically Resistant Index (VARI) (Case study of Cikabayan Research Farm, Bogor City). In Proceedings of the E3S Web of Conferences, Kenitra, Morocco, 25–27 December 2020; Volume 211, pp. 1–7. [Google Scholar] [CrossRef]
- Shafri, H.Z.M.; Hamdan, N.; Saripan, M.I. Semi-automatic detection and counting of oil palm trees from high spatial resolution airborne imagery. Int. J. Remote Sens. 2011, 32, 2095–2115. [Google Scholar] [CrossRef]
- Syed Hanapi, S.N.H.; Shukor, S.A.A.; Johari, J. A Review on Remote Sensing-based Method for Tree Detection and Delineation. In Proceedings of the IOP Conference Series: Materials Science and Engineering, Wuhan, China, 10–12 October 2019; Volume 705. [Google Scholar] [CrossRef]
- Li, W.; Fu, H.; Yu, L.; Gong, P.; Feng, D.; Li, C.; Clinton, N. Stacked Autoencoder-based deep learning for remote-sensing image classification: A case study of African land-cover mapping. Int. J. Remote Sens. 2016, 37, 5632–5646. [Google Scholar] [CrossRef]
- Pibre, L.; Chaumon, M.; Subsol, G.; Lenco, D.; Derras, M. How to deal with multi-source data for tree detection based on deep learning. In Proceedings of the 2017 IEEE Global Conference on Signal and Information Processing (GlobalSIP), Montreal, QC, Canada, 14–16 November 2017; pp. 1150–1154. [Google Scholar] [CrossRef]
- Neupane, B.; Horanont, T.; Hung, N.D. Deep learning based banana plant detection and counting using high-resolution red-green-blue (RGB) images collected from unmanned aerial vehicle (UAV). PLoS ONE 2019, 14, e0223906. [Google Scholar] [CrossRef]
- Norling, S. Tree Species Classification with YOLOv3: Classification of Silver Birch (Betula pendula) and Scots Pine (Pinus sylvestris). Bachelor Thesis, KTH Royal Institute of Technology, Stockholm, Sweden, 2019. [Google Scholar]
- Itakura, K.; Hosoi, F. Automatic tree detection from three-dimensional images reconstructed from 360 spherical camera using YOLO v2. Remote Sens. 2020, 12, 988. [Google Scholar] [CrossRef]
- Zheng, J.; Li, W.; Xia, M.; Dong, R.; Fu, H.; Yuan, S. Large-Scale Oil Palm Tree Detection from High-Resolution Remote Sensing Images Using Faster-RCNN. Int. Geosci. Remote Sens. Symp. 2019, 1422–1425. [Google Scholar] [CrossRef]
- Ammar, A.; Koubaa, A.; Benjdira, B. Deep-learning-based automated palm tree counting and geolocation in large farms from aerial geotagged images. Agronomy 2021, 11, 1458. [Google Scholar] [CrossRef]
- Herman, H.; Susanto, A.; Cenggoro, T.W.; Suharjito, S.; Pardamean, B. Oil palm fruit image ripeness classification with computer vision using deep learning and visual attention. J. Telecommun. Electron. Comput. Eng. 2020, 12, 21–27. [Google Scholar]
- Yarak, K.; Witayangkurn, A.; Kritiyutanont, K.; Arunplod, C.; Shibasaki, R. Oil palm tree detection and health classification on high-resolution imagery using deep learning. Agriculture 2021, 11, 183. [Google Scholar] [CrossRef]
- Descals, A.; Wich, S.; Meijaard, E.; Gaveau, D.L.A.; Peedell, S.; Szantoi, Z. High-resolution global map of smallholder and industrial closed-canopy oil palm plantations. Earth Syst. Sci. Data 2021, 13, 1211–1231. [Google Scholar] [CrossRef]
- Prasetyo, N.A.; Pranowo; Santoso, A.J. Automatic detection and calculation of palm oil fresh fruit bunches using faster R-CNN. Int. J. Appl. Sci. Eng. 2020, 17, 121–134. [Google Scholar] [CrossRef]
- Emmert-Streib, F.; Yang, Z.; Feng, H.; Tripathi, S.; Dehmer, M. An Introductory Review of Deep Learning for Prediction Models With Big Data. Front. Artif. Intell. 2020, 3, 4. [Google Scholar] [CrossRef]
- Redmon, J.; Divvala, S.; Girshick, R.; Farhadi, A. You only look once: Unified, real-time object detection. In Proceedings of the IEEE Conference on Computer Vision and Pattern Recognition, Las Vegas, NV, USA, 27–30 June 2016; pp. 779–788. [Google Scholar] [CrossRef]
- Redmon, J.; Farhadi, A. YOLO9000: Better, faster, stronger. In Proceedings of the IEEE Conference on Computer Vision and Pattern Recognition (CVPR 2017), Honolulu, HI, USA, 21–26 July 2017; pp. 7263–7271. [Google Scholar]
- Redmon, J.; Farhadi, A. Yolov3: An incremental improvement. arXiv 2018, arXiv:1804.02767. [Google Scholar]
- Bochkovskiy, A.; Wang, C.Y.; Liao, H.Y.M. YOLOv4: Optimal Speed and Accuracy of Object Detection. arXiv 2020, arXiv:2004.10934. [Google Scholar]
- Ultralytics-YOLOv5. Available online: https://github.com/ultralytics/yolov5 (accessed on 9 September 2021).
- Chowdhury, P.N.; Shivakumara, P.; Nandanwar, L.; Samiron, F.; Pal, U.; Lu, T. Oil palm tree counting in drone images. Pattern Recognit. Lett. 2022, 153, 1–9. [Google Scholar] [CrossRef]
- Aripriharta, A.; Firmansah, A.; Mufti, N.; Horng, G.-J.; Rosmin, N. Smartphone for palm oil fruit counting to reduce embezzlement in harvesting season. Bull. Soc. Inform. Theory Appl. 2020, 4, 76–82. [Google Scholar] [CrossRef]
- Junos, M.H.; Mohd Khairuddin, A.S.; Thannirmalai, S.; Dahari, M. An optimized YOLO-based object detection model for crop harvesting system. IET Image Process. 2021, 15, 2112–2125. [Google Scholar] [CrossRef]
- Li, W.; Fu, H.; Yu, L.; Cracknell, A. Deep learning based oil palm tree detection and counting for high-resolution remote sensing images. Remote Sens. 2017, 9, 22. [Google Scholar] [CrossRef]
- Li, W.; Fu, H.; Yu, L. Deep convolutional neural network based large-scale oil palm tree detection for high-resolution remote sensing images. In Proceedings of the 2017 IEEE International Geoscience and Remote Sensing Symposium (IGARSS), Fort Worth, TX, USA, 23–28 July 2017; pp. 846–849. [Google Scholar] [CrossRef]
- Mubin, N.A.; Nadarajoo, E.; Shafri, H.Z.M.; Hamedianfar, A. Young and mature oil palm tree detection and counting using convolutional neural network deep learning method. Int. J. Remote Sens. 2019, 40, 7500–7515. [Google Scholar] [CrossRef]
- Bonet, I.; Caraffini, F.; Pena, A.; Puerta, A.; Gongora, M. Oil Palm Detection via Deep Transfer Learning. In Proceedings of the 2020 IEEE Congress on Evolutionary Computation (CEC), Glasgow, UK, 19–24 July 2020. [Google Scholar] [CrossRef]
- Liu, X.; Ghazali, K.H.; Han, F.; Mohamed, I.I. Automatic Detection of Oil Palm Tree from UAV Images Based on the Deep Learning Method. Appl. Artif. Intell. 2021, 35, 13–24. [Google Scholar] [CrossRef]
- Confusion Matrix, Accuracy, Precision, Recall, F1 Score. Available online: https://medium.com/analytics-vidhya/confusion-matrix-accuracy-precision-recall-f1-score-ade299cf63cd (accessed on 20 July 2021).
- Intersection over Union (IoU) for Object Detection. Available online: https://pyimagesearch.com/2016/11/07/intersection-over-union-iou-for-object-detection (accessed on 22 July 2021).


| Attributes | Description |
|---|---|
| Wingspan | 2000 mm |
| Weight | 3.8 kg |
| Radio control | 2.4 GHz |
| Camera | RGB 24 mp support PPK GNSS |
| Telemetry type long-range | 15 km |
| Flying ability | Full system auto/fly without remote |
| Cruising flight maximum | 70 min/60 km |
| Datasets | Blocks |
|---|---|
| Training | 101,106,107,108,109,110,111,112,113,117,118,119,122,126,127,128,131,133,136, 137,140,141,143,144,147,150,151,152,153,154,155,156,157,158,159,160,162,164, 165,170,172,174,176,201,202,206,207,208,215,216,218,225,228,229,230,231,232, 233,237,238,239,240,241,242,243,244,253,254,256. |
| Validation | 102,103,104,105,114,115,116,120,121,124,145,161. |
| Testing | 203,204,205,209,210,211,212,213,214,217,219,220,221,222,223,224,227,234,257. |
| Network Input Size (Width × Height) | Hyperparameters | ||||
|---|---|---|---|---|---|
| Batch | Subdivision | Momentum | Decay | Learning Rate | |
| 416 × 416 | 64 | 16 | 0.9 | 0.0005 | 0.001 |
| 608 × 608 | 64 | 16 | 0.9 | 0.0005 | 0.001 |
| 832 × 832 | 64 | 16 | 0.9 | 0.0005 | 0.001 |
| 1024 × 1024 | 64 | 32 | 0.9 | 0.0005 | 0.001 |
| Network Input Size (Width × Height) | Hyperparameters | ||||
|---|---|---|---|---|---|
| Batch | Subdivision | Momentum | Decay | Learning Rate | |
| 416 × 416 | 64 | 16 | 0.949 | 0.0005 | 0.001 |
| 608 × 608 | 64 | 16 | 0.949 | 0.0005 | 0.001 |
| 832 × 832 | 64 | 32 | 0.949 | 0.0005 | 0.001 |
| 1024 × 1024 | 64 | 64 | 0.949 | 0.0005 | 0.001 |
| Network Input Size (Width × Height) | Hyperparameters | |||
|---|---|---|---|---|
| Batch | Momentum | Decay | Learning Rate | |
| 416 × 416 | 64 | 0.937 | 0.0005 | 0.01 |
| 608 × 608 | 32 | 0.937 | 0.0005 | 0.01 |
| 832 × 832 | 16 | 0.937 | 0.0005 | 0.01 |
| 1024 × 1024 | 8 | 0.937 | 0.0005 | 0.01 |
| Network Input Size (Width × Height) | Iteration | Threshold | Precision | Recall | F1-Score | Average IoU (%) |
|---|---|---|---|---|---|---|
| 416 × 416 | 4000 | 0.2 | 0.84 | 0.99 | 0.91 | 72.71 |
| 608 × 608 | 7000 | 0.2 | 0.85 | 0.99 | 0.91 | 74.84 |
| 832 × 832 | 7000 | 0.4 | 0.86 | 0.99 | 0.92 | 76.52 |
| 1024 × 1024 | 8000 | 0.4 | 0.86 | 0.99 | 0.92 | 76.42 |
| Network Input Size (Width × Height) | Iteration | Threshold | Precision | Recall | F1-Score | Average IoU (%) |
|---|---|---|---|---|---|---|
| 416 × 416 | 5000 | 0.3 | 0.85 | 0.99 | 0.91 | 73.92 |
| 608 × 608 | 3500 | 0.4 | 0.86 | 0.99 | 0.92 | 76.17 |
| 832 × 832 | 4000 | 0.4 | 0.86 | 0.99 | 0.92 | 76.76 |
| 1024 × 1024 | 2000 | 0.4 | 0.86 | 0.99 | 0.92 | 70.35 |
| Network Input Size (Width × Height) | Iteration | Threshold | Precision | Recall | F1-Score | Average IoU (%) |
|---|---|---|---|---|---|---|
| 416 × 416 | 6000 | 0.5 | 0.97 | 0.89 | 0.93 | 71.20 |
| 608 × 608 | 6000 | 0.5 | 0.97 | 0.89 | 0.93 | 73.60 |
| 832 × 832 | 6000 | 0.5 | 0.97 | 0.89 | 0.93 | 74.70 |
| 1024 × 1024 | 6000 | 0.5 | 0.97 | 0.89 | 0.93 | 75.10 |
| Region | Ground Truth |
|---|---|
| Region 1 (grid 1) | 547 |
| Region 2 (grid 2) | 1079 |
| Region 3 (grid 3) | 324 |
| Region 4 (grid 9) | 423 |
| Region 5 (grid 10) | 1301 |
| Region 6 (grid 11) | 1213 |
| Region 7 (grid 12) | 991 |
| Region 8 (grid 13) | 982 |
| Region 9 (grid 14) | 754 |
| Region 10 (grid 15) | 407 |
| Region 11 (grid 17) | 251 |
| Region 12 (grid 18) | 1117 |
| Region 13 (grid 19) | 731 |
| Region 14 (grid 20) | 674 |
| Region 15 (grid 21) | 1170 |
| Region 16 (grid 22) | 1090 |
| Region 17 (grid 23) | 889 |
| Region 18 (grid 26) | 539 |
| Region 19 (grid 27) | 1209 |
| Region 20 (grid 28) | 440 |
| Region 21 (grid 29) | 98 |
| Region 22 (grid 30) | 190 |
| Region 23 (grid 31) | 485 |
| Region 24 (grid 32) | 439 |
| Network Input Size (Width × Height) | GT | TP | FP | FN | Recall (%) | Precision (%) | F1-Score (%) | Detection Time (s) |
|---|---|---|---|---|---|---|---|---|
| 416 × 416 | 17,343 | 15,542 | 235 | 1801 | 89.62 | 98.51 | 93.85 | 42 |
| 608 × 608 | 17,343 | 16,403 | 146 | 940 | 94.58 | 99.12 | 96.80 | 41 |
| 832 × 832 | 17,343 | 16,073 | 19 | 1270 | 92.68 | 99.88 | 96.14 | 43 |
| 1024 × 1024 | 17,343 | 16,432 | 7 | 911 | 94.75 | 99.96 | 97.28 | 43 |
| Network Input Size (Width × Height) | GT | TP | FP | FN | Recall (%) | Precision (%) | F1-Score (%) | Detection Time (s) |
|---|---|---|---|---|---|---|---|---|
| 416 × 416 | 17,343 | 14,946 | 145 | 2397 | 86.18 | 99.04 | 92.16 | 42 |
| 608 × 608 | 17,343 | 15,509 | 33 | 1834 | 89.43 | 99.79 | 94.32 | 45 |
| 832 × 832 | 17,343 | 16,600 | 23 | 743 | 95.72 | 99.86 | 97.74 | 45 |
| 1024 × 1024 | 17,343 | 10,699 | 7 | 6644 | 61.69 | 99.93 | 76.29 | 44 |
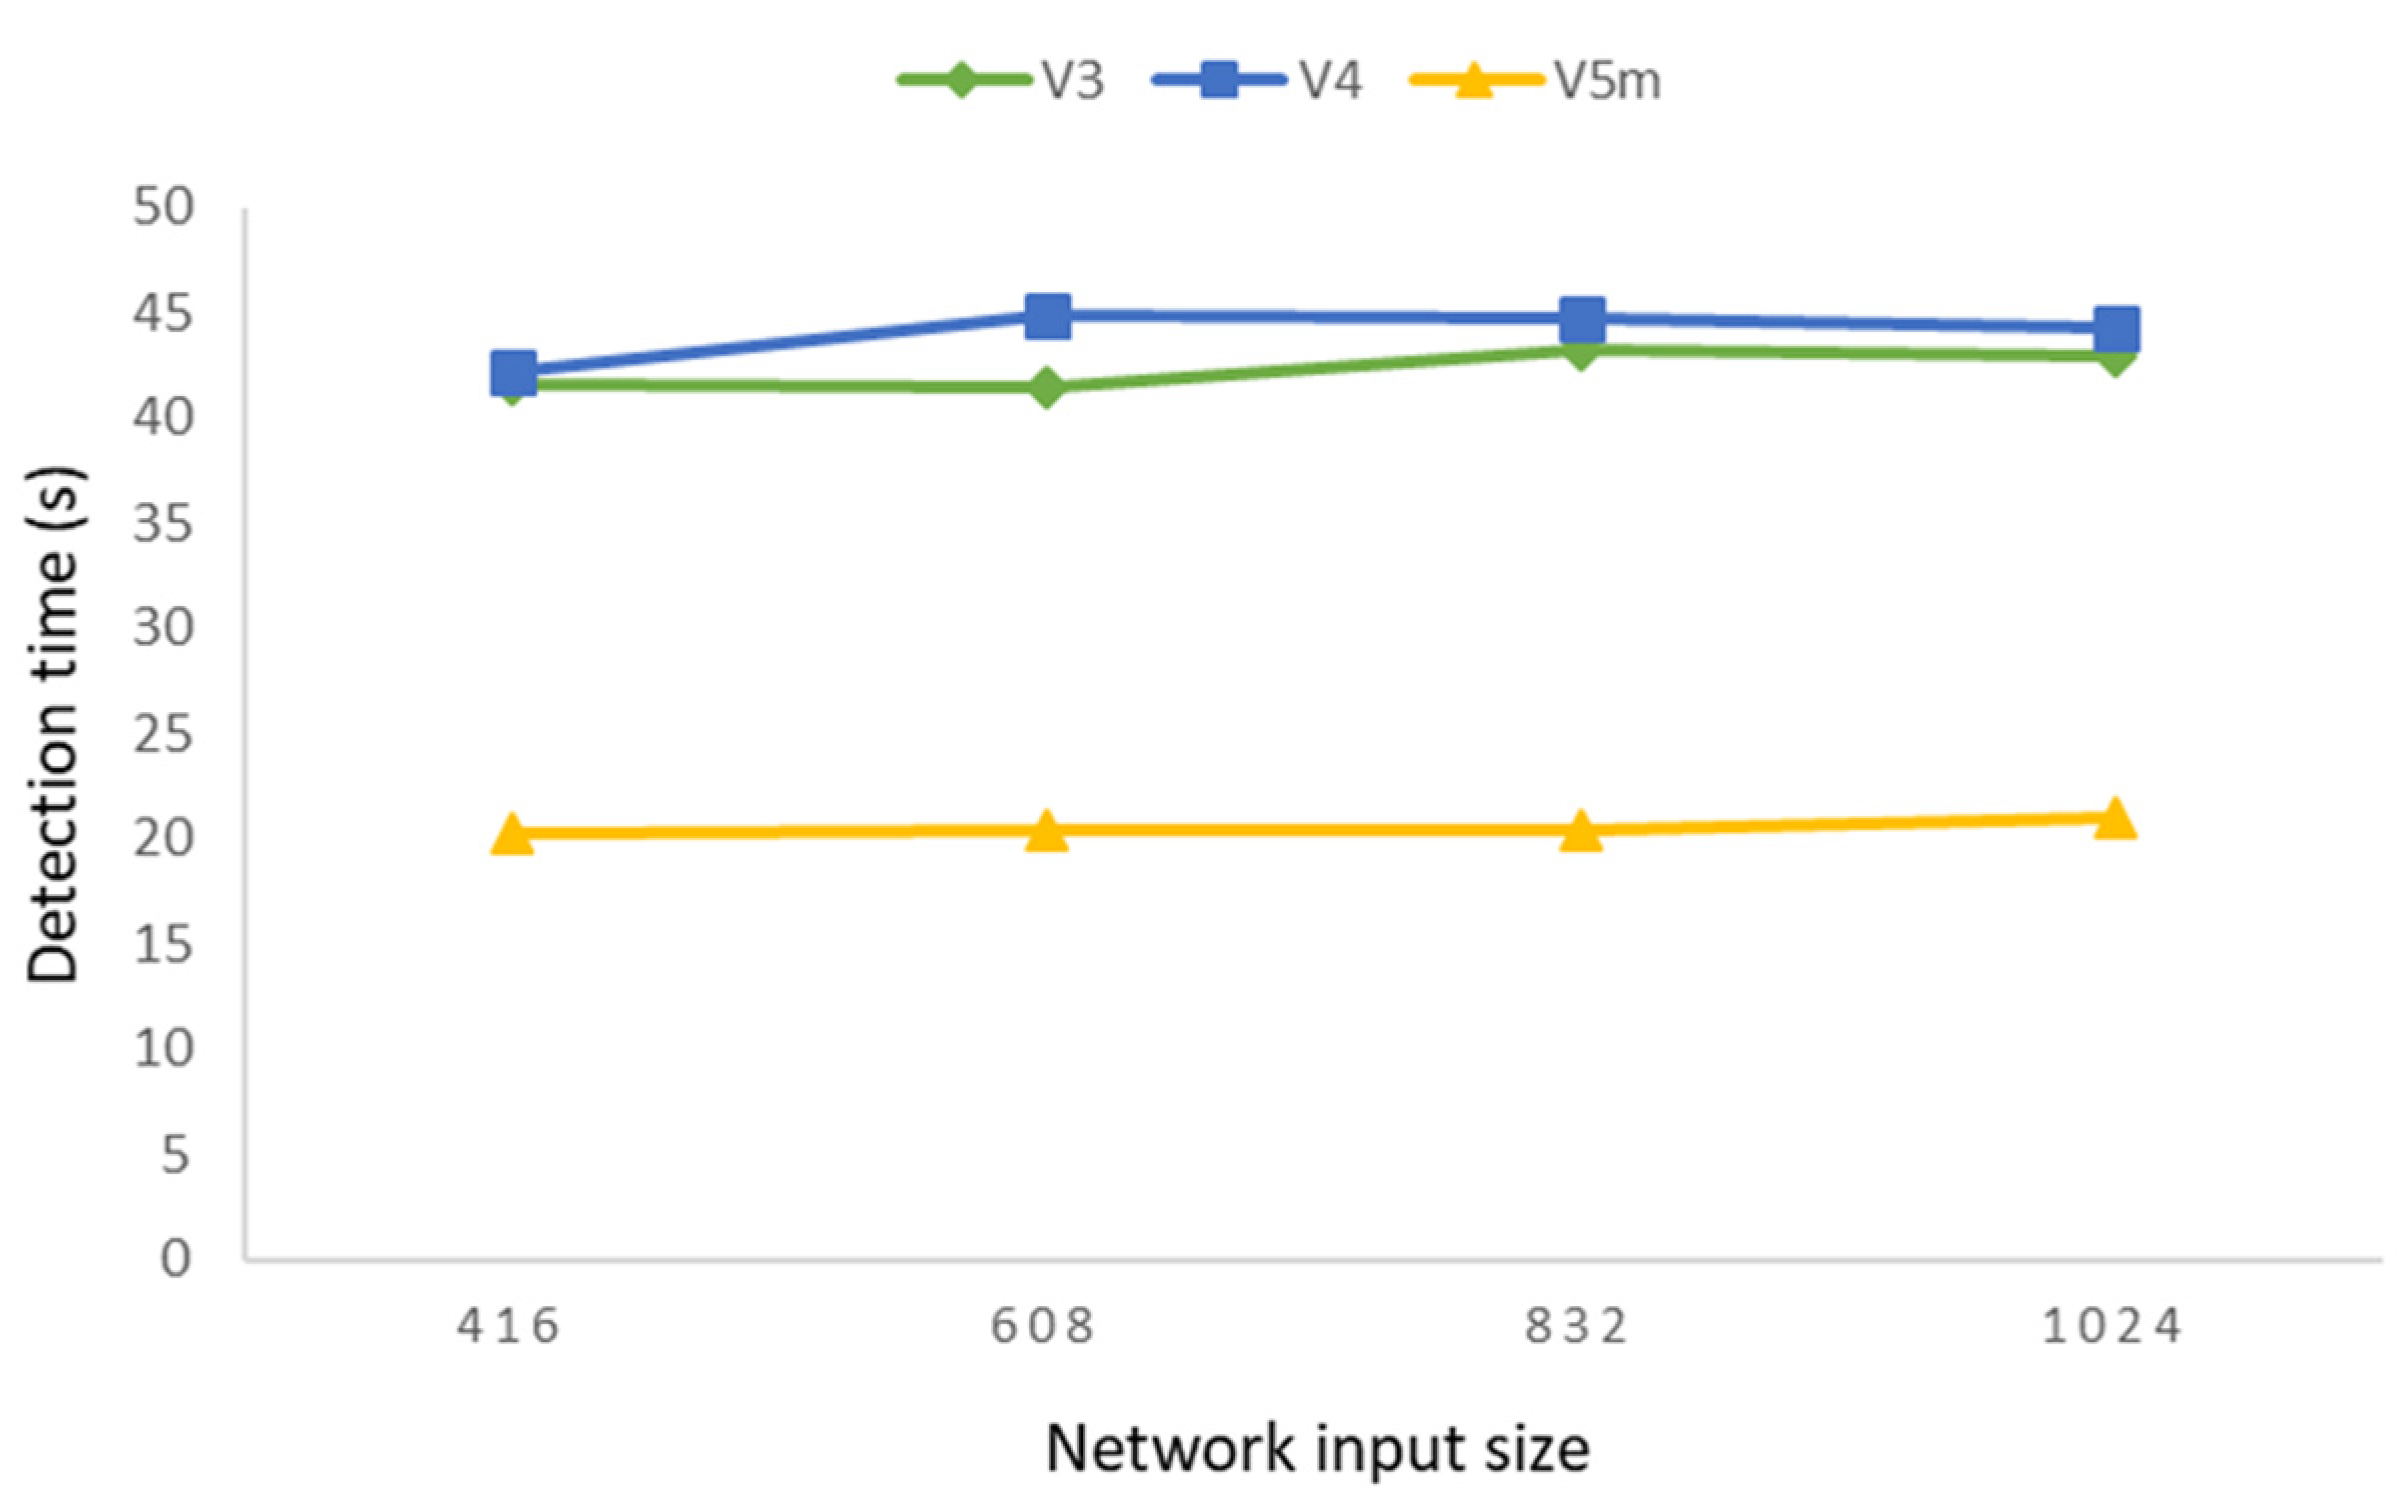
| Network Input Size (Width × Height) | GT | TP | FP | FN | Recall (%) | Precision (%) | F1-Score (%) | Detection Time (s) |
|---|---|---|---|---|---|---|---|---|
| 416 × 416 | 17,343 | 6935 | 69 | 10,408 | 39.99 | 99.01 | 56.97 | 20 |
| 608 × 608 | 17,343 | 15,257 | 84 | 2086 | 87.97 | 99.45 | 93.36 | 20 |
| 832 × 832 | 17,343 | 15,599 | 68 | 1744 | 89.94 | 99.57 | 94.51 | 20 |
| 1024 × 1024 | 17,343 | 15,717 | 49 | 1626 | 90.62 | 99.69 | 94.94 | 21 |
Publisher’s Note: MDPI stays neutral with regard to jurisdictional claims in published maps and institutional affiliations. |
© 2022 by the authors. Licensee MDPI, Basel, Switzerland. This article is an open access article distributed under the terms and conditions of the Creative Commons Attribution (CC BY) license (https://creativecommons.org/licenses/by/4.0/).
Share and Cite
Wibowo, H.; Sitanggang, I.S.; Mushthofa, M.; Adrianto, H.A. Large-Scale Oil Palm Trees Detection from High-Resolution Remote Sensing Images Using Deep Learning. Big Data Cogn. Comput. 2022, 6, 89. https://doi.org/10.3390/bdcc6030089
Wibowo H, Sitanggang IS, Mushthofa M, Adrianto HA. Large-Scale Oil Palm Trees Detection from High-Resolution Remote Sensing Images Using Deep Learning. Big Data and Cognitive Computing. 2022; 6(3):89. https://doi.org/10.3390/bdcc6030089
Chicago/Turabian StyleWibowo, Hery, Imas Sukaesih Sitanggang, Mushthofa Mushthofa, and Hari Agung Adrianto. 2022. "Large-Scale Oil Palm Trees Detection from High-Resolution Remote Sensing Images Using Deep Learning" Big Data and Cognitive Computing 6, no. 3: 89. https://doi.org/10.3390/bdcc6030089