
Low-Carbon Transition Paths of Coal Power in China’s Provinces under the Context of the Carbon Trading Scheme


1
School of Economics and Management, China University of Mining and Technology, Xuzhou 221116, China
2
School of Business, East China University of Science and Technology, Shanghai 200237, China
3
School of Postgraduate Education, Jiangsu Normal University of China, Xuzhou 221116, China
*
Author to whom correspondence should be addressed.
Sustainability 2022, 14(15), 9657; https://doi.org/10.3390/su14159657
Submission received: 23 June 2022
/
Revised: 16 July 2022
/
Accepted: 3 August 2022
/
Published: 5 August 2022
(This article belongs to the Special Issue Advances in Energy Transition towards Carbon Neutrality)
Abstract
:The importance of coal power in maintaining the security of the national power supply and the stability of the grid is irreplaceable for China at present, as was reflected in the “power shortage” event of 2021. To achieve the goal of carbon neutrality, the low-carbon transition paths of coal power for each province were analyzed in the context of China’s emission trading scheme (ETS). The prospect and importance of coal power was preliminarily analyzed first. Following the “bottom-up” direction, the real option method was used to establish decision models for investing in carbon capture, utilization and storage equipment (CCUS) and eliminating high carbon-intensive units. Results showed that Inner Mongolia will first adopt CCUS in 2037 and the thresholds can be met in all provinces before 2050. However, the ETS will not lead to the elimination of coal power during the studied period. Combined with an evaluation of the development potential of coal power, four transition paths were distinguished for Chinese provinces. Considering that China’s ETS is in the developing stage, its full potential for stimulating the low-carbon transition of coal power was further discussed. On this basis, several policy implications were provided.
1. Introduction
The rapidly increased GDP of China supported by an energy mix dominated by coal has resulted in the highest carbon emissions in the world [1]. To achieve the goals of “carbon peaking” and “carbon neutrality”, a low-carbon transition across the domestic high carbon-intensive industries is required [2]. As the primary sector of energy consumption, the power sector accounted for 53% of national carbon emissions in 2019, and over 97% of that comes from coal power [1]. The Government of China has formulated development planning for the electricity system including the large-scale diffusion of variable renewable energy (VRE) and the establishment of the world’s cleanest coal utilization system. With the rapid development in recent years, China has become the biggest producer of solar power and wind power. However, due to the limitations of the intermittent and fluctuating output of VRE, low carbon-intensive coal power is expected to continue playing an essential role in ensuring the security of power supply and maintaining the stability of the grid.
Considering the importance of coal power in China’s electricity transition, the feasibility of its low-carbon development paths, which include the elimination of high carbon-intensive capacity [3,4,5] and the adoption of carbon capture utilization and storage (CCUS) [6,7,8,9], needed to be evaluated. Additionally, due to the regional differences in power demand and resource endowment, this study was conducted from the provincial perspective. Taking as reference the EU’s ETS, China began a domestic pilot for carbon trading in 2011, and coal power enterprises were involved in the first version of the trading list. With the accumulation of operational experience, the nationwide carbon trading market was launched in 2021. This newly emerged charging mechanism has the potential to promote the low-carbon transition of China’s coal power.
The high carbon-intensive emitters are less motivated to make changes when the negative externalities of carbon emissions are apportioned to the whole society [10,11,12]. On this basis, carbon policy instruments were introduced in the early 2000s and the carbon emission trading scheme was the most representative one [13,14]. The ETS was established on a quota system and emitters need to trade for the right of excess emissions beyond the free quota [15,16,17]. Given that the distribution of the emission quota is equitable and finite, the enterprises with higher carbon intensity will experience more pressure for carbon reduction [18,19,20]. The participants can make tradeoffs between paying the carbon cost or conducting a low-carbon upgrade [21]. At present, the ETS is used as the primary instrument of carbon policies worldwide [22,23].
The EU made the first attempt at carbon trading in 2005. The positive influence of the EU’s ETS on low-carbon electricity transition has been studied by many researchers [24,25]. Results showed that with the increase of the carbon price and the proportion of the quota auction, low generation approaches with low carbon intensity were more attractive to investors. It can indirectly lead to technological innovation and diffusion of low-carbon generation technologies [21,26] and the optimization of high carbon-intensive power plants [11]. The total CO2 emissions of the EU have decreased by 23.6% from 2005 to 2019. Additionally, the CO2 intensity of the EU’s power sector has also decreased from 0.48 kg CO2/kWh to 0.23 kg CO2/kWh during the same period [1]. In terms of China’s ETS, some obstacles were identified from the pilot experience [27,28] including: (1) a price discovery process is still absent, which results in market rigidity and abnormal fluctuation of the carbon price [13,29]; (2) more supporting policies are still needed for China’s ETS to adapt to the complexity among different provinces, considering that few universal experiences have been concluded from the pilots [30,31,32]. At present, the mechanism of China’s ETS for the low-carbon transition of coal power is unclear, which needs to be further studied.
To reflect the advantage of the ETS for stimulating China’s coal power industry to conduct the low-carbon upgrade [33], the research perspective can be transferred to the level of the power enterprises participating in the trading process [34,35]. The effect of the ETS can be directly reflected in the investment decisions taken towards the goal of the decarbonization transition. Due to the uncertain features of the ETS, the real option approach (ROA) is often adopted to replace the traditional discounted cash flow (DCF) method to simulate the decision process [36,37]. According to the real option theory, an item with low current profitability can be treated as an alternative option when its value is expected to increase in the future, which matches the characteristics of the low-carbon generation technologies in the context of the ETS [38,39].
Following the “bottom-up” direction, the prospects and paths of the low-carbon transition of coal power in China’s provinces were studied based on the decisions of the coal power plants. Based on the real option approach, the potential effects and mechanisms of the ETS on this process were evaluated. To provide more specific insights for each province, the regional differences of power demand, price and resource endowment were taken into consideration. Our aim was not to argue against the importance and necessity of coal power in the future low-carbon electricity system, but to explore the most suitable development mode in the context of the ETS and the effective regulatory policies needed.
The remainder of this paper is organized as follows: Section 2 conducts a preliminary analysis of the prospect and importance of coal power for each province of China. The methodology of this study is established in Section 3. The numerical analytical results are derived in Section 4. Further discussion is provided in Section 5 and Section 6 concludes.
2. Current Status of Coal Power in the Provincial Power Supply
Due to the limitations of the domestic resource endowment, the electricity structure of China was dominated by coal power before 2010. With the slowing down of the national economy, as well as the rapid development of renewable energy, the proportion of installation capacity of coal power had decreased from 73.4% in 2010 to 59.5% in 2019 [40]. On the other hand, coal power still accounted for more than 70% of national power production by 2019. In order to meet the enormous power demand, coal power needs to continue playing an important role in the electricity mix [41]. In addition, in order to make up for the fluctuating output of renewable power, coal power is also essential to maintain the stability of the power grid [42].
On this basis, the importance and prospects of coal power for each province was first analyzed, and it was measured using the proportion of coal power in provincial power production (PC) and the self-sufficiency rate of electricity (SR), here Equations (1) and (2).
where is the provincial production of coal power in MWh, and and are the total production and consumption of electricity for each province in MWh.
As shown in Figure 1, all the provinces of China were positioned in a coordinate system, where SR is the x-axis and PC is the y-axis, and four types were first distinguished.
The first type includes the provinces which are the main producers and exporters of coal and have high PC and SR, such as Shanxi, Inner Mongolia, Xinjiang, Ningxia and Guizhou. Additionally, the coal resources excavated in these provinces are also transmitted to other regions of China in the form of electricity as an important component of the national West-East Electricity Transmission Project. Considering the advantage of their resource endowments and the responsibility to make up the shortage of electricity supply in other provinces, coal power is estimated to continue taking a big share in these provinces with great potential for low-carbon upgrading.
The second type assembled the economically developed provinces having high PC and low SR, and included Shandong, Jiangsu, Zhejiang, Guangdong, Henan, Hebei and Liaoning. The huge power demand to maintain their large-scale economic development is the common feature among these provinces. Due to the insufficiency of their water resources and the low generation efficiency of VRE, coal power remains attractive for them. Additionally, their capital advantage can reduce the difficulty of making the upgrade decision.
The third type included Beijing, Shanghai and Tianjin which have high PC and low SR. Their electricity consumption is largely reliant on transregional transmission from other provinces. Unlike the second type, these municipalities are in the process of eliminating their internal coal power capacity. Coal power in these municipalities tends to be a flexible power source used with VRE to make up for its intermittent and fluctuating output. In this case, the PC of these municipalities is estimated to decrease continuously.
The fourth type describes the provinces with high SR and low PC. The main producers of hydropower are concentrated in this quadrant, including Yunnan, Sichuan and Guizhou. Combined with the trend toward developing VRE, coal power has shown the lowest competitiveness in these regions. Apart from these four types, the other provinces are in an intermediate position in the coordinate system, and they combine the features of the identified types above with more complexity.
The importance and prospects of coal power in the provincial electricity mix was preliminarily analyzed. However, with the launch of China’s carbon trading market, much complexity and uncertainty were infused into the low-carbon upgrade of coal power. To reflect these features, a quantitative analysis able to identify and evaluate the optional transition path of coal power for each province was needed.
3. Methodology
The enterprise value (EV) was the key indicator determining low-carbon decisions. The learning effect for niche technologies was considered. The high carbon-intensive coal power capacity can receive the residual value of the equipment from the elimination path. The CCUS device can largely reduce the carbon intensity of the fossil fuel power plants, while the generation cost will increase at the same time [43]. Considering that CCUS was widely recognized as the most effective tool for carbon reduction, it was adopted to represent the low-carbon upgrade option for coal power plants under the context of China’s carbon trading scheme. Other low-carbon and pollution control technologies, which are also useful to improve generation efficiency and reduce the emission of gaseous pollutants, were not included. On this basis, the decision model was established in the remaining part of this section.
3.1. Carbon Price
Considering that the carbon cost embodied in the ETS is the primary reason for coal power enterprises to make the decision of low-carbon upgrading, the trend of carbon price was first depicted. As shown in Equations (3) and (4), the carbon price () was assumed to follow geometric Brownian motion [44,45,46]. On this basis, the Poisson jump process was also adopted to depict the unpredictable fluctuation [47,48].
, and denote the drift factor, standard deviation and the Standard Wiener increment of the carbon price, respectively. The Poisson jump process ( is inserted such that will fluctuate by the degree of with the possibility of .
3.2. Learning Effect of CCUS
The technical progress of CCUS can reduce the costs of its acquisition and maintenance with the accumulation of installation capacity [49], shown as Equations (5) and (6).
and are the acquisition and maintenance costs at the time of t in yuan; and are the initial costs in yuan; denotes the learning rate; and are the current and the initial installation capacity in MW.
3.3. Decision Model for the Paths of Elimination and Upgrading
The investment decisions of elimination and upgrading are optional with the increase of the carbon cost. By contrast, they can also remain unchanged if the costs of the low-carbon modifications exceed the carbon costs. The decision criteria depend on the indicator of the expected enterprise value per unit installation capacity (), which is shown in Equation (7).
where LT denotes the remaining lifetime of the generation units in years; is the maintenance cost of the original units in yuan; and are the emission rates before and after adopting the CCUS equipment in tCO2/MWh; is the free quota rate; and is the proportion of carbon cost delivering to the electricity price; and are the generation efficiency before and after using CCUS in t/MWh. and are the operation times of the coal power plants before and after installing CCUS in hours. > when the additional maintenance cost () is higher than the reduction of carbon cost by CCUS, and vice versa. is the discount rate; F(a) is the option value of exercising the upgrading decision in the future; is the residual value of the generation equipment in yuan.
From the perspective of the ROA, the transition opportunity of decisions (I) and (II) is an American option [50]. The decision will be made when the critical conditions of the thresholds are met, which takes the uncertain factors into consideration.
The value of the option to install CCUS or terminate the units was solved using Ito’s lemma:
The general solution of Equation (8) is , where (>1) and (<0) are the roots of . To ensure when , is implied to be 0. Here is the only positive root of the characteristic equation [51]:
The thresholds for installing the CCUS device on fossil fuel power plants and eliminating the high carbon-intensive units are solved as follows:
Based on the decision model, the thresholds for each province to conduct the low-carbon transition on the internal coal power capacity were simulated. The trends of China’s ETS were depicted in Table 1. The regular mode was set as the BAU scenario, which was used to get the main results of the study. On this basis, the FC scenario was also established to explore the full potential of the ETS for the low-carbon transition of coal power in the section of discussion. The provincial data of coal price, power price and annual operation time of different types of generation units were collected using the statistics data from the website of the National Energy Administration and the Development and Reform Commission of China. Additionally, some other factors affecting the decision results, such as learning effects, price parameters, lifetime of the units and electricity marketization, were depicted in Table 2.
4. Results
4.1. Installing the CCUS Device on Operating Coal Power Units
For each province, the threshold value of the upgrading path is expected to decrease with the increase of the carbon price, as shown in Figure 2. All provinces are estimated to adopt CCUS technology in their coal power plants before 2050, and the average time to achieve this decision is 2043. As one of the biggest producers of coal power, the critical condition will first be reached in Inner Mongolia in 2037, followed by Xinjiang, Heilongjiang, Shaanxi and Jilin between 2039 and 2040. According to the latest development planning, Beijing will shut down all fossil fuel generation units in the coming years, but it still has the potential to develop low-carbon coal power by 2041. In contrast, Tibet, Qinghai, Guangxi, Jiangxi, Fujian and Henan will be the last batch of provinces reaching the thresholds for adopting CCUS.
The national average value of the threshold would drop from 440 yuan/t CO2 in 2020 to 120 yuan/t CO2 in 2050. At the same time, the carbon price is estimated to increase from 84 yuan/t CO2 to 359 yuan/t CO2. The effects of China’s ETS on the provincial low-carbon transition of coal power is further measured by the decreasing amplitude of the thresholds. On this basis, Heilongjiang, Jilin and Beijing have shown the largest changes during the simulation period. In contrast, Qinghai, Tibet and Yunnan are less sensitive to the increase of carbon cost than other provinces.
Combined with the preliminary analysis in Section 2, all provinces of Type I will prefer to adopt the upgrading path earlier than the national average time. The low generation cost of these main coal-producing provinces can largely offset the costs of CCUS. Additionally, the provinces surrounding them in Figure 1, including Shaanxi, Jilin and Heilongjiang, can also reach these thresholds earlier than the average. In contrast, provinces of Type IV, which have abundant renewable energy, tend to maintain their existing generation mode of coal power without CCUS, which is consistent with the result for their surrounding provinces, including Qinghai, Guangxi and Fujian. According to Equation (5), the electricity price is negatively correlated with the difficulty to make the upgrade decision. As a result, the economically developed regions, including the municipalities in Type II and some provinces in Type III (Jiangsu and Zhejiang), find it easier to make this decision.
4.2. Eliminating High Carbon-Intensive Coal Power Capacity
Due to the limitation of the high acquisition cost, the adoption of CCUS is not applicable for those coal power plants with a short remaining lifetime. With an increase of the carbon cost, high carbon-intensive units with low generation efficiency are expected to be eliminated from the electricity mix.
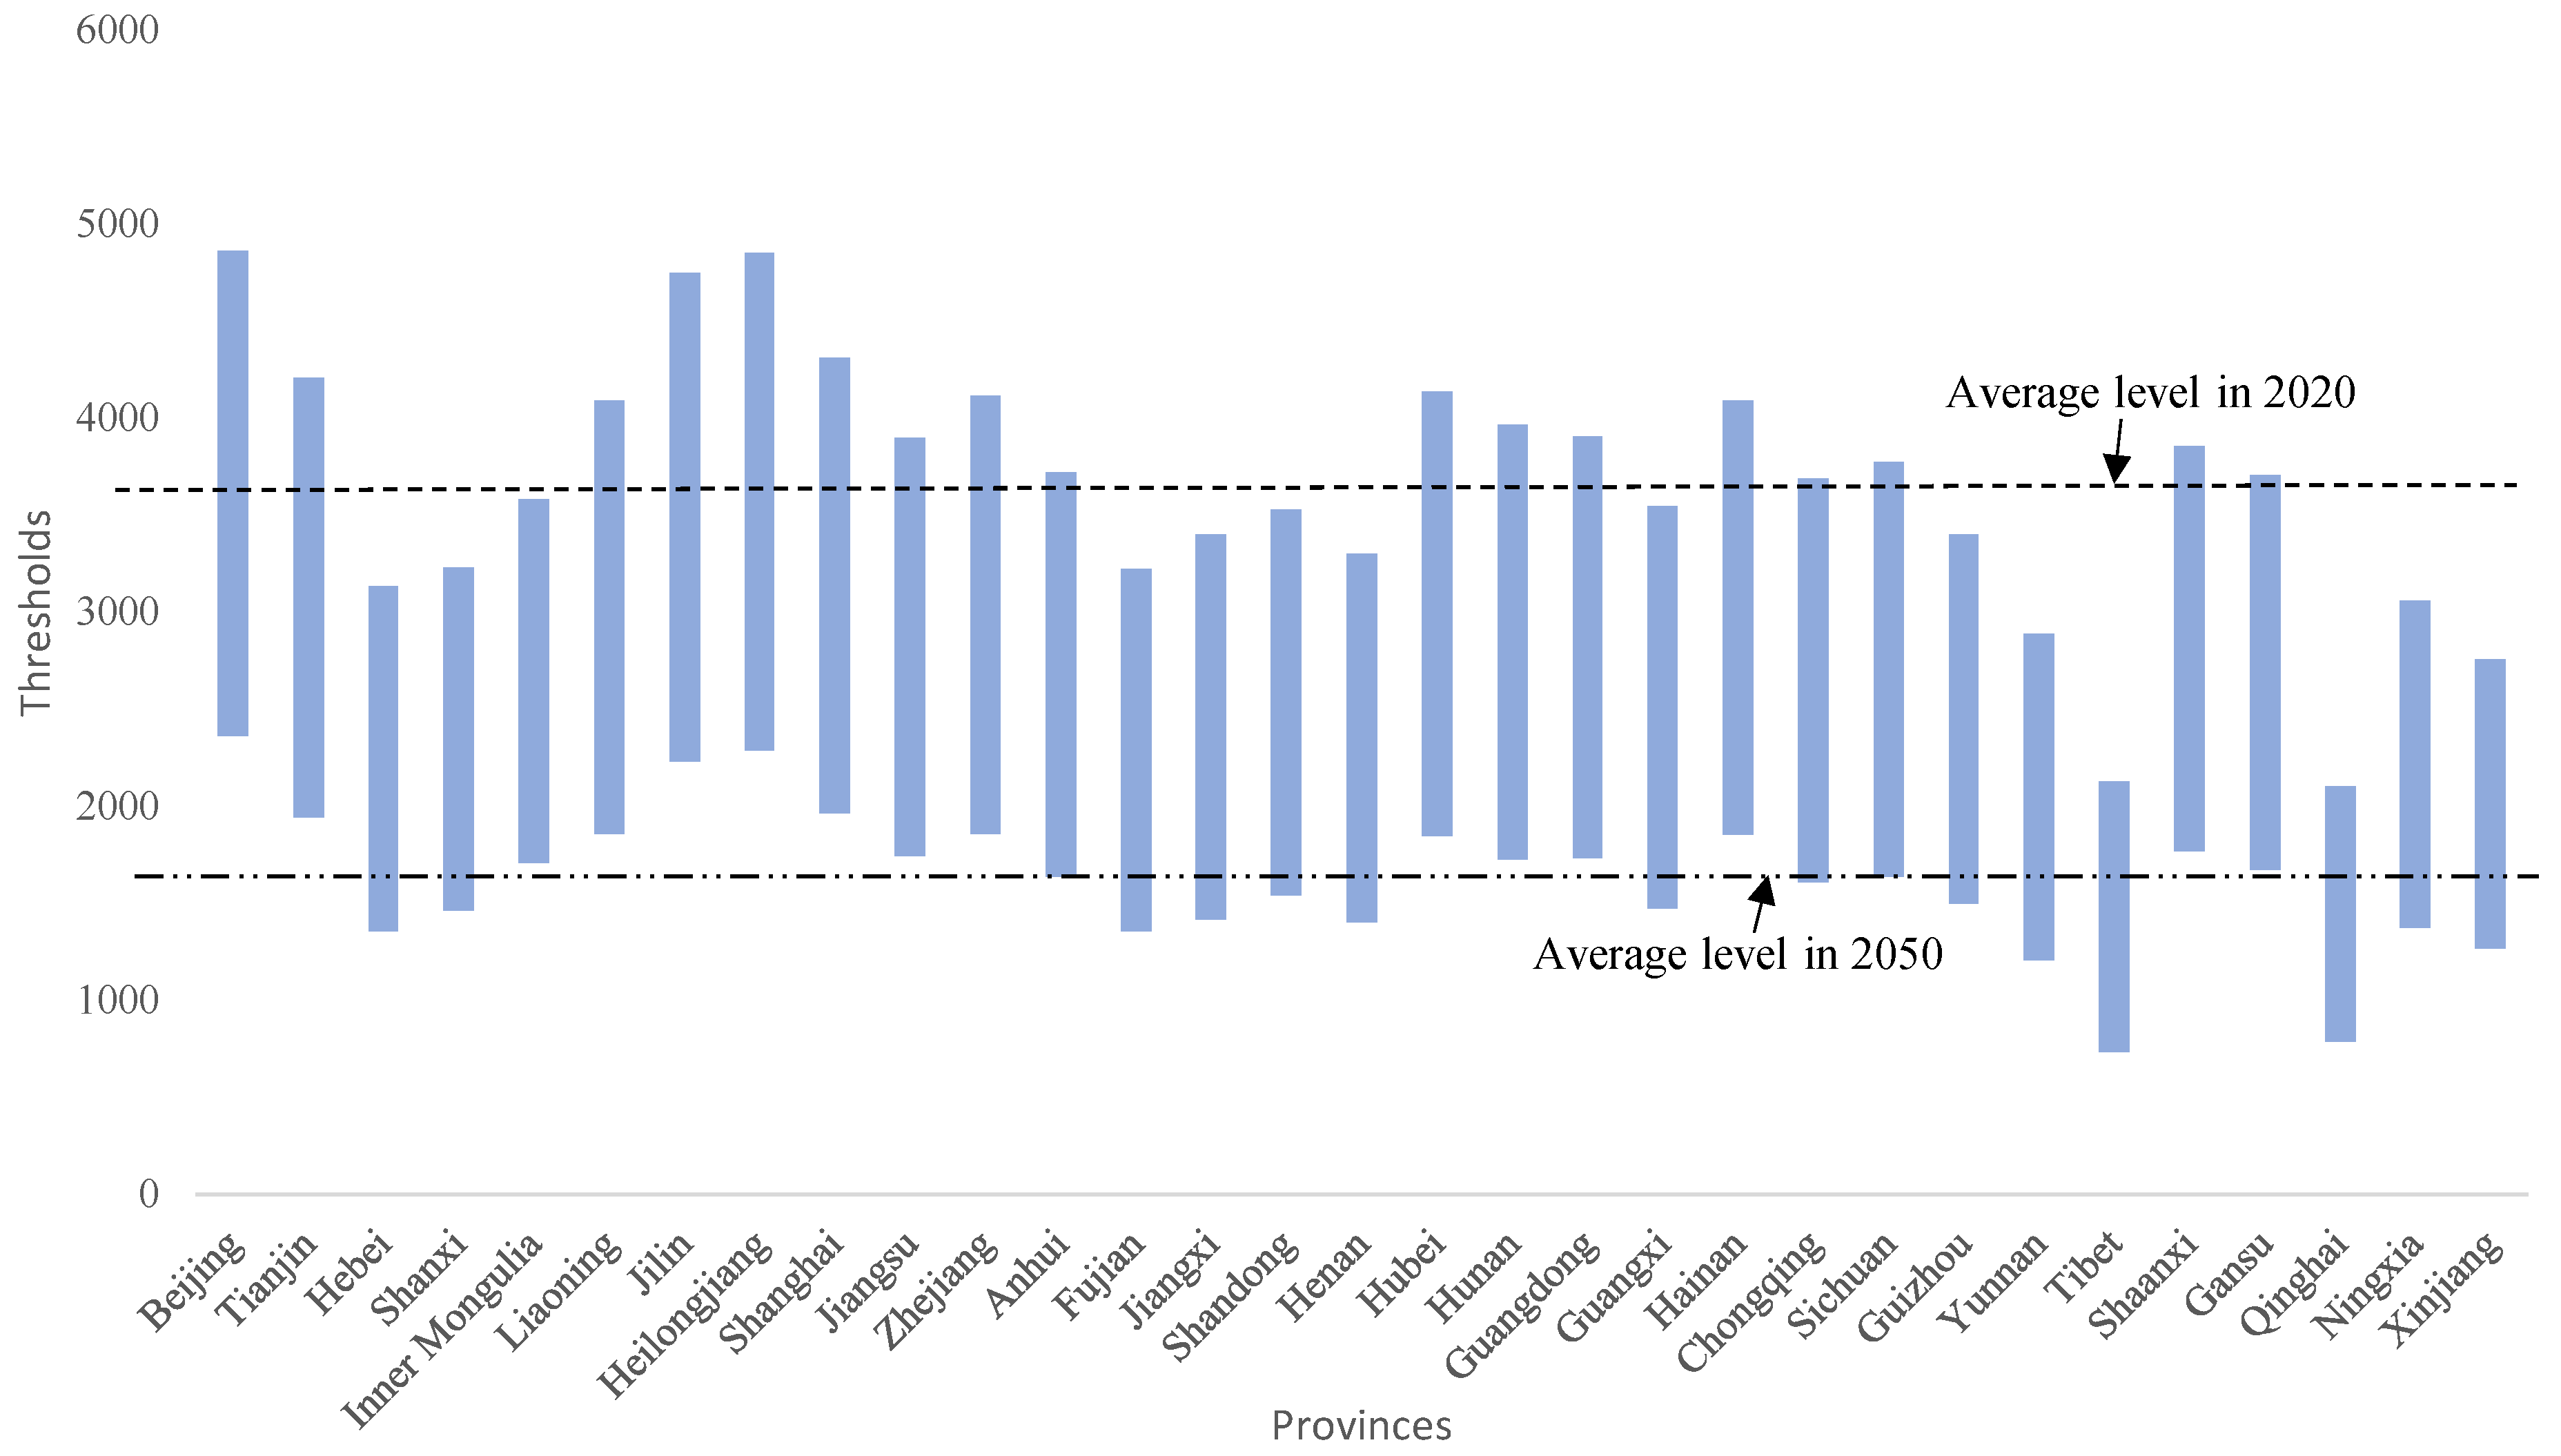
The technical indicators were shown in Table 2, and the remaining lifetime was set as 5 years. Based on the recovery rate of the residual value rate as 0.2, the national average critical values of the elimination path will increase from 1874 yuan/t CO2 in 2020 to 4509 yuan/t CO2 in 2050, which are much higher than the synchronous carbon price. The internals of the thresholds for all provinces from 2020 to 2050 were depicted in Figure 3. According to Figure 3, the elimination decision is not applicable for any province when additional policy regulation is absent. Heilongjiang, Jilin, Beijing, Tianjin and Liaoning have the highest thresholds, while Qinghai, Tibet, Xinjiang and Yunnan find it relatively easier to adopt the elimination decision. Combined with the results of Section 4.1, it is found that provinces adopting CCUS early will prefer not to follow the elimination path, and vice versa.
4.3. Development Potential Evaluation of Coal Power
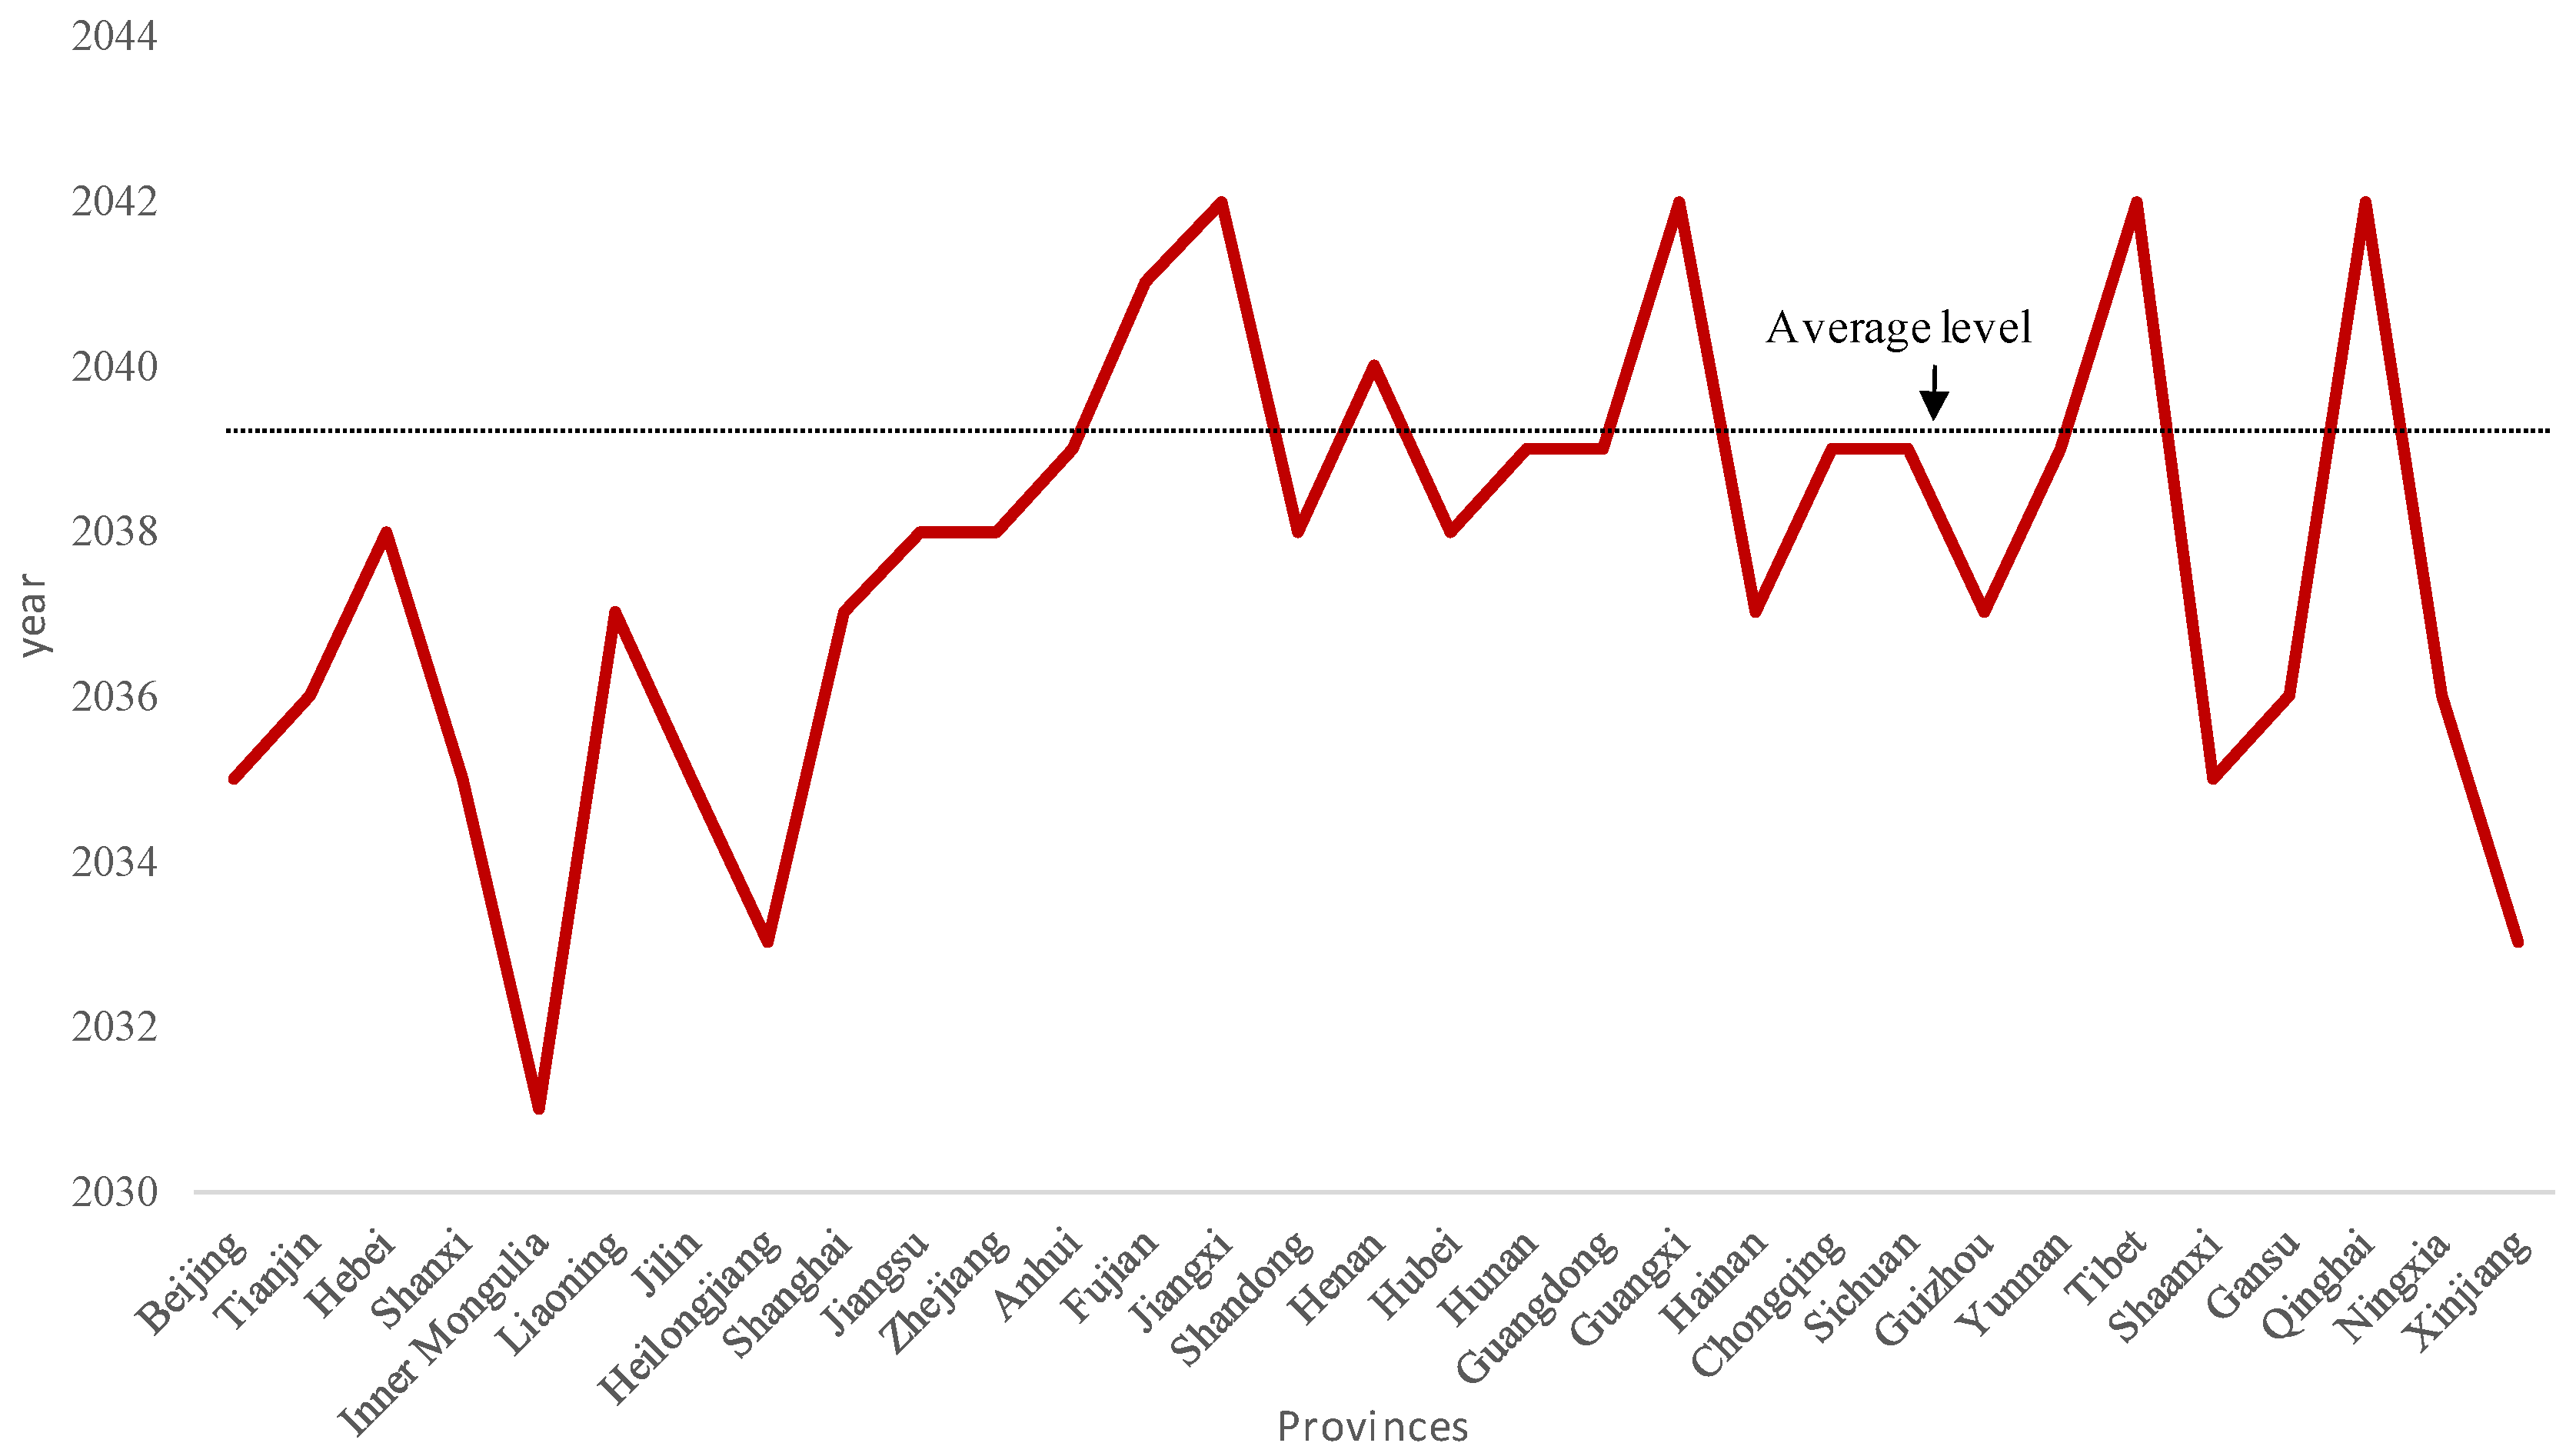
The EVs of the coal power enterprises in different provinces were simulated in this section in the context of China’s ETS. The CCUS device is feasible to reduce the carbon cost of coal power plants in the future. The investment decision of simultaneously installing the CCUS device on new coal power units can be considered as a special case of the upgrading decision where the lifetime is full (40 years). As shown in Figure 4, the critical time to achieve the investment decision is between 2031 (Inner Mongolia) to 2042 (Jiangxi, Guangxi, Tibet and Qinghai). Such results were consistent with those in Section 4.1.
The future profitability of coal power for each province during the studied period was evaluated. Due to the fact that all provinces were estimated to install CCUS on new coal power plants during the studied period, the results of the revenues before and after adopting CCUS were integrated at the points when the thresholds were reached. Results are shown in Figure 5, the bars and lines represent the range and growth rates of the EVs of coal power generation units in each province from 2021 to 2050. The highest EVs are achieved in Heilongjiang, followed by Jilin, Beijing, Shanghai and Tianjin. By contrast, Qinghai has the lowest value for this indicator, followed by Tibet, Xinjiang, Yunnan and Fujian. Due to the EVs of coal power plants being significantly influenced by the initial values and the regional power price and coal price, the growth rate was more suitable to reflect the potential of coal power in each province. Qinghai had the highest growth rate of EVs, followed by Tibet, Fujian and Hebei. In contrast, the development potential of coal power for Heilongjiang and Jilin was limited. Combined with the results presented in Figure 4, it can be seen that the correlation between the potential to develop coal power units and the willingness to adopt the CCUS device for Chinese provinces was not significant.
4.4. Provincial Low-Carbon Transition Paths of Coal Power
In this section, the provincial development trend of coal power in the context of China’s ETS was comprehensively evaluated from the perspectives of eliminating backward capacity, adopting CCUS on existing units and investing in new coal power capacity. Results showed that the pressure from carbon cost was insufficient to stimulate the elimination of high carbon-intensive coal power capacity. Therefore, the transition paths of provincial coal power were distinguished by the other two aspects. Based on the mid values of the thresholds for adopting CCUS and the growth rate of the EVs, four paths were laid out, as shown in Figure 6.
The first path was to continue installing coal power capacity without CCUS. Provinces with high thresholds to adopt CCUS and that have potential to develop coal power were assembled in this path, including Fujian, Jiangxi, Henan, Guangxi and Tibet. On this basis, provinces following the second path will develop coal power with CCUS, which includes Hebei, Shanxi, Shandong, Guizhou, Ningxia and Xinjiang. By contrast, the third branch, including Beijing, Tianjin, Inner Mongolia, Liaoning, Jilin, Heilongjiang, Shanghai, Jiangsu, Zhejiang, Hainan, Shaanxi and Gansu, will also maintain the present coal power capacity and install CCUS on them. Additionally, the importance of coal power will decline in Anhui, Hubei, Hunan, Guangdong, Chongqing, Sichuan, Yunnan and Qinghai and CCUS was not applicable for these provinces.
5. Discussion
The potential contribution of China’s ETS for the low-carbon transition of coal power for each province of China was analyzed. Based on the experience of the EU’s ETS, there will be an unpredictable jump in the carbon price. Apart from the free quota, a proportion of the carbon cost will also be added to the power price. As a result, the influence of the ETS on the low-carbon power transition is weakened. To demonstrate the full potential of the ETS, a special scenario is designed which removes the Poisson jump process of the carbon price and the participants undertake the full carbon cost ().
The national average thresholds for the paths of elimination and adopting CCUS are shown in Figure 7. The critical values for eliminating high carbon-intensive units in the new scenario can be sharply reduced to be less than 20% of that in the BAU scenario. Due to the fact that the thresholds were still higher than the carbon price over the same period, this decision remained unfeasible. By contrast, the critical time for the upgrading path would be brought forward from 2043 to 2030, and the thresholds will reduce greatly. As a result of this, 14 provinces were eligible to adopt the upgrading decision before 2031.
6. Conclusions and Policy Implications
This study analyzed the transition paths of coal power for each province of China in the context of the goals of carbon neutrality. Additionally, the potential effects and the associated mechanism of China’s ETS for this process were also evaluated. Due to the pressure of the carbon cost, the high carbon-intensive coal power units might be terminated before the end of their lifetime. With the development of decarbonization technology, CCUS is also optional for coal power capacity. Additionally, the development potential of coal power was also evaluated. On this basis, comparative analysis between different provinces was conducted.
Based on the indicators SR and PC, the importance and development trend of coal power for the provincial electricity mix was preliminarily analyzed. Following the ‘bottom-up’ direction, the transition path of coal power for each province was analyzed from the perspective of the low-carbon investment decision using the real-option method. Results showed that provinces which are the main producers of coal power (Inner Mongolia, Xinjiang and Heilongjiang) prefer to adopt CCUS technology earlier than regions having a high proportion of renewable power (Yunnan and Sichuan). In term of the elimination path, the critical conditions were not met in any province during the simulation process. Additionally, there was a mismatch between the development potential of coal power and the applicability of adopting CCUS at the provincial level. On this basis, four transition paths were identified and most provinces will install CCUS for their existing coal power capacity, while the gap in power supply will be filled by other generation approaches, mainly VRE.
To explore the potential of China’s ETS, the FC scenario was established which assumed that a jump in the carbon price can be prevented and that the carbon cost is fully undertaken by the emitters. In this scenario, the decision to adopt CCUS can be achieved more than ten years earlier than in the BAU mode. By contrast, the elimination path remained unfeasible, which meant additional policy instruments are needed to terminate high carbon-intensive plants in advance.
Additionally, some policy implications are provided as follows:
- (1)
- The fluctuation of the carbon price can significantly enlarge the thresholds for low-carbon investment decisions. The government of China should maintain the stability of the carbon price through the establishment of an efficient management system. Policy intervention is also optional at the current stage of the ETS.
- (2)
- The allocation policy of the free quota is important to promote the utilization of CCUS through improving the cost perception of coal power plants. The allocation plan should take the goals of carbon reduction, the development stage of the ETS, as well as the composition of the participants into consideration.
- (3)
- The coal power plants equipped with CCUS can supply electricity with high stability and low carbon intensity, which is not in contradiction with the goal of carbon neutrality. Due to the regional heterogeneity in the future development paths of coal power among the domestic provinces, the government of China should formulate differentiated policies to achieve a comprehensive low-carbon transition.
Several further aspects remain outside the scope of this study. The allocation plan for the free quota, including the Grandfathering and Industrial Benchmark methods, is important for understanding the impact of the ETS on low-carbon investment decisions, which can be absorbed into the model. In addition, comparison analysis of competitiveness between coal power with CCUS and renewable power (wind and solar) under the carbon emission trading scheme can be conducted in the future.
Author Contributions
Conceptualization, F.L.; methodology, J.X. and X.D.; software, X.H. and Y.M.; writing—original draft preparation, F.L.; writing—review and editing, T.L.; funding acquisition, F.L. and T.L. All authors have read and agreed to the published version of the manuscript.
Funding
This research was funded by the National Natural Science Foundation of China (Grant Nos. 72004218 and 72074212), the China Postdoctoral Science Foundation (Grant No. 2022M710049) and the Fundamental Research Funds for the Central Universities (Grant No. 2021YCPY0112).
Institutional Review Board Statement
Not applicable.
Informed Consent Statement
Not applicable.
Data Availability Statement
Not applicable.
Conflicts of Interest
The authors declare no conflict of interest.
References
- IEA. Key World Energy Statistics. Available online: https://www.iea.org/statistics/ (accessed on 8 July 2018).
- Dagoumas, A.S.; Polemis, M.L. Carbon pass-through in the electricity sector: An econometric analysis. Energy Econ. 2020, 86, 104621. [Google Scholar] [CrossRef]
- Wang, D.; Liu, Y.; Wang, Y.; Shi, X.; Song, X. Allocation of coal de-capacity quota among provinces in China: A bi-level multi-objective combinatorial optimization approach. Energy Econ. 2020, 87, 104709. [Google Scholar] [CrossRef]
- Li, X.; Yao, X. Can energy supply-side and demand-side policies for energy saving and emission reduction be synergistic?—A simulated study on China’s coal capacity cut and carbon tax. Energy Policy 2020, 138, 111232. [Google Scholar] [CrossRef]
- Shi, X.; Rioux, B.; Galkin, P. Unintended consequences of China’s coal capacity cut policy. Energy Policy 2018, 113, 478–486. [Google Scholar] [CrossRef]
- Chen, H.; Wang, C.; Ye, M. An uncertainty analysis of subsidy for carbon capture and storage (CCS) retrofitting investment in China’s coal power plants using a real-options approach. J. Clean. Prod. 2016, 137, 200–212. [Google Scholar] [CrossRef]
- Morris, J.; Paltsev, S.; Ku, A.Y. Impacts of China’s emissions trading schemes on deployment of power generation with carbon capture and storage. Energy Econ. 2019, 81, 848–858. [Google Scholar] [CrossRef]
- Xu, L.; Zhang, S.; Yang, M.; Li, W.; Xu, J. Environmental effects of China’s solar photovoltaic industry during 2011–2016: A life cycle assessment approach. J. Clean. Prod. 2018, 170, 310–329. [Google Scholar] [CrossRef]
- Zhou, S.; Wang, Y.; Zhou, Y.; Clarke, L.E.; Edmonds, J.A. Roles of wind and solar energy in China’s power sector: Implications of intermittency constraints. Appl. Energy 2018, 213, 22–30. [Google Scholar] [CrossRef]
- Wang, H.; Chen, Z.; Wu, X.; Nie, X. Can a carbon trading system promote the transformation of a low-carbon economy under the framework of the porter hypothesis?—Empirical analysis based on the PSM-DID method. Energy Policy 2019, 129, 930–938. [Google Scholar] [CrossRef]
- Višković, V.; Chen, Y.; Siddiqui, A.S. Implications of the EU emissions trading system for the South-East Europe regional electricity market. Energy Econ. 2017, 65, 251–261. [Google Scholar] [CrossRef] [Green Version]
- Hu, Y.; Ren, S.; Wang, Y.; Chen, X. Can carbon emission trading scheme achieve energy conservation and emission reduction? Evidence from the industrial sector in China. Energy Econ. 2019, 85, 104590. [Google Scholar] [CrossRef]
- Weng, Q.; Xu, H. A review of China’s carbon trading market. Renew. Sustain. Energy Rev. 2018, 91, 613–619. [Google Scholar] [CrossRef]
- Yuyin, Y.; Jinxi, L. The effect of governmental policies of carbon taxes and energy-saving subsidies on enterprise decisions in a two-echelon supply chain. J. Clean. Prod. 2018, 181, 675–691. [Google Scholar] [CrossRef]
- Kirat, D.; Ahamada, I. The impact of the European Union emission trading scheme on the electricity-generation sector. Energy Econ. 2011, 33, 996–1003. [Google Scholar] [CrossRef]
- Lirong, Z.; Yakun, L.; Zhijie, J. Impact of carbon allowance allocation on power industry in China’s carbon trading market: Computable general equilibrium based analysis. Appl. Energy 2018, 229, 814–827. [Google Scholar]
- Li, W.; Jia, Z. The impact of emission trading scheme and the ratio of free quota: A dynamic recursive CGE model in China. Appl. Energy 2016, 174, 1–14. [Google Scholar] [CrossRef]
- Gao, T.; Shen, L.; Shen, M.; Liu, L.; Chen, F.; Gao, L. Evolution and projection of CO2 emissions for China’s cement industry from 1980 to 2020. Renew. Sustain. Energy Rev. 2017, 74, 522–537. [Google Scholar] [CrossRef]
- Kim, D.H.; Suen, Y.B.; Lin, S.C. Carbon dioxide emissions and trade: Evidence from disaggregate trade data. Energy Econ. 2019, 78, 13–28. [Google Scholar] [CrossRef]
- Aatola, P.; Ollikainen, M.; Toppinen, A. Impact of the carbon price on the integrating European electricity market. Energy Policy 2013, 61, 1236–1251. [Google Scholar] [CrossRef]
- Teixidó, J.; Verde, S.F.; Nicolli, F. The impact of the EU Emissions Trading System on low-carbon technological change: The empirical evidence. Ecol. Econ. 2019, 164, 106347. [Google Scholar] [CrossRef]
- Uddin, N.; Holtedahl, P. Emission trading schemes–avenues for unified accounting practices. J. Clean. Prod. 2013, 52, 46–52. [Google Scholar] [CrossRef]
- Anke, C.P.; Hobbie, H.; Schreiber, S.; Mst, D. Coal phase-outs and carbon prices: Interactions between EU emission trading and national carbon mitigation policies. Energy Policy 2020, 144, 111647. [Google Scholar] [CrossRef]
- Levin, T.; Kwon, J.; Botterud, A. The long-term impacts of carbon and variable renewable energy policies on electricity markets. Energy Policy 2019, 131, 53–71. [Google Scholar] [CrossRef]
- Verbruggen, A.; Laes, E.; Woerdman, E. Anatomy of emissions trading systems: What is the EU ETS? Environ. Sci. Policy 2019, 98, 11–19. [Google Scholar] [CrossRef]
- Müsgens, F. Equilibrium prices and investment in electricity systems with CO2-emission trading and high shares of renewable energies. Energy Econ. 2018, 86, 104107. [Google Scholar] [CrossRef] [Green Version]
- Fan, J.H.; Todorova, N. Dynamics of China’s carbon prices in the pilot trading phase. Appl. Energy 2017, 208, 1452–1467. [Google Scholar] [CrossRef] [Green Version]
- Fang, G.; Tian, L.; Fu, M.; Sun, M.; Du, R.; Liu, M. Investigating carbon tax pilot in YRD urban agglomerations—Analysis of a novel ESER system with carbon tax constraints and its application. Appl. Energy 2017, 194, 635–647. [Google Scholar] [CrossRef]
- Song, Y.; Liang, D.; Liu, T.; Song, X. How China’s current carbon trading policy affects carbon price? An investigation of the Shanghai Emission Trading Scheme pilot. J. Clean. Prod. 2018, 181, 374–384. [Google Scholar] [CrossRef]
- Qin, Q.; Liu, Y.; Li, X.; Li, H. A multi-criteria decision analysis model for carbon emission quota allocation in China’s east coastal areas: Efficiency and equity. J. Clean. Prod. 2017, 168, 410–419. [Google Scholar] [CrossRef]
- Wu, J.; Guo, Q.; Yuan, J.; Lin, J.; Xiao, L.; Yang, D. An integrated approach for allocating carbon emission quotas in China’s emissions trading system. Resour. Conserv. Recycl. 2019, 143, 291–298. [Google Scholar] [CrossRef]
- Kong, Y.; Zhao, T.; Yuan, R.; Chen, C. Allocation of carbon emission quotas in Chinese provinces based on equality and efficiency principles. J. Clean. Prod. 2019, 211, 222–232. [Google Scholar] [CrossRef]
- Jiang, J.; Xie, D.; Ye, B.; Shen, B.; Chen, Z. Research on China’s cap-and-trade carbon emission trading scheme: Overview and outlook. Appl. Energy 2016, 178, 902–917. [Google Scholar] [CrossRef]
- Mo, J.-L.; Agnolucci, P.; Jiang, M.-R.; Fan, Y. The impact of Chinese carbon emission trading scheme (ETS) on low carbon energy (LCE) investment. Energy Policy 2016, 89, 271–283. [Google Scholar] [CrossRef]
- Hasan, M.R.; Roy, T.C.; Daryanto, Y.; Wee, H.-M. Optimizing inventory level and technology investment under a carbon tax, cap-and-trade and strict carbon limit regulations. Sustain. Prod. Consum. 2020, 25, 604–621. [Google Scholar] [CrossRef]
- Zhang, M.M.; Wang, Q.; Zhou, D.; Ding, H. Evaluating uncertain investment decisions in low-carbon transition toward renewable energy. Appl. Energy 2019, 240, 1049–1060. [Google Scholar] [CrossRef]
- Liu, J.F.; Zhang, Q.; Li, H.L.; Chen, S.Y.; Teng, F. Investment decision on carbon capture and utilization (CCU) technologies—A real option model based on technology learning effect. Appl. Energy 2022, 322, 119514. [Google Scholar] [CrossRef]
- Amram, M.; Kulatilaka, N. Managing Strategic Investment in an Uncertain World; Harvard Business School Press: Boston, MA, USA, 2000; ISBN 0875848451. [Google Scholar]
- Kester, W.C. Today’s options for tomorrow’s growth. Harv. Bus. Rev. 1984, 62, 153–160. [Google Scholar]
- National Energy Administration of China. National Energy Statistics. Available online: http://www.nea.gov.cn/2018-01/24/c_136920159.htm (accessed on 20 July 2018).
- Wu, Y.; Xiao, X.; Song, Z. Competitiveness analysis of coal industry in China: A diamond model study. Resour. Policy 2017, 52, 39–53. [Google Scholar] [CrossRef]
- Zhang, Q.; Chen, W. Modeling China’s interprovincial electricity transmission under low carbon transition. Appl. Energy 2020, 279, 115571. [Google Scholar] [CrossRef]
- Budinis, S.; Krevor, S.; Mac Dowell, N.; Brandon, N.; Hawkes, A. An assessment of CCS costs, barriers and potential. Energy Strateg. Rev. 2018, 22, 61–81. [Google Scholar] [CrossRef]
- Zhu, L.; Fan, Y. Modelling the investment in carbon capture retrofits of pulverized coal-fired plants. Energy 2013, 57, 66–75. [Google Scholar] [CrossRef]
- Yao, X.; Fan, Y.; Xu, Y.; Zhang, X.; Zhu, L.; Feng, L. Is it worth to invest?—An evaluation of CTL-CCS project in China based on real options. Energy 2019, 182, 920–931. [Google Scholar] [CrossRef]
- Fuss, S.; Szolgayova, J.; Obersteiner, M.; Gusti, M. Investment under market and climate policy uncertainty. Appl. Energy 2008, 85, 708–721. [Google Scholar] [CrossRef]
- Liu, D. The Economics Models of the Geometric Brownian Motion with Poissonian Jumps; Harbin Engineering University: Harbin, China, 2008. [Google Scholar]
- Zhiming, W.; Zhiyong, H.; Fangzhong, X. The economic model of the geometric Brownian motion with Poisson jumps. J. Math. 2007, 27, 93–95. [Google Scholar]
- Pindyck, M.R.S. The Learning Curve and Optimal Production Under Uncertainty. Rand J. Econ. 1989, 20, 331–343. [Google Scholar]
- Gazheli, A.; van den Bergh, J. Real options analysis of investment in solar vs. wind energy: Diversification strategies under uncertain prices and costs. Renew. Sustain. Energy Rev. 2018, 82, 2693–2704. [Google Scholar] [CrossRef] [Green Version]
- Dixit, A.K.; Dixit, R.K.; Pindyck, R.S. Investment Under Uncertainty; Princeton University Press: Princeton, NJ, USA, 1994; ISBN 0691034109. [Google Scholar]
- British Petroleum. Global Energy Statistical Yearbook 2019. Available online: https://www.bp.com.cn/zh_cn/china/home/news/reports/statistical-review-2021.html (accessed on 5 June 2022).
- Loncar, D.; Milovanovic, I.; Rakic, B.; Radjenovic, T. Compound real options valuation of renewable energy projects: The case of a wind farm in Serbia. Renew. Sustain. Energy Rev. 2017, 75, 354–367. [Google Scholar] [CrossRef]
- Rubin, E.S.; Azevedo, I.M.L.; Jaramillo, P.; Yeh, S. A review of learning rates for electricity supply technologies. Energy Policy 2015, 86, 198–218. [Google Scholar] [CrossRef]
- Fout, T.; Zoelle, A.; Keairns, D.; Turner, M.; Woods, M.; Kuehn, N.; Shah, V.; Chou, V.; Pinkerton, L. Cost and Performance Baseline for Fossil Energy Plants Volume 1a: Bituminous Coal (PC) and Natural Gas to Electricity Revision 3; National Energy Technology Laboratory (NETL): Pittsburgh, PA, USA; Morgantown, WV, USA, 2015. [Google Scholar]
- Varro, L.; Ha, J. Projected Costs of Generating Electricity, 2015th ed.; Organisation for Economic Co-operation and Development/International Energy Agency: Paris, France; Issy-les-Moulineaux, France, 2015. [Google Scholar]
Figure 1.
Role of coal power in the provinces of China.

Figure 2.
Ranges and critical time of the upgrading path for each province.

Figure 3.
Ranges of the thresholds for the elimination path for each province.

Figure 4.
Thresholds for adopting CCUS in new coal power units.

Figure 5.
Ranges and growth rates of the EVs of coal power plants for each province.

Figure 6.
Suggested transition paths of coal power for each province.

Figure 7.
Thresholds for elimination and upgrading paths in the FC scenario.


Table 1.
Indicator setting for China’s ETS.
| Description | Symbol | Scenarios | |
|---|---|---|---|
| BAU | FC | ||
| Drift rate of carbon price | 0.03 | 0.05 | |
| Volatility of carbon price | 0.03 | 0.05 | |
| Jumping range of carbon price | 0.2 | 0 | |
| Jumping possibility of carbon price | −0.3 | −0.5 | |
| Free quote rate | 0.3 | 0 | |
| Delivering rate of carbon cost | 0.5 | 0 | |
| Annual reduction of the operation hours of the coal power plants without CCUS | 30 | 30 | |
Table 2.
Default values of related parameters.
| Description | Symbol | Unit | Value | |
|---|---|---|---|---|
| Price [52] | Drift rate of electricity price | - | 0.02 | |
| Drift rate of coal price | - | 0.01 | ||
| Discount rate [50,53] | Discount rate | - | 0.06 | |
| Learning effect [49,54] | Learning rate of CCUS | - | 0.03 | |
| Increasing rate of CCUS | - | 1.05 | ||
| Technical indicators [55] | Emission rate of coal plants without CCUS | tCO2/MWh | 0.75 | |
| Emission rate of coal plants with CCUS | tCO2/MWh | 0.075 | ||
| Generation efficiency of coal plants without CCUS | t/MWh | 0.51 | ||
| Generation efficiency of coal plants with CCUS | t/MWh | 0.39 | ||
| Lifetime [56] | Overall lifetime of fossil power plants | year | 40 | |
| Costs [55,56] | Unit acquisition cost of coal power plants | yuan/MW | 4,999,950 | |
| Unit acquisition cost of CCUS device | yuan/MW | 3,749,963 | ||
| Unit maintenance cost of coal power plants without CCUS | yuan/MW·year | 25 | ||
| Unit maintenance cost of coal power plants with CCUS | yuan/MW·year | 71 |
Publisher’s Note: MDPI stays neutral with regard to jurisdictional claims in published maps and institutional affiliations. |
© 2022 by the authors. Licensee MDPI, Basel, Switzerland. This article is an open access article distributed under the terms and conditions of the Creative Commons Attribution (CC BY) license (https://creativecommons.org/licenses/by/4.0/).
Share and Cite
MDPI and ACS Style
Liu, F.; Lv, T.; Meng, Y.; Hou, X.; Xu, J.; Deng, X. Low-Carbon Transition Paths of Coal Power in China’s Provinces under the Context of the Carbon Trading Scheme. Sustainability 2022, 14, 9657. https://doi.org/10.3390/su14159657
AMA Style
Liu F, Lv T, Meng Y, Hou X, Xu J, Deng X. Low-Carbon Transition Paths of Coal Power in China’s Provinces under the Context of the Carbon Trading Scheme. Sustainability. 2022; 14(15):9657. https://doi.org/10.3390/su14159657
Chicago/Turabian StyleLiu, Feng, Tao Lv, Yuan Meng, Xiaoran Hou, Jie Xu, and Xu Deng. 2022. "Low-Carbon Transition Paths of Coal Power in China’s Provinces under the Context of the Carbon Trading Scheme" Sustainability 14, no. 15: 9657. https://doi.org/10.3390/su14159657
Note that from the first issue of 2016, this journal uses article numbers instead of page numbers. See further details here.