
Transport Preferences of City Residents in the Context of Urban Mobility and Sustainable Development


1
Faculty of Economics and Transport Engineering, Maritime University of Szczecin, 70-500 Szczecin, Poland
2
Institute of Mathematics, Physics and Chemistry, Maritime University of Szczecin, 70-500 Szczecin, Poland
*
Author to whom correspondence should be addressed.
Energies 2022, 15(15), 5692; https://doi.org/10.3390/en15155692
Submission received: 30 June 2022
/
Revised: 1 August 2022
/
Accepted: 3 August 2022
/
Published: 5 August 2022
(This article belongs to the Special Issue The Challenge for Creating a Smart & Sustainable City through Logistics, Transportation Management, and Tourism Management)
Abstract
:The article focuses on the transport preferences of the inhabitants of a medium-sized city in the context of changing urban mobility and sustainable development. It fills the gap in the literature researching the changing communication behavior of the inhabitants of a given city. The main purpose of this article is to identify and analyze the preferred means of movement for inhabitants of a medium-sized city in Central and Eastern Europe. The research area was the city of Szczecin, Poland. The research was carried out using the following research methods: literature review, analysis of legal acts and documents, case study. The research material was collected using an anonymous questionnaire based on a proprietary survey made available to the inhabitants of the largest city of north-western Poland, Szczecin, in the GOOGLE browser in the period 17 May 2019–1 April 2021. The multiple-response contingency tables, chi-square test of independence and non-parametric U Mann–Whitney and Kruskal–Wallis tests were used for study development. The conducted scientific research showed that, when determining the relationship between the method and the destination, the respondents most often chose a car or on-foot commuting in all of the surveyed destinations. The research results increase the level of knowledge regarding residents’ needs in terms of urban mobility and the development of Szczecin’s transport system. They can be used in the rational actions of local authorities aiming to improve residents’ the quality of life in the context of the sustainable development of city transport.
1. Introduction
Determining the communication preferences of residents regarding the way they move around the city is an important element in the cultivation of transport systems in cities. These, in turn, are increasingly burdened, and the accompanying congestion and their negative effects are a visible barrier to the socio-economic development of the urbanized areas. Often limited by buildings, urban space is not conducive to the development of its inhabitants’ transport preferences. This reduces their activity and prevents the creation of optimal conditions in terms of access to various functional areas of the city, including the workplace, study, medical assistance/healthcare, culture or worship. According to the transport policy of the European Union, the need to ensure growth in the transport sector and support urban mobility was emphasized. The White Paper on Transport Policy also considers that urban development should be accompanied by a simultaneous reduction in greenhouse gas emissions [1]. The transport sector emits 14% of greenhouse gases, 79.5% of which come from road transport [2]. This constitutes 39% of nitrogen oxide emissions and 11% of PM2.5 emissions in Europe. The sector is responsible for 28% of the world’s primary energy consumption [3], making it one of the main and most energy-intensive sectors of the economy [4]. The total external costs of transport, including CO2 emissions, noise, traffic accidents and congestion in urban areas in the European Union, amount to EUR 230 billion [5]. Therefore, less than a decade ago, the European Commission presented detailed recommendations on sustainable transport, with an emphasis on meeting the needs of urban mobility, which will provide appropriate living and development conditions [6]. The European Commission in the Green Paper [7] identified the main challenges in the development of urban transport, which are as follows:
- Improving traffic flow in cities by optimizing the use of private cars, promoting active mobility (walking, cycling), suistainable commercial transport;
- Improving accessibility and integration of urban transport, including sustainable spatial planning;
- Increasing the use of Intelligent Transport Systems (ITS) services in urban transport;
- Reducing the negative impact of transport on the environment by using modern technologies and alternative energy sources, promoting eco-driving and limiting car traffic;
- Improving the safety and reliability of urban transport;
- Changing transport behavior and the way that transport is perceived by urban communities.
Studies conducted by the OECD and the European Conference of Transport Ministers on different congestion reduction strategies have shown a greater need to support collective transport and non-motorized modes of transport (walking, cycling) and the implementation of traffic management strategies to counteract traffic congestion [8]. The consequence of these postulates in many European cities, including Polish ones (Warsaw, Kraków, Wrocław, Poznań, Szczecin, etc.), is an increase in the competitiveness of collective transport compared to individual transport through the use of a number of tools. The organizational ones consist of preferences for public transport vehicles in the form of priorities at junctions, separated traffic lanes, tracks, expansion of the connection system, attractive transport hubs, stops, and investments in passenger information [9,10,11], as well as the possibility of using travel planners, and quick access to public transport timetables. Passengers in selected applications have the option of purchasing a ticket or checking the validity of a season ticket. The attractiveness of collective transport is emphasized in terms of travel safety, ticket cost, the condition and age of the rolling stock, accessibility for disabled people, the cleanliness of vehicles and stop infrastructure, punctuality, reliability, and accessibility—that is, the quality of transport services [12,13]. With an eye to improving the flow of traffic in cities and promoting active mobility by walking, cycling, scooters or electric scooters, users also have the support of various applications. Using these, they can easily check the rental points of their chosen means of transport. Identification and analysis of residents’ transport preferences is an important element of the city’s transport policy, which is focused on the sustainable mobility of its residents. Knowledge of the actual behavior and needs of residents in terms of mobility is crucial to ensure a functioning urban transport system and its improvement.
The main purpose of the study described in the article was to identify and analyze the preferred means of movement of inhabitants of a medium-sized city in east-central Europe. The research area was the city of Szczecin, Poland. The research was carried out using the following research methods: literature review, analysis of legal acts and documents, case study. The research material was collected using an anonymous survey. The studies presented in the article refer to different age groups, considering their different means of social involvement, including work, school, shopping, entertainment, hospital. The analyses concern the preferences and limitations in choosing means of moving in the city of Szczecin, depending on the destination and motivation.
The article is structured as follows. Section 2 presents a literature review, including various concepts and definitions of urban mobility, together with elements of sustainable development implemented in urban areas. Section 3 presents the materials and methods the authors used to achieve the purpose of the study. It also characterizes the research area in detail. Section 4 presents the results of the survey research and analyses, for which multiple-response contingency tables, the chi-square test of independence, and the nonparametric Mann–Whitney and Kruskal–Wallis U tests were used. Discussion, findings, and recommendations for future research are included in Section 5. The document finishes in Section 6, where the conclusions are given.
2. Literature Review
2.1. Communication Preferences
Preference means placing something above something else. It is also choosing something from various options [14,15]. In this case, communication preferences mean the chosen means of transport, maybe even a penchant, among others that are available in a given area. Preferences, also interpreted as communication behaviors, refer to short- or long-term social decisions [16]. These decisions are made not only as part of development programs or regional strategies [17], but also concern the specific social groups to which individual users of collective and individual transport belong [18]. Daily decisions are supported by preferences regarding the chosen means of transport, and are also influenced by socio-demographic trends [19] and changes in economic conditions [20]. The literature describes research regarding preferences in terms of transport using various methods [21] and in different contexts. Scientists also propose the use of appropriate models in this area. Fiorio et al. propose prohibiting models from analyzing the satisfaction of urban transport users in 33 European cities. According to them, transport users’ level of satisfaction is higher for a single operator than for many providers of transport services [22]. Al-Salih et al. have studied the preferences of transport users using logit models. They showed that the travel time and purpose of the respondents are the most decisive factors influencing the chosen means of transport [23]. Studying the preferences of urban transport users is also related to the broader notion of urban mobility and available ITS technologies.
2.2. Urban Mobility and Technologies, That Conducive It
We increasingly come across the concept of mobility in the context of telecommunications or transport [24,25]. Everyone wants to be mobile thanks, to its availability via the Internet, telephone and, of course, convenient means of transport [26]. This is especially important in a city where frequent trips are accompanied by congestion [27]. Overall, mobility can be considered as “being able to reach all the places a person wants to go” [28].
When looking at transport issues, we can consider mobility as deliberately crossing space using all means of transport: motorized, non-motorized and on foot [29]. This can be measured by looking at the communication mobility of, defined by Madeyski as the number of journeys taken within a specified time per inhabitant of any designated area or population group, using all means of transport, including collective transport, individual transport or a mix of both [30]. Pilot studies on the communication behavior of the population in Poland in 2015 also included travel on foot [31].
The mobility of inhabitants may be influenced by many factors, including: the prices of goods and services, the wealth of the inhabitants and their needs, the offers and transport availability [32]. The most important is the level of wealth of the inhabitants and the prices of goods and services, which shape both the need for and accessibility of transport. The concept of accessibility should be considered in the context of economy and time, which allows for users to have the freedom required for them to choose their means of transport [33]. This can relate to private or public [34], and motorized or non-motorized transport. This, in turn, may be influenced by the attractiveness of the public transport offer, adapted to age, health and place of residence, or even free time, habits and environmental awareness. The type and frequency of transport needs can affect urban mobility, especially the purpose and length of the trip, as well as reliability and comfort. Therefore, the factor that determines social mobility is transport. Although, in cities, the range of choice regarding the manner of movement is much higher than in non-urban areas, it is advisable to undertake research on the level of satisfaction and social expectations with regard to whether urban residents’ need to move in various directions is satisfied, depending on the circumstances and purpose of the activity [35]. Based on the concept of mobility in the context of the everyday activities of city residents, one should refer to one of its dimensions, i.e., the ability of a given entity to move in space, and recognize that transport’s impact on communication mobility has a direct dimension, which leads to inhabitants’ reaching the travel destination, and an indirect dimension. This influences the economic growth regarding the inhabitants’ standard of living, professional and social activity, security, the availability of goods and services, the level of free time and social integration [36]. Inhabitants’ mobility levels also depend on the city’s location and geographic conditions [37]. Emerging megacities and metropolises, as well as the development of metropolitan areas and urban centers, will provide various offers of collective and individual transport [38,39].
Mobility patterns have been identified in scientific reports that reflect the daily travels of members of the community. They referenced the purpose, method, time, number and length of the journeys [40,41]. Other researchers, focusing on a relatively small sample of influential stakeholders, active at local or national levels, who share the same vision of sustainable urban mobility, interviewed these carefully defined stakeholders. These included the people who shape the transport policy of the largest Czech cities, with over 50 thousand residents, as well as smaller cities belonging, implementing the concept of sustainable urban mobility in the Czech Republic. Using the Q method [42], researchers identified the common perspectives of key stakeholders without the need to define their relative importance in the overall population [43].
To increase the residents’ mobility, various types of applications that are helpful when planning journeys were used. These included: Google Maps, Transportoid, Jakdojade, Moovit, Mobile MPK, E-traveler, myBus, Gdyprzyjedzie.pl. Most of the applications are available in the following systems: Android, iOS, Windows Phone [44]. These applications not only support public transport in the city, but also individual ecological transport (bicycles, scooters) and car transport, which is still a cause of congestion in road traffic.
2.3. The Car as the Dominant Mean of Transport
Of the various ways that people travel in cities, the car is still an important individual means of transport [45]. It plays an important role in spatial development and in shaping the spatial and functional structure of cities. This allows for fairly free movement, while ensuring comfort when traveling and achieving the planned goals. This allows for effective organization when commuting to work, extends the spheres of human and family activity, and allows people to spend their free time in an attractive way, as well as allowing them to travel to holiday destinations. Thus, it can be said that the car extends the sphere of human activity in two dimensions: in the spatial and temporal dimension, by allowing people to function at any time of day, as well as presenting the possibility of them moving in different directions. In Poland, the car has been a symbol of social position, prestige, high standards of living, and even luxury for many years. Many Polish residents cannot imagine their lives without a car. It is often a symbol of freedom and independence. Hence, as a means of movement, it significantly changes the spatial arrangement and functioning of cities. It can safely be said that it shapes the mobility of inhabitants, especially in relation to journeys from their place of residence to a particular destination (work, shopping, shopping centers) [46]. Hence, in the literature on the subject, attention is paid to the mutual relations between motorization and the mobility of residents using a car [47], as well as the driving role of motorization in this context [48]. This ongoing relationship is considered by looking at problems and processes such as [49,50]:
- Population mobility, including mobility as a necessity, will and right to move, and impact on the development of transport and road traffic;
- Development of the automotive industry and its consequences for medium-sized cities;
- Transport policy;
- Road transport in the context of urban ecology, spatial policy and development planning.
The relationship between mobility and motorization development is conditioned by the spatial development of cities, and encourages the population to buy a car and use this means of transport more and more. To establish the limits of the level of motorization, the number of cars per 1000 inhabitants was determined. The total for Europe is 560 passenger vehicles per 1000 inhabitants. In Poland, the number was 642 in 2019, but in 2020 it was 662 cars [51,52].
The highest level of motorization is recorded in the largest Polish cities. These cities include Poznań, Kraków, Łódź, Lublin and Kielce. Zero-emission vehicles in EU countries accounted for 1% in 2018, 1.9% in 2019, and 5.3% in 2020. In Poland, at the end of 2021, a total of 38,001 passenger cars and 1657 commercial electric vehicles were registered. Compared to 2020, the number of cars increased by 20,253 PZPM and PSPA units. At the end of December 2021, there were 38,001 electric passenger cars on Polish roads. Fully electric vehicles (BEVs) accounted for 49% (18,795 units); the remainder (51%) were plug-in hybrid electric vehicles (PHEV)—19,206 units. The number of electric mopeds and motorcycles is also growing; at the end of 2021, the total consisted of 10,650 units. Additionally, the number of hybrid passenger cars and vans increased to 325,136 units. At the end of last month, electric bus parks in Poland increased to 651 pieces. From January to December 2021, the electric bus fleet increased by 220 zero-emission vehicles [53].
Following the increase in the number of electric vehicles, the charging infrastructure is also developing. At the end of December 2021, there were 1932 publicly accessible charging stations for electric vehicles in Poland (3784 points). A total of 30% of them were fast DC charging stations and 70% were slow AC chargers, with a power less than or equal to 22 kW. In December 2021, 119 new, generally accessible charging stations (240 points) [54] were launched.
2.4. Sustainable Development of Urban Transport
When considering the frequency of car use, attention should be paid to the relationship between the level of development and the functionality and quality of urban public transport, as well as the level of environmental awareness and the degree of car use. Therefore, the network and functioning of public transport means that, in European cities such as Berlin, Vienna, London and even Paris, the car is not the most popular means of getting around the city. A similar situation is observed in Scandinavian countries, where the most common means of transport around the city is on foot and by bicycle. This may not only prove the existence of an extensive and universal public transport network, but most of all, a high level of environmental awareness that is also shaped by economic factors. In Western European cities, the excessive use of passenger cars is effectively deterred by the various charges for entering the city center and parking prices [55], which makes it necessary to switch from a car to public transport. The transformation towards sustainable mobility requires a paradigm change in transport planning. Studies of varying scope are still being undertaken on this issue [56,57]. The process of sustainable development planning must be comprehensive and integrated, considering all relevant goals, effects and options [58,59]. Intelligent Transport Systems (ITS) play an important role in road transport. They are a combination of information and communication technologies with transport infrastructure and vehicles to improve safety, increase the efficiency of transport processes and protect the natural environment. Transport telematics relates to the movement of people and goods using appropriate means of transport. In this field, modern telematics systems have gained particular importance in recent years [60]. They make it possible to influence the mobility processes of inhabitants of cities and entire agglomerations (movement of people and goods) in order to increase the efficiency of transport, improve safety and reduce the negative impact on the environment. They allow for the optimization of transport planning. In practice, they connect travelers, means of transport and transport infrastructure. Intelligent Transport Systems form the largest share of transport telematics. Therefore, the name Intelligent Transport Systems, instead of transport telematics, functions in the world. In a structural sense, these are treated as a subcategory of the field of transport engineering; however, in practice, the concept of ITS is often equated with this field [61].
The key function of telematics systems is information management, starting from its acquisition, through processing and distribution, to its transmission and use in various decision-making processes. ITS consists of three cooperating systems: intelligent road, intelligent vehicle, i.e., a vehicle equipped with devices that maintain continuous, especially wireless, information exchange with devices installed along transport routes, and an intelligent management center. In practice, transport telematics systems use various devices and applications: cellular networks and the Internet, radio communication systems, geographic databases, road databases, satellite navigation systems, road traffic monitoring devices, i.e., all sensors, detectors, cameras, radars, weather monitoring devices, and devices for transmitting data to the users of transport systems, variable message boards, etc. [62]. They are used to solve transport problems in cities, and are oriented to the needs of various user groups. They involve advanced technologies for the planning, management and supervision, control and implementation of intelligent vehicles and infrastructure.
In this way, ITS strengthens the positive features of transport, i.e., mobility and accessibility, while minimizing its negative impact on environmental pollution, energy consumption, congestion and accidents without incurring significant investment outlays. The integrated nature of the solutions offered by ITS is conducive to implementing the concept of sustainable development postulated by the EU [63]. The development, implementation and maintenance of ITS is a complex interdisciplinary undertaking in the following dimensions: technical, organizational and financial. It requires a professional and individualized approach to obtain large potential benefits in both the short and long term. In Szczecin, ITS is primarily [64]:
- On-board equipment for FMS, ticketing and CCTV, with an integrated control center for 290 buses and 150 trams:
- -
- High-performance OBU for FMS, ticketing and CCTV management;
- -
- 1686 validators for Transport Smart Cards;
- -
- 300 on-board TVMs;
- -
- 1125 on-board video surveillance cameras.
- Passenger Information System:
- -
- On-board multimedia information system;
- -
- 99 information displays at stops;
- -
- Internet and applications.
- 36 TVM at stops:
- Passenger Counting System;
- Request stops.
In the areas of Szczecin agglomeration, the assumptions resulting from the construction of the Traffic Management System in Szczecin and the Public Transport Management System for Szczecin and the Szczecin agglomeration were implemented. Ultimately, this system consists of a Passenger Information Subsystem (PIP), Traffic Detection Subsystem (PDR), Mobile Information Subsystem (PIM), Communication Subsystem (PŁ), Traffic Management Center (CZR), Fleet Management Subsystem for the entire rolling stock, Technical Vehicle Location Subsystem, Vehicle Video Monitoring Subsystem, Passenger Stream Counting Subsystem, On-Demand Transport Subsystem, Dynamic Passenger Information Subsystem, Electronic Ticket and City Card Subsystem, and Communication Network Optimization Subsystem.
The subjectivity of the choice inhabitants’ make regarding their means of movement in cities does not always depend on rational premises. Sometimes it is due to sudden individual sensations or impulses caused by an unexpected configuration of events. Therefore, bearing in mind the quality of life of city inhabitants, which is largely formed by the possibilities of transport, their travel preferences should be systematically examined, as well as the impact of their level of awareness in the field of sustainable development [65,66,67]. The main purpose of this article is to identify and analyze inhabitants’ preferences regarding ways of movement in a medium-sized city in east-central Europe. The area of research was the city of Szczecin, Poland. The studies presented in the article refer to different age groups, considering different means of social involvement, including work, school, shopping, entertainment, hospital. The analyses concern the preferences and limitations in choosing the means of moving in the city of Szczecin, depending on the destination and motivation.
3. Materials and Methods
3.1. Research Scope
Therefore, the subject matter of this study is topical and important. The main purpose of the study described in the article was to identify and analyze preferences regarding inhabitants’ means of movement in a medium-sized city in east-central Europe. The research area was the city of Szczecin, Poland. The research was based on source data (literature, legal acts and internal documents 2013–2035). The means of individual and collective transport were considered in the context of urban mobility and sustainable development. The specific objectives were:
- Determine how travel is related to destination;
- Indicate the dependence of the chosen means of transport on age, education, professional activity, industry and place of residence;
- Clarify the restrictions on the freedom of choice and access to means of transport, which affect residents’ mobility, quality of life and the implementation of sustainable development provisions;
- Obtain information about the residents’ motivations when choosing their means of transport, depending on the specific destination and based on the indicated factors (economic, ecological, own comfort and safety, and congruence with the principles of sustainable development and quality of life).
Due to the purpose of the study, the following research hypothesis was adopted:
- Hypothesis: The analysis of the obtained results allows for the relationship between the declared manner of the respondents’ movement and their needs in the area of mobility and awareness of changes consistent with the principles of sustainable development to be observed.
The research scope included residents who use individual and collective public transport in Szczecin, including the use of their own means of transport. The research also included users living in neighboring communes, who were covered by the service offer of the Szczecin transport organizer, i.e., the ZDiTM Road and Public Transport Authority in Szczecin. These are connected to the boroughs: Dobra, Police Kołbaskowo. People registered or residing in Szczecin and its vicinity participated in the study. They were categorized into age groups separating minors and adults, those of working age and those who were of a post-productive age.
3.2. Research Area
Szczecin is the third largest city in Poland. It is located next to the Polish–German border at the mouth of the Odra River, with the coordinates: 14°33′10″ E (east) longitude 53°25′44″ N (north) latitude [68]. An area of 300.6 km2 is currently inhabited by 396,472 people [69]. City transport in Szczecin is mainly based on the use of collective means of transport [70,71], such as buses [72] and trams. This is complemented by ecological means of transport, such as scooters, bicycles, electric scooters. At present, a total of 81 bus lines and 14 tram lines, with a total length of 118.7 km, on a 54.5-km-long traction network, operate in Szczecin. The average operational speed in tram transport is 14.4 km/h, and in bus transport this is 15.3 km/h. A significant number of inhabitants still use their own means of transport, a car. In 2020, 236,707 passenger cars and 32,905 trucks were registered in Szczecin. At that time, there were fewer than 595 passenger cars and 95 trucks per 1000 inhabitants [73].
Residents also have the option of using the transport services of several taxi corporations (City Taxi, Taxi 4 You, Radio Taxi, and Mix Taxi). The newest means of individual transport in the capital of the West Pomeranian Voivodeship is a wide range of car rental companies that allow for carsharing. As many as 22 companies make it possible for residents to rent a car for a day or longer, as shown in Table 1. These points are located on the left bank of the Odra River, which naturally divides the city into two parts. Their location is shown in Figure 1.
Since 2014, city bikes have also become available in Szczecin. Szczecin City Bike (Szczeciński Rower Miejski (SRM)) initially had 370 bicycles at 33 stations in different parts of the city, but mainly in the center [75]. There are around 800 bicycles at present. The new BikeS has autonomous locks and GPS. This makes docking stations unnecessary. Two-wheelers can be left in one of the 99 parking zones [76]. Users of this type of transport include students temporarily staying in Szczecin. As an academic center, Szczecin attracts around 35,000 people every year, including students at four public universities, eight private and two branch departments [77,78].
In addition to the city bike, Szczecin offers other forms of individual transport. Electric scooters and motor-scooters have appeared. In October 2019, Cabbi and Volt scooters became the pioneers of electric scooters in Szczecin, but they did not conquer the Szczecin market and do not operate on the city streets at present. From May 2020, it became possible to rent electric scooters from blinkee.city. The company’s bikes are single-seater bikes with a speed limit of 25 km/h. They have LED lights on the front and rear and an electric brake. Other providers of this service are Bolt, Quick-app and Lime. In addition, on the streets of Szczecin, you can find EcoShare city scooters, which are not as popular as the aforementioned scooter, but have been in operation for the longest time in Szczecin.
3.3. Characteristics of the Method—Identification of User Preferences in Terms of Moving around the City
The chosen research method is an instrumental case study. A specific case is properly researched and described to obtain better insight into a more general problem or theory.
The case study method is scientifically objective, rational, organized, systematic and structured to ensure the credibility of the conclusions. The most important principle is the triangulation method, which, in this case, is understood as obtaining data from several independent sources. According to B. Glaser and G. Barney, anything can be data—such as what will be said during the interview, how it is said and under what circumstances, in addition to documents concerning the problem, press articles, observation results, and audio and video recordings. These different, independent sources of information should lead to the same conclusions [79].
R. Yin recommends the use of the case study method to find answers to questions of a revealing nature, such as those concerning “how” and “why” a given phenomenon occurs. Such research focuses more on obtaining a thorough understanding of the phenomenon than on the analysis of variables. The application of the case study method allows one to discover what the results of quantitative research can only suggest. The case study, compared to other research methods, offers the richest range of techniques and tools for data acquisition and analysis. Data may be obtained from observations, interviews, company documents, press articles, surveys, and databases maintained by various institutions. There are also no methodological limitations to how the data are analyzed. Both qualitative and quantitative methods are often used, which complement each other; for example, ratio analysis and statistical analysis may coexist with axial coding, grouping and visualization or temporal bracketing strategies [80].
The presented case plays a secondary, auxiliary role, making it easier to obtain a superior understanding and going beyond the specific case under consideration. This case is analyzed in different contexts to allow for other aspects to be understood. [81] When researching a social or economic phenomenon, an important parameter of the research process is the current state of the environment, which strongly influences the studied phenomenon; this is the current state, which cannot be repeated in the next research experiment.
The primary research was based on a proprietary questionnaire entitled: “Quality of life from the perspective of using various means of transport for the inhabitants of a medium-sized city”. This was shared with respondents via the Google browser [82]. The questionnaire prepared for the study consisted of eight basic questions and a record characterizing the respondent, including their age, professional activity, industry, education and gender. The questions included:
- How often do you use a given means of transport?
- How do you evaluate the level of safety in the moving means of transport?
- How do you evaluate the level of accessibility to means of transport?
- In what directions and how do you move?
- What kind of limitations reduce access to means of transport?
- What features do you think the means of transport should have?
- What extent to does the way you get around the city affect your daily life?
- What is your way of moving around the city conditioned?
Only some of the questions from the worksheet were used in the article. The data that were chosen for analysis were dictated by the aim of improving the transparency and consistency of inference.
The following forms of travel were considered for assessment: on foot (F), by car €, e-scooter (S), electric scooter €, bicycle (B), bus (BUS), tram (TRAM), taxi (T) and other (O), e.g., seasonally available water tram, and applications for finding/sharing rides/sharing a vehicle. The study did not consider the subway, city railways and trolleybuses, as these means of transport are not available in Szczecin.
When asking respondents what determines their way of moving around the city, a 7-point Likert scale was used to analyze reliability using the Statistica program. The Cronbach’s α coefficient was 0.774, which proves the correct selection of the measuring scale that the authors used for the article in the questionnaire.
In question 4, respondents were asked about their direction and manner of movement in accordance with the suggested structure of answers, as shown in Table 2.
The next question related to the limitations to the respondent’s accessibility to a particular means of transport. The following limitations were considered in this question: economic, physical (efficiency), lack of means of transport, weather conditions, lack of a driving license, health condition, lack of communication with other means of transport, insufficient number of parking spaces, others.
The last question was: What determines the chosen means of transport around the city? The respondents were given a choice of several variants, which they rated on a scale from 1 to 7 (from the least to the most):
- Principles of sustainable development;
- Quality of life;
- Economic factors;
- Ecological factors;
- Own comfort and safety;
- Other.
3.4. Analysis of the Declared Transport Preferences
The results of the study were analyzed using multiple-response multi-direction tables, the chi-square test of independence and non-parametric U Mann–Whitney and Kruskal–Wallis tests [83].
Multiple-response variables are most often encountered when analyzing data from public opinion polls. When performing complex analyzes using the multiple-response contingency tables procedure, it is often difficult to see exactly how each case in the data file is classified in the contingency table. This is a combination of two or more frequency tables, which are arranged in such a way that each cell in the table uniquely represents a combination of the specific values of the tabulated variables. As a result, contingency tables enable cardinities corresponding to categories defined by more than one variable to be analyzed. By analyzing these frequencies, it is possible to identify the relationship between the tabulated variables. With regard to the problem under consideration, it can detect the relationship between the characteristics of respondents and their direction of movement, their chosen means of transport, transport limitations, and their reasons for choosing a given measure.
The Pearson Chi-square statistic is the basis of the most common significance test for categorical (categorized) variables. This measure is based on the ability to compute the expected cardinities in the two-direction table (that is, the frequencies that we would expect if there were no dependencies between the variables).
The Mann–Whitney U test uses the ranks of each observation to verify that the groups were drawn from the same population. The Mann–Whitney test was used to check if the two sampled populations are identical in terms of location. The observations from both groups are combined and assigned a rank.
The Kruskal–Wallis test is an extension of the Mann–Whitney U test. This test is the non-parametric equivalent of the one-way analysis of variance. It detects differences in the position of the distribution. This test assumes that there was no a priori ordering of the populations from which the samples were taken.
4. Results
A total of 322 respondents aged from 16 to 80 took part in the study, in the period from 17 May 2019 to 1 April 2021. The majority of participants were women, at 62.7%. The respondents represented all levels of education: higher—54%, secondary—42.5%, vocational—2.2% and primary—1.3%. A total of 71.4% of respondents lived in Szczecin, 13.7% in the vicinity of Szczecin, and 11.2% in the West Pomeranian Voivodeship. A significant portion, as many as 58.4%, were students, 38.2% of the respondents worked professionally, and the rest were pensioners and the unemployed. The respondents represented various professional sectors, the most numerous of which were services—32.5%, education—23%, and administration—20.1%. Trade and production were similar.
The research analysis concerns only some parts of the survey:
- Respondents’ preferences with regard to means of transport to a specific activity;
- Determining the reasons for respondents’ choice of transport;
- Identification of limitations regarding respondents’ chosen means of transport in the surveyed directions.
4.1. Analysis of the Respondents’ Chosen Means of Transport in the Indicated Directions of Movement
To facilitate transparent research on respondents’ travel activity, their travel directions were defined, as presented in Table 3. The chosen means of transport in the A–B, B–A directions showed no significant differences. Therefore, the article only presents analyses relating to one direction
Considering the respondents’ various activities, the most frequently chosen means of transport were car, then on-foot, followed by tram and bus. General statistics regarding the chosen means of transport in all directions are shown in Figure 2.
Many respondents mentioned hiking trips. This may be an effect of the COVID-19 pandemic, an unfavorable economic situation, or due the proximity of their planned activities. Walking trips were most common among students, who accounted for more than half of the respondents.
The selection of an individual means of transport in the indicated directions is shown in detail in Figure 3.
Most directions are dominated by car. In the H-f, H-s, and o directions, the pedestrian form of transport dominates. In the H-sh and H-e directions, car and on-foot transportation are chosen equally often. The respondents’ choices may indicate certain customary behaviors, e.g., car transport is favored for weekly shopping because it increases comfort and accessibility to shopping centers. Similar results are seen in the case of leisure travel; however, respondents most often used cars, but in the form of a taxi.
On the basis of the multi-way tables and interaction charts, it was possible to infer the individual means of transport most often chosen by users in the home–work direction:
- Szczecin residents chose to use the bus less frequently than other identified respondents, similar to the case of professionally active people;
- Students choose trams more than other groups;
- Service workers also choose trams more often than other industries;
- Workers in trade, however, chose trams less often than other groups, and more often travelled on foot;
- People with secondary education use buses more than other groups;
- Men decide to travel by bike more often than women;
- For people aged 25–34, the car ranked third, after travelling by tram and on foot, but for the other age groups, the car was the most frequently used means of transport;
- Hiking trips were chosen less often by respondents aged 18–24 than by other groups, as shown in Figure 4.
In the h–s direction, the majority of respondents move on foot. This is especially influenced by the age group, of 18–24 years, i.e., physically fit young people. Buses are more frequently chosen by people living in the vicinity of Szczecin; for the remaining groups, on-foot is the main means of arriving at school, as shown in Figure 5.
In the home–shopping direction, shown in Figure 6, it can be observed that:
- For most age groups, a car is used for travelling; only the age group 18–24 use walking trips;
- Professionally active people choose a car more often; students usually travel on foot;
- Respondents with higher education travel by car more often, while respondents with secondary education travel on foot;
- People living in Szczecin first chose to travel on foot and by car, and then by tram; respondents from the vicinity of Szczecin mainly use a car, and the remaining respondents travel by foot and by car;
- Women choose to travel on foot, as opposed to by car, more often than men.
In the home–fitness direction, shown in Figure 7, it can be observed that:
- For the 34–44 and 45–55 age groups, the main means of transport is by car; for the other age groups, it is on foot;
- Professionally active people choose to travel by car more often, and students travel on foot;
- All industries, apart from administration, choose pedestrian trips first, then the car; administration industries first travel by the car and then on foot;
- Respondents with higher education use trams much less;
- Women use cars less.
In the home–entertainment direction, respondents similarly made a choice between transport by car, on-foot, and by tram. The 18–24 and 25–34 age groups prefer to travel on foot, followed by a tram or a car. The remaining groups use the car first, followed by travel on foot. Moreover, the professionally active respondents chose to travel by car and students chose to travel on foot. Respondents who work in services chose to travel by car more often than other groups, while respondents working in education were more likely to travel by taxi. This is also confirmed by the fact that, in terms of education, those with higher education choose taxis more often than other groups. In this direction, women prefer to walk and men choose the car, as shown in Figure 8.
In the home–cemetery direction, the distance was not covered on foot by the group of respondents aged 35–44. Among the surveyed groups, economically active people used the bus more often than others. Considering the respondents’ education, those with higher education chose to use buses more often, as shown in Figure 9.
When analyzing the home–hospital direction, students chose the tram more often than the other groups and chose taxis less often. When looking at the responses from different industries, those working in trade very rarely chose to travel on foot, and those with higher education more often used taxis, as shown in Figure 10.
4.2. Motivation Analysis
The research also looked at whether respondents, when choosing their means of transport around the city of Szczecin, took the following into account:
- The principles of sustainable development (SDP);
- Own comfort and safety (OCS);
- Economic factors (EF);
- Ecological factors (EcF);
- Quality of life (QL);
- Other, not mentioned factors (O).
In terms of sustainable development, when choosing a means of transport, there are significant differences between students and professionally active respondents. The Mann–Whitney U test (with continuity correction) provides a test value of 9461, and the test probability p = 0.006 indicates significant differences in the extent to which the principles of sustainable development motivated the choice of transport, as shown in Figure 11. Students who follow the SDP are more likely to identify with this, probably because of their greater knowledge of the issue.
The interaction between the level of managing SDP and the occupation of the group of respondents choosing a car in different directions is shown in Figure 12.
Among the most numerous age groups, the group of respondents aged 18–24 showed the highest level of adherence to the principles of sustainable development. The Kruskal–Wallis rank ANOVA test gave a test value of 6.652 and a test probability of p = 0.0359, which indicates significant differences in the extent to which SDPs motivated the transport choice, as shown in Figure 13.
The education industry stands out from the crowd in terms of comfort and safety. In this case, the Kruskal–Wallis rank ANOVA test gave a result of 12.537, which translates into the test probability of p = 0.0138. This indicates significant differences in the level of motivation that own comfort and safety provide when choosing a means of transport, as shown in Figure 14.
The highest level of guidance by one’s own comfort and safety was demonstrated by respondents in the 35–44 age group. The Kruskal–Wallis rank ANOVA test provided a test value of 5.9, and the test probability p = 0.05 indicates significant differences in the level of motivation the OCS criterion provided when choosing a means of transport, as shown in Figure 15.
The largest professional groups, students and those who are professionally active, gave different reasons for choosing a means of transport. Generally speaking, for professionally active people, the most important features are those related to comfort in everyday life, quality of life and safety. For students, the principles of sustainable development, and ecological and economic features, are more important, as shown in Figure 16.
Although the largest groups of respondents in terms of education, higher and secondary, were revealed to have different factors dominate their decision-making process, the differences are not statistically significant. Respondents with secondary education were more likely to choose their mode of transport according to the PSD, and, to a lesser extent, QL, as shown in Figure 17.
When looking at different areas of residence, the greatest differences were visible in terms of the principles of ecology (1—Szczecin, 2—Vicinity, 3—West Pomeranian Voivodeship, 4—other).
Respondents living in Szczecin and the West Pomeranian Voivodeship are less influenced by ecological factors when choosing a method of transport. However, inhabitants of the vicinity of Szczecin demonstrated the highest level of ecological awareness (Figure 18).
4.3. Analysis of Limitations regarding Respondents’ Chosen Means of Transport in the Surveyed Directions
To assess the mobility of the inhabitants of Szczecin and the surrounding area, the survey identified and analyzed the restrictions on the chosen means of transport that respondents revealed for the surveyed directions. The level of these limitations may indicate the availability of the means of transport indicated in the survey. The following limitations were assessed in the study: economic (EC), physical/fitness (PH), no means of transport (NM), weather conditions (WC), no document that allows one to drive (ND), health condition (HC), no communication with other means of transport (transfer points) (NC), insufficient number of parking spaces (IN) and others (OT), specified by the respondents themselves. The distribution of restrictions to individual means of movement in Szczecin is presented in Figure 19.
Accessibility to individual means of transport is mainly determined by economic factors, weather conditions, and the lack of a means of transport. It is worth noting that when a car is used, the respondents note that there are too few parking spaces. However, when traveling on foot, by tram, or by bus, time is considered the most important factor. During the study in Szczecin, the availability of motor-scooters and electric scooters was insufficient. Companies offering this type of transport were still in the early stages of development; hence, their availability was limited, as reflected in the research results.
The most popular of all analyzed means of transport, car, bus, and tram, are analyzed in more depth in the following.
4.3.1. Restrictions for the Car
The relationship between the significance of individual restrictions and the characteristics of the respondents (age, profession, industry, education, place of residence, gender) is shown in Figure 20, Figure 21 and Figure 22.
Production, as compared to other industry groups, places much less importance on restrictions resulting from an insufficient number of parking spaces. Those working in trade also assign less importance to this restriction than those working in services, administration, and education.
Respondents with higher education attributed much less importance to restrictions related to weather conditions.
Non-residents from the vicinity of Szczecin recognize constraints related to the lack of a means of transport to a lesser extent than other groups and ascribe less importance to limitations related to an insufficient number of parking spaces.
4.3.2. Bus Restrictions
The relationship between assessment of the significance of individual constraints and the characteristics of the respondents is shown in Figure 23, Figure 24, Figure 25, Figure 26, Figure 27 and Figure 28.
Respondents from the 25–34 age group, compared to other age groups, attribute less importance to economic constraints and the lack of a means of transport. Respondents from the 35–44 age group, compared to other age groups, attribute less importance to time constraints.
Compared to professionally active participants, students assign much less importance to restrictions related to an insufficient number of parking spaces and weather conditions. The limited availability of the bus to professionally active groups may be due to the low availability of parking lots at interchange points for other means of transport. It may also result from the respondents misunderstanding the question.
Respondents from the production group, compared to other industry groups, attribute much less importance to the limitations of bus transport related to the lack of communication with other means of transport and time constraints. Compared to other industry groups, the respondents from the administration group ascribe much less importance to economic constraints. Those working in service industries observe health-related limitations to bus transport more than those working in other industries. The education industry, to a greater extent than other industries, found limitations to bus transport that were related to the lack of communication with other means of transport and the lack of a means of transport.
Disproportions occur regarding economic and physical constraints, where respondents with secondary education rate these factors much higher than respondents with higher education.
The respondents who resided in Szczecin consider time limitations to be less important compared to representatives from other groups.
Women, compared to men, attach less importance to the economic limitations to bus transport. The same applies to limitations related to an insufficient number of parking spaces, health conditions and the lack of a driving license, although this result was less clear.
4.3.3. Tram Restrictions
The relationship between assessment of the significance of individual constraints and the characteristics of the respondents is shown in Figure 29, Figure 30, Figure 31, Figure 32, Figure 33 and Figure 34.
Respondents from the 35–44 age group, compared to other age groups, paid less attention to time constraints. The 25–34 group also placed much less importance on economic constraints. The 55–65 age group assigned less importance to limitations related to the lack of communication with other means of transport.
For students, economic conditions are the greater limitation, and weather conditions provided less of a limitation compared to other groups.
Respondents from the production group, compared to other industry groups, attribute much less importance to the limitations to tram transport related to the lack of communication with other means of transport and time constraints. Respondents from the administration group, compared to other industry groups, attribute much less importance to economic constraints. Education, to a greater extent than other industries, the lack of a means of transport to be a greater limitation, and noted physical limitations less than other groups.
Respondents with secondary education ascribe much more importance to the economic and physical limitations to tram transport, as well as limitations related to the lack of this means of transport.
Inhabitants of the vicinity of Szczecin pay less attention to the time constraints of tram travel.
Women, compared to men, attach less importance to the economic and physical limitations of tram transport. There is a certain similarity in the assessment of the availability of trams and buses.
5. Discussion
The main purpose of this study was to identify and analyze the preferred means of transport of inhabitants of a medium-sized city in east-central Europe. The research area was the city of Szczecin, Poland. The research was based on source data (literature, legal acts, and internal documents 2013–2035). The considerations included the means of individual and collective transport in the context of urban mobility and sustainable development
The current situation, shaped by the events of recent years and even recent months, has caused both city authorities and scientists to conduct in-depth research on the mobility of city inhabitants [84]. Transport is important for mobility. Transport should be developed in line with the SDP to ensure the proper quality of life for the users. Mobility is regarded as the availability of planned and affordable connectivity in cities [85,86].
5.1. The Dominant Role of the Car
The results of the presented research clearly show that the car is the dominant means of transport in various directions for the inhabitants of Szczecin. The choice of a car for city journeys was described and interpreted by Zawieska in his research, conducted among inhabitants of Warsaw, examining their transport preferences in the years 1993–2015 [87]. The choice of a car is not related to the direction of travel but may constitute a habit. This type of transport behavior for inhabitants of Europe is described by Vij et al. [88]. In Poland, not many cities have been researched and described in the literature in terms of public transport. The studied cities are mainly Warsaw, Kraków, Wrocław, Gdynia, Poznań and Szczecin. The research is mainly based on statistical data from the the Central Statistical Office (GUS) and the use of ITS technology.
One of the conclusions of this study was a preference for using motor vehicles and increasing their access to cities; therefore, cities’ smart mobility technologies may have to invest in autonomous vehicles [89]. In the long term, technology can provide more sustainable and more convenient means of transport, which are more adapted to the needs of the inhabitants, as well as more travel options [90,91]. While this is unlikely to happen in the near term, shared or combined electrical energy could reduce car ownership and increase the active use of transport [92,93,94].
The latest data from Exact Systems show that Poland ranks 1st in Central and Eastern Europe and 13th in the European Union in terms of sales of electric vehicles. In Szczecin, courier companies are already replacing their fleet with electric vehicles. It might be that car-sharing companies will follow their example [95]. The space that is recovered from cars in this way, and the accompanying parking lots, could be redesigned [96]. The landscape could comprise trees, sidewalks or paths for bicycles and electric scooters, as well as rest zones for pedestrians in the form of friendly benches.
The respondents’ compliance with the principles of sustainable development when choosing a means of transport showed that this definitely tanked lower in their hierarchy of values than quality of life, their own comfort and safety, and economic factors. Similar observations were made in other studies relating to urban transport in east–central European cities [97,98].
5.2. Identification of Preferences regarding the Chosen Means of Transport Depending on the Respondents’ Characteristics
Considering respondents’ diversity in terms of age, the 18–24 and 25–34 age groups usually choose on-foot travel and public transport. However, respondents of 35–44 and 45–54 years of age were more likely to use individual car rides. A similar distribution of the chosen means of transport applied to economically active groups (car) and students (on foot, tram, bus). The indicated choice may prove that we have the funds for this type of transport. The means of transport that particular industry groups chose for journeys in the indicated directions were quite diverse, and it is difficult to generalize their preferences. Only trade workers are clearly more likely to go on foot. When focusing on the education criterion, it was noticed that people with higher education use public transport and walk less than other respondents. Respondents from Szczecin used pedestrian and car transport, while respondents from the city prefer to use the bus or car. The respondents’ preferences, as defined by the authors, fill the knowledge gap regarding the needs of the inhabitants of a medium-sized city in Poland.
5.3. Identification of Accessibility Restrictions for Individual Means of Transport
The analysis of Szczecin’s communication network and the limitations declared in the survey provide extremely important information in terms of the modernization of the communication system. Cascajo et al. stated that the greatest limitation to using public transport is congestion and the necessity of frequently changing the means of transport [99]. A significant problem with public transport, which is often analyzed, is its punctuality and the rolling stock and stops [100,101]. Punctuality, travel time, and driving comfort are also among the most important features of public transport, as noted by the inhabitants of Belgrade [102]. On the other hand, in our research, the main limitation in the accessibility of public transport turned out to be time constraints and the lack of communication with other means of transport, i.e., too few transfer points.
Economic constraints, which are very important in relation to the various means of transport, were correlated with the selected characteristics of the respondents. This was particularly visible in the case of the professional groups, workers and students, and the industry groups: administration and others (education, production, trade, services). The authors did not find similarly configured studies, which confirms the need to continue this type of research.
6. Conclusions
The presented article sheds light on the perceived transport mobility of the respondents in the context of quality of life and SDP in a medium-sized city, considering social and economic needs. The primary research was based on a proprietary questionnaire and the case study was based on the analyses and reports of local government institutions, the statistical office, and city transport organizers. These confirmed the research hypothesis presented in the article.
Hypothesis: The analysis of the obtained research results can determine the relationship between the transport choice made by the respondents, their needs regarding mobility and their awareness of changes consistent with the principles of sustainable development.
Paying attention to the importance of car transport to the respondents, it is worth emphasizing its limitations, such as the lack of a sufficient number of parking spaces. In the case of production workers, this problem is much smaller, as employees used the bus as their means of transport. The respondents considered timing the greatest limitations in relation to public transport (frequency of departures, punctuality), and weather conditions for ecological means of transport. The limitation regarding the availability of motor-scooters and electric scooters in the analyzed period was significant; however, the situation in this area of accessibility has changed very dynamically, as additional companies allowing such products to be rented have appeared on the market.
It is noteworthy that the respondents did not identify quality of life with SDP and ecological factors. This perception is not conducive to the development of urban mobility, which is an important element of the SDP policies implemented in the city. The great popularity of using the car to travel around Szczecin could indicate to the city authorities that SDP is not a priority for the residents of Szczecin. Only young students with greater awareness of SD and limited financial resources are more likely to use collective transport. A large proportion of people walking on foot is a hallmark of cities where the walking distances are short enough. In Szczecin, many students have dormitories close to their universities.
The last two conclusions indicate that the public transport system is still not attractive enough for the inhabitants of Szczecin to completely give up car journeys.
The limited access to some means of transport, as identified during the research, provides a very important indication of the direction in which public transport should develop.
Further research could focus on the following:
- Monitoring the availability of ecological means of transport;
- Assessing of the possibility of using an ecological means of public transport;
- Comparing data on means of transport with ITS with those obtained from previous surveys;
- Assessing the preferences of urban transport users in other Polish cities for comparison;
- Researching additional forms of transport.
Author Contributions
Conceptualization, A.E.W. and L.K.; data curation, A.E.W. and L.K.; formal analysis, A.E.W. and L.K.; investigation, A.E.W. and L.K.; methodology A.E.W. and L.K.; visualization, L.K.; writing—original draft, A.E.W. and L.K.; writing—review and editing A.E.W. All authors have read and agreed to the published version of the manuscript.
Funding
The APC was funded by Maritime University of Szczecin.
Institutional Review Board Statement
Not applicable.
Informed Consent Statement
Not applicable.
Data Availability Statement
The data presented in this study are available on request from the corresponding author.
Conflicts of Interest
The authors declare no conflict of interest.
Abbreviations
| ITS | Intelligent Transportation Systems |
| LED | Light-Emitting Diode |
| GPS | Global Positioning System |
| OECD | Organization for Economic Co-operation and Development |
| PSPA | Polish Alternative Fuels Association (Polskie Stowarzyszenie Paliw Alternatywnych) |
| PZPM | Polish Automotive Industry Association (Polski Związek Przemysłu Motoryzacyjnego) |
| SDP | Sustainable Development Principles |
| SRM | Szczecin City Bike (Szczeciński Rower Miejski) |
| ZDiTM | Road and Public Transport Authority in Szczecin |
References
- European Commission. White Paper on Transport (2011) Roadmap to a Single European Transport Area–Towards a Competitive and Resource Efficient Transport System; COM (2011) 144 Final; European Commission: Brussels, Belgium, 2011.
- Kirby, A. CCCC Kick the Habit, A UN Guide to Climate Neutrality; UNEP: Arendal, Norway, 2008. [Google Scholar]
- European Environment Agency, European Union Emission Inventory Report 1990–2016. 2018. Available online: https://www.eea.europa.eu/publications/european-union-emission-inventory-report-1 (accessed on 18 July 2022).
- U.S. Energy Information Administration. Annual Energy Review, 2011; Government Printing Office: Washington, DC, USA, 2012.
- European Commission DG MOVE. Study to Support an Impact Assessment of the Urban Mobility Package; Activity 31 Sustainable Urban Mobility Plans Final Report; European Commission DG MOVE: Brussels, Belgium, 2013.
- COM (2013) Communication from the Commission to the European Parliament, the Council of the European Economic and Social Committee and the Committee of the Regions, COM/2013/0913. Available online: https://eur-lex.europa.eu/legal-content/PL/TXT/HTML/?uri=CELEX:52013DC0913&from=EN (accessed on 18 July 2022).
- Commission of the European Communities. Green Paper. Towards a New Culture for Urban Mobility; Commission of the European Communities: Brussels, Belgium, 2007.
- OECD/ECMT. Managing Urban Traffic Congestion. Paris. 2007. Available online: http://www.oecd-ilibrary.org/transport/managing-urban-traffic-congestion_9789282101506-en (accessed on 20 July 2022).
- Grzelec, K. Organizational conditioning of passenger urban transport development. Transp. Miej. I Reg. 2020, 2, 22–27. [Google Scholar]
- Starowicz, W. Jakość Przewozów W Miejskim Transporcie Zbiorowym; Wydawnictwo Politechniki Krakowskiej: Kraków, Poland, 2007; pp. 35–58. [Google Scholar]
- Bryniarska, Z.; Starowicz, W. Funkcjonowanie systemu statystycznej kontroli jakości usługi transportowej w Krakowie w latach 1997–2005. Transp. Miej. I Reg. 2006, 12, 2–15. [Google Scholar]
- Ciastoń-Ciulkin, A. Quality criteria applied in the contracts for transport services in big cities and methods of its controlling, Transp. Miej. I Reg. 2013, 4, 31–40. [Google Scholar]
- Ustawa o publicznym transporcie zbiorowym z dnia 16 grudnia 2010 r., Dz. U. z 2011 r. Nr 5, poz. 13, Nr 228, poz. 1368. Available online: https://isap.sejm.gov.pl/isap.nsf/download.xsp/WDU20110050013/T/D20110013L.pdf (accessed on 20 June 2022).
- Druckman, J.N.; Lupia, A. Preference formation. Annu. Rev. Political Sci. 2000, 3, 1–24. [Google Scholar] [CrossRef] [Green Version]
- Słownik Języka Plskiego PWN. Available online: https://sjp.pwn.pl/sjp/preferencja;2572329.html (accessed on 20 May 2022).
- Abou-Zeid, M.; Schmöcker, J.D.; Belgiawan, P.F.; Fujii, S. Mass effects and mobility decisions. Transp. Lett. 2013, 5, 115–130. [Google Scholar] [CrossRef]
- Dugundji, E.R.; Páez, A.; Arentze, T.A.; Walker, J.L.; Carrasco, J.A.; Marchal, F.; Nakanishi, H. Transportation and social interactions. Transp. Res. Part Policy Pract. 2011, 45, 239–247. [Google Scholar] [CrossRef]
- Plan Zrównoważonego Rozwoju Publicznego Transportu Zbiorowego Dla Miasta Szczecin Na Lata 2013–2025. Available online: http://bip.um.szczecin.pl/UMSzczecinFiles/file/Plan_Zrownowazonego_Rozwoju_Publicznego_Transportu_Zbiorowego_Szczecin_KONSULTACJE.pdf (accessed on 22 July 2022).
- Garikapati, V.M.; Pendyala, R.M.; Morris, E.A.; Mokhtarian, P.L.; McDonald, N. Activity patterns, time use, and travel of millennials: A generation in transition? Transp. Rev. 2016, 36, 558–584. [Google Scholar] [CrossRef]
- Bastian, A.; Börjesson, M.; Eliasson, J. Explaining “peak car” with economic variables. Transp. Res. Part Policy Pract. 2016, 88, 236–250. [Google Scholar] [CrossRef] [Green Version]
- Tsafarakis, S.; Gkorezis, P.; Nalmpantis, D.; Genitsaris, E.; Andronikidis, A.; Altsitsiadis, E. Investigating the preferences of individuals on public transport innovations using the Maximum Difference Scaling method. Eur. Transp. Res. Rev. 2019, 11, 3. [Google Scholar] [CrossRef]
- Fiorio, C.V.; Florio, M.; Perucca, G. User satisfaction and the organization of local public transport: Evidence from European cities. Transp. Policy 2013, 29, 209–218. [Google Scholar] [CrossRef]
- Al-Salih, W.Q.; Esztergár-Kiss, D. Linking Mode Choice with Travel Behavior by Using Logit Model Based on Utility Function. Sustainability 2021, 13, 4332. [Google Scholar] [CrossRef]
- D’Amico, G.; Arbolino, R.; Shi, L.; Yigitcanlar, T.; Ioppolo, G. Digital Technologies for Urban Metabolism Efficiency: Lessons from Urban Agenda Partnership on Circular Economy. Sustainability 2021, 13, 6043. [Google Scholar] [CrossRef]
- Andreasen, M.H.; Møller-Jensen, L. Access to the city: Mobility patterns, transport and accessibility in peripheral settlements of Dar es Salaam. J. Transp. Geogr. 2017, 62, 20–29. [Google Scholar] [CrossRef] [Green Version]
- Sepasgozar, S.M.; Hawken, S.; Sargolzaei, S.; Foroozanfa, M. Implementing citizen centric technology in developing smart cities: A model for predicting the acceptance of urban technologies. Technol. Forecast. Soc. Chang. 2019, 142, 105–116. [Google Scholar] [CrossRef]
- Korneć, R. The role of stakeholders in shaping smart solutions in Polish cities. Entrep. Sustain. Issues 2020, 7, 1981–1995. [Google Scholar] [CrossRef]
- Rogall, H. Ekonomika Zrównoważonego Rozwoju. Teoria i Praktyka; Zysk i S-ka: Poznań, Poland, 2010; pp. 88–120. [Google Scholar]
- Adamkiewicz-Kłos, Z.; Załoga, E. Miejski Transport Zbiorowy. Kształtowanie Wartości Usługi Dla Pasażera W Świetle Wyzwań Nowej Kultury Mobilności; BelStudio: Warszawa, Poland, 2017; pp. 133–140. [Google Scholar]
- Madeyski, M. Some aspects of the mobility of population and its satisfaction. Int. J. Transp. Econ. 1974, 1, 281–300. [Google Scholar]
- Badania Pilotażowe Zachowań Komunikacyjnych Ludności Polsce. Raport Końcowy; Centrum Badań i Edukacji Statystycznej GUS: Jachranka, Poland, 2015; p. 5.
- Bidasca, L. European Commission Sustainable Urban Mobility–Policy & Key Actions; JRC Community of Practice, Research and Innovation/Urban Mobility; European Commission: Brussels, Belgium, 28 April 2021. [Google Scholar]
- Cordera, R.; Coppola, P.; dell’Olio, L.; Ibeas, Á. Is accessibility relevant in trip generation? Modelling the interaction between trip generation and accessibility taking into account spatial effects. Transportation 2017, 44, 1577–1603. [Google Scholar]
- Izba Gospodarcza Komunikacji Miejskiej. Available online: https://igkm.pl/statystyka/ (accessed on 11 June 2022).
- Hull, A. Transport Matters. Integrated Approachesto Planningcity–Regions; Publisher Routledge. Taylor & Francis Group: London, UK, 2011; pp. 35–47. [Google Scholar]
- Kaufmann, V.; Kesseliring, S. Tracing Mobilities. Towards a Cosmopolitan Perspective; Ashgate: Hampshire, UK, 2008. [Google Scholar]
- An Integrated Perspective on the Future of Mobility; McKinsey Centre for Future Mobility. McKinsey & Company: Hong Kong, China, 2016.
- Bouton, S.; Knupfer, S.M.; Mihov, I.; Swartz, S. Urban Mobility at a Tipping Point; McKinsey & Company: Hong Kong, China, 2015. [Google Scholar]
- Aapaoja, A.; Eckhardt, J.; Nyk¨anen, L.; Sochor, J. MaaS service combinations for different geographical areas. In Proceedings of the 24th World Congress on Intelligent Transportation Systems, Montreal, QC, Canada, 29 October–2 November 2017. [Google Scholar]
- Future of transport. Analytical Report. Flash EB 312, The Gallup Organizations; EMTA Barometr 2013, Consortio Transports, Madryt 2015; Europen Commissione: Brussels, Belgium, 2011.
- Oskarbski, J.; Birr, K.; Żarski, K. Bicycle Traffic Model for Sustainable Urban Mobility Planning. Energies 2021, 14, 5970. [Google Scholar] [CrossRef]
- Smith, N.W. Current Systems in Psychology: History, Theory, Research and Applications; Thomson Learning: Wadsworth, OH, USA; Belmont, NC, USA, 2001; pp. 45–93. [Google Scholar]
- Brůhová Foltýnováa, H.; Vejchodskáa, E.; Rybováa, K.; Květoňb, V. Sustainable urban mobility: One definition, different stakeholders’ opinions. Transp. Res. Part D Transp. Environ. 2020, 87, 102465. [Google Scholar] [CrossRef]
- Ismail, A.; Kadir, S.A.; Aziz, A.; Mokshin, M.; Lokman, A.M. Aplikacja mobilna I Tourism travel buddy. In Proceedings of the 10th International Conference on Next Generation Mobile Applications, Security and Technologies (NGMAST), Cardiff, Wales, 24–26 August 2016; pp. 82–87. [Google Scholar] [CrossRef]
- Neves, A.; Brand, C. Assessing the potential for carbon emissions savings from replacing short car trips with walking and cycling using a mixed GPS travel diary approach. Transp. Res. Part A Policy Pract. 2019, 123, 130–146. [Google Scholar] [CrossRef]
- Sikora-Fernandez, D. Smarter cities in post-socialist country: Example of Poland. Cities 2018, 78, 52–59. [Google Scholar] [CrossRef]
- Lempp, M.; Siegfried, P. Conclusion to Automotive Disruption and the Urban Mobility Revolution. In Automotive Disruption and the Urban Mobility Revolution. Business Guides on the Go; Springer: Cham, Switzerland, 2022. [Google Scholar] [CrossRef]
- Grebe, U.D.; Hick, H.; Rothbart, M.; von Helmolt, R.; Armengaud, E.; Bajzek, M.; Kranabitl, P. Challenges for Future Automotive Mobility. In Systems Engineering for Automotive Powertrain Development. Powertrain; Hick, H., Küpper, K., Sorger, H., Eds.; Springer: Cham, Switzerland, 2021; pp. 1–28. [Google Scholar]
- Gallo, M.; Marinelli, M. Sustainable Mobility: A Review of Possible Actions and Policies. Sustainability 2020, 12, 7499. [Google Scholar] [CrossRef]
- Klecha, L.; Gianni, F. Designing for Sustainable Urban Mobility Behaviour: A Systematic Review of the Literature. In Citizen, Territory and Technologies: Smart Learning Contexts and Practices, Smart Innovation; Mealha, Ó., Divitini, M., Rehm, M., Eds.; Systems and Technologies 80; Springer: Cham, Switzerland, 2018; pp. 137–149. [Google Scholar]
- Polacy W Czołówce Europejskiego Rankingu. Powodu Do Dumy Nie Ma. Available online: https://smoglab.pl/liczba-samochodow-na-1000-mieszkancow/ (accessed on 22 December 2021).
- ACEA Report. Vehicles in Use Europe 22. Available online: https://www.acea.auto/files/ACEA-report-vehicles-in-use-europe-2022.pdf (accessed on 11 June 2022).
- Polish EV Outlook 2022–Raport, Polskie Stowarzyszenie Paliw Alternatywnych. Available online: https://pspa.com.pl/2019/informacja/uruchomiono-polski-licznik-elektromobilnosci/ (accessed on 1 June 2022).
- Raport CSR.PL. Available online: https://raportcsr.pl/licznik-elektromobilnosci-w-2021-r-na-polskie-drogi-wyjechalo-ponad-20-tys-aut-z-napedem-elektrycznym/ (accessed on 11 June 2022).
- Plakietki Ekologiczne W Europie. Przepisy, Ceny, Kary. Available online: https://motofakty.pl/plakietki-ekologiczne-w-europie-przepisy-ceny-kary/ar/c4-16271325 (accessed on 24 June 2022).
- Strulak-Wójcikiewicz, R.; Lemke, J. Concept of a Simulation Model for Assessing the Sustainable Development of urban transport. Transp. Res. Procedia 2019, 39, 502–513. [Google Scholar] [CrossRef]
- Kostrzewska, M.; Macikowski, B. Towards Hybrid Urban Mobility: Kick Scooter as a Means of Individual Transport in the City. IOP Conf. Ser. Mater. Sci. Eng. 2017, 245, 052073. [Google Scholar] [CrossRef] [Green Version]
- Litman, T. Well Measured: Developing Indicators for Sustainable and Livable Transport Planning, Victoria Transport Policy Institute, Canada 2016. Available online: http://www.vtpi.org/wellmeas.pdf (accessed on 24 June 2022).
- Okraszewska, R.; Romanowska, A.; Wołek, M.; Oskarbski, J.; Birr, K.; Jamroz, K. Integration of a Multilevel Transport System Model into Sustainable Urban Mobility Planning. Sustainability 2018, 10, 479. [Google Scholar] [CrossRef] [Green Version]
- Xu, X.; Ren, J.; Zhu, L.; Zhang, L. Intelligent Device System of Urban Transportation Service. In Proceedings of the IEEE 8th Joint International Information Technology and Artificial Intelligence Conference, ITAIC, Chongqing, China, 24–26 May 2019; pp. 1729–1732. [Google Scholar]
- Tkachenko, K.; Tkachenko, O. Modeling of management of intelligent systems in transport. Transp. Syst. Technol. 2022, 39, 252–261. [Google Scholar] [CrossRef]
- Zear, A.; Singh, P.K.; Singh, Y. Intelligent Transport System: A Progressive Review. Indian J. Sci. Technol. 2016, 9, 1–8. [Google Scholar] [CrossRef]
- García, C.R.; Quesada-Arencibia, A.; Cristóbal, T.; Padrón, G.; Alayón, F. Systematic Development of Intelligent Systems for Public Road Transport. Sensors 2016, 16, 1104. [Google Scholar] [CrossRef] [Green Version]
- Intelligent System for Public Transport in the City of Szczecin (Poland). Available online: https://www.gmv.com/sites/default/files/content/file/2021/04/05/115/caso-de-exito_szczecin_eng.pdf (accessed on 22 July 2022).
- Fioreze, T.; de Gruijter, M.; Geurs, K. On the likelihood of using Mobility-as-a-Service: A case study on innovative mobility services among residents in the Netherlands. Case Stud. Transp. Policy 2019, 7, 790–801. [Google Scholar] [CrossRef]
- Towards a Sustainable Europe by 2030, Reflection Paper, COM(2019) 22; European Commission: Brussels, Belgium, 2019.
- Wytyczne Dotyczące Opracowywania i Wdrażania Planu Zrównoważonej Mobilności Miejskiej, Wyd. 2, Consult, R; Europejska Platforma Planów Zrównoważonej Mobilności Miejskiej: Kolonia, Germany, 2019.
- Instytut Meteorologii i Gospodarki Wodnej-Państwowy Instytut Badawczy. Rocznik Meteorologiczny 2020. Available online: https://danepubliczne.imgw.pl/data/dane_pomiarowo_obserwacyjne/Roczniki/Rocznik%20meteorologiczny/ (accessed on 16 April 2022).
- Local Data Bank. Available online: https://bdl.stat.gov.pl/BDL/start (accessed on 23 April 2022).
- Act of 16 December 2010 on Public Collective Transport (Journal of Laws of 2011, No. 5, Item 13). Available online: https://isap.sejm.gov.pl/isap.nsf/DocDetails.xsp?id=WDU20110050013 (accessed on 23 April 2022).
- Act of 8 March 1990 r. on Local Self-Government (Journal of Laws of 1990, No. 16, Item 95). Available online: https://isap.sejm.gov.pl/isap.nsf/DocDetails.xsp?id=WDU19900160095 (accessed on 20 May 2022).
- Pietrzak, O.; Pietrzak, K. The Economic Effects of Electromobility in Sustainable Urban Public Transport. Energies 2021, 14, 878. [Google Scholar] [CrossRef]
- Local Data Bank. Available online: https://bdl.stat.gov.pl/bdl/dane/podgrup/tablica (accessed on 24 May 2022).
- Wynajem Samochodów. Available online: https://www.kayak.pl/Tani-Wynajem-Samochodow-Szczecin.11418.cars.ksp (accessed on 3 June 2022).
- Wolnowska, A.; Rymer, W. The role of city bicycles in the public transport in Szczecin. Studia Miej. 2016, 23, 145–157. [Google Scholar]
- Olbrzymie Zmiany w Zasadach Korzystania z Roweru Miejskiego. Za Miesiąc Startuje BikeS. Available online: https://wszczecinie.pl/aktualnosci,olbrzymie_zmiany_w_zasadach_korzystania_z_roweru_miejskiego_za_miesiac_startuje_bikes,id-40127.html (accessed on 28 May 2022).
- Akademicki Szczecin. Available online: https://www.szczecin.eu/akademicki_szczecin/uczelnie_wyzsze_w_szczecinie.html (accessed on 1 June 2022).
- Znajdź Uczelnie Dostosowana Do Twoich Potrzeb. Available online: https://www.uczelnie.pl (accessed on 1 June 2022).
- Glaser, B.G. The Grounded Theory Perspective: Conceptualization Contrasted with Description; Sociology Press: Mill Valley, CA, USA, 2001; pp. 37–78. [Google Scholar]
- Yin, R. Case Study Research: Design and Methods; Sage: Thousand Oaks, CA, USA, 2009; pp. 27–53. [Google Scholar]
- Stake, R. Case Studies. In Handbook of Qualitative Research; Denzin, N., Lincoln, Y., Eds.; Sage: Thousand Oaks, CA, USA; London, UK; New Delhi, India, 1994; pp. 236–247. [Google Scholar]
- Wolnowska, A.E.; Kasyk, L. Ways Residents of Large Cities in Poland, Commute before and during the COVID-19 Pandemic. Eur. Res. Stud. J. 2021, 3B, 24. [Google Scholar]
- Montgomery, D.C.; Runger, G.C. Applied Statistics and Probability for Engineers; John Wiley & Sons: New York, NY, USA, 1994; pp. 154–230. [Google Scholar]
- Wiktorowska-Jasik, A. Implemented sustainable public transport solutions and social expectations for the city transport system of Szczecin. Sci. J. Marit. Univ. Szczec. 2020, 61, 62–66. [Google Scholar] [CrossRef]
- Garau, C.; Masala, F.; Pinna, F. Cagliari and smart urban mobility: Analysis and comparison. Cities 2016, 56, 35–46. [Google Scholar] [CrossRef]
- Lyons, G. Getting Smart About Urban Mobility: Aligning the Paradigms of Smart and Sustainable. Transp. Res. Part A 2016, 115, 4–14. [Google Scholar] [CrossRef]
- Zawieska, J. Zachowania i preferencje komunikacyjne mieszkańców Warszawy w kontekście zmian społeczno-ekonomicznych w latach 1993–2015. Transp. Miej. I Reg. 2017, 3, 17–23. [Google Scholar]
- Vij, A.; Carrel, A.; Walker, J.L. Incorporating the influence of latent modal preferences on travel mode choice behavior, Transp. Res. Part A Policy Pract. 2013, 54, 164–178. [Google Scholar]
- Lewandowska, A.; Chodkowska-Miszczuk, J.; Rogatka, K.; Starczewski, T. Smart Energy in a Smart City: Utopia or Reality? Evidence from Poland. Energies 2020, 13, 5795. [Google Scholar]
- Taiebat, M.; Brown, A.L.; Safford, H.R.; Qu, S.; Xu, M. A Review on Energy, Environmental, and Sustainability Implications of Connected and Automated Vehicles. Environ. Sci. Technol. 2018, 52, 11449–11465. [Google Scholar] [CrossRef]
- Firnkorn, J.; Müller, M. Free-floating electric carsharing-fleets in Smart Cities: The Dawning of a Post-Private Car Era in Urban Environments? Environ. Sci. Policy 2015, 45, 30–40. [Google Scholar] [CrossRef]
- Greenblatt, J.; Saxena, S. Autonomous Taxis Could Greatly Reduce Greenhouse-Gas Emissions of US Light-Duty Vehicles, Nat. Clim. Change 2015, 5, 860–863. [Google Scholar]
- Meyer, J.; Becker, H.; Bösch, P.; Axhausen, K. Autonomous Vehicles: The Next Jump in Accessibilities? Res. Transp. Econ. 2017, 62, 80–91. [Google Scholar] [CrossRef] [Green Version]
- Wadud, Z.; MacKenzie, D.; Leiby, P. Help or Hindrance? The Travel, Energy and Carbon Impacts of Highly Automated Vehicles. Transp. Res. Part A 2016, 86, 1–18. [Google Scholar]
- Ferrero, F.; Perboli, G.; Rosano, M.; Vesco, A. Car-sharing services: An annotated review. Sustain. Cities Soc. 2018, 37, 501–518. [Google Scholar] [CrossRef]
- Annex a Concept for Sustainable Urban Mobility Plans to the Communication from the Commission to the European Parliament, the Council, the European Economic and Social Committee and the Committee of the Regions Together Towards Competitive and Resource-Efficient Urban Mobility. Available online: https://eur-lex.europa.eu/ (accessed on 23 April 2022).
- Dimitrowa, E. The ‘sustainable development’ concept in urban planning education: Lessons learned on a Bulgarian path. J. Clean. Prod. 2014, 62, 120–127. [Google Scholar] [CrossRef]
- Krych, A. Horyzont 2050–o nowy paradygmat planowania mobilności. Transp. Miej. I Reg. 2020, 6, 29–35. [Google Scholar]
- Cascajo, R.; Garcia-Martinez, A.; Monzon, A. Stated preference survey for estimating passenger transfer penalties: Design and application to Madrid. Eur. Transp. Res. Rev. 2017, 9, 42. [Google Scholar] [CrossRef] [Green Version]
- Dostatni, K. Badania jakości funkcjonowania komunikacji miejskiej w Poznaniu w latach 2013-2019. Transp. Miej. I Reg. 2020, 3, 36–43. [Google Scholar]
- Chyba, A.; Chyba, K. Punktualność kursowania pojazdów miejskiego transportu zbiorowego w Krakowie w latach 1997-20011, Transp. Miej. I Reg. 2012, 12, 37–42. [Google Scholar]
- Filipović, S.; Tica, S.; Živanović, P.; Milovanović, B. Comparative analysis of the basic features of the expected and perceived quality of mass passenger public transport service in Belgrade. Transport 2009, 24, 265–273. [Google Scholar] [CrossRef]
Figure 1.
Locations of car rental points in Szczecin. Source: Own elaboration based on: [74] (accessed: 3 June 2022).
Figure 1.
Locations of car rental points in Szczecin. Source: Own elaboration based on: [74] (accessed: 3 June 2022).

Figure 2.
The statistics on the respondents’ chosen means of transport in all directions.

Figure 3.
Selection of the means of transport depending on the direction of travel.

Figure 4.
The choice of individual means of transport in the home–work direction.

Figure 5.
The choice of individual means of transport in the home–school direction.

Figure 6.
The choice of individual means of transport in the home–shopping direction for selected groups.
Figure 6.
The choice of individual means of transport in the home–shopping direction for selected groups.

Figure 7.
The choice of individual means of transport in the home–fitness direction.

Figure 8.
The choice of individual means of transport by users in the home–entertainment direction.

Figure 9.
The choice of individual means of transport by users in the direction of Home–cemetery.

Figure 10.
The choice of individual means of transport in the home–hospital direction.

Figure 11.
Differences between students and professionally active people in terms of their consideration of sustainable development when choosing a means of transport.
Figure 11.
Differences between students and professionally active people in terms of their consideration of sustainable development when choosing a means of transport.

Figure 12.
Interaction between the level of PSD and the professional activity of the respondents.

Figure 13.
SDP as a factor influencing the transport choice in different age groups.

Figure 14.
Own C&S as a factor shaping the means of movement in various industry groups.

Figure 15.
Own comfort and safety as a factor influencing the means of movement in different age groups.
Figure 15.
Own comfort and safety as a factor influencing the means of movement in different age groups.

Figure 16.
The quality of life and economic factors influencing the transport choice in various industry groups.
Figure 16.
The quality of life and economic factors influencing the transport choice in various industry groups.

Figure 17.
SDP and QL as factors influencing mobility choice at different education levels.

Figure 18.
Ecological factors influencing the choice of transport depending on place of residence.

Figure 19.
Accessibility: limitations to the surveyed means of transport, as indicated by the respondents.
Figure 19.
Accessibility: limitations to the surveyed means of transport, as indicated by the respondents.

Figure 20.
A graph of interactions between limitations in terms of car availability and the respondent’s vocation.
Figure 20.
A graph of interactions between limitations in terms of car availability and the respondent’s vocation.

Figure 21.
A graph of interactions between limitations in terms of car availability and the respondent’s education.
Figure 21.
A graph of interactions between limitations in terms of car availability and the respondent’s education.

Figure 22.
A graph of interaction between the limitations regarding car availability and the respondent’s place of residence.
Figure 22.
A graph of interaction between the limitations regarding car availability and the respondent’s place of residence.

Figure 23.
A graph of interaction between limitations in terms of bus availability and the age of the respondent.
Figure 23.
A graph of interaction between limitations in terms of bus availability and the age of the respondent.

Figure 24.
Graph of the interaction between the limitations in the availability of the bus and occupation.
Figure 24.
Graph of the interaction between the limitations in the availability of the bus and occupation.

Figure 25.
A graph of interactions between the limitations of bus availability and the respondent’s industry.
Figure 25.
A graph of interactions between the limitations of bus availability and the respondent’s industry.

Figure 26.
A graph of the interaction between the limitations to bus availability and the education level of the respondent.
Figure 26.
A graph of the interaction between the limitations to bus availability and the education level of the respondent.

Figure 27.
Graph of interactions between the limitations of bus availability and the respondent’s place of residence.
Figure 27.
Graph of interactions between the limitations of bus availability and the respondent’s place of residence.

Figure 28.
Graph of the interactions between the limitations to bus availability and the gender of the respondent.
Figure 28.
Graph of the interactions between the limitations to bus availability and the gender of the respondent.

Figure 29.
A graph of the interaction between limitations in the availability of tram transport and the age of the respondent.
Figure 29.
A graph of the interaction between limitations in the availability of tram transport and the age of the respondent.

Figure 30.
A graph of the interactions between the limitations in the accessibility of tram transport and the respondents’ occupation.
Figure 30.
A graph of the interactions between the limitations in the accessibility of tram transport and the respondents’ occupation.

Figure 31.
A graph of interactions between limitations in the availability of tram transport and industry.
Figure 31.
A graph of interactions between limitations in the availability of tram transport and industry.

Figure 32.
A graph of the interaction between limitations in the availability of tram transport and education.
Figure 32.
A graph of the interaction between limitations in the availability of tram transport and education.

Figure 33.
A graph of interaction between the limitations of the accessibility of tram transport and place of residence.
Figure 33.
A graph of interaction between the limitations of the accessibility of tram transport and place of residence.

Figure 34.
A graph of the interaction between limitations in the availability of tram transport and gender.
Figure 34.
A graph of the interaction between limitations in the availability of tram transport and gender.


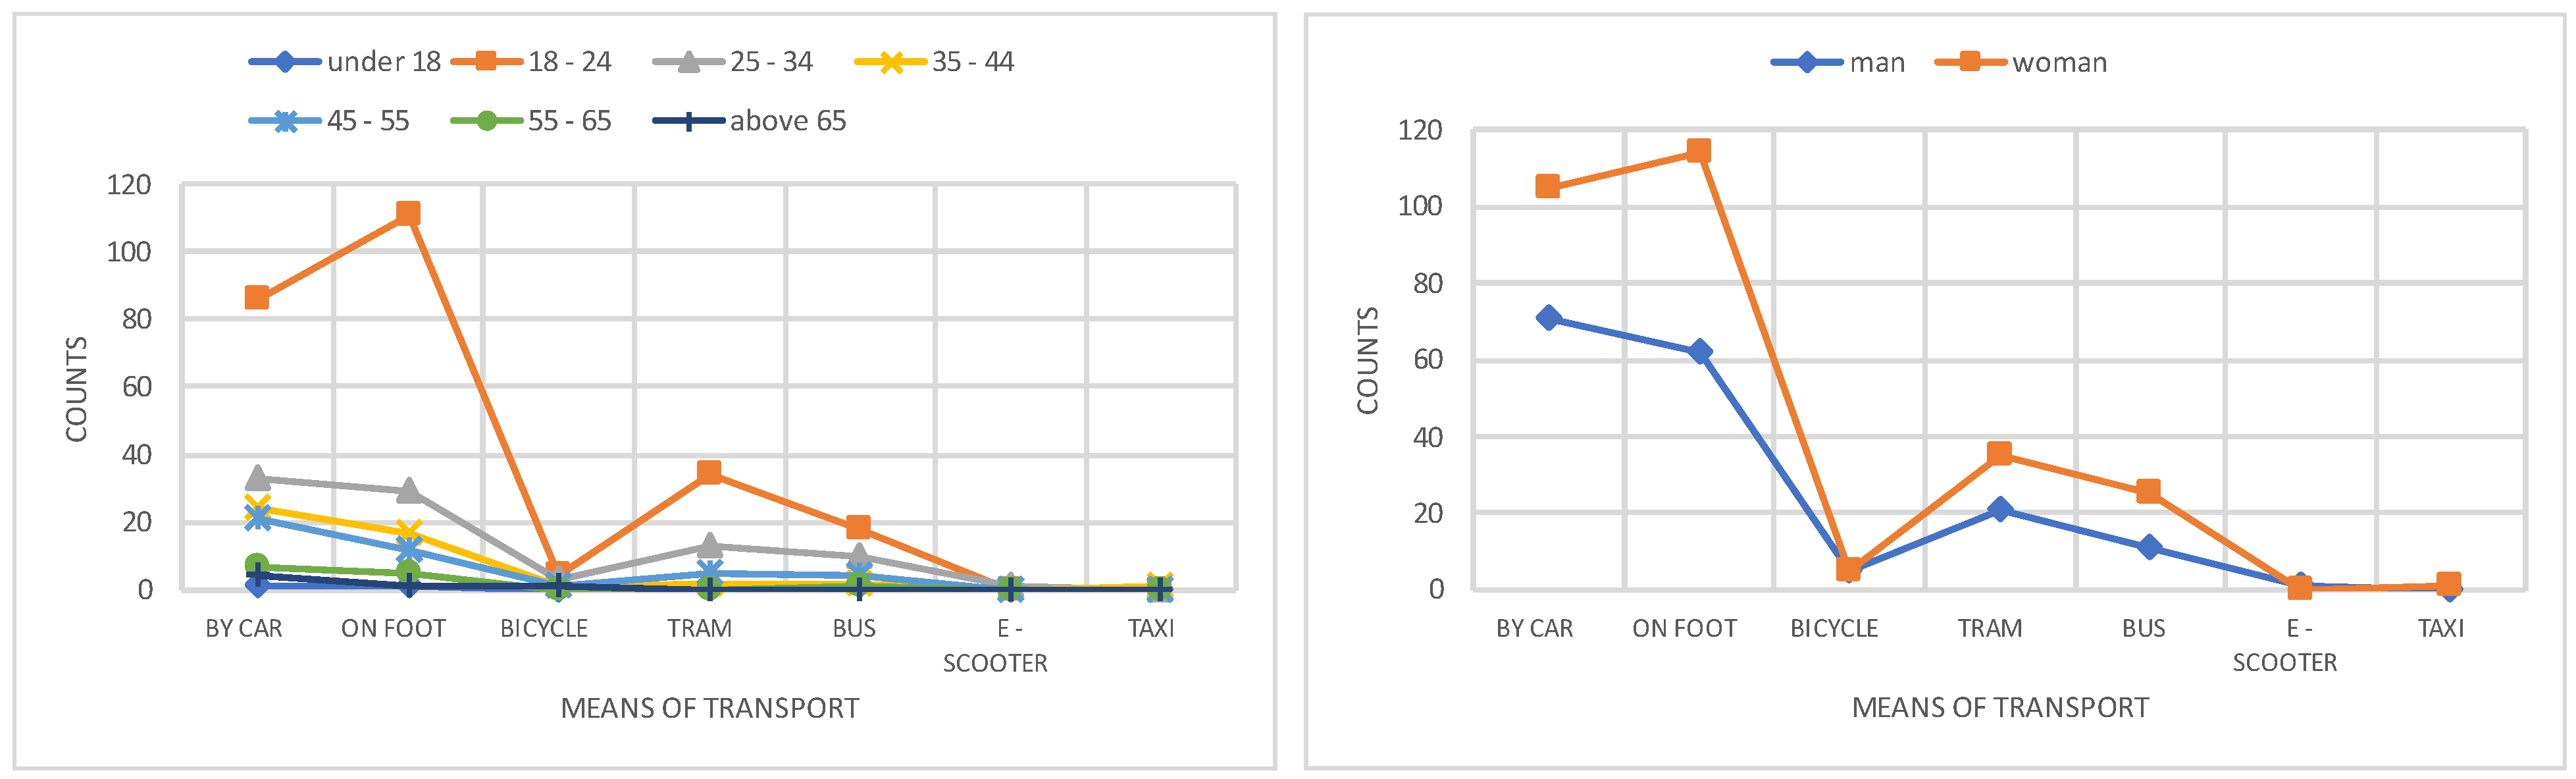
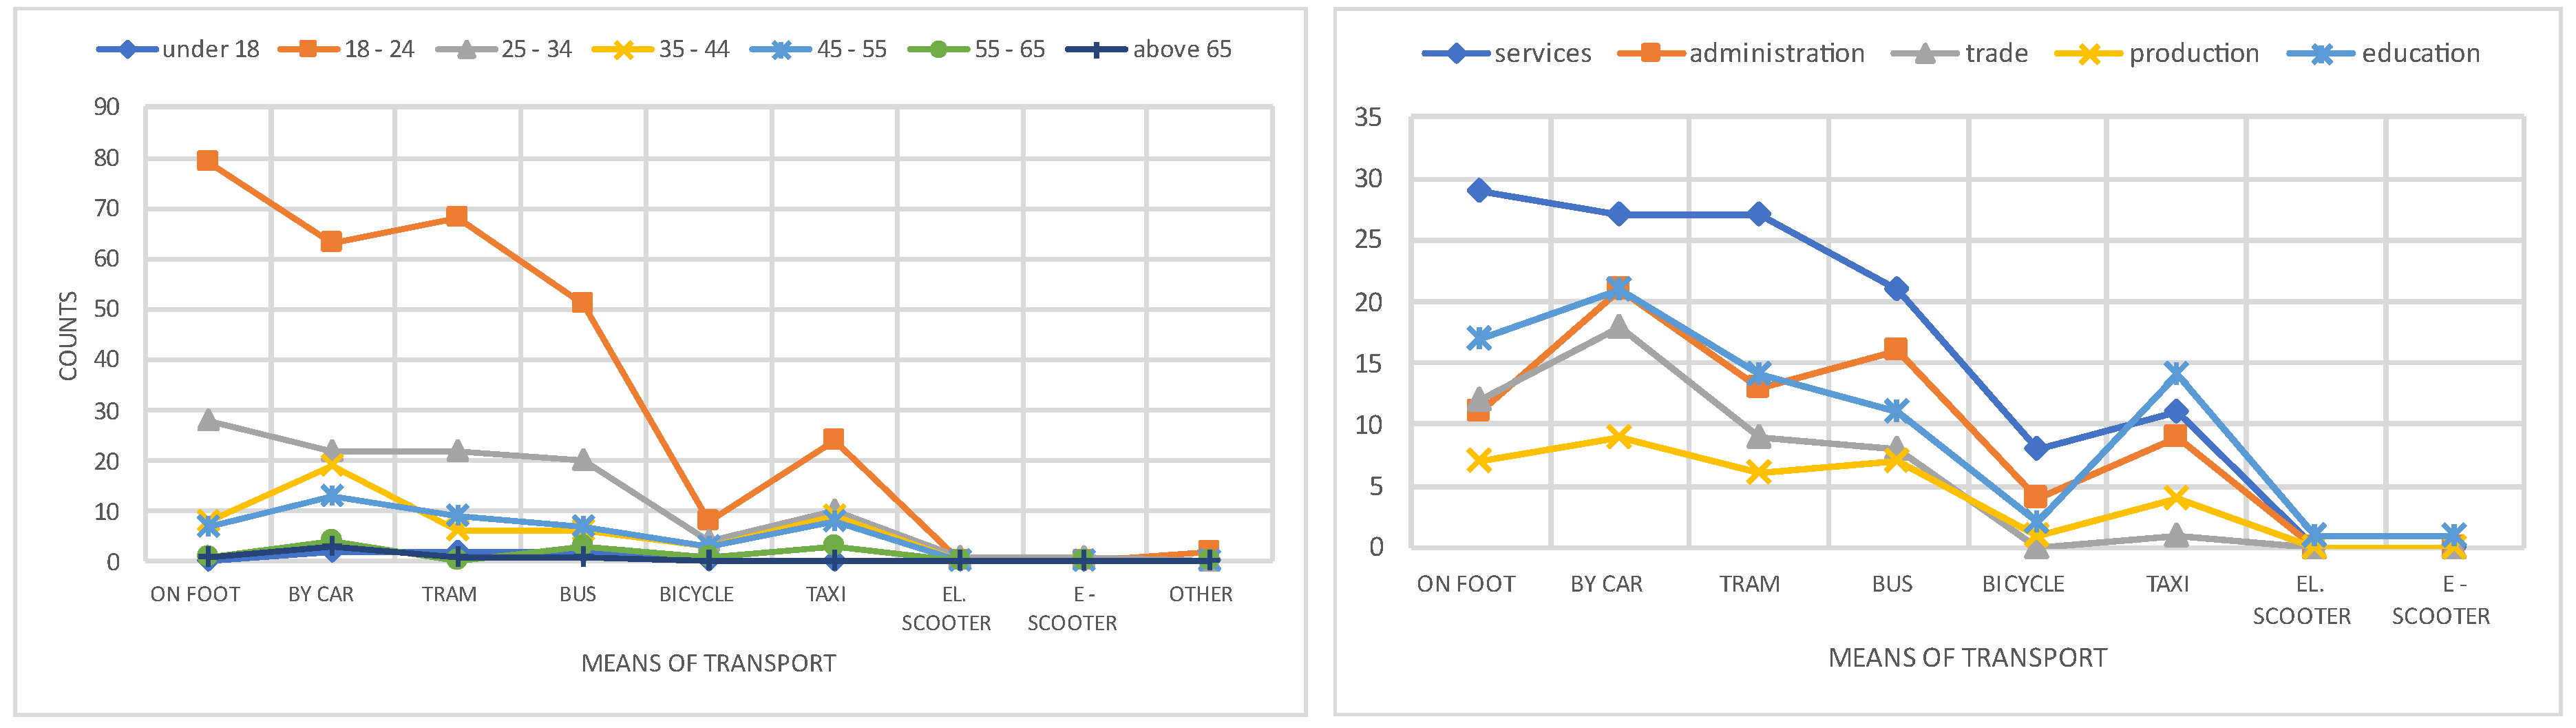
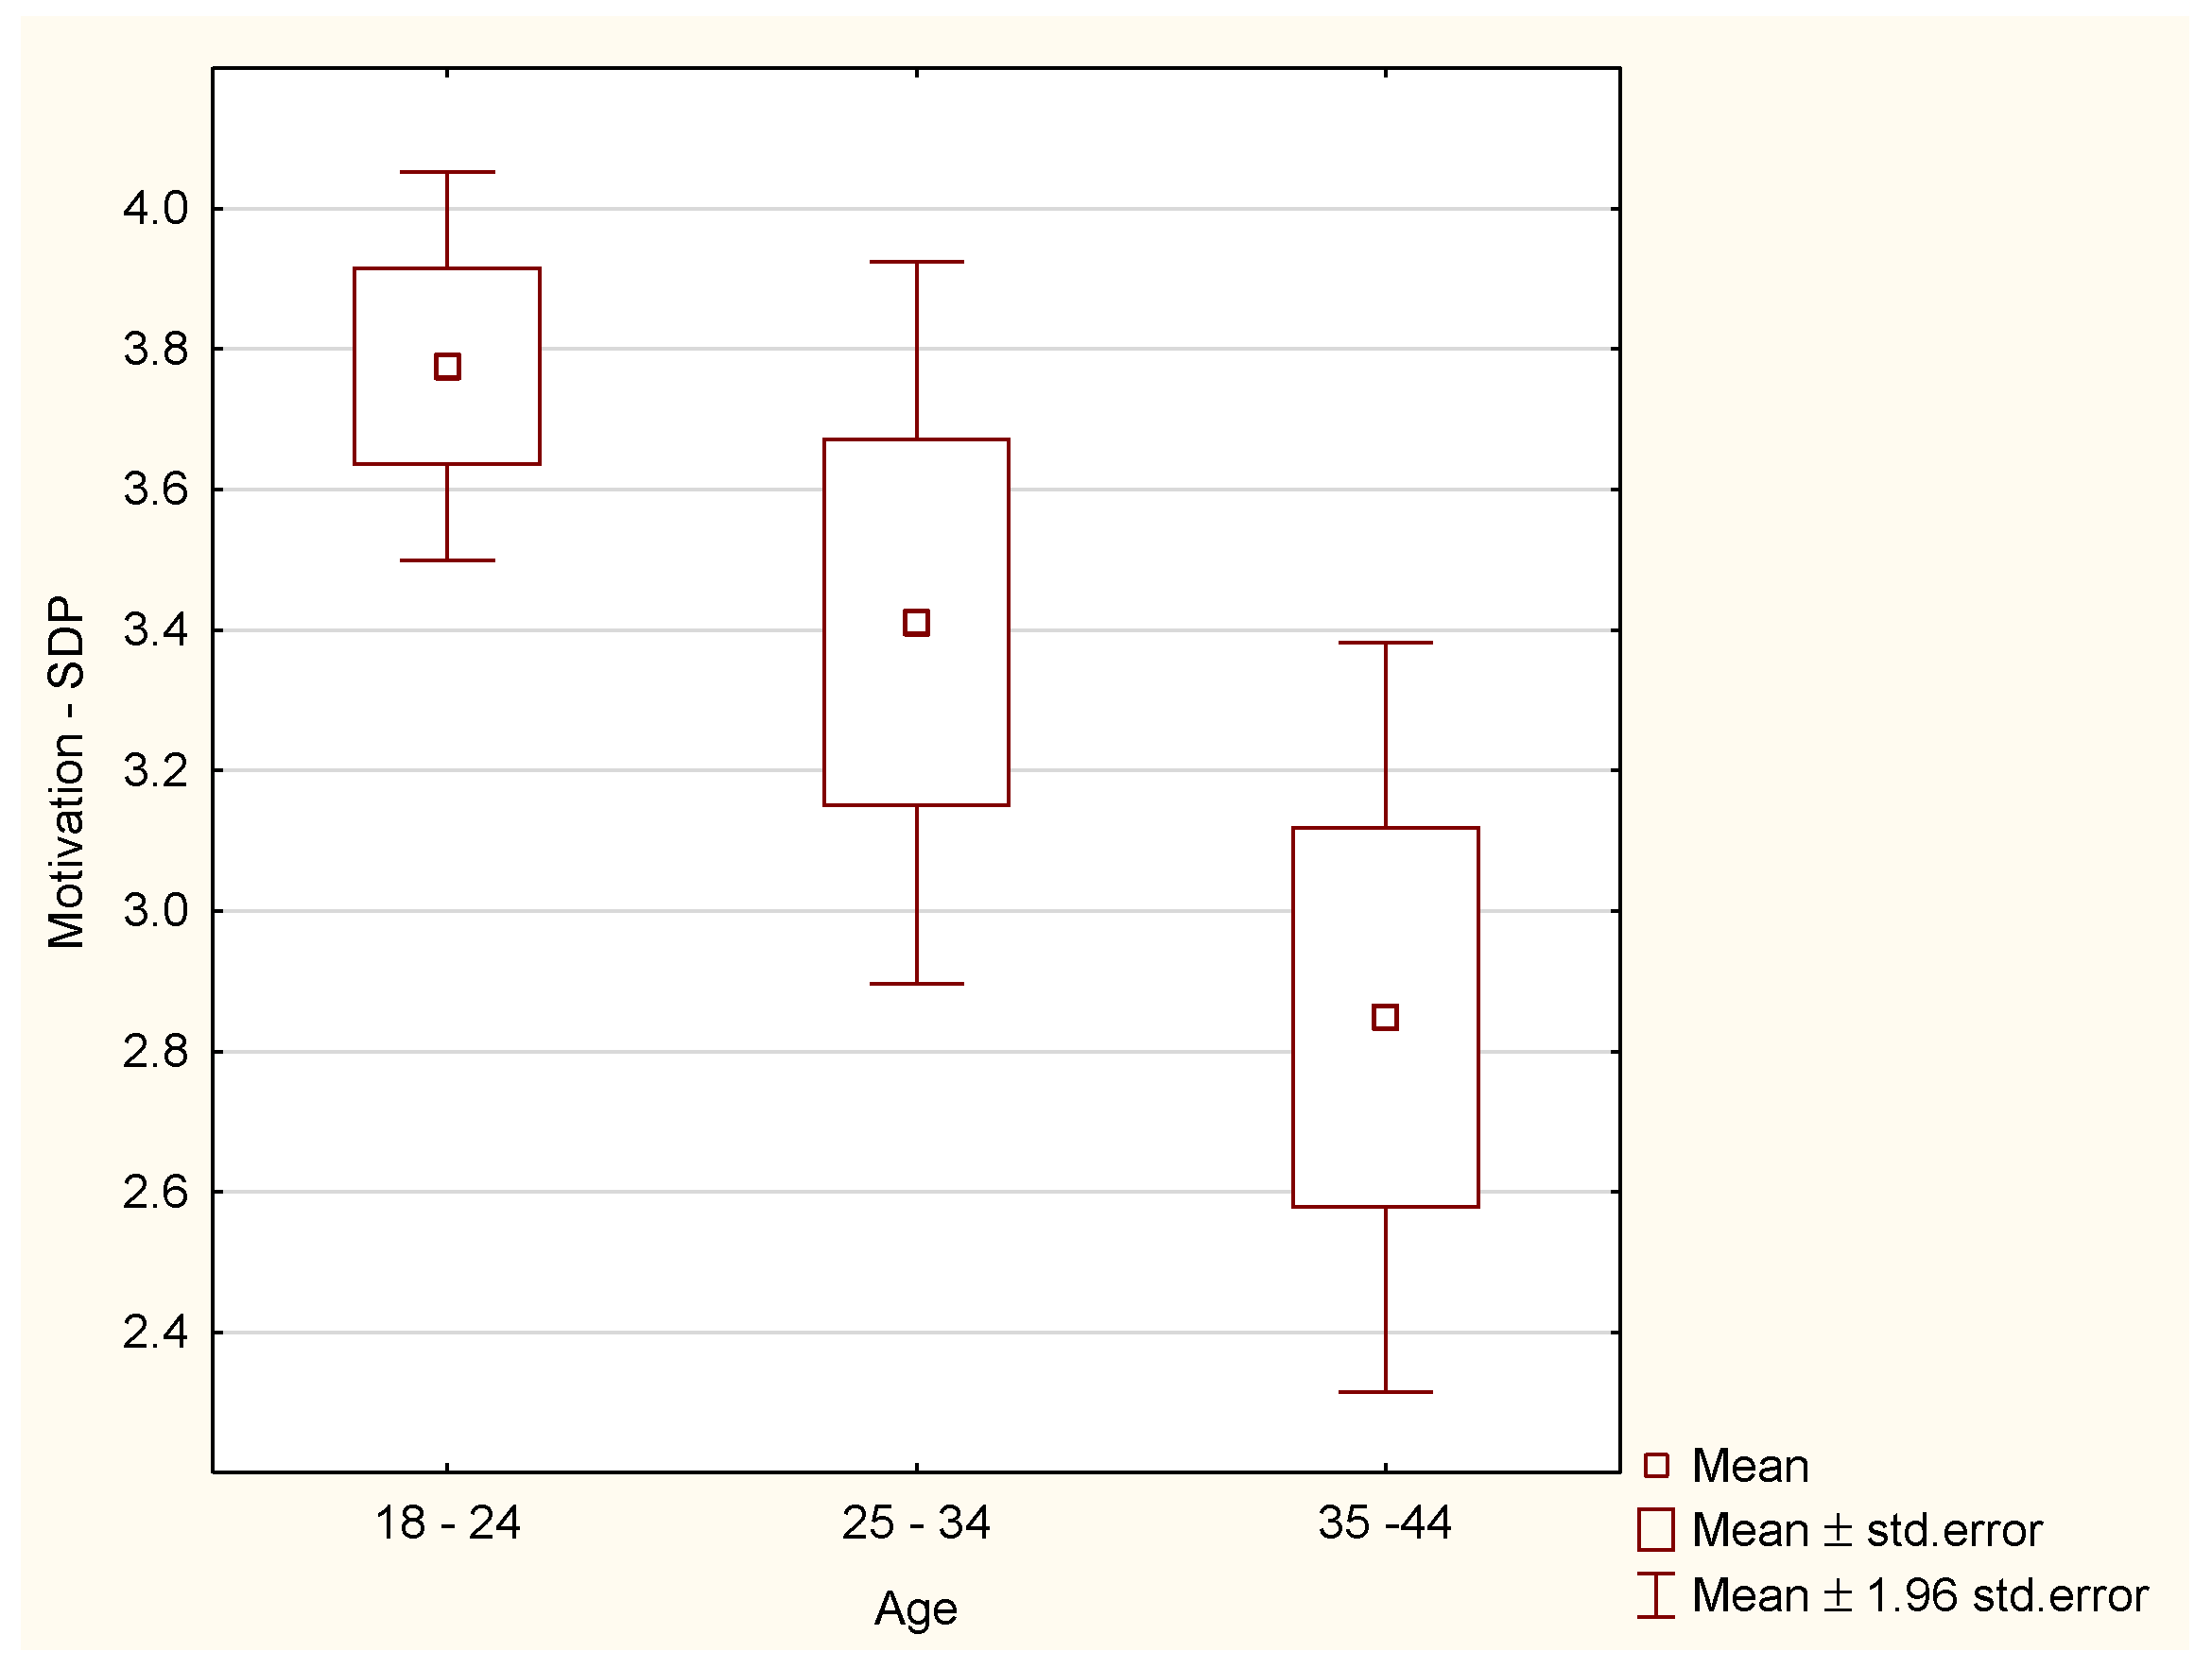
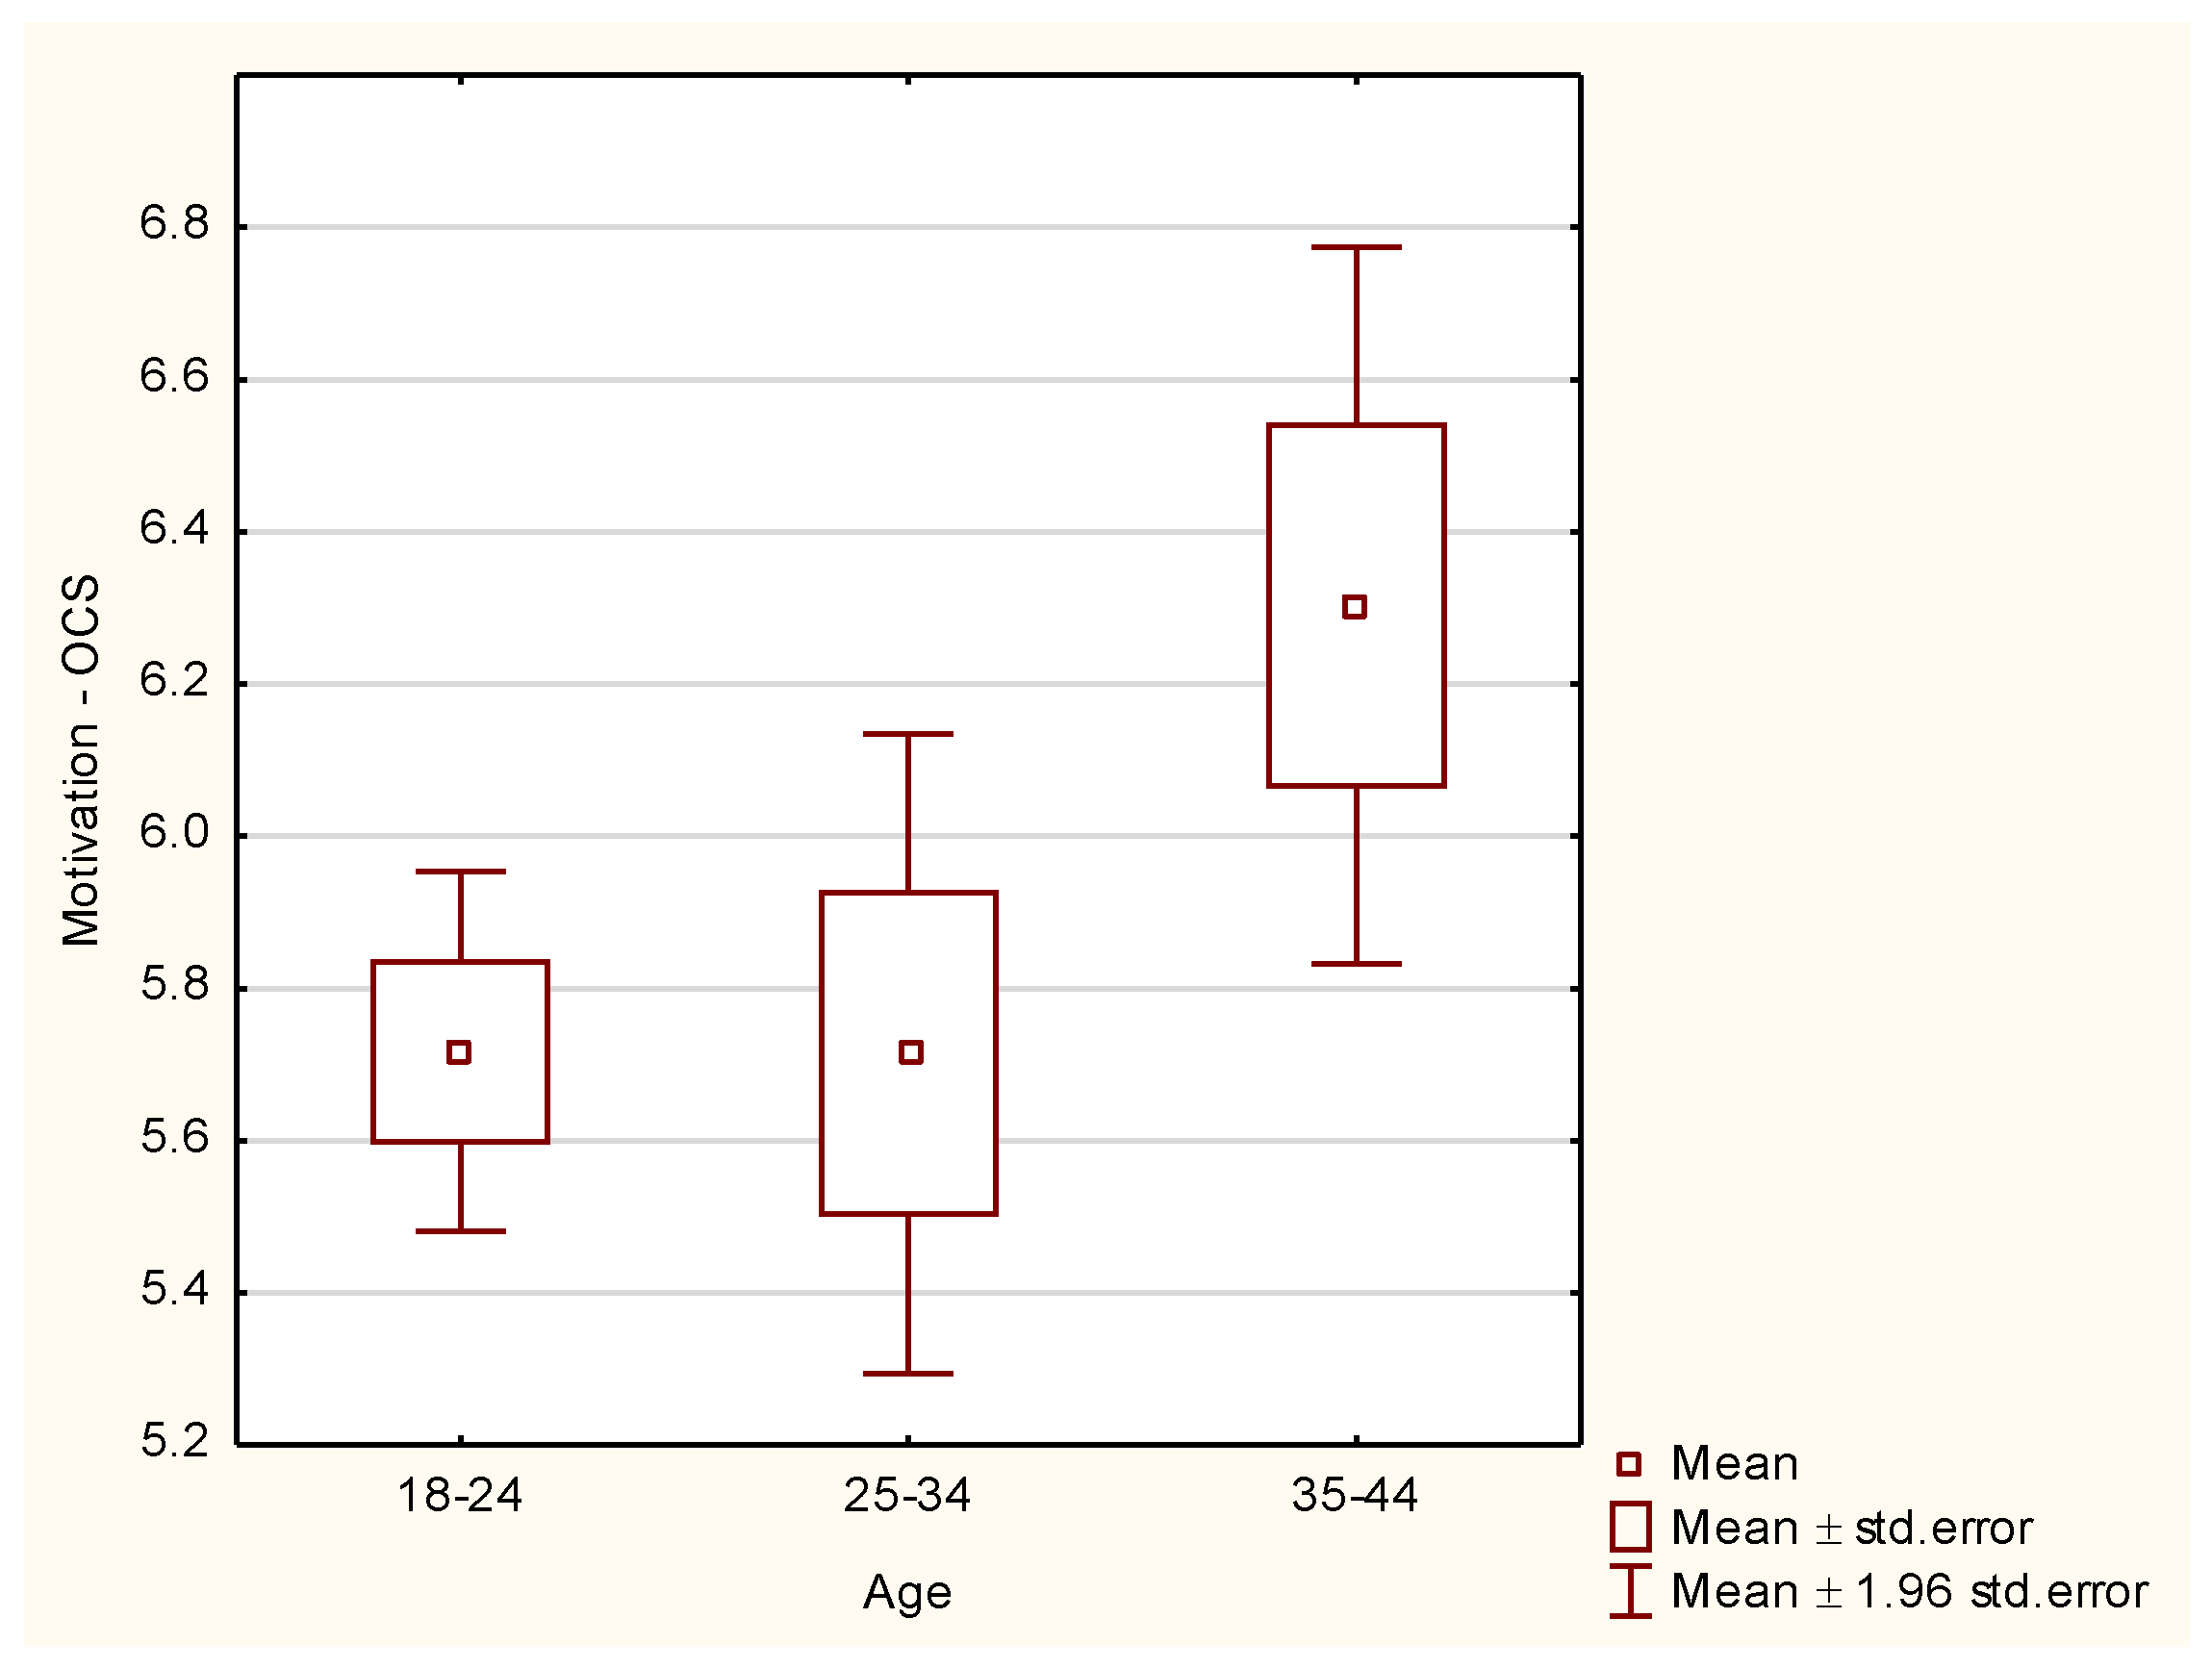
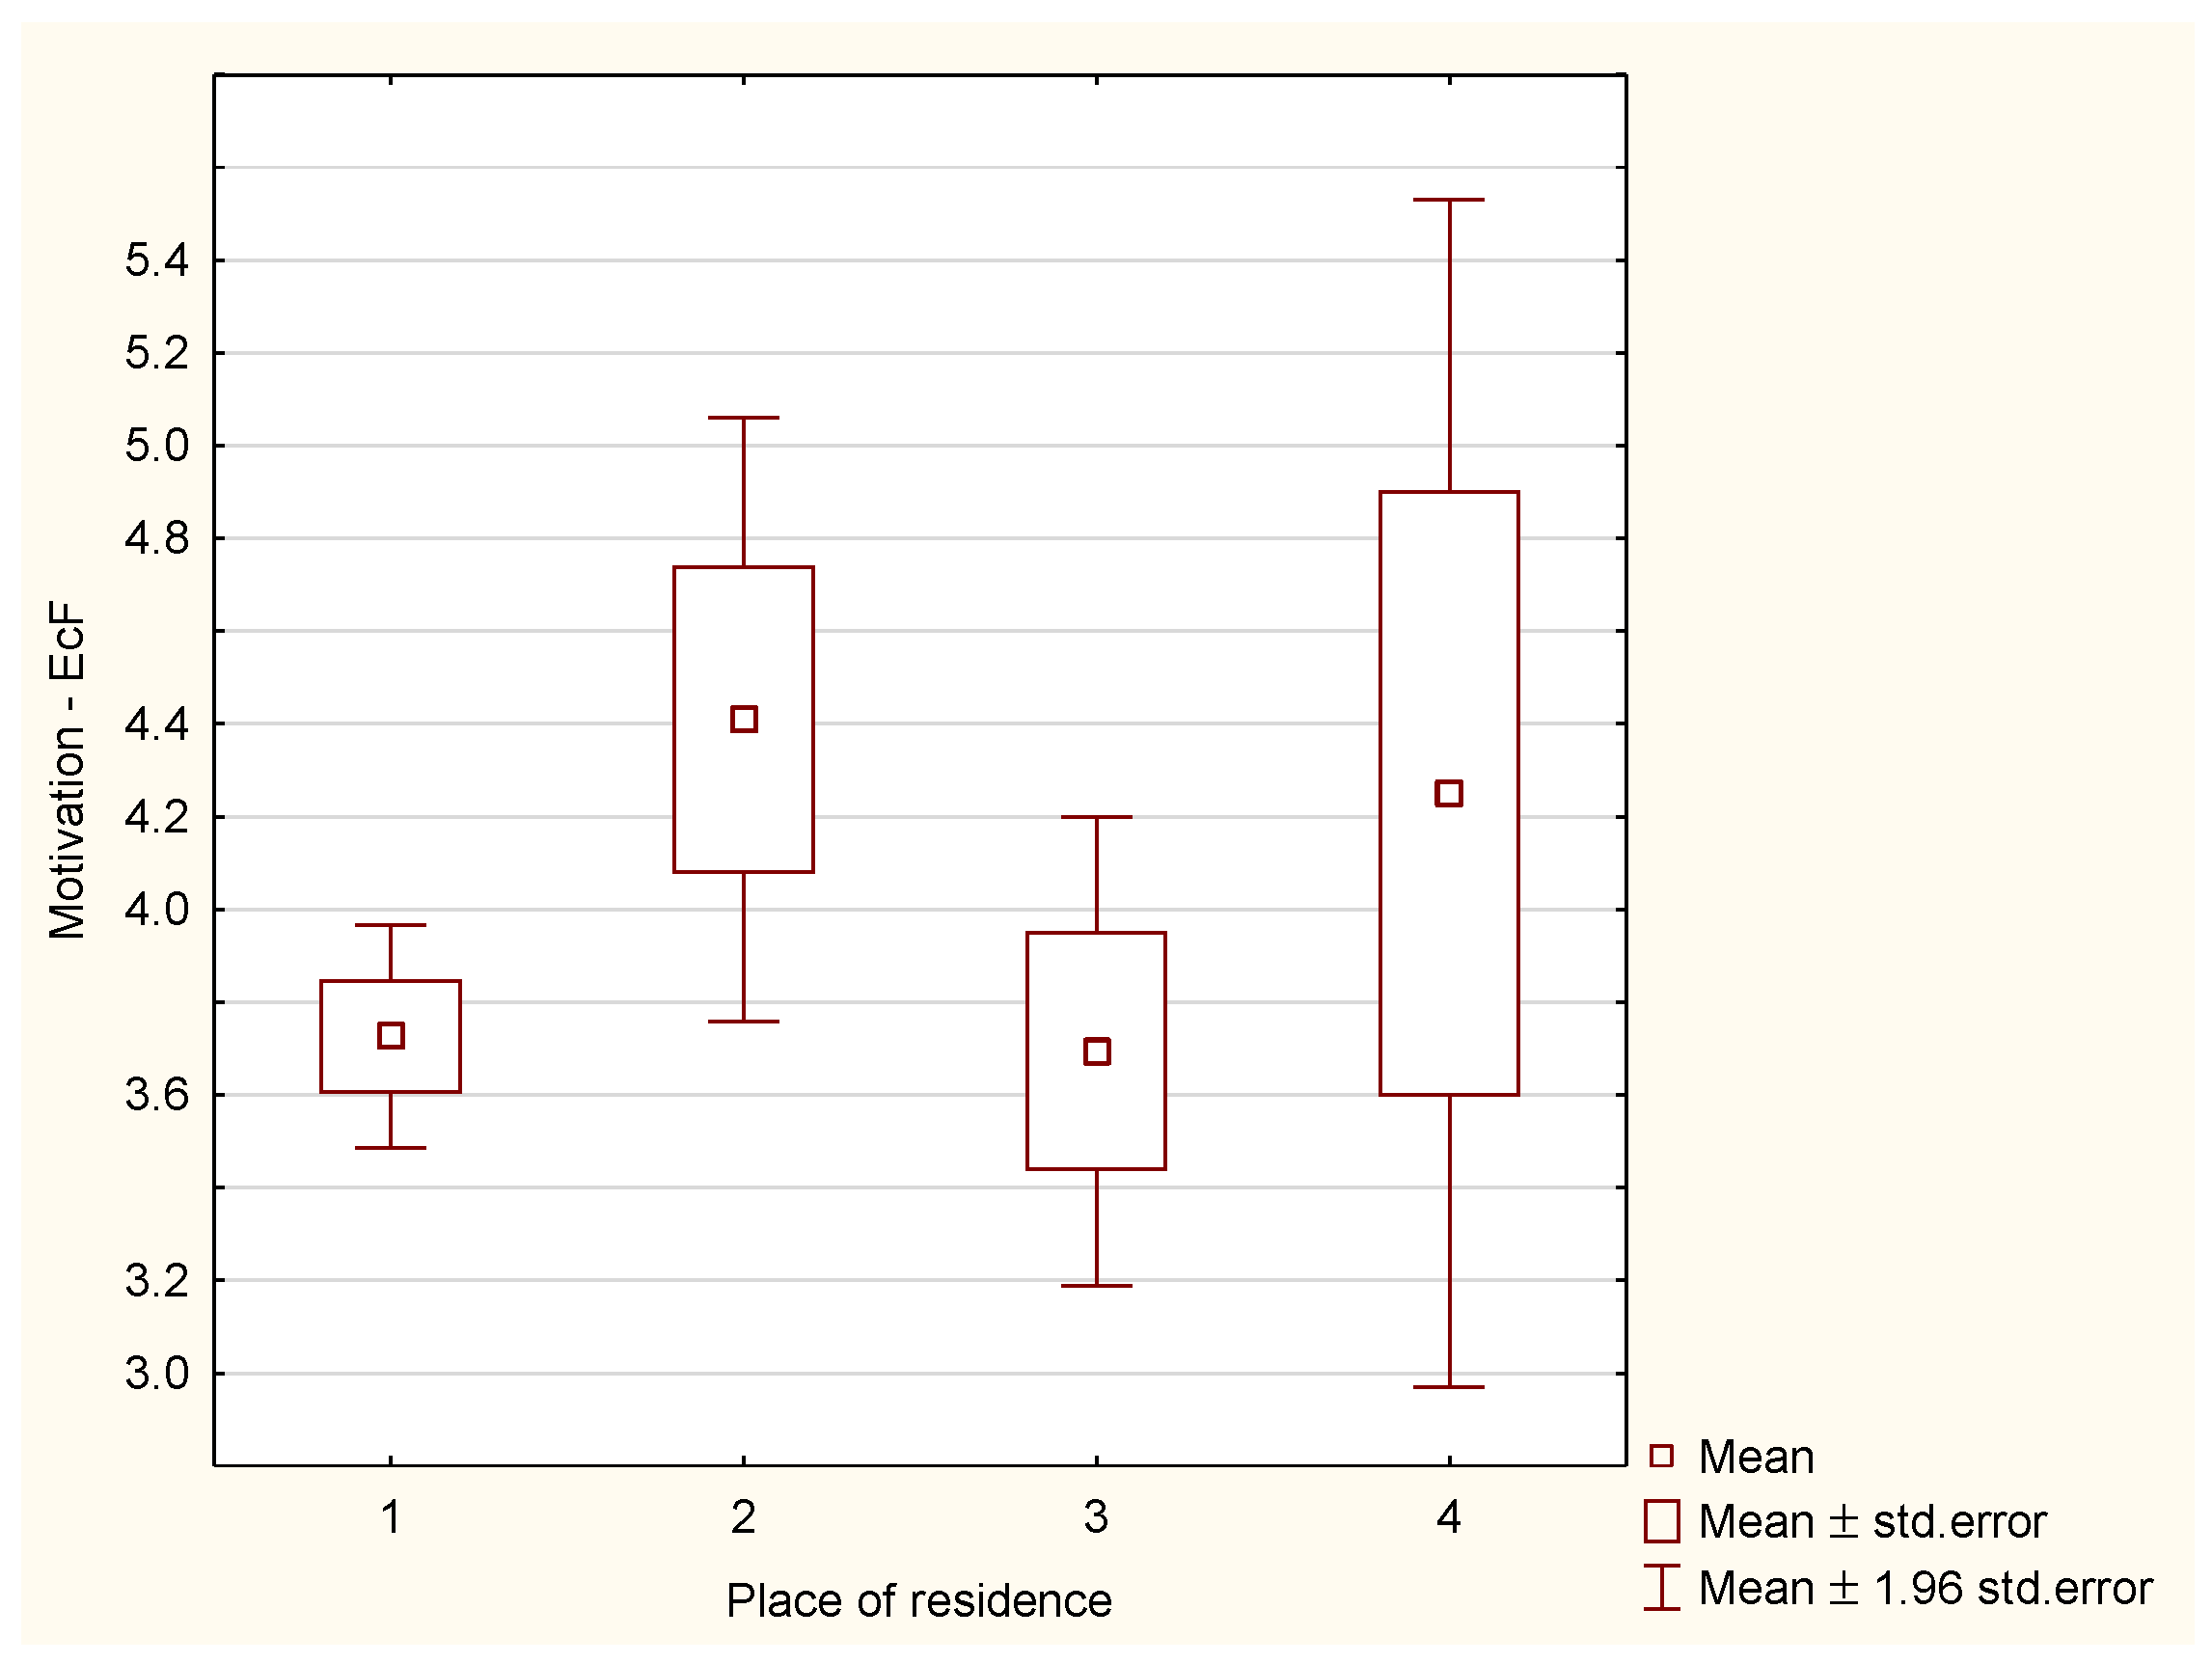
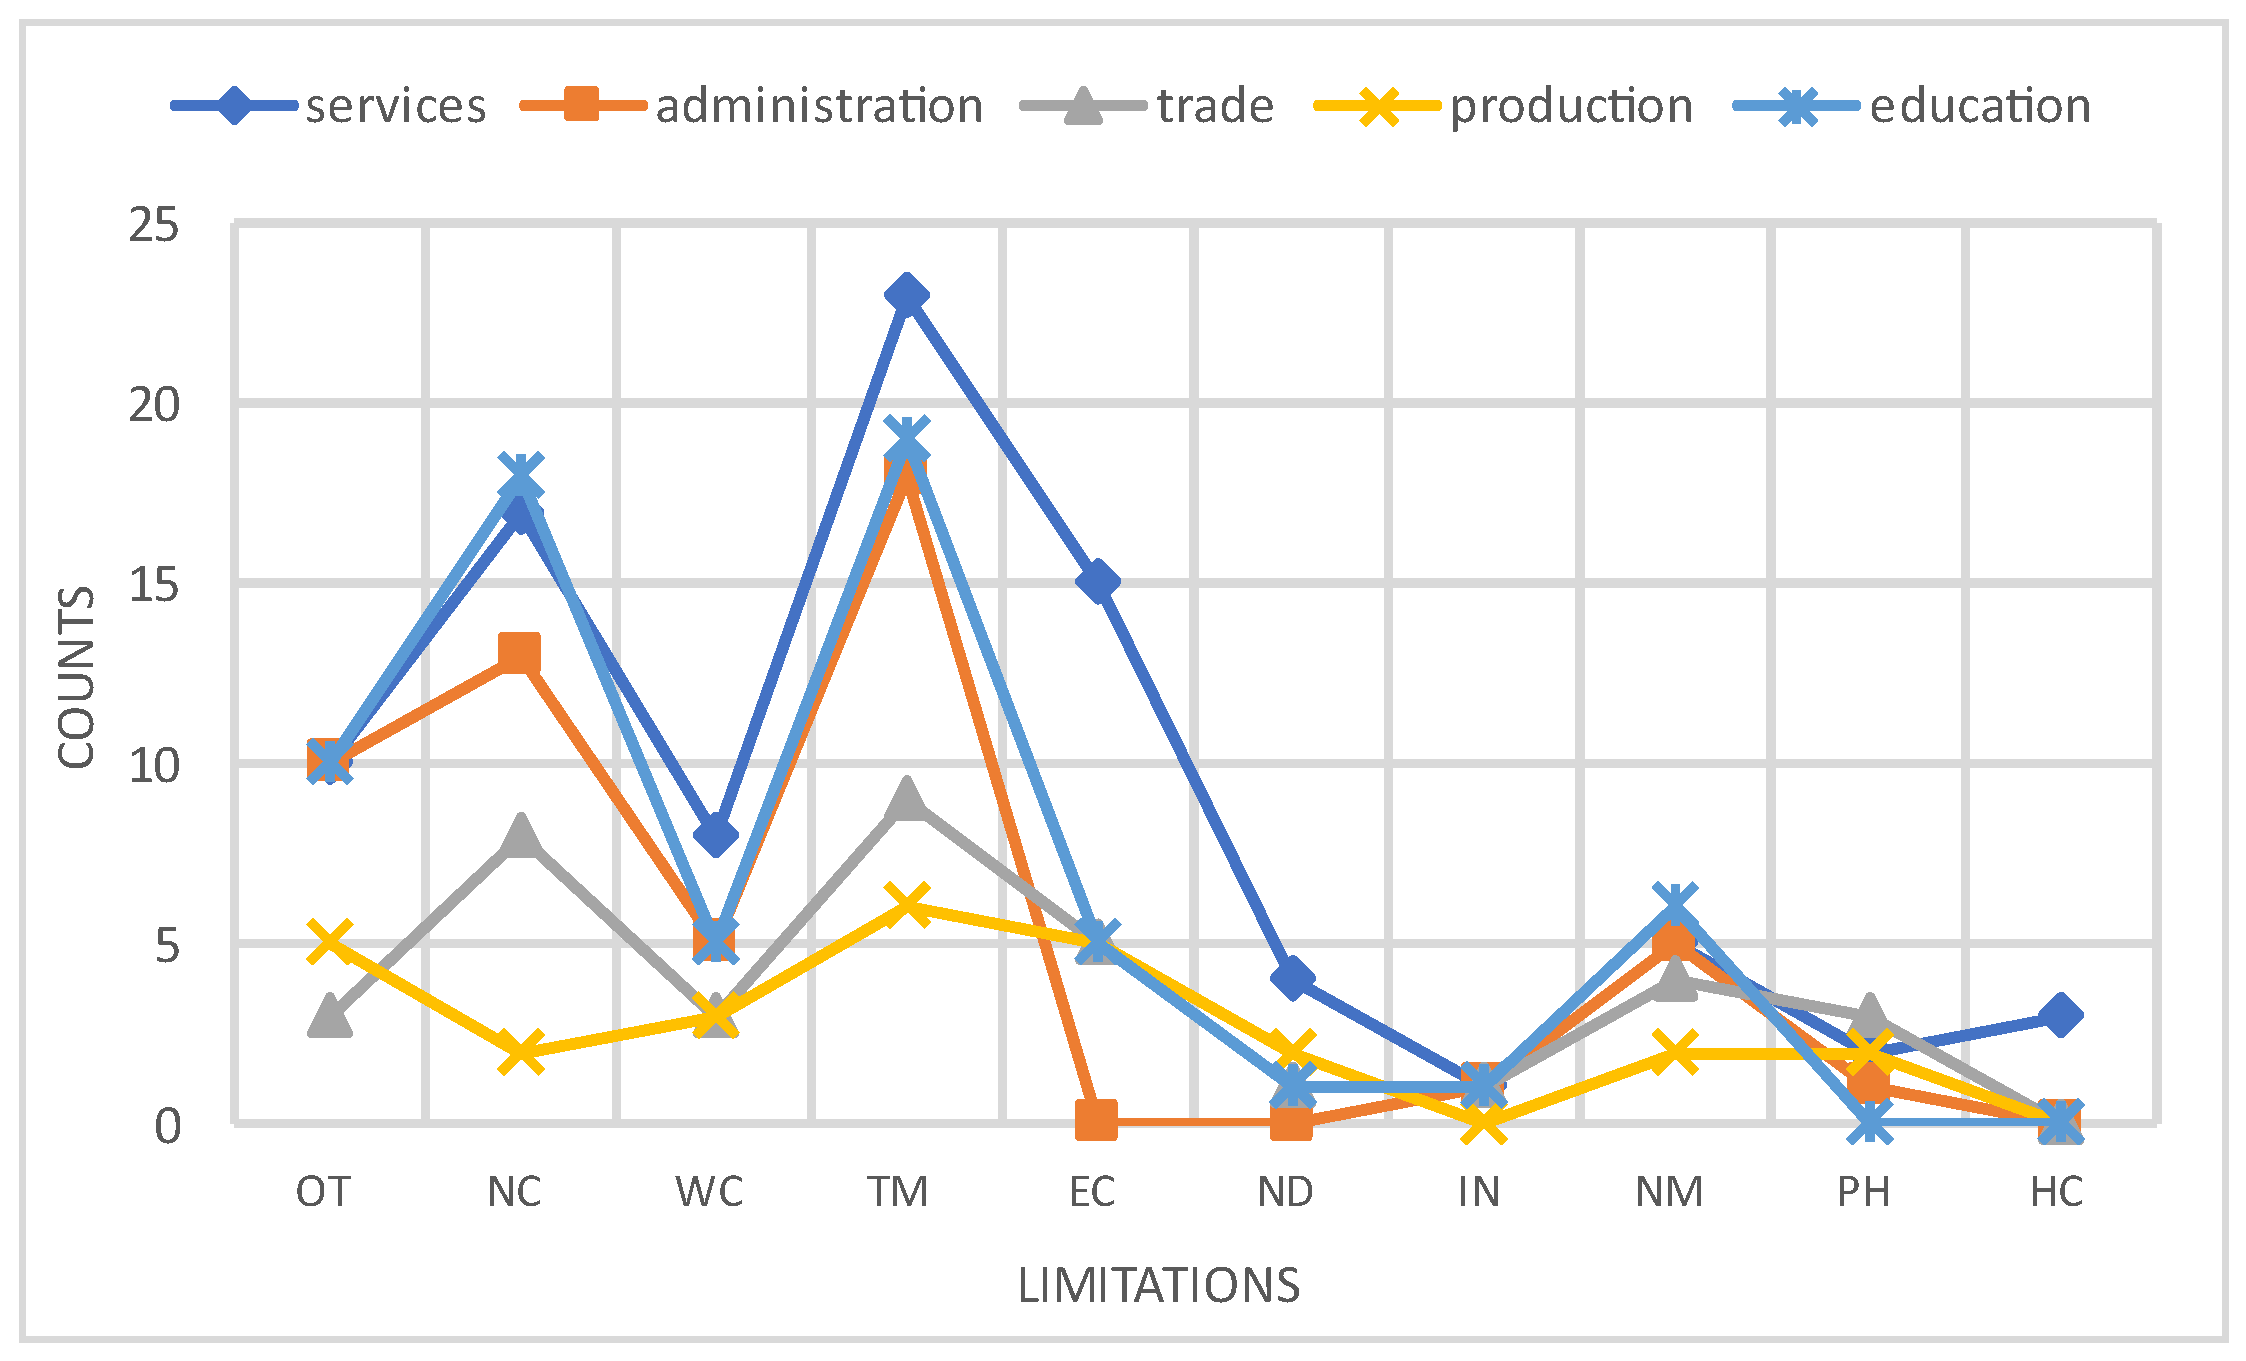
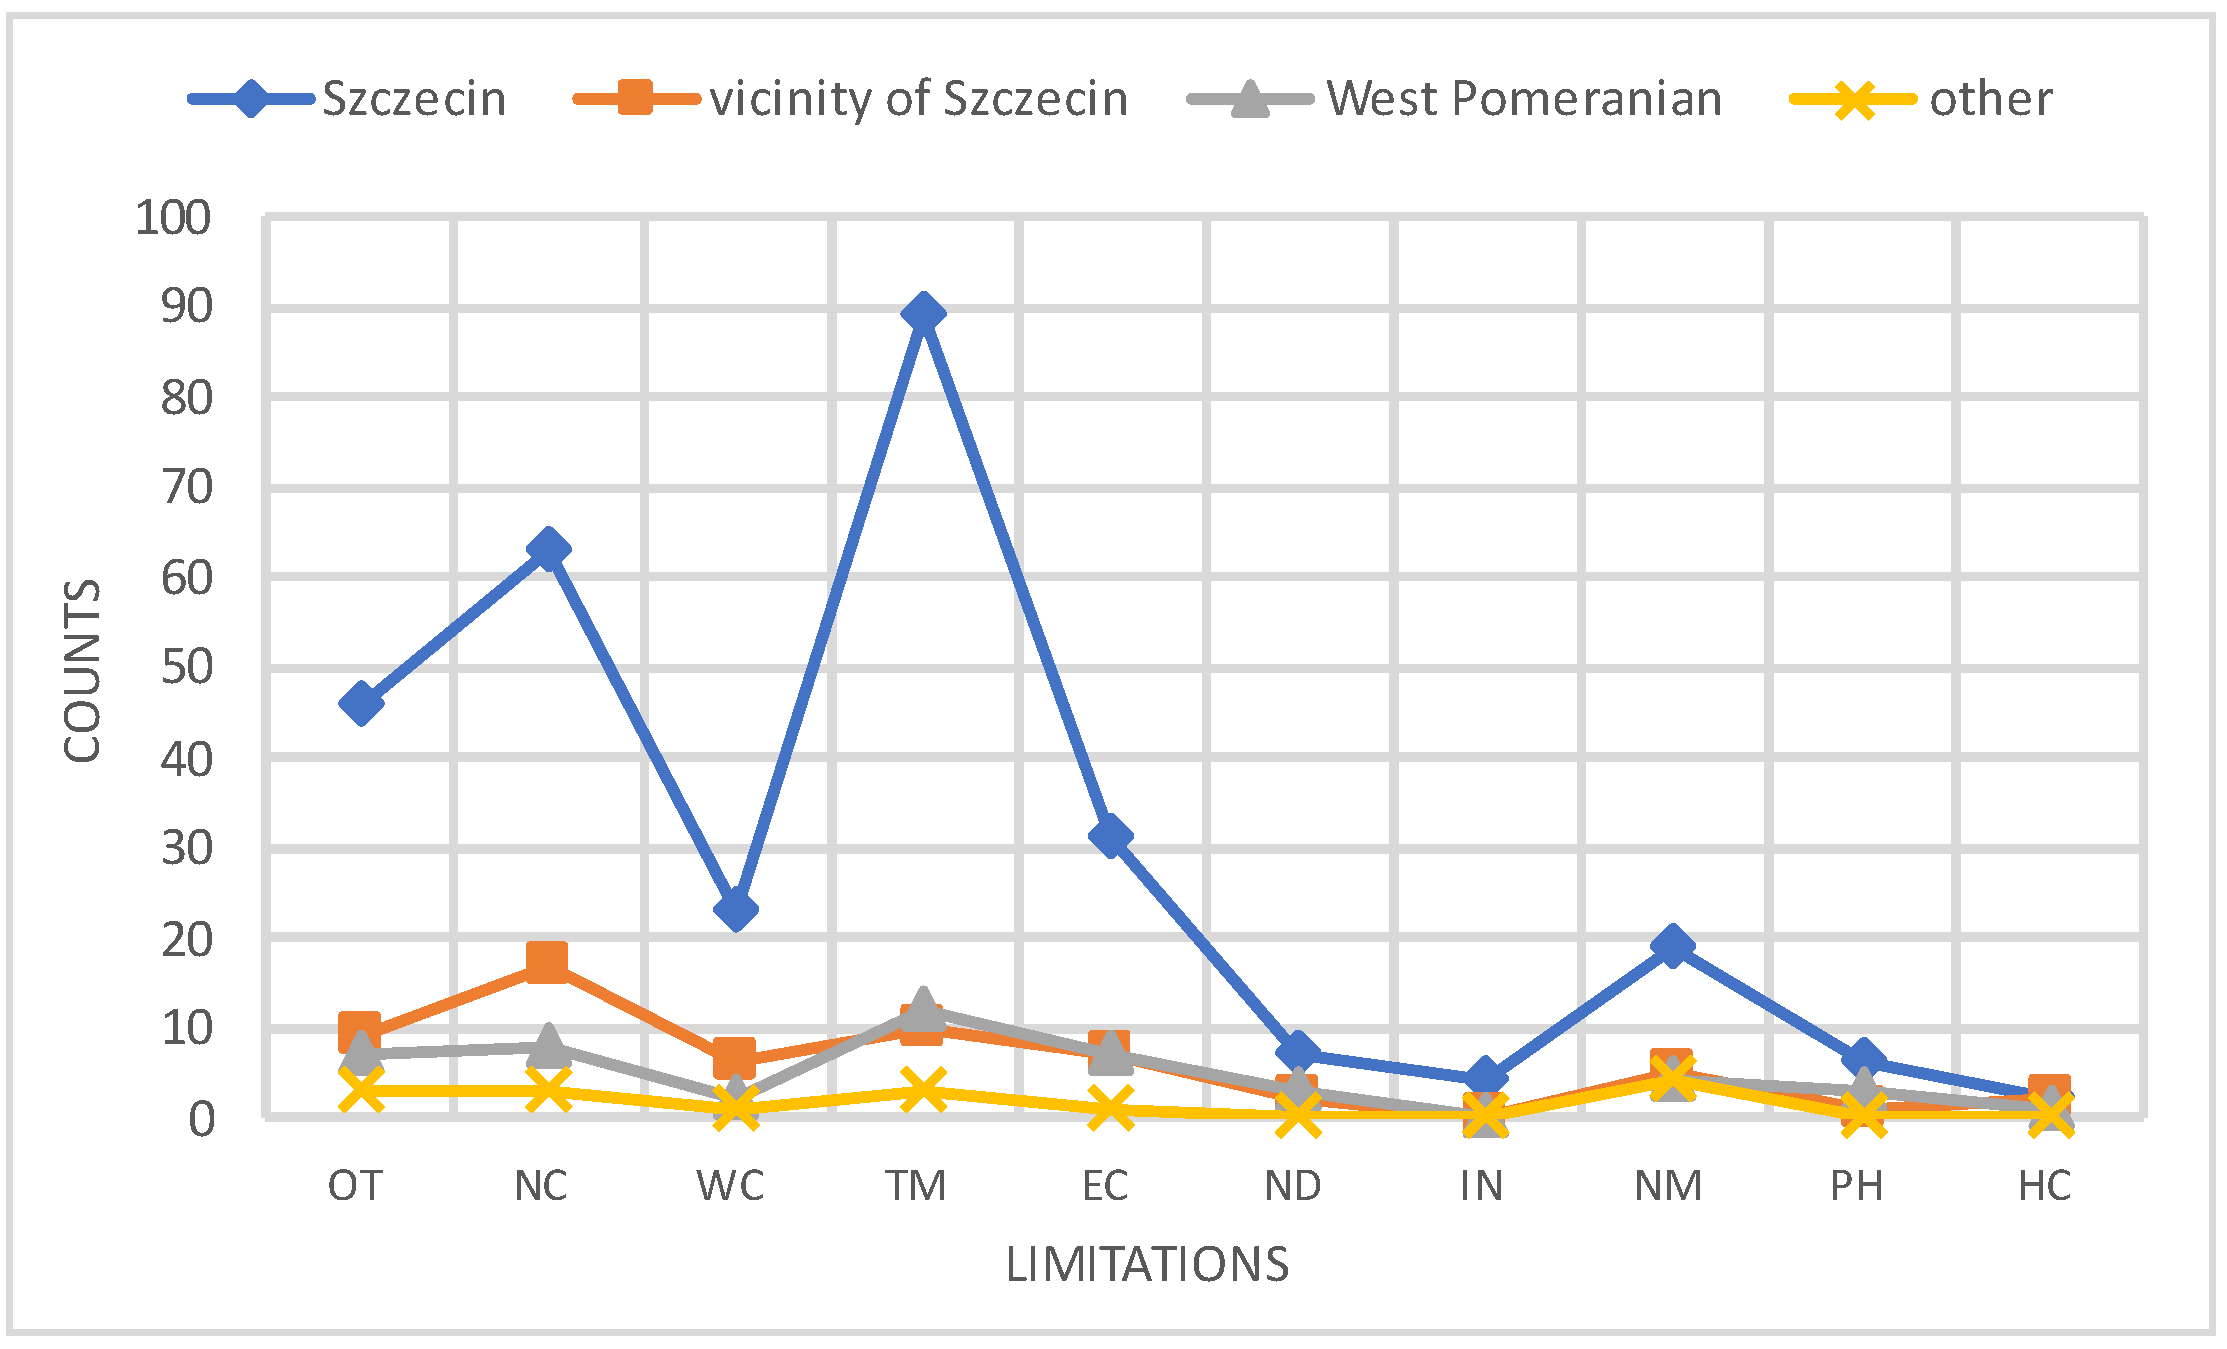
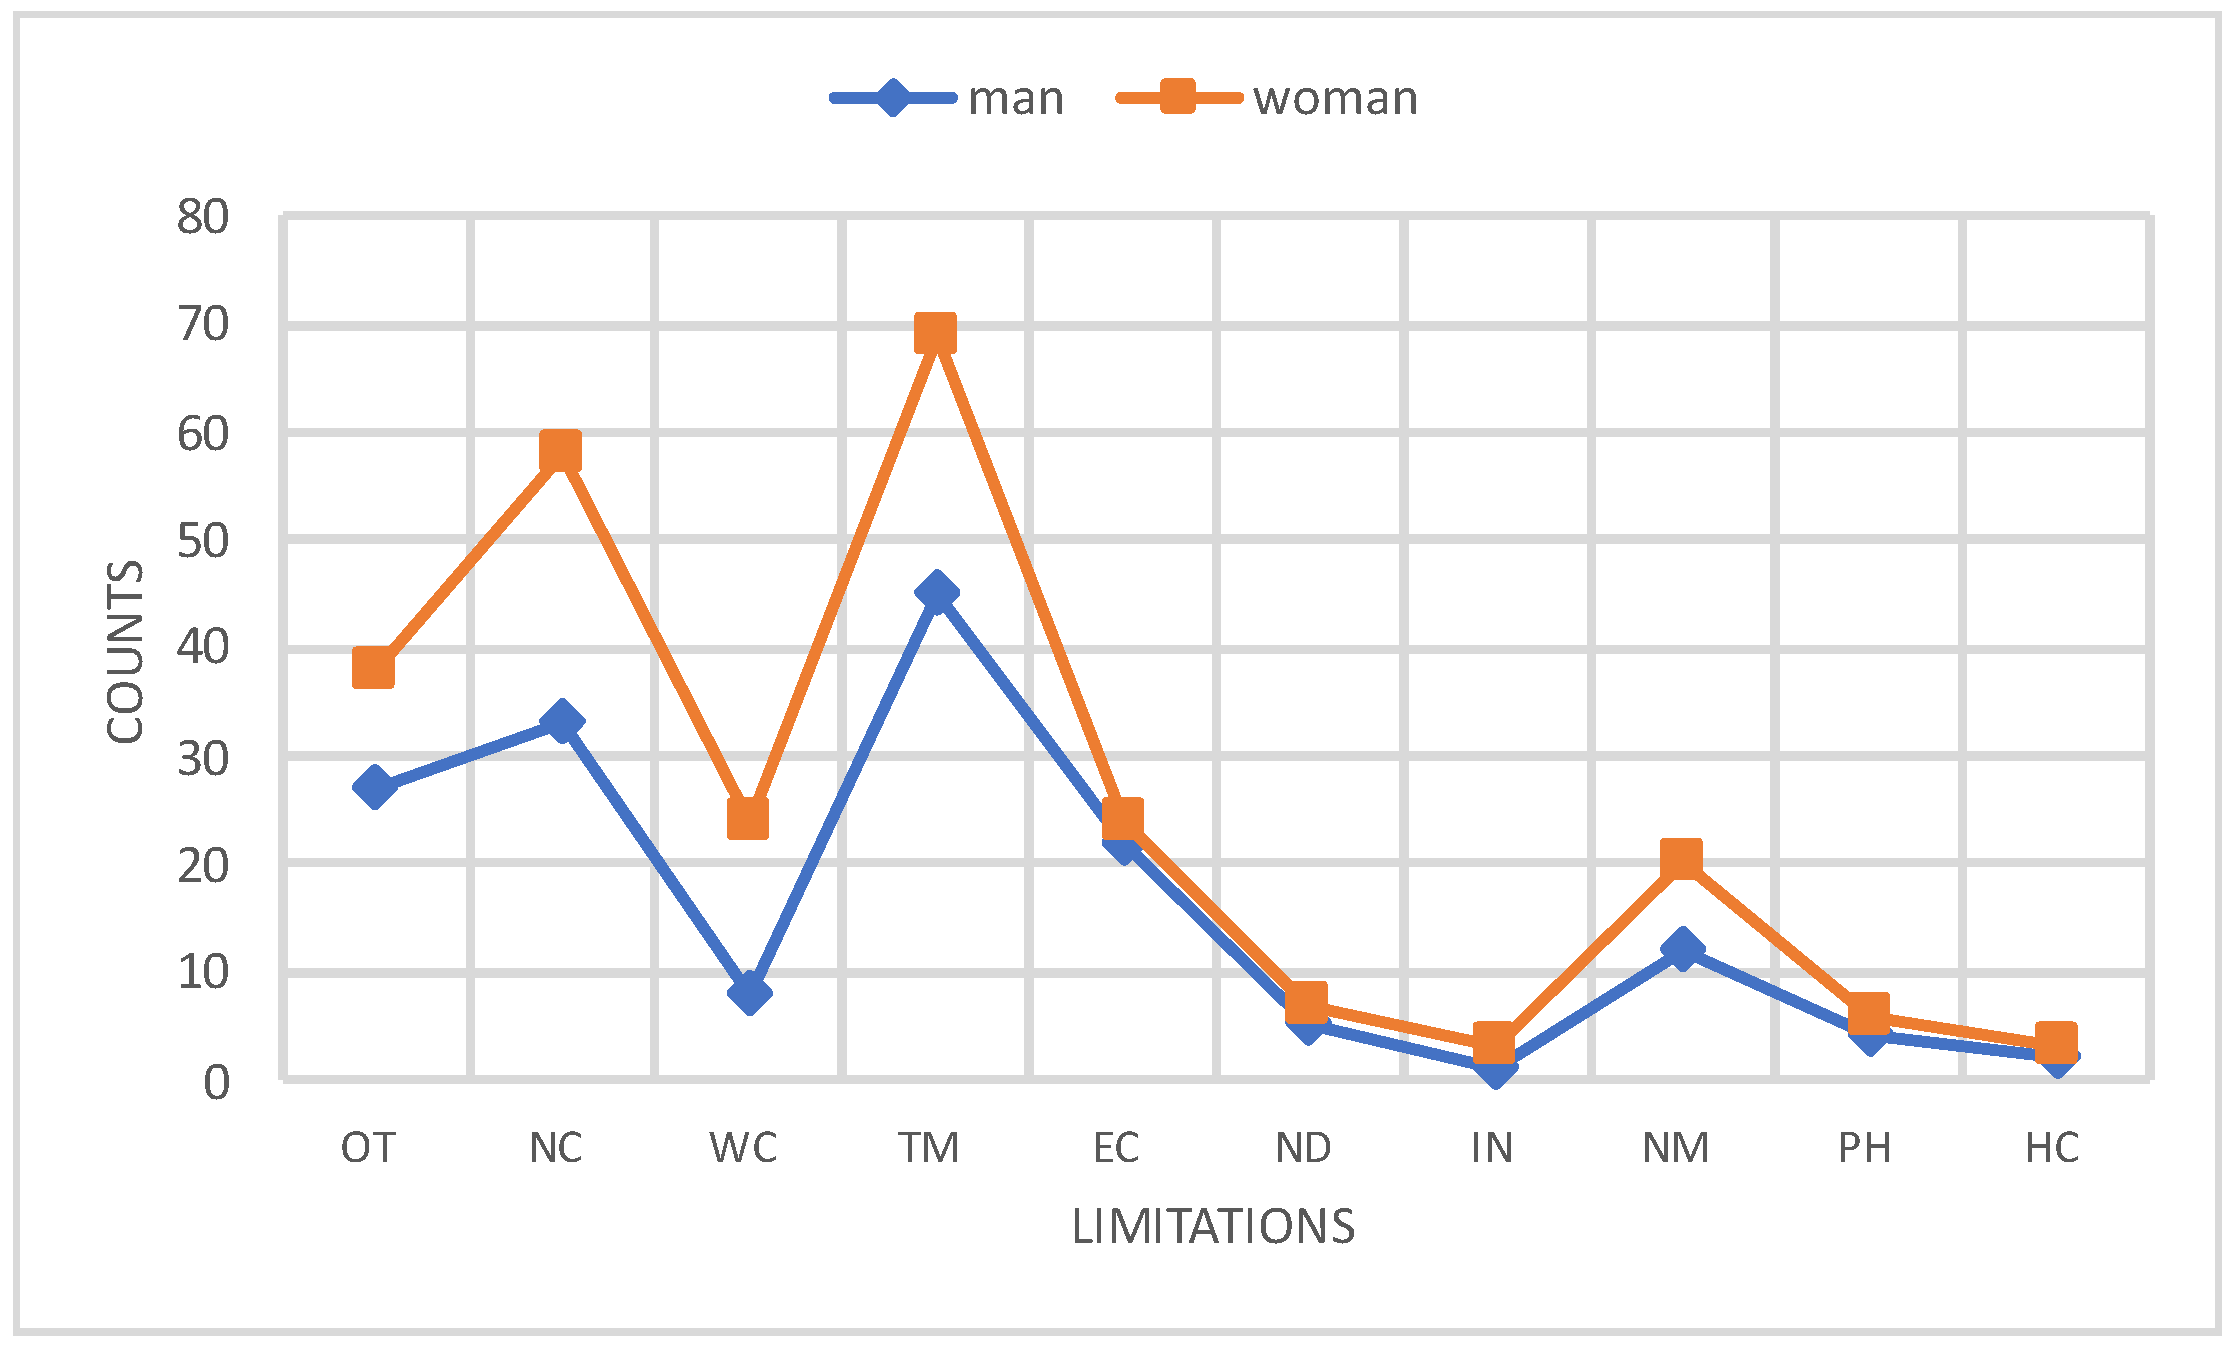
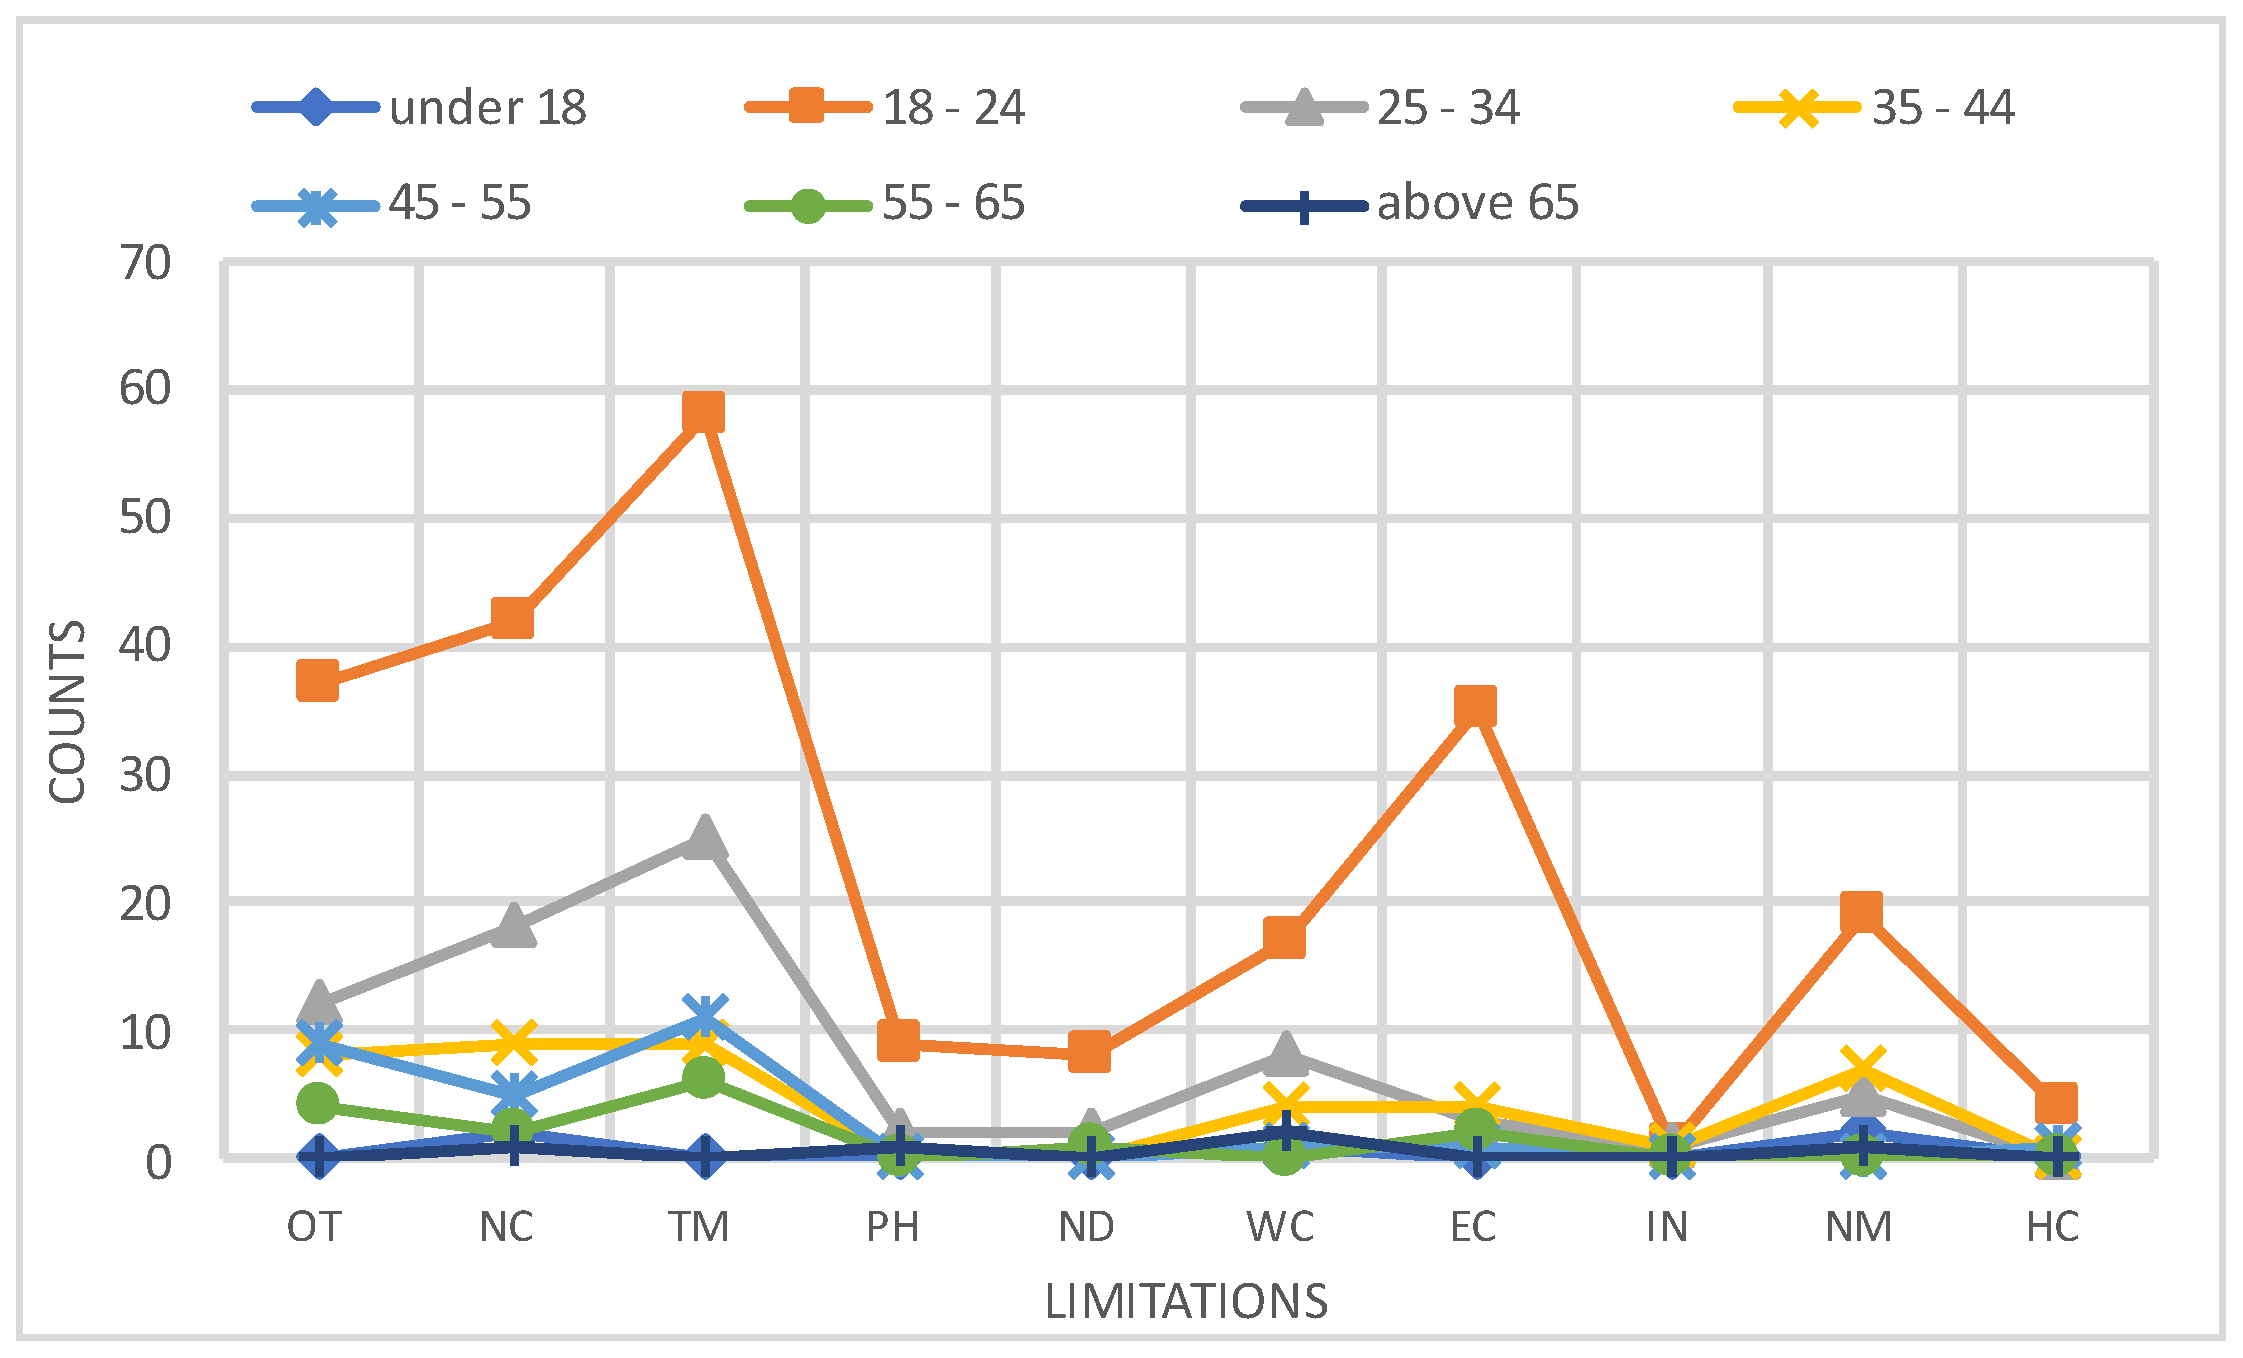
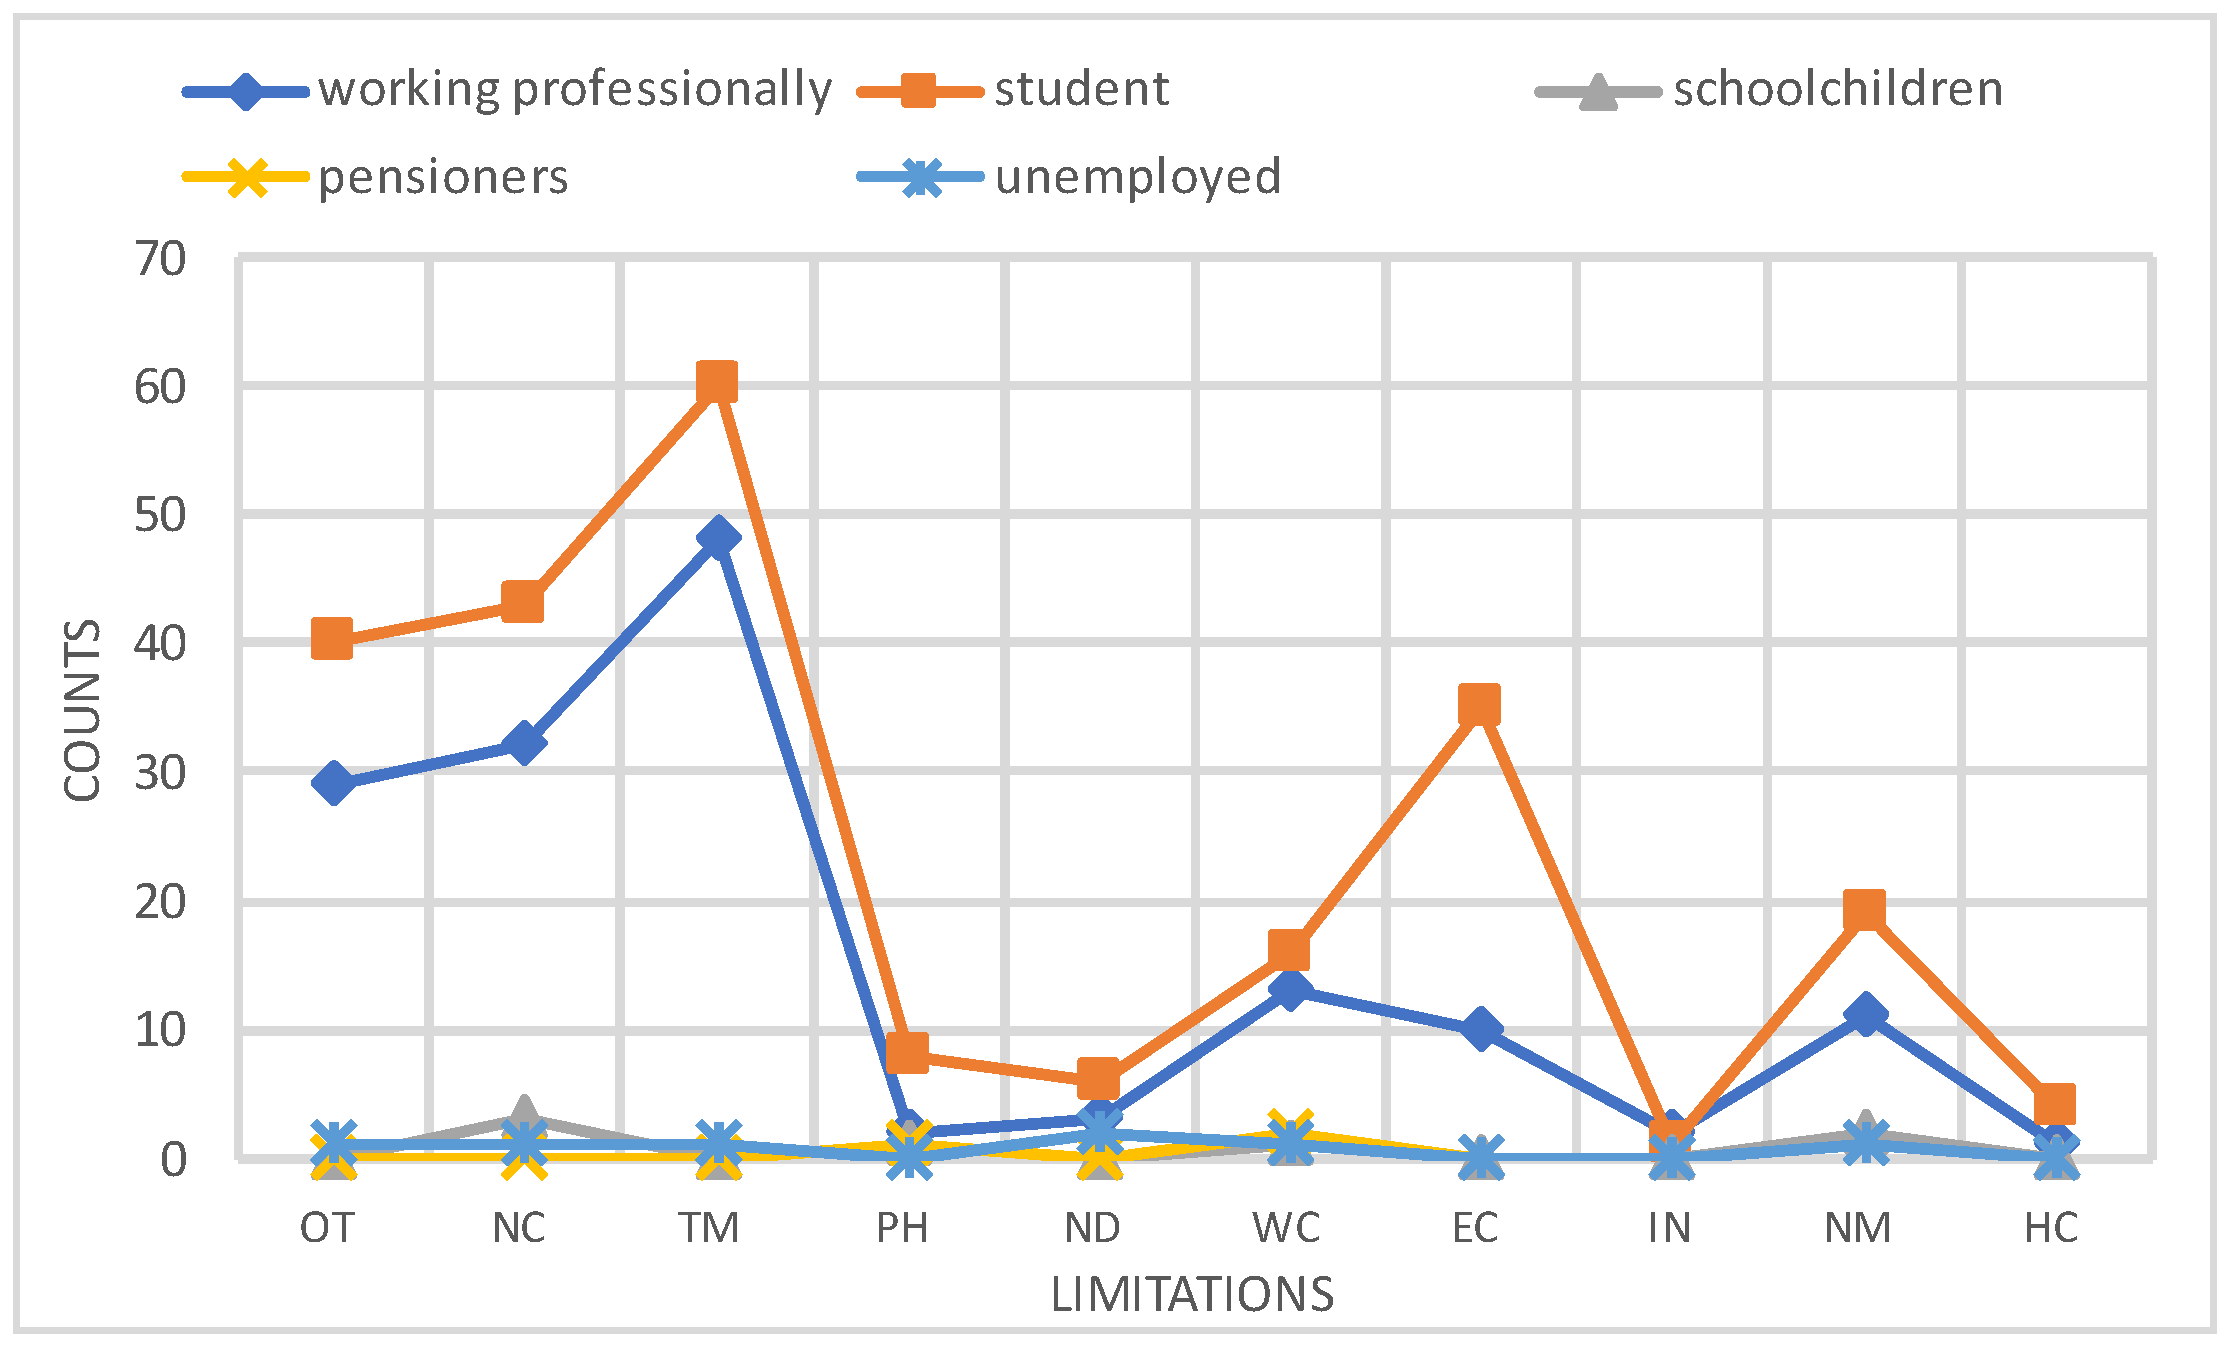
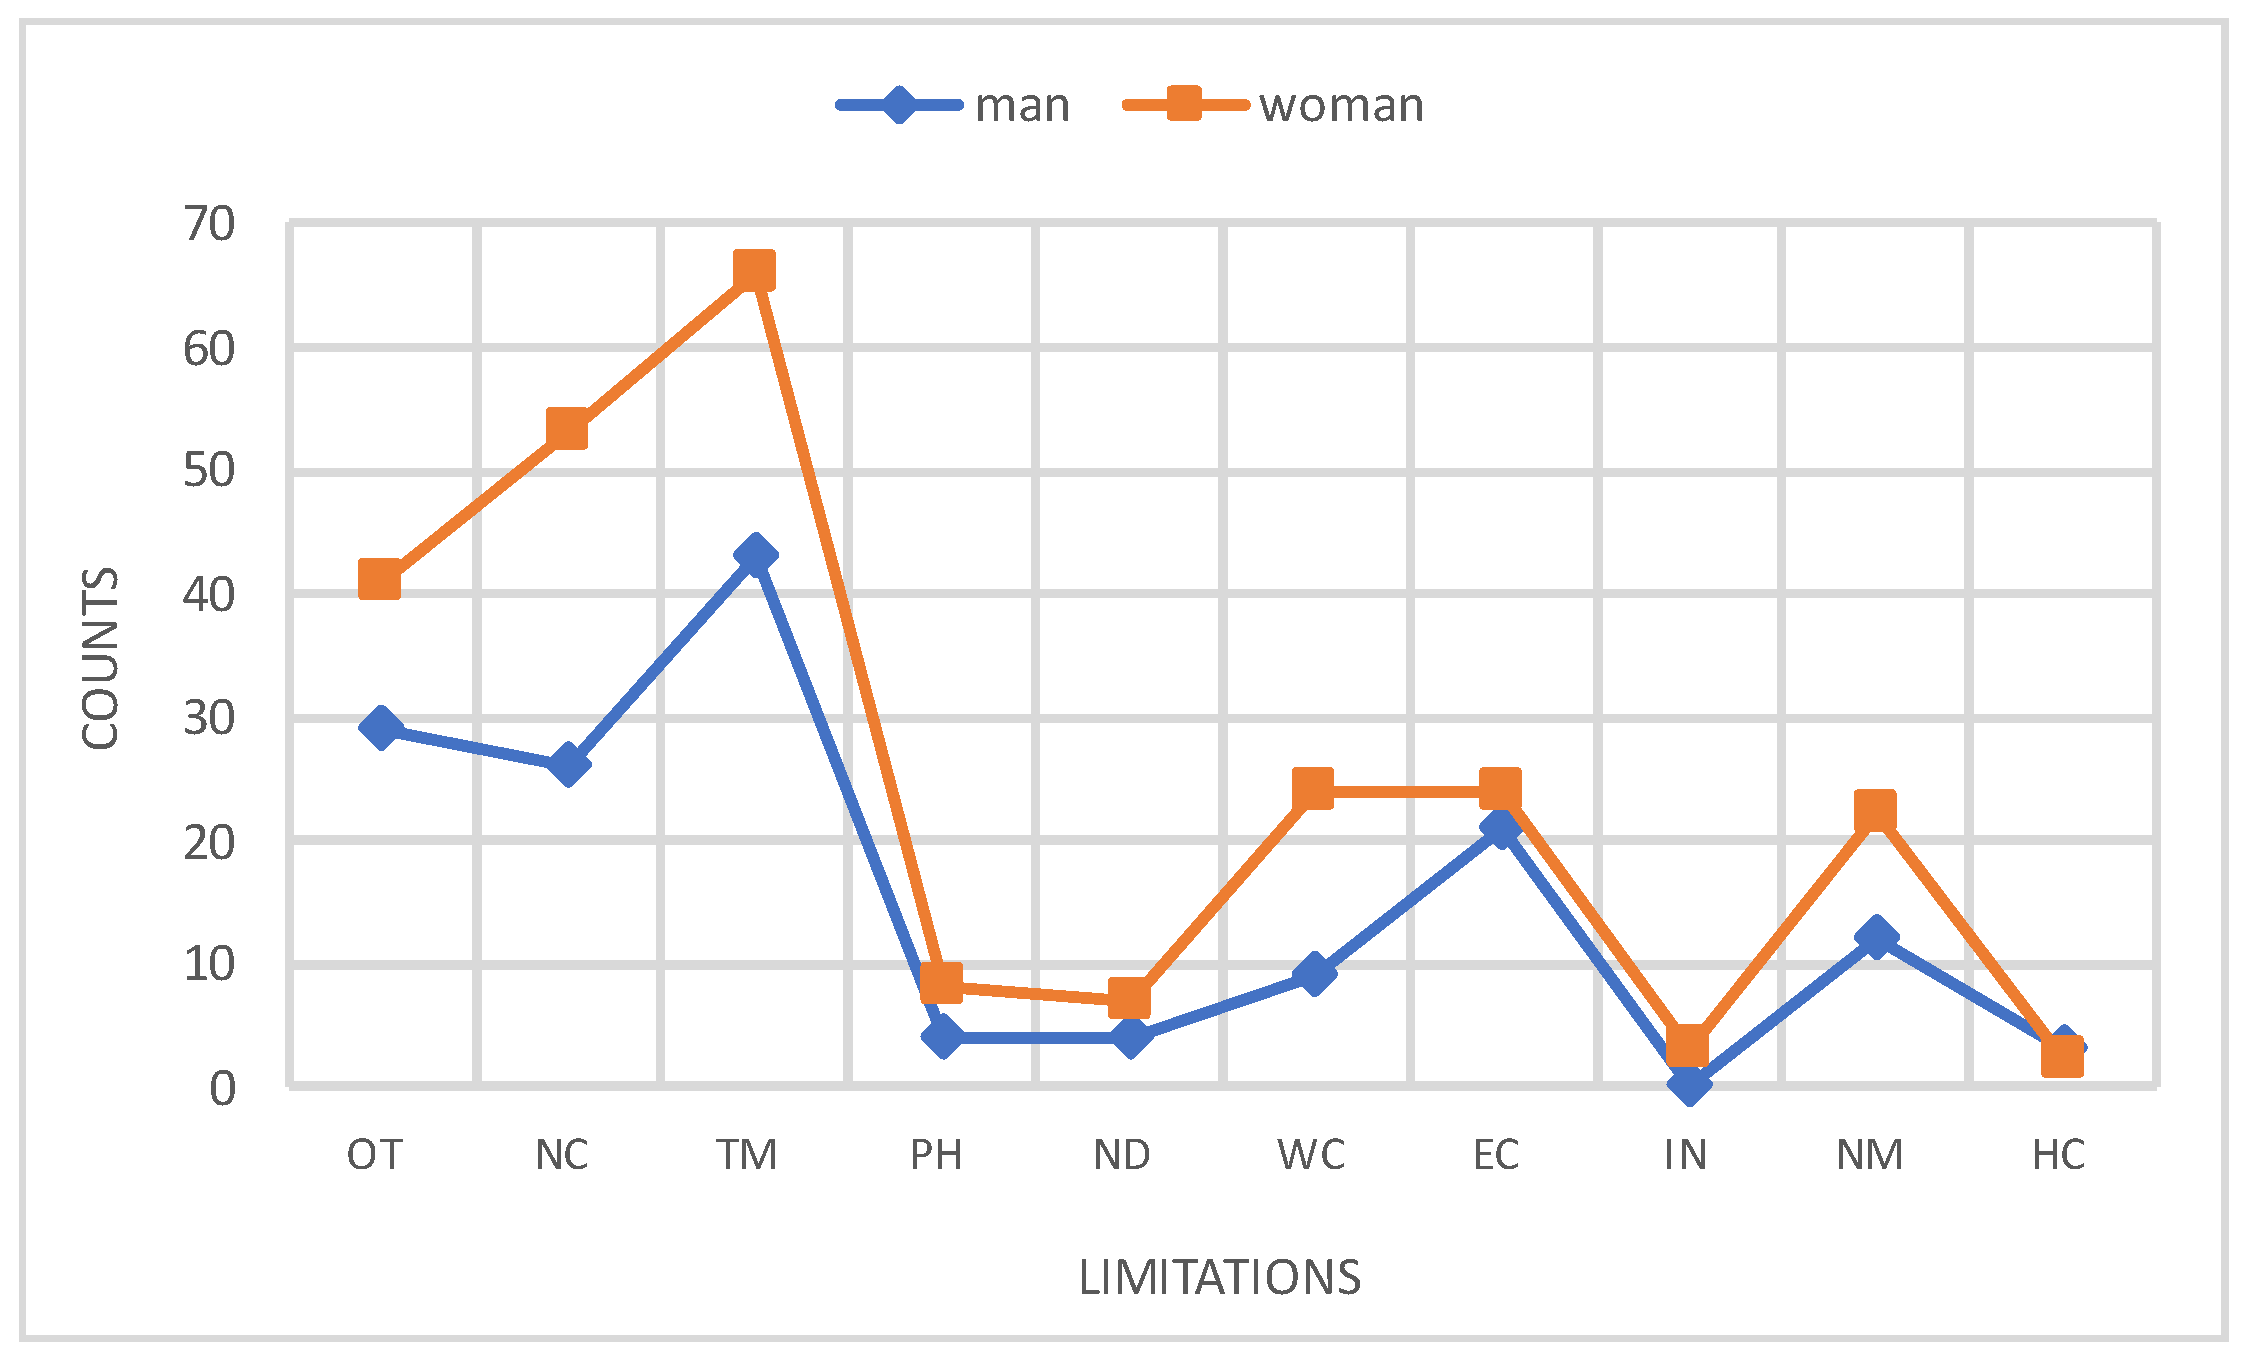
Table 1.
Car rentals in Szczecin.
| Car Rental | Number of Locations in Szczecin | Car Rental | Number of Locations in Szczecin |
|---|---|---|---|
| Panek | 4 | Avis | 1 |
| Hertz | 3 | Budget | 1 |
| RENTIS | 6 | Car Net | 1 |
| Sunnycars | 4 | CarFree | 1 |
| Express Rent a Car | 3 | Dollar | 1 |
| Carrson | 2 | MWM Cars | 1 |
| Europcar | 2 | Platinum Rent a Car | 1 |
| Global Rent a Car | 2 | Thrifty | 1 |
| keedy by Europcar | 2 | US Rent-a-car | 1 |
| Right Cars | 2 | Van Fleet Poland | 1 |
| 99Rent | 1 | YouRent | 1 |
Source: Own elaboration based on: [74] (accessed: 3 June 2022).
Table 2.
The choice of transport in particular directions.
| Travel Directions/Means of Transport | On Foot | By Car | Bus | Tram | Bicycle | Taxi | E-Scooter | Electric Scooter | Other |
|---|---|---|---|---|---|---|---|---|---|
| Home–work | |||||||||
| Work–home | |||||||||
| Home–school | |||||||||
| School–home | |||||||||
| Home–shopping | |||||||||
| Shopping–home | |||||||||
| Home–fitness | |||||||||
| Fitness–home | |||||||||
| Home–entertainment | |||||||||
| Entertainment–home | |||||||||
| Home–cemetery | |||||||||
| Cemetery–home | |||||||||
| Home–hospital | |||||||||
| Hospital–home | |||||||||
| Other than mentioned |
Table 3.
Travel directions suggested to the respondents and the abbreviations used in their analysis.
Table 3.
Travel directions suggested to the respondents and the abbreviations used in their analysis.
| Travel Directions | Abbreviations Used | Travel Directions | Abbreviations Used |
|---|---|---|---|
| Home–work | H-w | Home–entertainment | H-e |
| Work–home | W-h | Entertainment–home | E-h |
| Home–school | H-s | Home–cemetery | H-c |
| School–home | S-h | Cemetery–home | C-h |
| Home–shopping | H-sh | Home–hospital | H-h |
| Shopping–home | Sh-h | Hospital–home | H-h |
| Home–fitness | H-f | Other than mentioned | O |
| Fitness–home | F-h |
Publisher’s Note: MDPI stays neutral with regard to jurisdictional claims in published maps and institutional affiliations. |
© 2022 by the authors. Licensee MDPI, Basel, Switzerland. This article is an open access article distributed under the terms and conditions of the Creative Commons Attribution (CC BY) license (https://creativecommons.org/licenses/by/4.0/).
Share and Cite
MDPI and ACS Style
Wolnowska, A.E.; Kasyk, L. Transport Preferences of City Residents in the Context of Urban Mobility and Sustainable Development. Energies 2022, 15, 5692. https://doi.org/10.3390/en15155692
AMA Style
Wolnowska AE, Kasyk L. Transport Preferences of City Residents in the Context of Urban Mobility and Sustainable Development. Energies. 2022; 15(15):5692. https://doi.org/10.3390/en15155692
Chicago/Turabian StyleWolnowska, Anna Eliza, and Lech Kasyk. 2022. "Transport Preferences of City Residents in the Context of Urban Mobility and Sustainable Development" Energies 15, no. 15: 5692. https://doi.org/10.3390/en15155692
Note that from the first issue of 2016, this journal uses article numbers instead of page numbers. See further details here.