1. Introduction
Chickpea (
Cicer arietinum L.) is a member of the genus
Cicer in the
Leguminosae sp., which originated in western Asia and along the Mediterranean coast [
1]. A study showed that the chickpea production of the world was 15.08 million tons, thereby becoming the world’s third largest bean [
2]. Chickpea is widely distributed in the Xinjiang region of China because of its strong drought resistance and tolerance [
3]. Xinjiang Uygur Autonomous Region in China usually eats high-fat, high-calorie foods, such as beef and mutton, dairy products and high-sugar melons and fruits, but not many people suffer from diabetes and cardiovascular and cerebrovascular diseases. The United Nations Health Organization found that chickpeas played a key role in a balanced diet in their staple food, that is, grasp rice mixed with chickpeas, thus preventing diabetes and cardiovascular and cerebrovascular diseases [
4]. Chickpea is also rich in protein, vitamins, carbohydrates, minerals, dietary fibre and other nutrients [
5]. In addition, chickpea contains the following physiological functions: anti-osteoporosis, blood sugar reduction, cholesterol regulation, anti-oxidation and anti-cancer [
6,
7,
8,
9,
10,
11]. Chickpea has high healthcare value and remarkable development potential. At present, more than 20 active compounds of flavonoids, saponin, polysaccharide and organic acids had been isolated from chickpea [
12,
13]. However, these studies did not reveal the full extent of the identification and quantification of most metabolites in chickpea. Thus, the application and development of chickpea were markedly restricted.
Soybean originated from China and was derived from USSURI soybean; it has been planted in China for 5000 years [
14]. Soybean not only contains protein, fat, vitamins, minerals and other basic nutrients but also phospholipids, sterols, isoflavones, saponins, oligosaccharides, vitamin E and other bioactive components [
15]. Isoflavone substances, soy peptides and other substances had anti-oxidation, anti-cancer, prevention of osteoporosis, hypoglycaemic, cardiovascular risk reduction, oestrogen effect and other functional activities [
16,
17,
18,
19,
20,
21,
22].
Soybeans and chickpeas are produced in large quantities, thus increasing opportunities to eat and use them in daily life. Consequently, a growing number of researchers are focusing on the strengths and weaknesses of chickpeas and soybeans to make them healthier to use in everyday life [
23,
24,
25,
26,
27]. In addition, both legumes have been shown to have beneficial effects on diabetes, but studies of their metabolites were inadequate, so studies of their active components tended to focus only on certain isoflavones and triterpenoid saponins, the study had strong limitations [
12,
13,
28]. Therefore, a comprehensive study of metabolites from soybean and chickpea and the differences in metabolites are very necessary to facilitate the effective use of the two legumes.
Widely targeted metabolomics analysis is a rapid and reliable approach for the detection of a wide range of plant metabolites [
29]. In this study, widely targeted metabolomics analysis based on ultrahigh performance liquid chromatography-electrospray ionization-tandem mass spectrometry (UPLC-ESI-MS/MS) was used to analyse the metabolites in soybean and chickpea and the differences in metabolites between the two legumes. The metabolic pathways, which led to the differences in metabolic products, were also studied and analysed. The treatment of diabetes-related metabolites analysis revealed their differences in diabetes prevention and treatment. The comprehensive analysis of metabolic products provided an important reference for further research on the effective components of soybean and chickpea and the mechanism of their activities. A comprehensive understanding of the soybean and chickpea was obtained through this study, which also laid a solid foundation for their further research and application.
2. Results
2.1. Sample Quality Control Analysis
The overlapping display analysis of Total Ion Chromatography (TIC) of different QC samples (
Figure 1A,B) confirmed the good repeatability of metabolites extraction and detection.
A high proportion of the substance with a low CV value denotes the stability of experimental data. The proportion of substances with CV less than 0.5 was higher than 85%, which indicated that the experimental data was stable. The proportion of substances with CV less than 0.3 was higher than 75%, which indicated that the experimental data was remarkably stable. The CV distribution of each group (
Figure 2) showed that the experimental data were remarkably stable.
2.2. Widely Targeted Metabolomics Analysis in Chickpea and Soybean
The primary and secondary metabolites of the two legumes were analysed by widely targeted LC-MS/MS to study the chemical constituents of chickpea and soybean (
Figures S1 and S2). The relative contents of metabolites were analysed by the MRM mode using MultiQuant software (
Figure 3A,B). A total of 776 metabolites, including more than 10 classes, were detected (
Table S1 and
Figure 4A,B). Some of these classes could be further divided into several secondary classifications (
Table 1).
2.3. Multivariate Analysis of Identified Metabolites
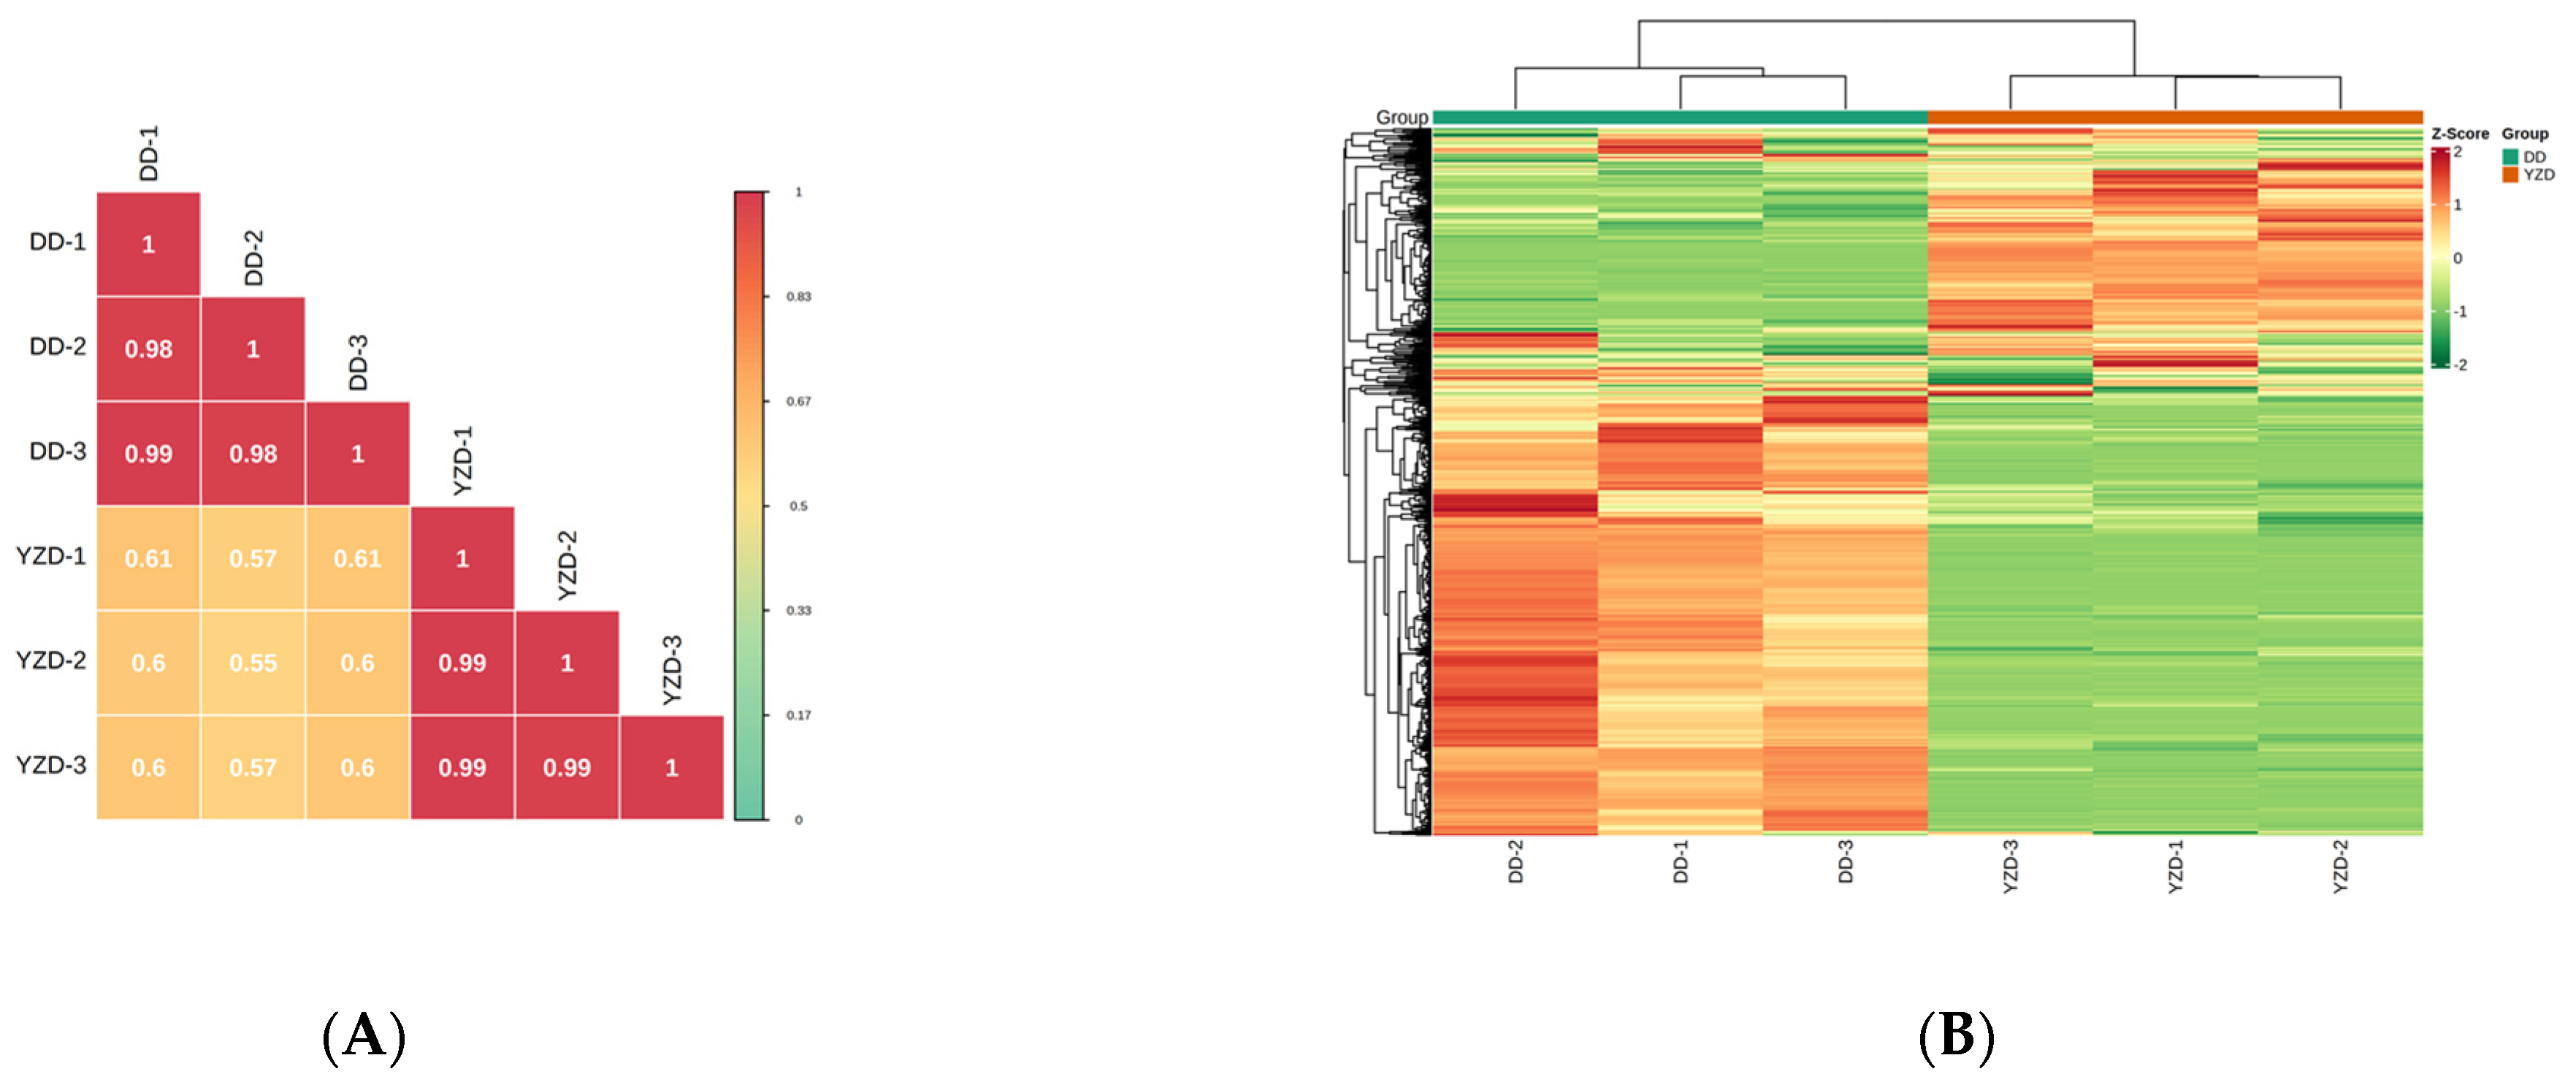
Multivariate analysis was used to further evaluate metabolites detected in YZD and DD. Correlation analysis showed that the correlation coefficients between the intra-group samples were close to 1 and the biological duplication was remarkably good (substantially higher than the inter-group samples correlation coefficients), which indicated that the obtained differential metabolites were reliable. The correlation coefficients between the YZD and DD groups also showed that YZD and DD had some biological duplications (
Figure 5A). The data of metabolite content were normalized (Unit Variance Scaling, UV Scaling), and the accumulation pattern of metabolites in different samples was analysed by Hierarchical Cluster Analysis (HCA). According to the analysis results, the metabolites in YZD and DD samples could be clearly divided into two groups. The two groups of metabolites in YZD and DD samples were significantly different (
Figure 5B).
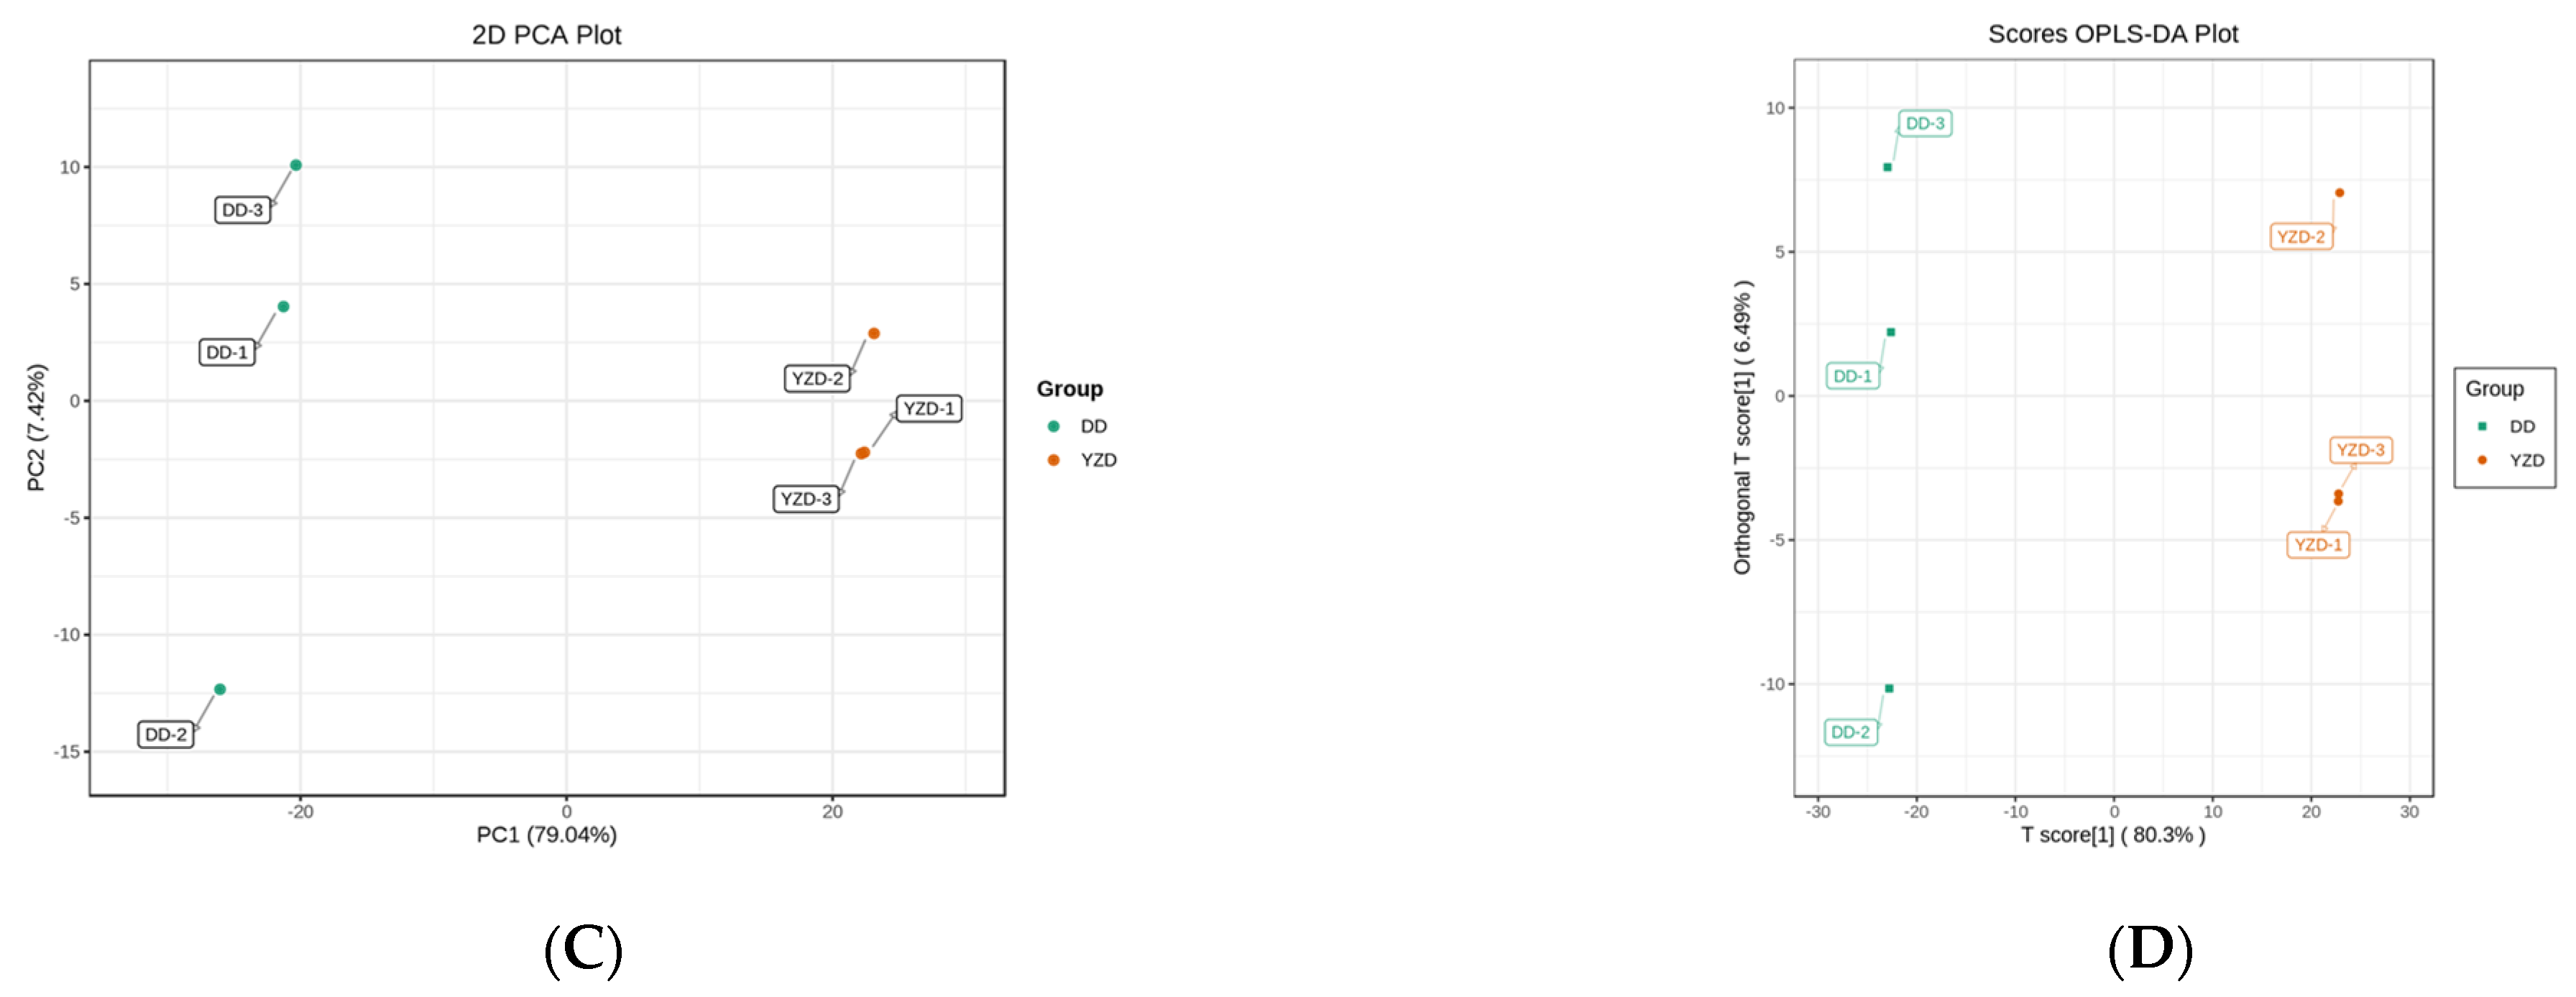
The two groups of samples were analysed by Principal Component Analysis (PCA) to observe the variability in inter- and intra-group samples. The degree of variation in inter- and intra-group samples was studied (
Figure 5C) by compressing the original data and taking PC1 (79.04% interpretation rate of data set) as the first principal component and PC2 (7.42% interpretation rate of data set) as the second principal component. Three biological duplications in DD group were concentrated on the left side of the PCA figure, and the distribution of the second principal component was scattered. By contrast, three biological duplications in YZD group were concentrated on the right side of the PCA figure, and the distribution of the second principal component was relatively concentrated. OPLS-DA evaluation of the variation degree in inter- and intra-group samples showed significant differences in metabolites between DD and YZD groups (
Figure 5D and
Figure S3).
2.4. Differential Metabolites between DD and YZD
The VIP values of OPLS-DA models and fold change were used to screen the differentially accumulated metabolites (DAMs). The screening conditions were as follows: fold change ≥ 2 or fold change ≤ 0.5, and VIP ≥ 1. A total of 480 DAMs were obtained by screening between DD and YZD (
Table S2). Compared with DD, 374 putative metabolites were down-regulated and 106 putative metabolites were up-regulated in YZD (
Figure 6A). These DAMs could be divided into more than 10 categories (
Figure 6B). Most of these DAMs were concentrated in four types of compounds, including flavonoids (24.20%), lipids (15.20%), amino acids and derivatives (10.40%) and phenolic acids (10.00%,
Figure 6C).
Through analysis, we got the differences of primary metabolites and the differences of secondary metabolites in YZD and DD (
Table S3). For primary metabolites, 42 metabolites were up-regulated and 146 metabolites were down-regulated in YZD compared with DD. For secondary metabolites, 62 metabolites were up-regulated and 218 metabolites were down-regulated in YZD compared with DD. Compared with DD, YZD has 2 up-regulated metabolites and 10 down-regulated metabolites in other types of compounds. For primary and secondary metabolites, YZD had approximately 22% up-regulated metabolites and approximately 78% down-regulated metabolites compared with DD.
The KEGG database was used to map metabolites to metabolic pathways. A total of 298 metabolites were mapped in 80 metabolic pathways, including 174 DAMs (
Table S4). The results of KEGG mapping of DAMs were classified in accordance with the type of pathway in KEGG, and most of the pathways focused on metabolism. By contrast, only a few focused on genetic and environmental information processing (
Figure S4). According to these results, the KEGG pathway enrichment was analysed. The major enrichment of KEGG pathways included isoflavonoid biosynthesis, flavonoid biosynthesis, flavone and flavonol biosynthesis, phenylpropanoid biosynthesis, linoleic acid metabolism, and tropane, piperidine and pyridine alkaloid biosynthesis (
Figure 6D and
Table S4).
2.5. Analysis of Anti-Diabetic Components
Chickpeas and soybeans had anti-diabetic effects [
30,
31,
32]. This study focused on lipids, saccharides, isoflavones, triterpene saponins and other metabolic products associated with diabetes. As shown in
Figure 6B and
Table 2, the contents of most lipids and saccharides from chickpeas were substantially lower than that of soybeans. The contents of most isoflavones and triterpenoid saponins in soybeans were higher than that in chickpeas.
Previous studies revealed that isoflavones, triterpenoid saponins and resistant starch were the main hypoglycaemic active components in chickpea [
12,
33,
34]. This study also found many other types of compounds in chickpeas that had a hypoglycaemic effect. The relative contents of these compounds in chickpeas were higher than those in soybeans (
Table S2). These compounds included amino acids and derivatives, such as L-glutamine [
35,
36], L-lysine [
37], L-homoarginine [
38], and phenolic acids, such as gallic acid [
39,
40], and so on. In addition, considering the hydrolysis reaction of glycosides in vivo, corresponding aglycones could be produced. We also analysed the glycosides which had good blood glucose lowering activity of their aglycones. These compounds included flavones such as acacetin, acacetin-7-O-galactoside, acacetin-7-O-glucoside [
41,
42,
43], chrysoeriol-7-O-(6′′-malonyl) glucoside [
44]; flavanones such as diosmetin-7-O-glucoside [
45]; flavonols such as isorhamnetin-3-O-(6′′-malonylglucoside), isorhamnetin-3-O- (6′′-acetylglucoside), isorhamnetin-3-O-neohesperidoside [
46,
47], kaempferol-3-O- sambubioside, kaempferol-3-O-rutinoside, kaempferol-3-O-neohesperidoside, kaempferol-3-O-(2-O-Xylosyl-6-O-Rhamnosyl)Glucoside, kaempferol-3-O-(6′′′′-malonyl) sophorotrioside [
48,
49,
50]; flavonoid carbonoside such as orientin-2′′-O-galactoside [
51]. In addition to the considerable difference in the contents of biochanin A and its glycosides between chickpea and soybean, which had good hypoglycaemic activity, some compounds with hypoglycaemic effect in chickpeas that were far more abundant than in soybeans were also found (e.g., gallic acid, acacetin and its glycosides, isorhamnetin glycosides and chrysoeriol-7-O-(6′′-malonyl) glucoside). These compounds were far more abundant in chickpeas than in soybeans, and some were found only in chickpeas.
3. Discussion
Soybeans and chickpeas are common legumes in production and life. Chickpea, as a kind of plant with medicine and food homology, had good healthcare function [
33]. An increasing number of studies had focused on chickpeas as a substitute for soybeans, such as for some functional foods for human beings and animal feed, to produce improved results [
24,
25,
26,
27,
52,
53,
54]. Therefore, a comprehensive analysis of whether these types of legumes could be used as substitutes or their respective advantages and disadvantages is necessary for their further development and application. Thus, a comprehensive study of the metabolites from the two legumes and the differences in their metabolites is crucial. In this study, the primary and secondary metabolites of soybeans and chickpeas were comprehensively identified and relatively quantitative analysis was performed using widely targeted metabolomics analysis, involving more than a dozen kinds of metabolites. The results of this study provided important basic data for further research and development of soybeans and chickpeas.
A total of 776 metabolites were identified. In addition to lipids and amino acids and derivatives, we found that flavonoids, a major kind of secondary metabolites, were very abundant, even more abundant than amino acids and derivatives. Flavonoids is a kind of active compounds in nature, which would be beneficial to the development and application of two kinds of beans. Multivariate analysis of identified metabolites showed that there was less variability among samples in the chickpea group than in the soybean group. This indicated that the accumulation of metabolites was more stable during the growing process of chickpea. The 480 metabolites showed significant difference between soybean and chickpea by differential metabolites analysis. The identification and relatively quantitative analysis of these metabolites compensated for the lack of previous studies. The relative contents of 106 metabolites in chickpea were up-regulated compared with that in soybean. These metabolites of up-regulation may be the material bases for good healthcare function of chickpea. Like biochanin A, there is little in soybeans. The research and development of these material bases could be deepened. In addition, we were concerned that the two legumes because of the differences of growth habits and resistance to the natural environment, the corresponding metabolites were also different. For example, maackiain, a phytoalexin, was found in chickpeas but not soybeans. The relative contents of 374 metabolites in soybean were up-regulated compared with that in chickpea. Among them, primary metabolites provided rich nutrients, such as lipids and amino acids. The relative contents of most secondary metabolites were also up-regulated and this could make it a source of some pharmacodynamic material basis.
Chickpeas and soybeans could be used as good ingredients to prevent diabetes in the diet. The above study revealed numerous differences in their metabolites. This finding suggested that the application of the two kinds of beans as supplementary food for blood sugar reduction should be emphasised. The potential diabetes prevention and treatment of soybean and chickpea were also discussed on the basis of identified metabolites. Chickpea is more suitable for diabetes prevention and adjuvant treatment of the modern population due to its low lipids and saccharides contents. For the isoflavones and triterpenoid saponins, although higher content in soybean, was less effective in reducing blood sugar due to its higher lipids. The results of this study could also explain why people with chickpea as an auxiliary food could be a good control of diabetes and cardiovascular diseases in Xinjiang Uygur Autonomous Region in China and other places rich in beef and mutton (high fat) as well as a variety of fruits (high sugar). In addition, some isoflavones, such as biochanin A, trifolirhizin and prunetin-5-O-glucoside, which demonstrated high contents in chickpea, could be studied and developed for their hypoglycaemic activity. The compounds related to the hypoglycaemic activity of higher contents in chickpea than in soybean were also analysed, which provided a new reference for studying the hypoglycaemic mechanism of chickpea. Soybean may be able to play an effective role in blood sugar reduction via lipid removal.
The enrichment of DAMs by KEGG pathway revealed differences between the two legumes in the metabolic pathways of isoflavonoid biosynthesis, flavonoid biosynthesis, flavone and flavonol biosynthesis, phenylpropanoid biosynthesis, linoleic acid metabolism and tropane, piperidine and pyridine alkaloid biosynthesis. Among them, flavonoid, phenylpropanoids, and alkaloids demonstrated biological activities. In addition, some differences were observed in the metabolic pathways of purine metabolism, biosynthesis of amino acids, and aminoacyl-tRNA biosynthesis. These differences could also have an impact on health.
4. Materials and Methods
4.1. Plant Materials
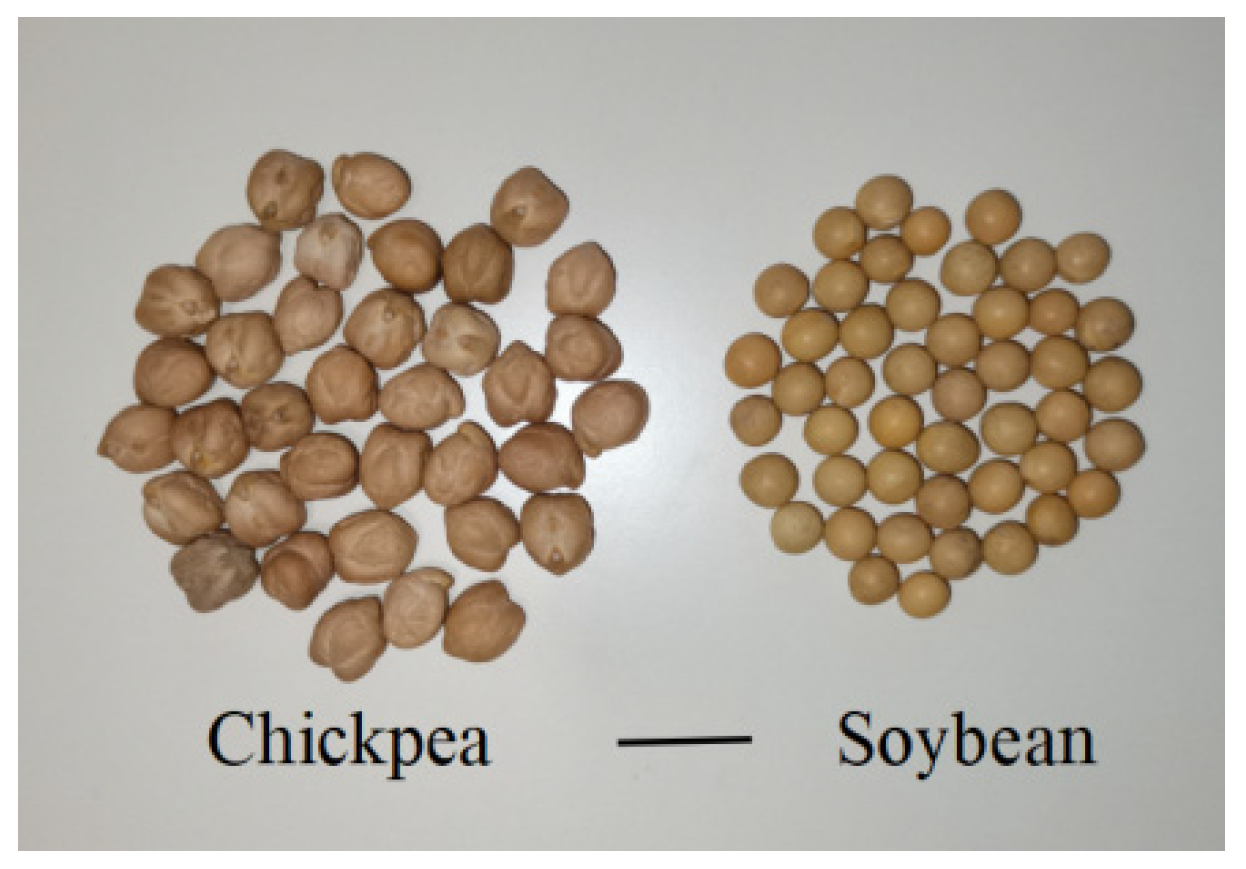
Chickpeas (Muying No.1) and soybeans (Heihe 43) were used in this study (
Figure 7). These two varieties have the characteristics of wide planting range, good performance, high yield and the good representation. Chickpeas were collected from Mori Kazakh Autonomous County, Xinjiang, China (43.837396 N, 90.296538 E; representative planting area) on August 2021. Chickpea was sown with 45 cm row spacing and 13 to 15 cm plant spacing and approximately 75,000 plants per hectare. Soybeans were collected from Heihe Soybean Association, Heihe, Heilongjiang, China (50.241354 N, 127.536307 E; representative planting area) on September 2021. There were 4 rows of 100 cm ridge and about 12 cm plant spacing and approximately 400,000 plants per hectare.
4.2. Sample Preparation and Metabolite Extraction [55,56]
The chickpea group was named YZD and the soybean group was named DD. Each group was set up with three biological replicates, each of which was collected from five different plants. Therefore, the YZD-1, YZD-2 and YZD-3 in the chickpea group and DD-1, DD-2 and DD-3 in the soybean group were observed. Metabolite extraction process: (1) The samples were placed in a lyophilizer (Scientz-100F, Scientz, Ningbo, China) for vacuum freeze drying. (2) After freeze-drying, the samples were prepared into powder by a grinder (MM 400, Retsch, Shanghai, China) for 1.5 min at 30 Hz. (3) The 100 mg sample powder was dissolved in 1.2 mL 70% methanol. (4) The samples were swirled every 30 min for 30 s (total vortex six times) and then the samples were kept in a refrigerator at 4 °C overnight. (5) The supernatant was extracted and filtered by microporous membrane (SCAA-104, 0.22 μm pore size; ANPEL, Shanghai, China) after centrifugation (12,000 rpm, 10 min) and stored in the sample bottle for UPLC-MS/MS analysis.
4.3. Quality Control Measurements
The quality control (QC) samples comprised equal-weight chickpea samples mixed with soybean samples and used to analyse the repeatability of the mass spectrometric results under the same treatment. In the instrumental analysis process, one QC sample was inserted into every 10 samples to monitor the repeatability of the analysis process.
The coefficient of variation (CV) could reflect the degree of data dispersion. The proportion of substances with CV values less than reference CV values could be analysed by empirical cumulative distribution function (ECDF).
4.4. UPLC Conditions [55,56]
The analytical conditions were as follows, UPLC: column, Agilent SB-C18 (1.8 µm, 2.1 mm × 100 mm). The mobile phase comprised solvents A (pure water with 0.1% formic acid) and B (acetonitrile with 0.1% formic acid). Sample measurements were performed with a gradient program that employed the starting conditions of 95% A, 5% B. Within 9 min, a linear gradient to 5% A, 95% B was programmed, and a composition of 5% A, 95% B was kept for 1 min. Subsequently, a composition of 95% A, 5.0% B was adjusted within 1.1 min and kept for 2.9 min. The flow velocity was set as 0.35 mL per minute. The column oven was set to 40 °C. The injection volume was 4 μL. The effluent was alternatively connected to an ESI-triple quadrupole-linear ion trap (QTRAP)-MS.
4.5. ESI-Q TRAP-MS/MS Analysis [55,56]
Linear ion trap (LIT) and triple quadrupole (QQQ) scans were acquired on a triple quadrupole-linear ion trap mass spectrometer (Q TRAP), AB4500 Q TRAP UPLC/MS/MS System, equipped with an ESI Turbo Ion-Spray interface, operating in positive and negative ion mode and controlled by Analyst 1.6.3 software (AB Sciex, Framingham, MA, USA). The ESI source operation parameters were as follows: ion source, turbo spray; source temperature 550 °C; ion spray voltage (IS) 5500 V (positive ion mode)/-4500 V (negative ion mode); ion source gas I (GSI), gas II(GSII), curtain gas (CUR) were set at 50, 60 and 25.0 psi, respectively; the collision-activated dissociation (CAD) was high. Instrument tuning and mass calibration were performed with 10 and 100 μmol/L polypropylene glycol solutions in QQQ and LIT modes, respectively. QQQ scans were acquired as multiple reaction monitoring (MRM) experiments with collision gas (nitrogen) set to medium. The declustering potential (DP) and collision energy (CE) for individual MRM transitions were done with further DP and CE optimization. A specific set of MRM transitions were monitored for each period according to the metabolites eluted within this period.
4.6. Qualitative and Semi-Quantitative Analysis of Metabolites [55,56]
The identification and structural analyses of the primary and secondary spectral data of the metabolites detected by mass spectrometry were based on the MWDB database (Metware Biotechnology Co., Ltd. Wuhan, China) and public databases, including MassBank, KNAPSAcK, HMDB, MoToDB, and ChemBank, PubChem, NIST Chemistry Webbook and METLIN. Metabolomics data were processed using Analyst (Version 1.6.3, Sciex, Framingham, MA, USA).
Metabolite quantification was performed using MRM mode of QQQ mass spectrometry. In the MRM mode, the quadrupole filters the precursor ions of the target substance and excludes the ions corresponding to other molecular weights to eliminate interference. Peak area integration was performed using MultiQuant version 3.0.2 (AB SCIEX, Concord, ON, Canada) after obtaining the metabolite mass spectrometry data. Finally, the chromatographic peak area was used to determine the relative metabolite contents.
4.7. Principal Component Analysis [55,56]
Unsupervised principal component analysis (PCA) was performed by statistics function prcomp within R (
www.r-project.org (accessed on 18 April 2022)). The data were unit variance scaled before unsupervised PCA.
4.8. Hierarchical Cluster Analysis and Pearson Correlation Coefficients [55,56]
The hierarchical cluster analysis (HCA) results of samples and metabolites were presented as heatmaps with dendrograms, while Pearson correlation coefficients (PCC) between samples were calculated by the cor function in R and presented as only heatmaps. Both HCA and PCC were carried out by R package Complex Heatmap. For HCA, normalized signal intensities of metabolites (unit variance scaling) are visualized as a colour spectrum.
4.9. Differential Metabolites Selected [55,56]
Significantly regulated metabolites between groups were determined by variable importance in project (VIP) ≥1 and absolute log
2 FC (fold change) ≥1. VIP values were extracted from Orthogonal Partial Least Squares-Discriminant Analysis (OPLS-DA) results, which also contain score plots and permutation plots, were generated using R package MetaboAnalystR (
https://github.com/xia-lab/MetaboAnalystR (accessed on 18 April 2022)). The data were log transformed (log
2) and mean cantered before OPLS-DA. In order to avoid overfitting, a permutation test (200 permutations) was performed.
4.10. KEGG Annotation and Enrichment Analysis [55,56]
Identified metabolites were annotated using KEGG Compound database (
http://www.kegg.jp/kegg/compound/ (accessed on 18 April 2022)), and annotated metabolites were then mapped to KEGG Pathway database (
http://www.kegg.jp/kegg/pathway.html (accessed on 18 April 2022)). Pathways with significantly regulated metabolites mapped to were then fed into metabolite sets enrichment analysis (MSEA), and their significance was determined by hypergeometric test’s
p-values.
5. Conclusions
This study used the methods of widely targeted metabolomics analysis, and the detection methods were stable and reliable. Taking representative soybean (Heihe 43) and chickpea (Muying No.1) as research objects, we systematically identified and relatively quantified more than 10 kinds of metabolites, with a total of 776 metabolites. It was also found that the stability of metabolites accumulation in soybean was lower than that in chickpea. Among these metabolites, 480 metabolites showed significant differences between chickpea and soybean. Most of these DAMs were concentrated in four types of compounds, including flavonoids (24.20%), lipids (15.20%), amino acids and derivatives (10.40%) and phenolic acids (10.00%). The relative contents of 106 metabolites in chickpea were up-regulated compared with that in soybean. The relative contents of 374 metabolites in soybean were up-regulated compared with that in chickpea. This finding provided important basic data for future research on chickpea and soybean. The differences in hypoglycaemic activity between soybean and chickpea and their applicability were also analysed on the basis of the metabolite data of lipids, saccharides, isoflavones and triterpene saponins. It was found that chickpea was more suitable for modern people to play the role of auxiliary hypoglycaemic health care. In addition, many novel hypoglycaemic compounds had been found in chickpea, some of which had much higher contents than those in soybean, or only exist in chickpea, which provided a basis for further research and development of chickpea. It also provided a reference for the development of new hypoglycaemic lead compounds. Through KEGG pathway, the differential metabolites of soybean and chickpea were found to be concentrated in the metabolic pathways of isoflavonoid biosynthesis, flavonoid biosynthesis, flavone and flavonol biosynthesis, phenylpropanoid biosynthesis, linoleic acid metabolism, and tropane, piperidine and pyridine alkaloid biosynthesis. These metabolic pathways played an important role in regulating the healthcare functions of the two legumes. This study provided an important reference for further research and development of chickpea and soybean based on these abundant data.
Supplementary Materials
The following supporting information can be downloaded at:
https://www.mdpi.com/article/10.3390/molecules27165297/s1, Figure S1: QC MS TIC-N (Negative ion mode); Figure S2: QC MS TIC-P (Positive ion mode); Figure S3: DD vs. YZD OPLS-DA model validation; Figure S4: DD vs YZD KEGG barplot; Table S1: List and characteristics of the metabolites identified and quantified in DD and YZD; Table S2: List of DAMs in the YZD vs. DD; Table S3: Statistics of DAMs between YZD and DD; Table S4: List of KEGG pathway in the YZD vs. DD.
Author Contributions
Conceptualization, P.L. and B.Z.; methodology, P.L., L.L. and Y.B.; software, Y.B. and M.L.; validation, Q.M., L.L. and Y.S.; investigation, J.L., L.L. and G.C.; resources, P.L. and B.Z.; data curation, Y.B., L.L. and P.L.; writing—original draft preparation, P.L. and Y.B.; writing—review and editing, M.L., Q.M. and Y.S.; visualization, Y.B.; supervision, P.L.; funding acquisition, P.L. and L.L. All authors have read and agreed to the published version of the manuscript.
Funding
This research was funded by the Special Project of Henan Provincial Key Research, Development and Promotion (Science and Technology) (No. 212102311104); the Key Scientific Research Projects of Henan Province Colleges and Universities (No. 20B360016); National Level Project Cultivation Fund of Luoyang Normal University (No. 2019-PYJJ-013); National Level Project Cultivation Fund of Luoyang Normal University (No. 2018-PYJJ-007) and PhD Research Foundation (No. 4600210) of Luoyang Normal University.
Institutional Review Board Statement
Not applicable.
Informed Consent Statement
Not applicable.
Data Availability Statement
Acknowledgments
We are very grateful to Xuan kaiang from Wuhan Metware Biotechnology for assistance with metabolic data analysis.
Conflicts of Interest
The authors declare no conflict of interest.
Sample Availability
Samples of the compounds are not available from the authors.
References
- Flora of China Editorial Comittee. Flora Reipublicae Popularis Sinicae; Science Press: Beijing, China, 1998; Volume 42, p. 288. [Google Scholar]
- FAO Statistical Databases (Food and Agriculture Organization of the United Nations), Statistics Division. 2020. Available online: https://www.fao.org/faostat/en/#data/QCL (accessed on 18 June 2022).
- Saxena, A.K.; Sharma, S.; Sandhu, J.S.; Gupta, S.K.; Jasdeep, K. Variability and correlation studies for nutritional and cooking qualitytraits in chickpea (Cicer arietinum L.). Indian J. Genet. Plant Breed. 2013, 73, 51. [Google Scholar] [CrossRef]
- Cicer arietinum L. Available online: https://baike.so.com/doc/24226118-25017068.html (accessed on 18 June 2022).
- Eldib, R.A.S. A Study on Some Physical Properties and Chemical Components of Some Common Legumes from Different Countries; Northeast Agricultural University: Harbin, China, 2014. [Google Scholar]
- Li, Y.; Jiang, B.; Zhang, T.; Mu, W.; Liu, J. Antioxidant and free radical scavenging activities of chickpea protein hydrolysate (CPH). Food Chem. 2008, 106, 444–450. [Google Scholar] [CrossRef]
- Sreerama, Y.N.; Sashikala, V.B.; Pratape, V.M. Variability in the distribution of phenolic compounds in milled fractions of chickpea and horse gram: Evaluation of their antioxidant properties. J. Agric. Food Chem. 2010, 58, 8322–8330. [Google Scholar] [CrossRef] [PubMed]
- Deping, W.; Xin, A.; Xiaomin, Y.; Rui, Y.; Xingting, W.; Yan, J. Hypoglycemic effect of chickpea ethanol extracts on diabetic mice. Food Res. Dev. 2019, 40, 21–25. [Google Scholar]
- Zhao, T.Y.; Meng, Q.; Qu, H.X.; Jiang, H.H.; Wang, Q.; Gu, R.X. Nutritional function and application of chickpea. Sci. Technol. Cereals Oils Foods 2014, 22, 38–41. [Google Scholar]
- Chino, X.M.; Martínez, C.J.; Garzón, V.R.; González, I.Á.; Treviño, S.V.; Bujaidar, E.M.; Ortiz, G.D.; Hoyos, R.B. Cooked chickpea consumption inhibits colon carcinogenesis in mice induced with azoxymethane and dextran sulfate sodium. J. Am. Coll. Nutr. 2017, 36, 391–398. [Google Scholar] [CrossRef]
- Gupta, N.; Bisen, P.S.; Bhagyawant, S.S. Chickpea lectin inhibits human breast cancer cell proliferation and induces apoptosis through cell cycle arrest. Protein Pept. Lett. 2018, 25, 492–499. [Google Scholar] [CrossRef]
- Ya, C.; Jiajia, Y.; Yunlong, F. Research progress on nutrition, active ingredients and efficacy of chickpeas. Food Res. Dev. 2021, 42, 204–209. [Google Scholar]
- Jing, G.; Xin, Y.; Yulong, C.; Ping, W. Research progress in bioactive components and functions of chickpea. Farm Prod. Process. 2021, 03, 76–79+83. [Google Scholar]
- Fu-Ming, Y.; Li-Li, F.; Shu-Nian, L.; Li-Feng, W.; Yong-Ge, S. Research progress of bioactive components in soybean and their detection technologies. J. Food Saf. Qual. 2021, 12, 858–865. [Google Scholar]
- Sun, L. Strategy analysis of developing Chinese soybean science and technology and revitalizing soybean industry under the background of new era. Soybean Sci. Technol. 2020, 4, 20–23. [Google Scholar]
- Anthony, M.S.; Clarkson, T.B.; Hughes, C.L.; Morgan, T.M.; Burke, G.L. Soybean isoflavones improve cardiovascular risk factors without affecting the reproductive system of peripubertal rhesus monkeys. J. Nutr. 1996, 126, 43–50. [Google Scholar] [CrossRef] [PubMed]
- Zong, L.; Changjiang, Z.; Yawei, L.; Shichu, Z.; Kailun, Y. Effect of two kinds of phytoestrogens on milk composition, blood biochemical index and antioxidant capacity of dairy cows. China Anim. Husb. Vet. Med. 2017, 44, 1688–1693. [Google Scholar]
- Qiu, S.; Jiang, C. Soy amd isoflavones consumption and breast cancer survival and recurrence: A systematic review and meta-analysis. Eur. J. Nutr. 2018, 58, 3079–3090. [Google Scholar] [CrossRef] [PubMed]
- Xiaoyun, Z.; Lishan, L.; Qinghua, L.; Liuran, L.; Huiting, T.; Li, Y. Research progress of the relationship between gut microbiota and their metabolites and bone metabolism, and the potential mechanism. Chin. J. Osteoporos. 2019, 25, 1812–1816. [Google Scholar]
- Jin, X.; Sun, J.; Yu, B.; Wang, Y.; Sun, W.J.; Yang, J.; Huang, S.H.; Xie, W.L. Daidzein stimulates osteogenesis facilitating proliferation, differentiation, and antiapoptosis in human osteoblast-like mg-63 cells via estrogen receptor-dependent mek/erk and pi3k/akt activation. Nutr. Res. 2017, 42, 20–30. [Google Scholar] [CrossRef]
- Huimin, Y. Effects of Soybean Isoflavones on Lipid Metabolism and Inflammatory Factors in Type 2 Diabetic Mice. Master’s Thesis, Shanxi Medical University, Taiyuan, China, 2021. [Google Scholar]
- Lulu, W.; Qianqian, S.; Yutong, W.; Xin, G.; Yutong, J.; Qi, H. Function of soybean bioactive peptides and its application in food processing. Farm Prod. Process. 2021, 1, 59–63. [Google Scholar]
- De Camargo, A.C.; Favero, B.T.; Morzelle, M.C.; Franchin, M.; Alvarez-Parrilla, E.; de la Rosa, L.A.; Geraldi, M.V.; Maróstica Júnior, M.R.; Shahidi, F.; Schwember, A.R. Is chickpea a potential substitute for soybean? Phenolic bioactives and potential health benefits. Int. J. Mol. Sci. 2019, 20, 2644–2685. [Google Scholar] [CrossRef]
- Muszyński, S.; Kwiecień, M.; Świetlicki, M.; Dobrowolski, P.; Tatarczak, J.; Gładyszewska, B. Effects of replacing soybean meal with chickpea seeds in the diet on mechanical and thermal properties of tendon tissue in broiler chicken. Poult. Sci. 2018, 97, 695–700. [Google Scholar] [CrossRef]
- Danek-Majewska, A.; Kwiecień, M.; Winiarska-Mieczan, A.; Haliniarz, M.; Bielak, A. Raw chickpea (Cicer arietinum L.) as a substitute of soybean meal in compound feed for broiler chickens: Effects on growth performance, lipid metabolism, fatty acid profile, antioxidant status, and dietary value of muscles. Animals 2021, 11, 3367–3383. [Google Scholar] [CrossRef]
- Yusuf, S.A.; Suleyman, C. Effect of partial replacement of soybean and corn with dietary chickpea (raw, autoclaved, or microwaved) on production performance of laying quails and egg quality. Food Sci. Anim. Resour. 2020, 40, 323–337. [Google Scholar]
- Priolo, A.; Lanza, M.; Galofaro, V.; Fasone, V.; Bella, M. Partially or totally replacing soybean meal and maize by chickpeas in lamb diets: Intramuscular fatty acid composition. Anim. Feed. Sci. Technol. 2003, 108, 215–221. [Google Scholar] [CrossRef]
- Clark, J.L.; Taylor, C.G.; Zahradka, P. Rebelling against the (insulin) resistance: A review of the proposed insulin-sensitizing actions of soybeans, chickpeas, and their bioactive compounds. Nutrients 2018, 10, 434–461. [Google Scholar] [CrossRef]
- Chen, W.; Gong, L.; Guo, Z.; Wang, W.; Zhang, H.; Liu, X.; Yu, S.; Xiong, L.; Luo, J. A novel integrated method for large-scale detection, identification, and quantification of widely targeted metabolites: Application in the study of rice metabolomics. Mol. Plant 2013, 6, 1769–1780. [Google Scholar] [CrossRef] [PubMed]
- Xiangfei, S.; Yakun, L.; Ning, L.; Jinghui, H.; Limin, S.; Shuren, L. Advances on health care effect and mechanism of characteristic coarse cereals on diabetes. Acta Agric. Boreali-Sin. 2020, 35 (Suppl. S1), 441–447. [Google Scholar]
- Zhong, D.; Yanju, J.; Qinghai, S. The role of legumes in diabetic diet intervention. Farm Prod. Process. 2021, 4, 66–70. [Google Scholar]
- Ting, F. Nutritional and health care value of chickpea and its application. Food Nutr. China 2011, 17, 67–69. [Google Scholar]
- Xuna, Z.; Yang, Y.; Bo, C.; Guixing, R. Research advance on the biological activity and application of chickpea. J. Food Saf. Qual. 2018, 9, 1983–1988. [Google Scholar]
- Rui, Z.; Jia, H. Chemical composition and health efficacy of chickpea. Chin. Wild Plant Resour. 2019, 38, 49–53. [Google Scholar]
- Caijuan, W. The Molecular Mechanism Study of Glutamine Improving the Insulin Signaling Pathway and Affecting Glucose Uptake in L6 cell. Master’s Thesis, Tianjin Medical University, Tianjin, China, 2018. [Google Scholar]
- Smeeta, S.; Dipti, K.; Neeraj, V. Protective effect of L-glutamine against diabetes-induced nephropathy in experimental animal: Role of KIM-1, NGAL, TGF-1, and collagen-1. Ren. Fail. 2016, 38, 1483–1495. [Google Scholar]
- Mirmiranpour, H.; Bathaie, S.Z.; Khaghani, S.; Nakhjavani, M.; Kebriaeezadeh, A. L-lysine supplementation improved glycemic control, decreased protein glycation, and insulin resistance in type 2 diabetic patients. Int. J. Diabetes Dev. Ctries 2021, 41, 634–643. [Google Scholar] [CrossRef]
- Wetzel, M.D.; Gao, T.; Venkatachalam, M.; Morris Jr, S.M.; Awad, A.S. L-Homoarginine supplementation prevents diabetic kidney damage. Physiol. Rep. 2019, 7, 14235–14243. [Google Scholar] [CrossRef] [PubMed]
- Huang, D.W.; Chang, W.C.; Wu, J.S.; Shih, R.W.; Shen, S.C. Gallic acid ameliorates hyperglycemia and improves hepatic carbohydrate metabolism in rats fed a high-fructose diet. Nutr. Res. 2016, 36, 150–160. [Google Scholar] [CrossRef]
- Yu, X.; Guoyi, T.; Cheng, Z.; Wang, N.; Feng, Y. Gallic acid and diabetes mellitus: Its association with oxidative stress. Molecules 2021, 26, 7115–7129. [Google Scholar]
- Weimin, H.; Xuchang, C.; Guirong, L.; Wang, Y. Acacetin protects against high glucose-induced endothelial cells injury by preserving mitochondrial function via activating Sirt1/Sirt3/AMPK signals. Front. Pharmacol. 2020, 11, 1–15. [Google Scholar]
- Yang, L.; Lingling, Z.; Xiaohan, W.; Guangping, L.; Gang, X.; Tong, L. Effect of acacetin on atrial structural remodeling and AF inducibility in DM rabbits. Chin. J. Geriatr. Heart Brain Vessel Dis. 2020, 22, 748–752. [Google Scholar]
- Song, F. Protection of Acacetin Against Diabetic Cardiomyopathy. Master’s Thesis, Xiamen University, Xiamen, China, 2019. [Google Scholar]
- Pan, M. Study on Chemical Constituents of Effective Fraction from Cardiospermum halicacabum for Anti-T2DM Effect. Master’s Theis, Guangxi University of Chinese Medicine, Nanning, China, 2017. [Google Scholar]
- Xiaobao, G.; Li, X.; Caihong, B.; Zhang, B. Diosmetin ameliorate type 2 diabetic mellitus by up-regulating Corynebacterium glutamicum to regulate IRS/PI3K/AKT-mediated glucose metabolism disorder in KK-Ay mice. Phytomedicine 2021, 87, 153582. [Google Scholar]
- Shujuan, Q. Study on the Renoprotective Effects of Isorhamnetin in Diabetic Rat and Its Mechanism. Ph.D. Thesis, Shandong University, Jinan, China, 2017. [Google Scholar]
- Zar, K.F.; Mondher, B.; Farhana, F.; Isoda, H. Effects of isorhamnetin on diabetes and its associated complications: A review of in vitro and in vivo studies and a post hoc transcriptome analysis of involved molecular pathways. Int. J. Mol. Sci. 2022, 23, 704. [Google Scholar]
- Alshehri Ali, S. Kaempferol attenuates diabetic nephropathy in streptozotocin-induced diabetic rats by a hypoglycaemic effect and concomitant activation of the Nrf-2/Ho-1/antioxidants axis. Arch. Physiol. Biochem. 2021, 24, 1–14. [Google Scholar] [CrossRef]
- Dawei, W.; Jie, Z.; Hongjin, T. Studies on the interaction of the natural flavonoid kaempferol and alpha-glucosidase. J. Anhui Polytech. Univ. 2020, 35, 20–25+33. [Google Scholar]
- Lihua, T.; Chao, F.; Haoran, W.; Shiguo, T. The protective effect of kaempferol on renal function and tissue of diabetic nephropathy rats induced by high glucose. Immunol. J. 2018, 34, 1041–1046. [Google Scholar]
- Qian, W.; Wenjuan, L.; Na, W.; Bing, Z. Orientin protect against diabetic cardiomyopathy via activating PGC-1β. Chin. J. ECC 2021, 19, 50–55. [Google Scholar]
- Yao, X. Development and Nutritional Evaluation of Chickpea Compound Milk Powder. Master’s Thesis, Tianjin University of Science & Technology, Tianjin, China, 2020. [Google Scholar]
- Pu, Y.; Shufang, Z.; Xuan, Z.; Pengyu, F.; Bing, Y. Research and development of hypoglycemic functional food. Diabetes New World 2017, 20, 188–189. [Google Scholar]
- Wang, S.; Chelikani, V.; Serventi, L. Evaluation of chickpea as alternative to soy in plant-based beverages, fresh and fermented. LWT-Food Sci. Technol. 2018, 97, 570–572. [Google Scholar] [CrossRef]
- Zou, S.; Wu, J.; Shahid, M.Q.; He, Y.; Lin, S.; Liu, Z.; Yang, X. Identification of key taste components in loquat using widely targeted metabolomics. Food Chem. 2020, 323, 126822–126827. [Google Scholar] [CrossRef] [PubMed]
- Li, S.; Chen, Y.; Duan, Y.; Zhao, Y.; Zhang, D.; Zang, L.; Ya, H. Widely targeted metabolomics analysis of different parts of Salsola Collina Pall. Molecules 2021, 26, 1126–1137. [Google Scholar] [CrossRef] [PubMed]
| Publisher’s Note: MDPI stays neutral with regard to jurisdictional claims in published maps and institutional affiliations. |
© 2022 by the authors. Licensee MDPI, Basel, Switzerland. This article is an open access article distributed under the terms and conditions of the Creative Commons Attribution (CC BY) license (https://creativecommons.org/licenses/by/4.0/).


