
Energy Landscape and Renewable Energy Resources in Nigeria: A Review
by
 , ,
, ,
Ebuwa Elisabeth Eweka
1,2,* ,
,
Enrique Lopez-Arroyo
1,
Christian Oluwaremilekun Medupin
3,
Abiola Oladipo
4 and
Luiza Cintra Campos
1,*
1
Civil, Environmental & Geomatic Engineering, University College London, Gower St., London WC1E 6BT, UK
2
BuroHappold Engineering, 17 Newman Street, London W1T 1PD, UK
3
Neo Mundo Ltd., 20 Mediterranean Street, Maitama District, Abuja 900001, Nigeria
4
Tiwakiki Consulting Ltd., 2 Mandley Avenue, Manchester M40 3LE, UK
*
Authors to whom correspondence should be addressed.
Energies 2022, 15(15), 5514; https://doi.org/10.3390/en15155514
Submission received: 13 May 2022
/
Revised: 10 June 2022
/
Accepted: 13 July 2022
/
Published: 29 July 2022
(This article belongs to the Section A: Sustainable Energy)
Abstract
:Renewable energy resource utilisation is becoming more prevalent in society and can be a sustainable method to meet rising energy demand and consumption. The International Renewable Energy Agency reports that presently, approximately 33% of total electricity output around the world is from renewable energy sources. However, in Nigeria, the World Bank reported this figure as 18.2% in 2015. It is important to understand how Nigeria can raise this average as the world moves towards less use of fossil fuels. Therefore, the aim of this work was to provide a review of the established literature, which can then be used to support the development of renewable energy systems in Nigeria. The methodology employed for the study of the literature involved a systematic review method, including identification, screening, eligibility and inclusion criterium steps. Understanding the national energy landscape is essential to support potential projects, and consequently, energy supply, demand and consumption in Nigeria are observed. The review examined renewable energy sources in Nigeria with a focus on solar and biomass/bioenergy. The levelised cost of electricity from renewable technologies was analysed, and the paper identified and evaluated past projects centered on solar and biomass, presenting three main case studies. The results indicate that solar and biomass have the most potential for energy generation in Nigeria, with 4–6.5 kWh/m2 of solar irradiation available per day and approximately 2.3 × 10⁹ GJ bioenergy potential per year. However, solar PV is currently of most interest in Nigeria due to the lower cost of on-grid solar PV electricity, which can comfortably compete with fossil fuels. Nevertheless, costs still need to be lowered to compete fully. Finally, the findings also indicate that there is an omission in the literature surrounding the existing renewable projects and technologies in Nigeria.
1. Introduction
Worldwide, there are over 860 million people without access to power. Sub-Saharan Africa accounts for 600 million [1]. Over the last century, extensive research has focused on the synergies between energy and development. Research has found that inclusive growth is not possible without modern energy [2]. Global energy demand is growing rapidly, and by 2035, worldwide energy consumption is projected to double [1]. Consequently, there have been major concerns about how to meet demand sustainably.
Currently, Nigeria has an electricity problem. The Nigerian “energy supply crisis” is referred to as the continuing failure of the Nigerian government and power sector to provide an adequate electricity supply to urban and rural communities. This is reflected in the low overall electrification rate in Nigeria, which stands at 56.5% [3]. Energy demand is estimated at approximately 17,520 MW annually, but peak generation capability is around 5300 MW [4]. The Nigerian energy sector is greatly dependent on petroleum and fossil fuels for energy and electricity production. The International Renewable Energy Agency (IRENA) reports that presently, approximately 33% of total global electricity output is from renewable energy sources, whereas, in Nigeria, the figure is 18.2% [5,6]. This exerts pressure on the limited renewable energy resources available as fossil fuel availability continues to deplete. Thus, the appeal for renewable energy sources has grown exponentially in the pursuit of climate change mitigation whilst still expanding energy access. The development of renewable energy can lead to the reduction in greenhouse gas emissions and can also have other benefits, such as contributing to the creation of new jobs, called “green jobs”. Additionally, indirect benefits such as a reduction in deforestation and soil erosion due to inefficient and unsustainable consumption of biomass. Incorrect burning of biomass can also lead to greenhouse gas emissions, and indoor smoke can cause respiratory diseases in children and adults.
The main aim of this study is to provide a review of the current energy situation and renewable energy resources in Nigeria. This study is important as it fills omissions/gaps in research on the energy crisis in Nigeria and will support renewable energy system development in Nigeria.
2. Methods
2.1. Literature Review Methodology
A comprehensive analysis of the literature and extraction of relevant information was carried out. The literature review was completed strategically using four main steps: identification, screening, eligibility and inclusion. For identification, appropriate publications were found using Google Scholar. The main keyword combinations were: energy + Nigeria; electricity + Nigeria; solar + Nigeria; biomass + Nigeria. In order to validate the method of search, the keywords were searched on the Science Direct website. The input of the keywords “Energy Nigeria” on Google Scholar gave 1,260,000 results, whereas Science Direct gave 30,152 results. This validates the search method as Google Scholar gives a wide range of research outputs, including the grey literature, such as reports and government papers.
The time frame set (2000–2020) was purposely broad due to the fact that between 2000 and 2005, the electricity crisis in Nigeria was gaining the most attention, and therefore, a lot of literature was published. Following the identification of the literature, the records were screened. This involved reading the title and abstracts; inappropriate studies were excluded based on the main focus of the study and its relevance to Nigeria. Suitable records were progressed to the eligibility step. In the eligibility step, full-text articles were read and assessed. Relevant studies were included, which is the last step. The flow chart for the literature review methodology is presented in Figure 1.
2.2. Methodology Limitations
There are some methodological limitations in this paper. Firstly, the literature review is limited to online information. Secondly, the analysed publications were retrieved from the Google Scholar database only. Google Scholar is often criticised due to a lack of screening for the quality of the journals on the database. However, the literature review methodology employed reduces the effect of this as studies are screened before inclusion. Moreover, studies found that Google Scholar produces more coverage than other databases such as Web of Science and Scopus [7,8]. Finally, the keywords used, such as “energy + Nigeria” could pose a study limitation as relevant articles could be missed because the authors failed to use these specific keywords.
3. Results
3.1. Energy Situation: Demand and Consumption in Nigeria
3.1.1. Energy Consumption
Global consumption patterns have shown that some African countries have the lowest rates of energy usage in the world—in 2017, Nigeria’s energy consumption was 25.79 billion kilowatt-hours. In comparison, the global average (based on 190 countries) was 117.31 billion kilowatt-hours [9]. This illustrates the gap between where the nation is and where it should aspire to be. Generally, the annual growth rate of total energy consumption has fluctuated strongly since the 1970s. A total consumption growth rate of 38% was recorded in 1977, 1% in 1985 and 5% in 2010. A negative yearly rate was recorded in 1995 and 2000 with −29% and −1%, respectively [10]. In Nigeria, energy consumption patterns are divided into five main sectors: industrial, commercial, transport, agricultural and household [11]. In both energy and electricity consumption sectors, the residential sector accounts for most of the energy usage. The main energy-consuming activities within the residential sector are cooking (91%), lighting (6%) and electrical appliances (3%) [12]. The International Energy Agency (IEA) provides data on energy consumption in Nigeria from 1990 to 2017.
Energy production in Nigeria is considerably higher than energy consumption. In 2017, the nation consumed approximately 1.54 quadrillion BTU (British Thermal Unit) of energy, which represented only 0.26% of global energy consumption. In the same year, Nigeria produced 5.95 quadrillions of energy which covers 386% of Nigeria’s yearly energy consumption needs [13]. Any “extra” energy is exported to neighboring nations and other countries. The impact of energy consumption on a country’s GDP has been researched for many years in order to understand the relationship between them. A range of important policies and regulations in the Nigerian energy sector are explored and summarised in Table S1 in Supplementary Information. This details renewable energy and general energy policies in Nigeria.
3.1.2. Energy Demand
Energy demand can be described as “the consumption of energy by human activity” [14]. Currently, energy demand is estimated at approximately 17,520 MW annually, but peak generation capability is around 5300 MW [4]. The population in Nigeria is estimated to grow from 115 million in 2000 to 281 million by 2030, which results in an average yearly growth rate of 2.86% between 2000 and 2030 [12]. This rapid growth has a direct effect on energy demand.
Studies by Sambo et al. [15,16] found that population is a major driver of energy demand in Nigeria; however, the most important determinant is economic activity and structure. The study used models developed by the Energy Commission of Nigeria (ECN) to analyse Nigeria’s energy demand between the years 2000 and 2030. The energy demand projections were computed using MAED (Model for the Analysis of Energy Demand). Four economic scenarios were designed: reference (7% GDP growth), high growth (10% GDP growth), optimistic 1 (11.5% GDP growth) and optimistic 2 (13% GDP growth). Table 1 shows the electricity demand projections for each scenario. The results showed that in the four adopted GDP growth scenarios, there was a substantial increase in electricity demand over 20 years (2010–2030). For example, 7% GDP growth was estimated to have an electricity demand projection of 15,730 MW in 2010. Optimistic GDP growth of 13% in the same year was estimated to have resulted in electricity demand of 33,250 MW, which is over 50% more than the 7% figure of 2010. This indicates that a high economic growth rate corresponds to higher energy demand, and as a result, Nigeria needs to exploit the full capacity of energy generation in the country. This will assist the country in GDP growth and also encourage electricity demand to grow, which is an indicator of economic development. As 2030 approaches, the Nigerian government can use the computed energy demand projections to track progress and where they should be in terms of electricity demand.
A report by ExxonMobil (2019) [17] details three main drivers of energy demand as policy, technology and consumer preferences. However, the interplay and importance between the three vary and depend on the local circumstances, such as available resources and public support. This is detailed further in Figure 2.
3.2. Energy Resources: Supply and Production
3.2.1. Energy Supply Status
Presently, Nigeria uses mostly fossil fuels for electricity production; the energy sector is greatly dependent on petroleum to supply energy to the population. The three main energy types utilised are natural gas, oil and coal, which are described in Table 2. Natural gas, crude oil and coal are all linked with increasing greenhouse gases, with coal emitting the most. The main environmental impacts of each source of energy include mining of natural gas potentially leaking large amounts of methane gas, oil spillages resulting in environmental pollution and black carbon from coal having harmful effects on the environment. This is explored further in Table 2. Research shows that the primary energy source in Nigeria is biofuels and waste, followed by oil and natural gas. Solid biomass and waste account for approximately 80% of total primary energy consumed in Nigeria [18].
3.2.2. National Grid System
The national grid has a total installed capacity of over 11,000 MW but an available capacity of only over 7000 MW. In fact, in 2012, Nigeria generated approximately 4000–5000 megawatts of power for a population of 150 million people [31]. By using the rule of thumb on power identified in a paper by Vincent and Yusuf (2014) [32], there should be 1000 MW per 1,000,00 people. Currently, the Nigerian population is approximately 202 million, which means power generation should be around 202,000 MW; as a result, Nigeria has a power deficit of over 190,000 MW [33]. The poor energy situation and power deficit can be attributed to a range of problems associated with the national grid network: physical deterioration of transmission lines, lack of maintenance of facilities, illegal connections/theft and outdated technology used by consumers [34].
The Nigerian transmission network has a maximum electricity wheeling capacity of only 6056 MW, which is much lower than the national demand for electricity [35]. Inadequate infrastructure and a fragile, radial system mean that the network is more prone to voltage instability and then voltage collapse. Voltage collapse is associated with a weak and stressed system; collapses lead to partial (p/c) or total (t/c) system crashes, which result in blackouts. Table 3 shows data of partial and total collapses on the national grid between 2000 and 2019. The data show the highest level of system collapses occurred between 2003 and 2004, with another increase between 2008 and 2010. The values are presented in a graph in Figure 3.
Figure 3 shows that the frequency of system disturbances is decreasing (negative trendline). However, the standalone figures show that the frequency is still high. The key studies analysing system collapses (Table 3) are successful in presenting reliable information and arriving at a valid conclusion as they present the same values. This demonstrates high accuracy within the literature. The two sources for 2010–2019 [38,39] were published within four months of each other (October 2019 and February 2020), which also implies high accuracy. Nonetheless, information for 2019 is difficult to find.
3.2.3. Power Generating Sets
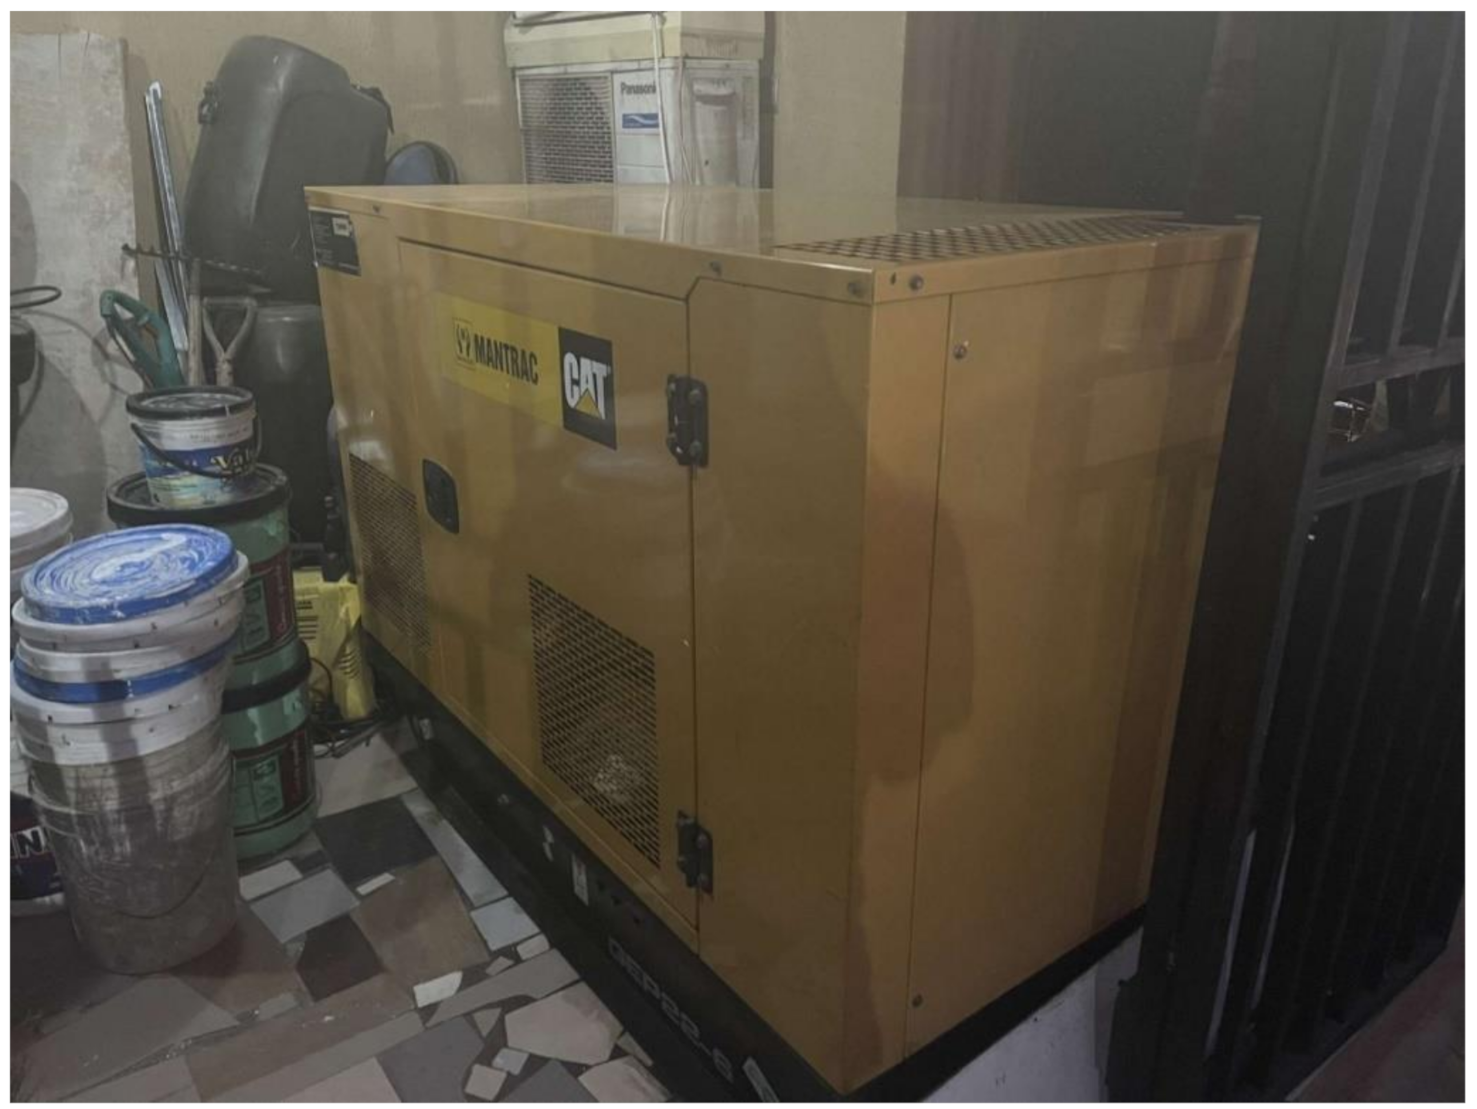
To make up for the lack of reliable electricity supplied by the national grid, many Nigerians have been forced to find alternative off-grid solutions. Investigations have found that over 60 million Nigerians own personal power generating sets, as illustrated by Figure 4 and Figure 5. This translates to 26% of households and 86% of operating businesses [40].
Generators range from 0.5 kVA (0.4 kW) for a small business kiosk to large generators of 75 kVA (60 kW), which service residential estates and industries [42]. A 2014 World Bank survey showed that 27% of the Nigeran firms contacted identified inconsistent electricity supply as the primary inhibitor of doing business [43]. A study by Ikhuosho-Asikhia (2014) investigated the effects of generators on small-scale Nigerian businesses. The results showed that 71% of businesses thought that generators do not profit their business, and 74% were willing to pay more for an environmentally friendly constant supply. Additionally, the study revealed that small-scale businesses with lesser income spend 46% of their annual income on the fueling and maintenance of generators [44]. The Access to Energy Institute analysed expenditure on generators in Nigeria. The data show that most expenditure is spent on fuel and maintenance of the generators.
A key study by Osagie et al. (2016) investigated the human experiences and perceptions of fossil fuel generators in Nigeria [45]. Diesel exhaust contains over 40 toxic contaminants, such as nitrogen oxide, which is bad for the environment and can cause respiratory illnesses. Fire incidences, skin burns and electrocutions are also frequent. The Access to Energy Institute reports approximately 1500 deaths annually from inhaling generator smoke and carbon monoxide. The institute also reports that 2/3 of generator users described impaired hearing, and users also have a 70% increased risk of lung cancer [46]. The research shows that 100% of the population in Nigeria is exposed to air pollution levels that exceed World Health Guidelines and cause damage worth 1.5% of gross national income [47].
3.2.4. Renewable Energy in Nigeria
Over the past two decades (2000–2020), there has been a global push towards reducing greenhouse gas emissions. As a result, energy systems are moving towards low-carbon technologies such as renewable energy sources (hydropower, bioenergy, wind, solar, marine and geothermal) and nuclear energy. This process of transitioning from the use of fossil fuels to low-carbon energy sources is known as “decarbonisation”. The International Renewable Energy Agency reports that presently, approximately 33% of total electricity output globally is from renewable energy sources [5]. In Nigeria, the World Bank reports this figure as 18.2% in 2015 [6]. Nigeria is abundantly blessed with conventional and renewable energy sources. A map of Nigeria is presented in Figure 6. Alas, most of the available renewable resources are untapped. Table 4 presents the renewable potentials per resource type in Nigeria. The table shows that biomass, solar and large hydropower have the highest energy potential in Nigeria, but current utilisation is still low. Less than 30% of each renewable energy source potential is utilised.
Wind Energy
Wind energy potential and wind speed in Nigeria vary from approximately 2 m/s in the coastal region and 4 m/s in the far northern region (Table 4). The use of wind for electricity generation is relatively new due to rapid growth in technology. In order to transform the energy in moving air into mechanical energy, a range of conversion systems can be used, such as wind turbines, generators and dynamos [32]. A wind mapping project carried out by the Ministry of Science and Technology resulted in wind energy resource mapping in Nigeria. This indicated a very small and local potential for wind energy. In fact, Nigeria falls under a poor/moderate wind regime. Despite this, there are two large wind farm projects in Nigeria; a 10 MW project in Katsina and a 100 MW project in Plateau State [48].
Hydropower Energy
Hydropower is the world’s biggest source of renewable electricity generation supplying 70–80% and currently accounts for 16% of the world’s total power supply [50]. Nigeria is endowed with various bodies of water, including large rivers and natural falls, with 11 key river basins located around the country. The research shows that the river systems can provide a total of 70 micro dams, 126 mini dams and 86 small hydropower sites [51]. The total exploitable potential of hydropower resources in Nigeria is 3500 MW for small hydropower and a massive 11,250 MW for large hydropower, which is enough to solely power Nigerian electricity generation (Table 4). However, only 2% of small hydropower and 17% of large hydropower is currently being utilised. As a result, only 18.2% of electricity generation in Nigeria is derived from hydroelectric sources [52].
Solar Energy
Solar energy is one of the most promising renewable energy sources due to its apparent “limitless” potential. Nigeria has great potential for solar energy; the country is located within the “high sunshine belt” region and is just north of the equator. The annual average of total solar radiation varies from about 4 kWh/m2.day in the coastal regions to approximately 6.5 kWh/m2.day in the North (Table 4). The long-term average of GHI (Global Horizontal Irradiation) between 1994 and 2018 in Nigeria was approximately 1534 kWh/m2 yearly total in the coastal states such as Port Harcourt, whereas it increased to approximately 2264 kWh/m2 yearly total in northern states such as Sokoto, Kano and Maiduguri (see Figure 6). Average sunshine hours are estimated at 6 h per day. Due to the high irradiation in Nigeria, research has shown that if 1% of the land mass in Nigeria (920 km2) is covered with solar PV, it has the potential to generate over 200 GWh annually, which is nearly 10 times more than the current electricity generated [51]. However, the economic viability of solar PV is often questioned due to the levelised cost of energy (LCOE) and the high initial installation cost. Nevertheless, the World Bank suggests that PV and hybrid systems are already economically competitive for off-grid applications [48]. Solar PV, off-grid or mini-grid is ideal for rural communities not connected to the national grid. A GIS survey by GIZ identified 8000 clusters of 26 million people who can be served with solar mini-grids, generating a capacity of over 3000 MW [53].
Bioenergy (Biomass)
Biomass energy refers to the energy of biological systems such as wood and other biological materials. Biomass is considered to be carbon neutral due to no net gain in atmospheric CO2 when the fuel is burned [54]. Many technologies have been designed to turn biomass into an efficient, clean and sustainable energy, including direct combustion, co-firing, biomass gasification and anaerobic digestion, which involves using micro-organisms to break down the biomass and turn it into biogas [55]. Solid biomass and waste account for approximately 80% of total primary energy consumed in Nigeria [18]. A study by Simonyan and Fasina (2013) explored the annual bioenergy potential for each source of biomass in Nigeria (see Table 5).
From Table 5, it is clear that energy crops and agricultural residues have the biggest potential for bioenergy production in Nigeria. Energy crops are grown specifically for energy; in Nigeria, this includes eucalyptus, poplar and jatropha. Out of the total land area in Nigeria (91,077 kha), approximately 78% (70,800 kha) is arable land [57]. Many agricultural crops such as cassava, maize and sugar cane, which are cultivated in Nigeria, can be converted into liquid and solid biofuels. However, this may lead to food competition and, hence, it is necessary to only use residues from the crops instead of the crops themselves. Table 6 shows the energy available from agricultural crops in Nigeria. The study by Simonyan (2013) [56] details the residue estimates from agricultural crops in Nigeria in 2010. However, by using data from The Food and Agriculture Organisation of the United Nations (FAOSTAT) (2020) [58] shown in Table 7, it is clear that crop production and, therefore, the total energy available has increased between 2010-2018. Therefore, the potential for biomass is much bigger than previously calculated.
Another high source of biomass is municipal solid waste, which is produced by households and commercial and industrial businesses. This includes food waste, unwanted materials, street sweepings and more. The research shows that up to 87% of the municipal solid waste composition is organic, with an estimated 3168 million tonnes of waste generated each day in Nigeria (2010). This has the potential to generate 186 GJ of energy [57]. However, this potential is not utilised as municipal solid waste is sent to landfills. The study by Simonyan (2013) showed that in 2010, there were over 15 million tonnes of dry animal dung available in Nigeria, which gives a bioenergy potential of 29.25 GJ of energy. It is clear that abattoirs and cattle farms have the highest biogas potential.
Biomass consumption does have some environmental, health and socio-economic effects. Inefficient and unsustainable consumption of biomass can lead to deforestation and soil erosion. Inefficient and incorrect burning of biomass can also lead to greenhouse gas emissions, and indoor smoke can cause respiratory diseases in children and adults. Studies show that children exposed to indoor air pollution are 2–3 times more likely to catch pneumonia [59]. Lastly, biomass use can have negative effects on rural communities that have to collect the fuel. Oftentimes, young girls are withdrawn from school to attend to domestic chores related to biomass usage. Moreover, women often suffer health issues and physical pains from strenuous work collecting and using biomass such as wood.
Biogas is produced by the anaerobic digestion of biomass. A biogas digester creates a favourable environment for the fermentation process to occur. The digester consists of an airtight reservoir where suitable feedstock is placed; this can include human waste, cow dung and abattoir waste. Depending on the temperature and moisture content in the digester, it can take 6–25 days to fully process a batch of feedstock [60].
Animal wastes have a high potential for bioenergy production in Nigeria. The research shows that daily input of waste from a single cow can produce 1–2 kwh of electricity or 8–9 kwh of heat [60]. An increase in meat production has meant an increase in abattoirs and slaughterhouses in Nigeria. The wastes generated in these environments are ideal for biogas production in Nigeria. It is estimated that about 227,500 tonnes of fresh animal waste are produced daily in Nigeria. With 1 kg of waste generating 0.03 m3 of gas, Nigeria is capable of producing over 6 million m3 of biogas every day [61]. A study by Simonyan (2013) also reports on animal waste production and its potential for biogas yield in Nigeria (2010). This is detailed in Table 8. The study by Akinbami et al. (2000) [61] reports an improvement in gas quality when different types of waste are mixed together. This is presented in Table 9. Codigestion is important in biogas production, and Nigeria, being in a tropical region, can aid this process. This is useful for applications in which there are low quantities of each type of feedstock.
There is a lack of data concerning the number of biogas digesters in use in Nigeria due to the fact that there is not a certified authority responsible for it within the government. However, multiple studies ([61,62,63,64]) focus on biogas potential in Nigeria using abattoir wastes. It was challenging to find up-to-date (in the last five years, 2015–2020) literature with information on biomass/biogas feedstock specifically based in Nigeria.
3.2.5. Renewable Energy Resources-Cost Comparison
The levelised cost of electricity (LCOE) is defined as the “net present value of the unit-cost of electricity over its lifetime” and is used to compare different methods of electricity generation on an equal level [65]. In simpler terms, LCOE is calculated by dividing the average total cost of a system (capital and operating costs) by the total energy output of the system over its lifetime. This produces the average total cost per unit of electricity generated [66]. As the world moves towards climate change mitigation, the costs of renewable technologies have developed. A chart from the IRENA “Renewable Power Generation Costs” (2019) [5] shows the LCOE of renewable technologies between 2010 and 2019. In this chart, the range of costs is represented as vertical bars per technology. In terms of the 2019 weighted average cost, most renewable technologies sit within the competitive range of fossil fuels. This excludes concentrating solar power, which is still slightly higher than the fossil fuel range. However, the cost is falling. Solar PV shows the biggest drop, with an 82% decrease between 2010 and 2019. A fact sheet by “Power for All” reports that the average global LCOE for mini-grids is USD 0.55–0.60 kWh. This is much higher than the renewable energy technologies assessed. In order for mini-grids to become more competitive, their LCOE needs to be more than halved to provide an affordable tariff for customers [67].
The relative costs of energy and each technology are context-dependent and vary in the country/region. This is due to the fact that, for example, biomass and solar PV costs are likely to be lower in warmer countries as they produce more energy in their lifetime. Similarly, investment costs may be lower as PV is usually imported while AD can be built locally, requiring only a few parts to be imported. Furthermore, the fossil-fuel cost range may vary. A report by the Nigerian Economic Summit Group and Heinrich Böll Stiftung Nigeria (2017) presents a comparison of costs of electricity generation in Nigeria [68]. These costs reported are presented in Table 10.
The LCOE data presented in Table 10 show that hydropower is one of the cheapest options in Nigeria. This can be due to Nigeria’s huge amount of natural hydro reserves. Solar PV is currently of most interest in Nigeria. The lower cost of on-grid solar PV can comfortably compete with fossil fuels. However, costs still need to be lowered to compete fully. The cost of batteries, a main component of the PV system, is rapidly decreasing due to the increased use of electric vehicles. This affects the LCOE of solar PV. Additionally, solar PV relies on imported materials, whereas other renewable resources such as wind or hydropower, for example, can be built with local materials and may not need batteries, etc. Off-grid solar PV is very cost-competitive when compared to diesel and gasoline generators, which are very prevalent in Nigerian communities (Table 10). Off-grid solar will be ideal for rural communities not connected to the grid. The full costs/benefits of renewable energy sources are yet to be sufficiently explored for Nigeria; there is a gap within the literature in exploring the up-to-date LCOE and other costs. This will benefit renewable energy project coordinators and policy designers.
In summary, renewable energy sources and technologies in Nigeria continue to advance, and REs (renewable energy) have become the least expensive and most sustainable method to achieve universal electricity access. It was estimated that Nigeria could transition to 100% renewable energy by 2050. This consists of 79.1% solar, 20% onshore wind, 0.8% hydropower and 0.1% wave energy. This would require only 2% of the total land in Nigeria and can save the country up to 36% in fossil fuel deployment costs [69]. The declining costs of solar PV for off-grid systems and mini-grids are key in helping deliver affordable electricity access to millions of Nigerians.
3.2.6. Overview of Technologies and Projects for Application in Nigeria
The overview of the projects and technologies are presented in Tables S2 and S3 in Supplementary Information. Table S2 solar power projects are the most prominent in Nigeria and exist in multiple states, including Kaduna, Katsina and Bauchi. Table S3 summarises and presents the description, advantages/disadvantages and other details about solar PV, biogas and mini-grids.
Table 11 summarises the case studies and projects in Nigeria; this contains important factors and information such as the type of technology deployed, the amount of electricity generated and the number of households supplied. Other notable projects include: ([70,71,72]). Ozor et al., 2014 [71] is a project in Abakaliki Abattoir In South-Eastern Nigeria, in which biogas is produced using cow dung. This is not included in the case study table due to a lack of information surrounding the specific technology, generation, and supply. Yimen et al., 2018 [72], included a case study of a photovoltaic/wind/biogas/pumped-hydro off-grid hybrid system for rural electrification in Djoundé, Northern Cameroon. Odoi-Yorke (2018) [70] presented a design for a hybrid PV/biogas system using the HOMER software (Hybrid Optimisation Model for Electric Renewable) to execute technical, economic and greenhouse gas emission analysis. This study is based in Offinso North, Ghana. These studies were not included due to the fact that they are based in other African countries.
4. Discussion
This paper shows that there is an omission in the literature surrounding the existing renewable projects and technologies in Nigeria. The identified gap inspired the need to examine, analyse and summarise the different projects and technologies. This study fills a gap in the existing literature by presenting an overview of renewable energy projects and technologies (Tables S2 and S3) whilst also providing case studies of specific projects in the region (see Table 11) [48,76]. The study by Sanni et al. (2019) presented an off-grid solar PV and biogas power generation system for a slaughterhouse in Ado Ekiti, Nigeria [75]. This is particularly important due to the fact that the two utilised technologies (solar and biogas) have the most potential for energy generation in Nigeria, according to the results of this study. The Cows To Kilowatts Project detailed in the Innovation for Sustainable Development (2005) [74] is also interested due to the use of slaughterhouse waste to produce biogas; this study revealed that slaughterhouse waste/animal wastes have a high potential for bioenergy production in Nigeria and should be used more. Current utilisation is under 30% (Table 4). Similar studies include Ozor et al. [63], which is a project in which biogas is produced using cow dung in Abakaliki Abattoir in South-Eastern Nigeria. Other similar studies around the world include Yimen et al. [77], which is a case study of a photovoltaic/wind/biogas/pumped-hydro off-grid hybrid system for rural electrification in Djoundé, Northern Cameroon. Additionally, Odoi-Yorke [70] presented a design for a hybrid PV/biogas system in Offinso North, Ghana. In general, the main barriers faced by Nigeria in relation to renewable energy utilization are non-implementation of global and national renewable energy policies, lack of adequate research and knowledge of renewable energy sources within the population and financial matters.
The main limitation of the reviewed studies is the restricted access to data. Energy-related studies in Nigeria are limited, and therefore, most researchers undertake fieldwork in which they collect primary data themselves. Energy-related studies in other countries and in other continents, such as Europe, were more easily found during the literature review. The research revealed there is a lack of baseline studies and recorded datasets in regard to energy demand, supply and consumption at the state level. The key studies by Adedeji [78] and the World Bank [52] state that there can be no significant design, development or evaluation of national strategies without reliable data and quality statistics. It is necessary for governments to record this information in order to identify socio-economic challenges in the country.
Additionally, there may be some bias within the studies, as many of the key studies included were written by Nigerian authors ([35,56,63,64,78,79,80]). Researchers can have biased views due to their cultural background or perspectives of certain phenomena. This may affect the reliability of the results. However, the methodology employed examined the appropriateness of each report and its data-gathering process.
Our review has many strengths. This includes exploiting a wide range of literature, including journals, newspapers and scientific publications. When compared to similar studies, it is clear that using an extensive range of information provides the best results. This justifies the approach used as it corresponds with comparable work.
Since the writing of this paper (2020), there have been a number of studies carried out in the literature around the topic of “energy in Nigeria”. The words “energy” and “Nigeria” was searched on Google Scholar to understand the number of studies carried out during the years 2021–2022. Google Scholar was used as an appropriate publication for this paper were found using Google Scholar. Some of these studies are detailed in Table 12. Although, in general, due to the COVID-19 pandemic between the years 2020 and 2021, there was a reduction in the number of studies carried out and published.
5. Conclusions
This paper presented a review of the established literature that gives a detailed background on energy and electricity in Nigeria from 2000 to 2020. The results indicate that solar and biomass have the most potential for energy generation in Nigeria, with 4–6.5 kWh/m2 of solar irradiation available per day and approximately 2.3 × 10⁹ GJ bioenergy potential per year. Overall, this study is relevant for providing a solution to the energy/electricity problem in Nigeria whilst also tackling the issue of slaughterhouse wastes.
Solar and biomass have the most potential in Nigeria, which is agreed upon across the literature. Multiple studies also agree on the different existing renewable projects in Nigeria. Renewable energy in Nigeria has begun to gain prominence in the last few years. Wind energy has a very small and local potential for electricity generation, which explains the lack of focus on that topic area. Hydropower is the world’s biggest source of renewable energy and is heavily utilised in Nigeria. As a result, a large number of studies were undertaken on the current utilisation and further potential of hydropower energy. Likewise, solar power is currently of high global interest as it is becoming more affordable over time due to advancements in technology. However, there is a need for more exploration into the new emerging technologies and their applications in Nigeria. Biomass/biogas exists in abundance in Nigeria; however, the technology is still relatively new to Sub-Saharan African countries. Moreover, except in South Africa, there is little scientific literature that presents information on commercial biomass systems in African countries in comparison to “first world countries” such as the United States. Biomass has an advantage over other technologies such as wind and even solar due to the fact that investing in waste to energy technologies not only deals with the energy demand but also with waste management, sanitation and reducing the exposure to pathogens.
In conclusion, this review provides a detailed background on the energy sector in Nigeria that can be utilised by practitioners and academics working in the field of renewable energy in Nigeria. Based on the findings of this review, researchers should consider more investigations into the main energy parameters in Nigeria (demand, supply, consumption], and focus should be on providing up-to-date information on these factors. It is important that future research examines how these parameters can be measured more accurately, quantitatively, or qualitatively. Future studies should be devoted to the development of reports on each specific parameter at a national level but, more importantly, on a state level.
Supplementary Materials
The following supporting information can be downloaded at: https://www.mdpi.com/article/10.3390/en15155514/s1, Table S1: Summary of energy policies and regulations in Nigeria; Table S2: Overview of current solar, biomass and mini-grid projects in Nigeria; Table S3: Overview of solar, biomass/biogas and mini-grid technologies in Nigeria. References [11,45,56,72,76,94,95,96,97,98,99,100,101,102,103,104,105,106,107,108,109,110,111,112,113,114,115,116,117,118] are cited in the supplementary materials.
Author Contributions
E.E.E.: Conceptualisation, methodology, investigation, visualisation, writing—original draft. E.L.-A.: Conceptualisation, writing—review and editing. A.O.: Funding acquisition, writing—review and editing. C.O.M.: Funding acquisition. L.C.C.: Conceptualisation, Supervision, funding acquisition, project administration, writing—review and editing. All authors have read and agreed to the published version of the manuscript.
Funding
This research was supported by Innovate UK through the Energy Catalyst Round 7: early, mid and late stage, under Grant number 43863. Enrique Lopez-Arroyo acknowledges the Secretaria Nacional de Educación Superior, Ciencia y Tecnología e Innovación for funding his PhD studies.
Conflicts of Interest
The authors declare no conflict of interest.
References
- IEA. SDG7: Data and Projections. 2019. Available online: https://www.iea.org/reports/sdg7-data-and-projections/access-to-electricity (accessed on 23 March 2020).
- Indrawati, S.M.; What You Need to Know about Energy and Poverty. World Bank Blogs. 2015. Available online: https://blogs.worldbank.org/voices/what-you-need-know-about-energy-and-poverty (accessed on 4 April 2020).
- The World Bank. Access to Electricity (% of Population)—Nigeria. 2018. Available online: https://data.worldbank.org/indicator/EG.ELC.ACCS.ZS?end=2018&locations=NG&start=1990&view=chart (accessed on 31 March 2020).
- National Council on Power. Federal Republic of Nigeria Sustainable Energy for All Action Agenda (Se4All-Aa). 2016, p. 12. Available online: https://www.seforall.org/sites/default/files/NIGERIA_SE4ALL_ACTION_AGENDA_FINAL.pdf (accessed on 23 March 2020).
- IRENA. Renewable Energy Statistics 2019. Abu Dhabi. 2019. Available online: https://www.irena.org/-/media/Files/IRENA/Agency/Publication/2019/Jul/IRENA_Renewable_energy_statistics_2019.pdf (accessed on 8 May 2020).
- Trading Economics. Nigeria—Renewable Electricity. 2020. Available online: https://tradingeconomics.com/nigeria/renewable-electricity-percent-in-total-electricity-output-wb-data.html (accessed on 27 March 2020).
- Halevi, G.; Moed, H.; Bar-Ilan, J. Suitability of Google Scholar as a source of scientific information and as a source of data for scientific evaluation—Review of the Literature. J. Informetr. 2017, 11, 823–834. [Google Scholar] [CrossRef]
- Martín-Martín, A.; Orduna-Malea, E.; Thelwall, M.; Delgado López-Cózar, E. Google Scholar, Web of Science, and Scopus: A systematic comparison of citations in 252 subject categories. J. Informetr. 2018, 12, 1160–1177. [Google Scholar] [CrossRef] [Green Version]
- globaleconomy.com. Nigeria: Electricty Consumption. 2020. Available online: https://www.theglobaleconomy.com/Nigeria/electricity_consumption/ (accessed on 26 May 2020).
- Oyaromade, R.; Mathew, A.; Abalaba, B.P. ‘Energy Consumption and Economic Growth in Nigeria: A Causality Analysis. Int. J. Sustain. Energy Environ. Res. 2014, 3, 53–61. [Google Scholar]
- ECN. National Energy Policy. 2013. Available online: http://rea.gov.ng/wp-content/uploads/2017/09/National_Energy_Policy_Nigeria.pdf (accessed on 8 April 2020).
- Oyedepo, S.O. Energy and sustainable development in Nigeria: The way forward Sustainable energy Renewable energy efficiency Energy conservation Review Background. Energy Sustain. Soc. 2012, 2, 15. [Google Scholar] [CrossRef] [Green Version]
- worldometers.info. Nigeria Energy. 2020. Available online: https://www.worldometers.info/energy/nigeria-energy/ (accessed on 12 June 2020).
- CREDS. What is Energy Demand? Centre for Research into Energy Demand. Available online: https://www.creds.ac.uk/what-is-energy-demand/ (accessed on 17 May 2020).
- Sambo, A.S.; Iloeje, O.C.J.; Ojosu, O.J.; Olayande, S.; Yusuf, A.O. Nigeria’s Experience on the Application of IAEA’s Energy Models (MAED & WASP] for National Energy Planning. Republic of Korea. 2006, pp. 24–28. Available online: http://erepository.uonbi.ac.ke/handle/11295/51327 (accessed on 6 April 2020).
- Sambo, A. Matching Electricity Supply and Demand in Nigeria. Int. Assoc. Energy Econ. 2008, 4, 32–36. Available online: https://www.iaee.org/documents/newsletterarticles/408sambo.pdf (accessed on 6 April 2020).
- Exxonmobil.co.uk. Energy Demand: Three Drivers, Exxonmobil—Outlook for Energy. 2019. Available online: https://www.exxonmobil.co.uk/Energy-and-environment/Looking-forward/Outlook-for-Energy/Energy-demand#Threedriversofenergydemand (accessed on 18 June 2020).
- Ben-Iwo, J.; Manovic, V.; Longhurst, P. Biomass resources and biofuels potential for the production of transportation fuels in Nigeria. Renew. Sustain. Energy Rev. 2016, 63, 172–192. [Google Scholar] [CrossRef] [Green Version]
- USEIA. International petroleum (Oil) Production: OPEC Countries Crude Oil Excluding Lease Condensate; USEIA (United States Energy Information Administration): Washington, DC, USA, 2010. [Google Scholar]
- Ologunorisa, T. A review of the effects of gas flaring on the Niger Delta environment. Int. J. Sustain. Dev. World Ecol. 2001, 8, 249–255. Available online: https://www.tandfonline.com/doi/abs/10.1080/13504500109470082 (accessed on 7 April 2022). [CrossRef]
- Osuji, L.C.; Avwiri, G.O. Flared gases and other pollutants associated with air quality in industrial areas of Nigeria: An overview. Chem. Biodivers. 2005, 2, 1277–1289. [Google Scholar] [CrossRef]
- Hopkins, J.R.; Evans, M.J.; Lee, J.D.; Lewis, A.C.; Marsham, J.H.; McQuaid, J.B.; Parker, D.J.; Stewart, D.J.; Reeves, C.E.; Purvis, R.M. Direct estimates of emissions from the megacity of Lagos. Atmos. Chem. Phys. 2019, 9, 8471–8477. [Google Scholar] [CrossRef] [Green Version]
- gasvessel.eu. Compressed Natural Gas Transport System. Available online: https://www.gasvessel.eu/news/natural-gas-vs-coal-impact-on-the-environment/ (accessed on 22 July 2020).
- Naturalgas.org. Natural Gas and the Environment. 2004. Available online: https://web.archive.org/web/20090503132200/http:/www.naturalgas.org/environment/naturalgas.asp (accessed on 14 May 2020).
- Global Greenhouse Warming. Gas vs Coal, Global Greenhouse Warming. 2010. Available online: http://www.global-greenhouse-warming.com/gas-vs-coal.html (accessed on 16 April 2020).
- Hultman, N.; Rebois, D.; Scholten, M.; Ramig, C. Erratum: The greenhouse impact of unconventional gas for electricity generation. Environ. Res. Lett. 2011, 6, 049504. [Google Scholar] [CrossRef] [Green Version]
- Ejiogu, A. E-waste economics: A Nigerian perspective. Manag. Environ. Qual. Int. J. 2013, 24, 199. Available online: https://www.researchgate.net/publication/235635669_E-waste_economics_A_Nigerian_perspective (accessed on 5 June 2020). [CrossRef]
- UCSUSA. Environmental Impacts of Natural Gas. Union of Concerned Scientists, 19 June 2014. Available online: https://www.ucsusa.org/resources/environmental-impacts-natural-gas (accessed on 6 July 2020).
- U.S. EIA. Nigeria Country Analysis Brief; U.S. Energy Information Administration: Washington, DC, USA, 1997. [Google Scholar]
- Novakov, T.; Rosen, H. The Black Carbon Story: Early History and New Perspectives. AMBIO. 2013, pp. 840–851. Available online: https://link.springer.com/article/10.1007/s13280-013-0392-8#citeas (accessed on 18 July 2020).
- Ndege, Y. Explaining Nigeria’s energy crisis. Aljazeera, 14 June 2012. Available online: https://www.aljazeera.com/features/2012/06/14/explaining-nigerias-energy-crisis/ (accessed on 12 June 2020).
- Vincent, E.N.; Yusuf, S.D. Integrating Renewable Energy and Smart Grid Technology into the Nigerian Electricity Grid System. Smart Grid Renew. Energy 2014, 5, 220–238. [Google Scholar] [CrossRef] [Green Version]
- worldometers.info. Nigeria Population (LIVE). 2020. Available online: https://www.worldometers.info/world-population/nigeria-population/ (accessed on 13 May 2020).
- Sambo, A.S. Strategic Developments in Renewable Energy in Nigeria. Int. Assoc. Energy Econonmics 2009, 3, 15–19. [Google Scholar]
- Emodi, N.V.; Yusuf, S.D. Improving electricity access in Nigeria: Obstacles and the way forward. Int. J. Energy Econ. Policy 2015, 5, 335–351. [Google Scholar]
- PHCN. Daily Operational Report; PHCN: Phoenix, AZ, USA, 2009. [Google Scholar]
- Samuel, I.; Katende, J.; Daramola, S.A.; Awelewa, A. Review of System Collapse Incidences on the 330-kV Nigerian National Grid. Int. J. Eng. Sci. Invent. 2014, 3, 55–59. [Google Scholar]
- Mac-Leva, F.; Sunday, S.E. Nigeria’s Power Grid Records 206 Collapses in 9 Years as Foreign Funded Investment Hits N715bn’, ICIR, 20 October 2019. Available online: https://www.icirnigeria.org/nigerias-power-grid-records-206-collapses-in-9-years-as-foreign-funded-investment-hits-n715bn/ (accessed on 18 July 2020).
- Vanguard. Power: Nigeria Records 123 System Collapses in 7 yrs, 6 February 2020. Available online: https://www.vanguardngr.com/2020/02/power-nigeria-records-123-system-collapses-in-7-yrs/ (accessed on 11 May 2020).
- Adekoya, F.; Jeremiah, K. Weaning Consumers of Generator Addiction without Fixing Lingering Power Issues, Saturday Magazine, April 2020. Available online: https://guardian.ng/saturday-magazine/cover/weaning-consumers-of-generator-addiction-without-fixing-lingering-power-issues/ (accessed on 4 June 2020).
- Eweka, E. (Civil, Environmental & Geomatic Engineering, University College London, Gower St., London, UK). Personal Images, 2020. [Google Scholar]
- Ebii, C. Can Nigeria Meet Its Electricity Goals by 2030? We found out. Heinrich Böll Stiftung, 11 October 2019. Available online: https://ng.boell.org/en/2019/10/11/can-nigeria-meet-its-electricity-goals-2030-we-found-out (accessed on 6 May 2020).
- YorPower. Generators Power Nigeria, 24 September 2019. Available online: https://www.yorpower.com/generator-news/generators-powering-nigeria/ (accessed on 12 May 2020).
- Ikhuosho-Asikhia, J. Effect of Generator Usage on Small Scale Businesses in Nigeria. Bachelor’s Thesis, Tampere University of Applied Sciences, Tampere, Finland, 2014. [Google Scholar]
- Osagie, I.; Ibhadode, P.; Okougha, A.; Umanah, I.; Aitanke, F.; Fiyebo, S. Hazards Assessment Analyses of Fossil-fuel Generators: Holistic-study of Human Experiences and Perceptions in South-Southern Nigeria. J. Sustain. Dev. Stud. 2016, 9, 153–242. [Google Scholar]
- Dalberg. Putting an End to Nigeria’s Generator Crisis: The Path Forward. Access to Energy Insitute, Berlin, Germany. 2019. Available online: https://a2ei.org/resources/uploads/2019/06/A2EI_Dalberg_Putting_an_End_to_Nigeria%E2%80%99s_Generator-Crisis_The_Path_Forward.pdf (accessed on 12 May 2020).
- Ochieng, A. Nigeria’s Generator Addiction Is an Opportunity in Disguise. emerge85. 2017. Available online: https://emerge85.io/Insights/nigerias-generator-addiction-is-an-opportunity-in-disguise/ (accessed on 4 April 2020).
- GIZ. The Nigerian Energy Sector. 2015. Available online: https://www.giz.de/en/downloads/giz2015-en-nigerian-energy-sector.pdf (accessed on 13 May 2020).
- Google Maps. “Image of Nigeria”. Available online: https://goo.gl/maps/v5aXg4DRMu9PBd477 (accessed on 9 June 2022).
- 49. International Hydropower Association (IHA). Hydropower Status Report 2019; International Hydropower Association: London, UK, 2019; pp. 1–83. [Google Scholar]
- GET.invest. Nigeria—Renewable Energy Potential. Available online: https://www.get-invest.eu/market-information/nigeria/renewable-energy-potential/ (accessed on 5 June 2020).
- The World Bank. Electricity Production from Hydroelectric Sources (% of Total)’. 2014. Available online: https://data.worldbank.org/indicator/EG.ELC.HYRO.ZS (accessed on 13 May 2020).
- Ogunleye, E.K. Political Economy of Nigerian Power Sector Reform. Helsinki. 2016. Available online: https://www.wider.unu.edu/publication/political-economy-nigerian-power-sector-reform (accessed on 6 April 2020).
- thisiseco. The Difference between Biomass and Biogas. 2020. Available online: https://www.thisiseco.co.uk/news_and_blog/the-difference-between-biomass-and-biogas.html (accessed on 17 April 2020).
- Olaoye, T.; Ajilore, T.; Akinluwade, K.; Omole, F.; Adetunji, A. Energy Crisis in Nigeria: Need for Renewable Energy Mix. Am. J. Electr. Electron. Eng. 2016, 4, 1–8. [Google Scholar] [CrossRef]
- Simonyan, K.J. Biomass resources and bioenergy potentials in Nigeria. Afr. J. Agric. Res. 2013, 8, 4975–4989. [Google Scholar] [CrossRef]
- RECP. Captive Power in Nigeria. 2015. Available online: https://www.get-invest.eu/wp-content/uploads/2019/06/RECP-Market-Study_Captive-Power_Nigeria_2016.pdf (accessed on 6 June 2020).
- FAO. Crops. Food and Agriculture Organisation of the United Nations. 2020. Available online: http://www.fao.org/faostat/en/#data/QC (accessed on 3 May 2020).
- Suleiman, S.; Idris, M.B. Biomass Consumption in Nigeria: Trends and Policy Issues. J. Agric. Sustain. 2016, 9, 127–157. Available online: http://infinitypress.info/index.php/jas/article/viewFile/1316/593 (accessed on 12 May 2020).
- Brown, V.J. Biogas: A bright idea for Africa. Environ. Health Perspect. 2006, 114, 300–303. [Google Scholar] [CrossRef] [Green Version]
- Akinbami, J.-F.; Ilori, M.; Oyebisi, T.; Akinwumi, I.; Adeoti, O. Biogas energy use in Nigeria: Current status, future prospects and policy implications. Renew. Sustain. Energy Rev. 2021, 5, 97–112. [Google Scholar] [CrossRef]
- Adeoti, O.; Ayelegun, T.A.; Osho, S.O. Nigeria biogas potential from livestock manure and its estimated climate value. Renew. Sustain. Energy Rev. 2014, 37, 243–248. [Google Scholar] [CrossRef]
- Ozor, O.C.; Agah, M.V.; Ogbu, K.I.; Nnachi, A.U.; Udu-ibiam, O.E.; Agwu, M.M. Biogas Production Using Cow Dung from Abakaliki Abattoir in South-Eastern Nigeria. Int. J. Sci. Technol. Res. 2014, 3, 237–239. [Google Scholar]
- Odekanle, E.L.; Odejobi, O.; Dahunsi, S.; Akeredolu, F. Potential for cleaner energy recovery and electricity generation from abattoir wastes in Nigeria. Energy Rep. 2020, 6, 1262–1267. [Google Scholar] [CrossRef]
- Bazilian, M. LCOE and Its Limitations What Is the Levelized Cost of Electricity? Energy for Growth Hub: Washington, DC, USA, 2020; pp. 2020–2023. [Google Scholar]
- Ritchie, H.; Roser, M.; Energy. Our World in Data. 2014. Available online: https://ourworldindata.org/energy (accessed on 11 April 2020).
- Power for All. Mini-Grids Costs Can Be Reduced by 60% by 2030. 2016, pp. 1–2. Available online: https://www.powerforall.org/application/files/4415/6700/7650/FS__Mini-grids_costs_can_be_reduced_by_60_by_2030.pdf (accessed on 3 May 2020).
- Roche, M.; Ude, N.; Donald-Ofoegbu, I. True Cost of Electricity: Comparison of Costs of Electricity Generation in Nigeria. Nigerian Economic Summit Group and Heinrich Böll Stiftung Nigeria. 2017, pp. 1–34. Available online: https://ng.boell.org/sites/default/files/true_cost_of_power_technical_report_final.pdf (accessed on 8 June 2020).
- Ulor, E. Nigeria: 100% Renewable Energy Is Possible. 2017. Available online: https://www.energymixreport.com/nigeria-100-renewable-energy-is-possible/ (accessed on 8 April 2020).
- Odoi-Yorke, F. Design of Solar Pv-Biogas Hybrid Power System for Rural Electrification in Ghana. Master’s Thesis, Pan African University, Yaoundé, Cameroun, 2018. [Google Scholar]
- Nwozor, A.; Oshewolo, S.; Owoeye, G.; Okidu, O. Nigeria’s Quest For Alternative Clean Energy Development: A Cobweb Of Opportunities, Pitfalls And Multiple Dilemmas. Energy Policy 2021, 149, 112070. [Google Scholar] [CrossRef]
- Mini-grids. Wikipedia. 2019. Available online: https://en.wikipedia.org/wiki/Mini-grids#cite_note-20 (accessed on 11 May 2020).
- UNFCCC. Cows to Kilowatts—Anaerobic Bio-Digestion of Abattoir Waste Generates Zero Emission and Creates Sustainable Bio-Energy and Bio-Fertiliser in Africa, United Nations Framework Convention on Climate Change. Available online: https://unfccc.int/climate-action/momentum-for-change/activity-database/momentum-for-change-cows-to-kilowatts-anaerobic-bio-digestion-of-abattoir-waste-generates-zero-emission-and-creates-sustainable-bio-energy-and-bio-fertiliser-in-africa (accessed on 12 May 2020).
- Innovation for Sustainable Development. Cows to Kilowatts, Nigeria: Turning Waste into Energy and Fertiliser. Prot. Ecosyst. 2015, 34–37.
- Sanni, S.; Ibrahim, M.; Mahmud, I.; Oyewole, T.; Olusuyi, K. Potential of Off-grid Solar PV/Biogas power generation system: Case study of Ado Ekiti slaughterhouse. Int. J. Renew. Energy Res. 2019, 9, 1309–1318. [Google Scholar]
- Energypedia.info. Nigeria Energy Situation. 2019. Available online: https://energypedia.info/wiki/Nigeria_Energy_Situation (accessed on 6 April 2020).
- Yimen, N.; Hamandjoda, O.; Meva’A, L.; Ndzana, B.; Nganhou, J. Analyzing of a photovoltaic/wind/biogas/pumped-hydro off-grid hybrid system for rural electrification in Sub-Saharan Africa—Case study of Djoundé in Northern Cameroon. Energies 2018, 11, 2644. [Google Scholar] [CrossRef] [Green Version]
- Adedeji, A.A. Spatial Exploration And Analysis Of Electricity Poverty: A Case Study of Ibadan, Southwestern, Nigeria. Ph.D. Thesis, University of Leicester, Leicester, UK, 11 March 2016. [Google Scholar]
- Waheed, M.A. Assessment of Household Energy Utilization in Ibadan, Southwestern Nigeria. 2012. Available online: https://www.researchgate.net/publication/259198034_Assessment_of_household_energy_utilization_in_Ibadan_southwest_nigeria (accessed on 8 April 2020).
- Nwofe, P.A. Utilization of Solar and Biomass Energy—A Panacea to Energy Sustainability in a Developing Economy. Int. J. Energy Environ. Res. 2014, 2, 10–19. [Google Scholar]
- Agbo, E.; Edet, C.; Magu, T.; Njok, A.; Ekpo, C.; Louis, H. Solar Energy: A Panacea for the Electricity Generation Crisis in Nigeria. Heliyon 2021, 7, e07016. [Google Scholar] [CrossRef]
- Ibrahim, I.D.; Hamam, Y.; Alayli, Y.; Jamiru, T.; Sadiku, E.R.; Kupolati, W.K.; Ndambuki, J.M.; Eze, A.A. A Review on Africa Energy Supply through Renewable Energy Production: Nigeria, Cameroon, Ghana and South Africa as a Case Study. Energy Strategy Rev. 2021, 38, 100740. [Google Scholar] [CrossRef]
- Adedayo, H.; Adio, S.; Oboirien, B. Energy Research In Nigeria: A Bibliometric Analysis. Energy Strategy Rev. 2021, 34, 100629. [Google Scholar] [CrossRef]
- Ndukwe, E.; Chiemelu Obinna, C.D.; Anejionu Raphael, I.; Ndukwu Francis, I. Okeke, Assessing the potentials of largescale generation of solar energy in Eastern Nigeria with geospatial technologies. Sci. Afr. 2021, 12, e00771. [Google Scholar] [CrossRef]
- Ozoegwu, C.G.; Akpan, P.U.-O. Solar Energy Policy Directions for Safer and Cleaner Development in Nigeria. Energy Policy 2021, 150, 112141. [Google Scholar] [CrossRef]
- Adeyemi-Kayode, T.M.; Misra, S.; Damaševičius, R. Impact Analysis of Renewable Energy Based Generation in West Africa—A case study of Nigeria. Probl. Ekorozw. 2021, 16, 67–78. [Google Scholar] [CrossRef]
- Abdullahi, D.; Renukappa, S.; Suresh, S.; Oloke, D. Barriers for implementing solar energy initiatives in Nigeria: An empirical study. Smart Sustain. Built Environ. 2021. ahead-of-print. [Google Scholar] [CrossRef]
- Ugwu, J.; Odo, K.C.; Oluka, L.O.; Salami, K.O. A Systematic Review on the Renewable Energy Development, Policies and Challenges in Nigeria with an International Perspective and Public Opinions. Int. J. Renew. Energy Dev. 2022, 11, 287–308. [Google Scholar] [CrossRef]
- Olujobi, O.; Ufua, D.; Okorie, U.; Ogbari, M. Carbon emission, solid waste management, and electricity generation: A legal and empirical perspective for renewable energy in Nigeria. Int. Environ. Agreem. Politics Law Econ. 2022. [Google Scholar] [CrossRef]
- Ugwu, C.O.; Ozor, P.A.; Mbohwa, C. Small Hydropower as a Source of Clean and Local Energy in Nigeria: Prospects and Challenges. Fuel Commun. 2022, 10, 100046. [Google Scholar] [CrossRef]
- Garba, N.; Özveren, C.S.; Blackwood, D.; Adamu, A.; Augie, A.I. Sustainable Energy Policy For Africa (Nigeria) And Europe: A Comparative Study. Int. J. Energy Environ. Eng. 2022, 16, 30–36.77. [Google Scholar]
- Olujobi, O.; Ufua, D.; Olokundun, M.; Olujobi, O. Conversion of organic wastes to electricity in Nigeria: Legal perspective on the challenges and prospects. Int. J. Environ. Sci. Technol. 2021, 19, 939–950. [Google Scholar] [CrossRef]
- Adekanye, T.; Oni, K.C. Comparative Energy Use in Cassava Production under Different Farming Technologies in Kwara State of Nigeria. Environ. Sustain. Indic. 2022, 14, 100173. [Google Scholar] [CrossRef]
- Ajayi, O.O.; Mokryani, G.; Edun, B.M. Sustainable Energy for National Climate Change, Food Security and Employment Opportunities: Implications for Nigeria. Fuel Commun. 2022, 10, 100045. [Google Scholar] [CrossRef]
- Heinemann, G.; Banzer, F.; Dumitrescu, R.; Hirschhausen, C.V.; Neuhoff, M.E.; Nwadiaru, V.O. Transforming Electricity Access by Replacing Back-Up Generators with Solar Systems: Recent Trends and Evidence from Nigeria. Renew. Sustain. Energy Rev. 2022, 157, 111751. [Google Scholar] [CrossRef]
- Olukan, T.A.; Santos, S.; Al Ghaferi, A.A.; Chiesa, M. Development of a Solar Nano-Grid for Meeting the Electricity Supply Shortage in Developing Countries (Nigeria as a Case Study). Renew. Energy 2021, 181, 640–652. [Google Scholar] [CrossRef]
- NERC. Notice of Review of the Multi Year Tariff Order (MYTO] Methodology, Nigerian Electrcity Regulatory Company. 2017. Available online: https://nerc.gov.ng/index.php/media-library/public-notices/511-notice-of-review-of-the-multi-year-tariff-order-myto-methodology-2017 (accessed on 4 June 2020).
- KPMG. Nigeria’s Electricity Supply Industry Highlights. 2019. Available online: https://assets.kpmg/content/dam/kpmg/ng/pdf/audit/Nigeria-Electricity-Supply.pdf (accessed on 11 May 2020).
- Chibueze, J.; Sadare, E. Electricity Regulation in Nigeria: Overview. Available online: https://uk.practicallaw.thomsonreuters.com/7-584-2605?__lrTS=20180131220013813&transitionType=Default&contextData=(sc.Default]&firstPage=true&bhcp=1 (accessed on 27 May 2020).
- Synergent. Current Projects. Available online: http://nigeria.synergent.us/site/projects_current.htm (accessed on 16 May 2020).
- JCM Power. Katsina, Nigeria. 2018. Available online: https://jcmpower.ca/katsina-nigeria/ (accessed on 7 May 2020).
- Nigeria Solar Capital Partners. Projects. 2016. Available online: http://www.nigeriasolarcapitalpartners.com/projects/ (accessed on 25 May 2020).
- Yahya, H.; Sambo, A. Solar Photovoltaic-Powered Village Electrification at Kwalkwalawa in Sokoto State. Renew. Energy 1995, 6, 307–309. [Google Scholar] [CrossRef]
- Ilenikhena, P.; Ezemonye, L. Solar Energy Applications in Nigeria. WEC Montr. 2010, 9, 76–99. [Google Scholar]
- Oresanya, O. Lagos: Integrated Waste Management Plant. 2013. Available online: https://issuu.com/siemens_the_crystal/docs/lagos (accessed on 12 June 2020).
- GVE. GVE Projects. 2019. Available online: https://gve-group.com/portfolio/angwan-rina-demshin-community-electrification-project/ (accessed on 19 May 2020).
- GVE Projects LTD. Electrification of Two (2] Villages; Angwan Rina & Demshin, Plateau State with PV Solar-Hybrid Mini-Grids. 2017, pp. 1–8. Available online: https://cleanenergysolutions.org/sites/default/files/documents/orajaka-presenter-slides-unf-mini-grids-in_-igeria.pdf (accessed on 18 April 2020).
- Yakubu, A.; Ayandele, E.; Sherwood, J.; Olu, O.A.; Graber, S. Mini-Grid Investment Report; The Nigerian Economic Summit Group (NESG]: Ikoyi, Nigeria, 2018. [Google Scholar]
- African Development Bank Group & Green Mini-Grid Market Development. Mini-Grid Market Opportunity Assessment: Nigeria; African Development Bank Group & Green Mini-Grid Market Development: Abidjan, Ivory Coast, 2018. [Google Scholar]
- ESMAP. Mini Grids in Nigeria: A Case Study of a Promising Market. Energy Sector Management Assistance Program. 2017. Available online: https://openknowledge.worldbank.org/handle/10986/29016 (accessed on 23 April 2020).
- Nayo Tropical Technology Ltd. Mini-Grid Utilities. 2020. Available online: https://www.nayotechnology.com/mini-grid-utilities (accessed on 16 May 2020).
- Nigeria Electricity Hub. Cross River Communities Receive Power from Solar Mini-Grid Facility, Energy Mix Report. 2018. Available online: https://www.nigeriaelectricityhub.com/2018/04/30/cross-river-communities-receive-power-from-solar-mini-grid-facility/ (accessed on 14 May 2020).
- Burger, A. World Bank Looks Forward to Nigerian Minigrid Boom. Microgrid Knowledge. 30 October 2019. Available online: https://microgridknowledge.com/nigeria-minigrid/ (accessed on 8 April 2020).
- Khan, J.; Arsalan, M.H. Solar power technologies for sustainable electricity generation—A review. Renew. Sustain. Energy Rev. 2016, 55, 414–425. [Google Scholar] [CrossRef]
- Fedkin, M. Types of PV Technology and Recent Innovations, John A. Dutton e-Education Institute. 2020. Available online: https://www.e-education.psu.edu/eme812/node/608 (accessed on 12 May 2020).
- Akinbomi, J.; Brandberg, T.; Sanni, S.A.; Taherzadeh, M.J. Development and Dissemination Strategies for Accelerating Biogas Production in Nigeria. BioResources 2014, 9, 5707–5737. [Google Scholar]
- IRENA. Renewable Mini-Grids. 2019. Available online: https://www.irena.org/-/media/Files/IRENA/Agency/Publication/2019/Sep/IRENA_Renewable_mini-grids_2019.pdf (accessed on 24 June 2020).
- Energypedia.info. Mini-Grid Operation Models. 2018. Available online: https://energypedia.info/wiki/Mini-grid_Operation_Models (accessed on 8 April 2020).
Figure 1.
Literature review methodology flowchart.

Figure 2.
Three key drivers of global energy demand. Source: Modified from [17].
Figure 2.
Three key drivers of global energy demand. Source: Modified from [17].

Figure 3.
The total system collapse incidents in Nigeria between 2000 and 2019. (Data from Table 3).
Figure 3.
The total system collapse incidents in Nigeria between 2000 and 2019. (Data from Table 3).

Figure 4.
Domestic diesel generator in a home-Lagos, Nigeria (plan view). Source: [41].
Figure 4.
Domestic diesel generator in a home-Lagos, Nigeria (plan view). Source: [41].

Figure 5.
Power generating set in a home—Lagos, Nigeria. Source: [41].
Figure 5.
Power generating set in a home—Lagos, Nigeria. Source: [41].

Figure 6.
Map of Nigeria (plan view). Source: [49].
Figure 6.
Map of Nigeria (plan view). Source: [49].


Table 1.
Energy demand projections for Nigeria. (Data taken from: [16].
Table 1.
Energy demand projections for Nigeria. (Data taken from: [16].
| Electricity Demand Projections Per Scenario (MW) | |||||
|---|---|---|---|---|---|
| Scenario (GDP Growth %) | 2010 | 2015 | 2020 | 2025 | 2030 |
| Reference (7%) | 15,730 | 28,360 | 50,820 | 77,450 | 119,200 |
| High Growth (10%) | 15,920 | 30,210 | 58,180 | 107,220 | 192,000 |
| Optimistic 1 (11.5%) | 16,000 | 31,240 | 70,760 | 137,370 | 250,000 |
| Optimistic 2 (13%) | 33,250 | 64,200 | 107,600 | 172,900 | 297,900 |
Table 2.
Environmental Impacts of Fossil Fuels In Nigeria.
| Resource | Description/Information | Environmental Impact | Carbon Dioxide (LB/Million BTU) | Ref |
|---|---|---|---|---|
| Natural Gas | The mining of natural gas has the potential to leak vast amounts of methane (which is 34 times stronger than carbon dioxide) into the environment. | 117 | [23,24,25,26,27,28] | |
| Oil |
| Plenty of energy is needed to produce and refine the oil. Pipeline oil spills also result in land, water and air pollution. Burning the oil afterward also adds to emissions. | 164 | [24,27] |
| Coal |
| Due to their light-absorbing qualities, black carbon has harmful effects on the environment. | 208 | [23,24,25,27,30] |
Table 3.
Total System Collapses, 2000–2019.
| Year | Partial Collapse | Total Collapse | Total System Collapse | Ref |
|---|---|---|---|---|
| 2000 | 6 | 5 | 11 | [36,37] |
| 2001 | 5 | 14 | 19 | [36,37] |
| 2002 | 32 | 9 | 41 | [36,37] |
| 2003 | 39 | 14 | 53 | [36,37] |
| 2004 | 30 | 22 | 52 | [36,37] |
| 2005 | 15 | 21 | 36 | [36,37] |
| 2006 | 10 | 20 | 30 | [36,37] |
| 2007 | 8 | 18 | 27 | [36,37] |
| 2008 | 16 | 26 | 42 | [36,37] |
| 2009 | 20 | 19 | 39 | [36,37] |
| 2010 | 20 | 22 | 42 | [38] |
| 2011 | 6 | 13 | 19 | [38] |
| 2012 | 8 | 16 | 24 | [38] |
| 2013 | 2 | 22 | 24 | [38] |
| 2014 | 4 | 9 | 13 | [38,39] |
| 2015 | 4 | 6 | 10 | [38,39] |
| 2016 | 6 | 22 | 28 | [38,39] |
| 2017 | 9 | 15 | 24 | [38,39] |
| 2018 | 1 | 12 | 13 | [38,39] |
| 2019 | - | - | 11 | [39] |
Table 4.
Renewable energy potential. Data taken from [48].
Table 4.
Renewable energy potential. Data taken from [48].
| Resource | Potential | Current Utilisation |
|---|---|---|
| Wind | 2–4 m/s ( 10 m height mainland) | N/A |
| Small Hydropower | 3500 MW | 64.2 MW |
| Large Hydropower | 11,250 MW | 1900 MW |
| Solar | 4–6.5 kWh/m2.day | 15 MW (dispersed solar PV) |
| Biomass | Municipal Waste | 0.5 kg/capita.day |
| Energy Crops | 28.2 million hectares of arable land (8.5% cultivated) | |
| Fuel Wood | 43.4 million tonnes/year (consumption) | |
| Agricultural Residues | 91.4 million tonnes/year (produced) | |
| Animal Waste | 245 million (assorted animals in 2001) |
Table 5.
Bioenergy potential, Nigeria (2013). Data taken from [56].
Table 5.
Bioenergy potential, Nigeria (2013). Data taken from [56].
| Source | Bioenergy Potential (GJ/Year) |
|---|---|
| Municipal Solid Waste | 186 |
| Energy Crops | 1700 × 106 |
| Forestry and Wood Residues | 18 × 10−3 |
| Agricultural Crop Residues | 604 × 106 |
| Human Waste | 8 |
| Animal Waste | 29 |
| Food and Feed Processing Waste | Limited |
| TOTAL | 2.3 × 10⁹ |
Table 6.
Residue estimates from agricultural crops in Nigeria (2010). Data taken from [48].
Table 6.
Residue estimates from agricultural crops in Nigeria (2010). Data taken from [48].
| Crop | Production (000t) | Component | Weigh Available in Million Tons | Total Energy Available (PJ) | Total Energy Available (GW) |
|---|---|---|---|---|---|
| Rice | 3368.24 | Straw | 7.86 | 125.92 | 34,977.8 |
| Husk | 1.19 | 23 | 6388.9 | ||
| Maize | 7676.85 | Stalk | 10.75 | 211.35 | 58,708.3 |
| Cob | 2.1 | 34.19 | 9497.2 | ||
| Husk | 0.92 | 14.32 | 3977.8 | ||
| Cassava | 42,533.17 | Stalks | 17.01 | 297.68 | 82,688.9 |
| Peelings | 76.56 | 812.3 | 225,638.9 | ||
| Groundnut | 3799.25 | Shells | 1.81 | 28.35 | 7875 |
| Straw | 4.37 | 76.83 | 21,341.7 | ||
| Soybean | 365.06 | Straw | 0.91 | 11.27 | 3130.6 |
| Pods | 0.37 | 4.58 | 1272.2 | ||
| Sugar Cane | 481.51 | Bagasse | 0.11 | 1.99 | 552.8 |
| Tops/Leaves | 0.14 | 2.21 | 613.9 | ||
| Cotton | 602.44 | Stalk | 2.25 | 41.87 | 11,630.6 |
| Millet | 5170.45 | Straw | 7.24 | 89.63 | 24,897.2 |
| Sorghum | 7140.96 | Straw | 7.14 | 88.39 | 24,552.8 |
| Cowpea | 3368.24 | Shell | 4.89 | 95.06 | 26,405.6 |
| Total | 145.62 | 1958.94 | 544,150.2 |
Table 7.
Crop production, 2010 vs. 2018. Data taken from [58].
Table 7.
Crop production, 2010 vs. 2018. Data taken from [58].
| Crop | Production (000 t) | Difference (%) | |
|---|---|---|---|
| 2010 | 2018 | ||
| Rice (paddy) | 4472.52 * | 6809.33 | +52.2% |
| Maize | 7676.85 | 10,155.03 | +32.3% |
| Cassava | 42,533.17 | 59,475.20 | +39.8% |
| Groundnut | 3799.25 | 2886.99 | –24% |
| Soybean | 365.06 | 758.03 | +107.7% |
| Sugarcane | 849.90 * | 1423.09 | +67.4% |
| Cotton | 602.44 | 270.53 | –55.1% |
| Millet | 5170.45 | 2240.74 | –56.7% |
| Sorghum | 7140.96 | 6862.34 | –3.9% |
| Cowpea | 3368.24 | 2606.91 | –22.6% |
| TOTAL | 75,978.84 | 93,488.19 | +23% |
* Figures differ from numbers given in the Simonyan (2013) study [56].
Table 8.
Animal waste production and its potential for biogas in Nigeria (2010). Data taken from [56].
Table 8.
Animal waste production and its potential for biogas in Nigeria (2010). Data taken from [56].
| Type | Population | Dry Matter Production Kg/Head/Day * | Amount of Dry Matter Produced Per Year Kg | Biogas Yield | |||
|---|---|---|---|---|---|---|---|
| Fraction Recoverable | Amount of Dry Matter Available Per Year Kg (×109) | m3/kg Dry Matter ** | Total Potential m3/Year (×109) | ||||
| Cattle | 18,871,339 | 2.86 | 1.970 × 10¹⁰ | 0.3 | 5.91 | 0.2 | 1.182 |
| Goat | 65,651,252 | 0.552 | 1.323 × 10¹⁰ | 0.4 | 5.292 | 0.25 | 1.323 |
| Pig | 6,040,820 | 0.66 | 1.457 × 10⁹ | 1 | 1.457 | 0.56 | 0.815 |
| Sheep | 37,422,554 | 0.329 | 4.493 × 10⁹ | 0.3 | 1.348 | 0.25 | 0.337 |
| Chicken | 101,676,710 | 0.043 | 1.596 × 10⁹ | 1 | 1.596 | 0.28 | 0.447 |
| Duck | 9,553,911 | 0.05 | 0.177 × 10⁹ | 0.9 | 0.159 | 0.56 | 0.089 |
| Total | 15.762 | 4.193 | |||||
* Daily dry matter production per cow. ** Dry matter density.
Table 9.
Gas yield increase with mixed waste (40-day retention time). Data taken from [61].
Table 9.
Gas yield increase with mixed waste (40-day retention time). Data taken from [61].
| Wastes | Gas Production (m3/kg) | % Volume |
|---|---|---|
| Cattle | 0.380 | - |
| Pig | 0.569 | - |
| Poultry | 0.617 | - |
| Sewage | 0.265 | - |
| Weeds | 0.277 | - |
| Cattle + Pig (50:50) | 0.510 | +6 |
| Cattle + Sewage (50:50) | 0.407 | +16 |
| Cattle + Weeds (50:50) | 0.363 | +5 |
| Poultry + Sewage (50:50) | 0.413 | +1 |
| Poultry + Weeds (50:50) | 0.495 | +1 |
| Sewage + Weeds (50:50) | 0.387 | +39 |
Table 10.
Grid and off-grid electricity LCOE costs, 2017. Data taken from [68].
Table 10.
Grid and off-grid electricity LCOE costs, 2017. Data taken from [68].
| Technology | LCOE ($/kWh) | |
|---|---|---|
| On-grid | Hydropower | 0.05–0.07 |
| Onshore Wind | 0.09–0.14 | |
| Coal | 0.10 | |
| Solar PV | 0.10–0.11 | |
| Off-grid | Solar PV | 0.20 |
| Diesel Generator | 0.30 | |
| Gasoline Generator | 0.60 | |
Table 11.
Case Studies in Nigeria.
| Case Study | Location | Description | Technology | Generation | Supply | Ref |
|---|---|---|---|---|---|---|
| Cows To Kilowatts Project | Ibadan, Nigeria | The “Cows to Kilowatts” Project aimed to reduce the water pollution levels and greenhouse gas emissions from slaughterhouse waste at the former Bodija Market Abattoir in Ibadan. Approximately 1000 cows were slaughtered per day. This has the potential to provide 1500 cubic metres of biogas which is 900 cubic metres of methane [73]. As a result, almost 5400 cylinders of cooking gas per month are generated. Some of the project sales points were selling the cooking gas to the community (~5400 households) at a lower price point and transforming the sludge produced by the reactor into fertiliser that is used by farmers | 3000 m3 anaerobic fixed-film bioreactor, designed to capture 1800 m3 of methane | 3600 kWh per day | 5400 households | [74]. |
| Potential Of Off-Grid Solar PV/Biogas System | Ado Ekiti, Nigeria | Using an optimal design and techno-economic analysis, a study by Sanni et al. (2019) presents an off-grid solar PV and biogas power generation system for a slaughterhouse in Ado Ekiti, Nigeria. Approximately 25 cows are slaughtered per day, which can yield a biomass supply of 1150 kg/day. The area has an annual average daily radiation of 4.93 kWh/m2/day. The daily load requirement of the facility is 164 kWh. Simulation results from HOMER software present the optimal PV/biogas/battery/converter system | 20 kW PV, 20 kW biogas generator, 15 kW inverter and 16 Trojan IND 17-6 V batteries | n/a | n/a | [75]. |
Publisher’s Note: MDPI stays neutral with regard to jurisdictional claims in published maps and institutional affiliations. |
© 2022 by the authors. Licensee MDPI, Basel, Switzerland. This article is an open access article distributed under the terms and conditions of the Creative Commons Attribution (CC BY) license (https://creativecommons.org/licenses/by/4.0/).
Share and Cite
MDPI and ACS Style
Eweka, E.E.; Lopez-Arroyo, E.; Medupin, C.O.; Oladipo, A.; Campos, L.C. Energy Landscape and Renewable Energy Resources in Nigeria: A Review. Energies 2022, 15, 5514. https://doi.org/10.3390/en15155514
AMA Style
Eweka EE, Lopez-Arroyo E, Medupin CO, Oladipo A, Campos LC. Energy Landscape and Renewable Energy Resources in Nigeria: A Review. Energies. 2022; 15(15):5514. https://doi.org/10.3390/en15155514
Chicago/Turabian StyleEweka, Ebuwa Elisabeth, Enrique Lopez-Arroyo, Christian Oluwaremilekun Medupin, Abiola Oladipo, and Luiza Cintra Campos. 2022. "Energy Landscape and Renewable Energy Resources in Nigeria: A Review" Energies 15, no. 15: 5514. https://doi.org/10.3390/en15155514
Note that from the first issue of 2016, this journal uses article numbers instead of page numbers. See further details here.