
Dietary Intake of Vegan and Non-Vegan Endurance Runners—Results from the NURMI Study (Step 2)

 , ,
, ,  , ,
, ,  and
and 
Abstract
:1. Introduction
2. Materials and Methods
2.1. Study Design
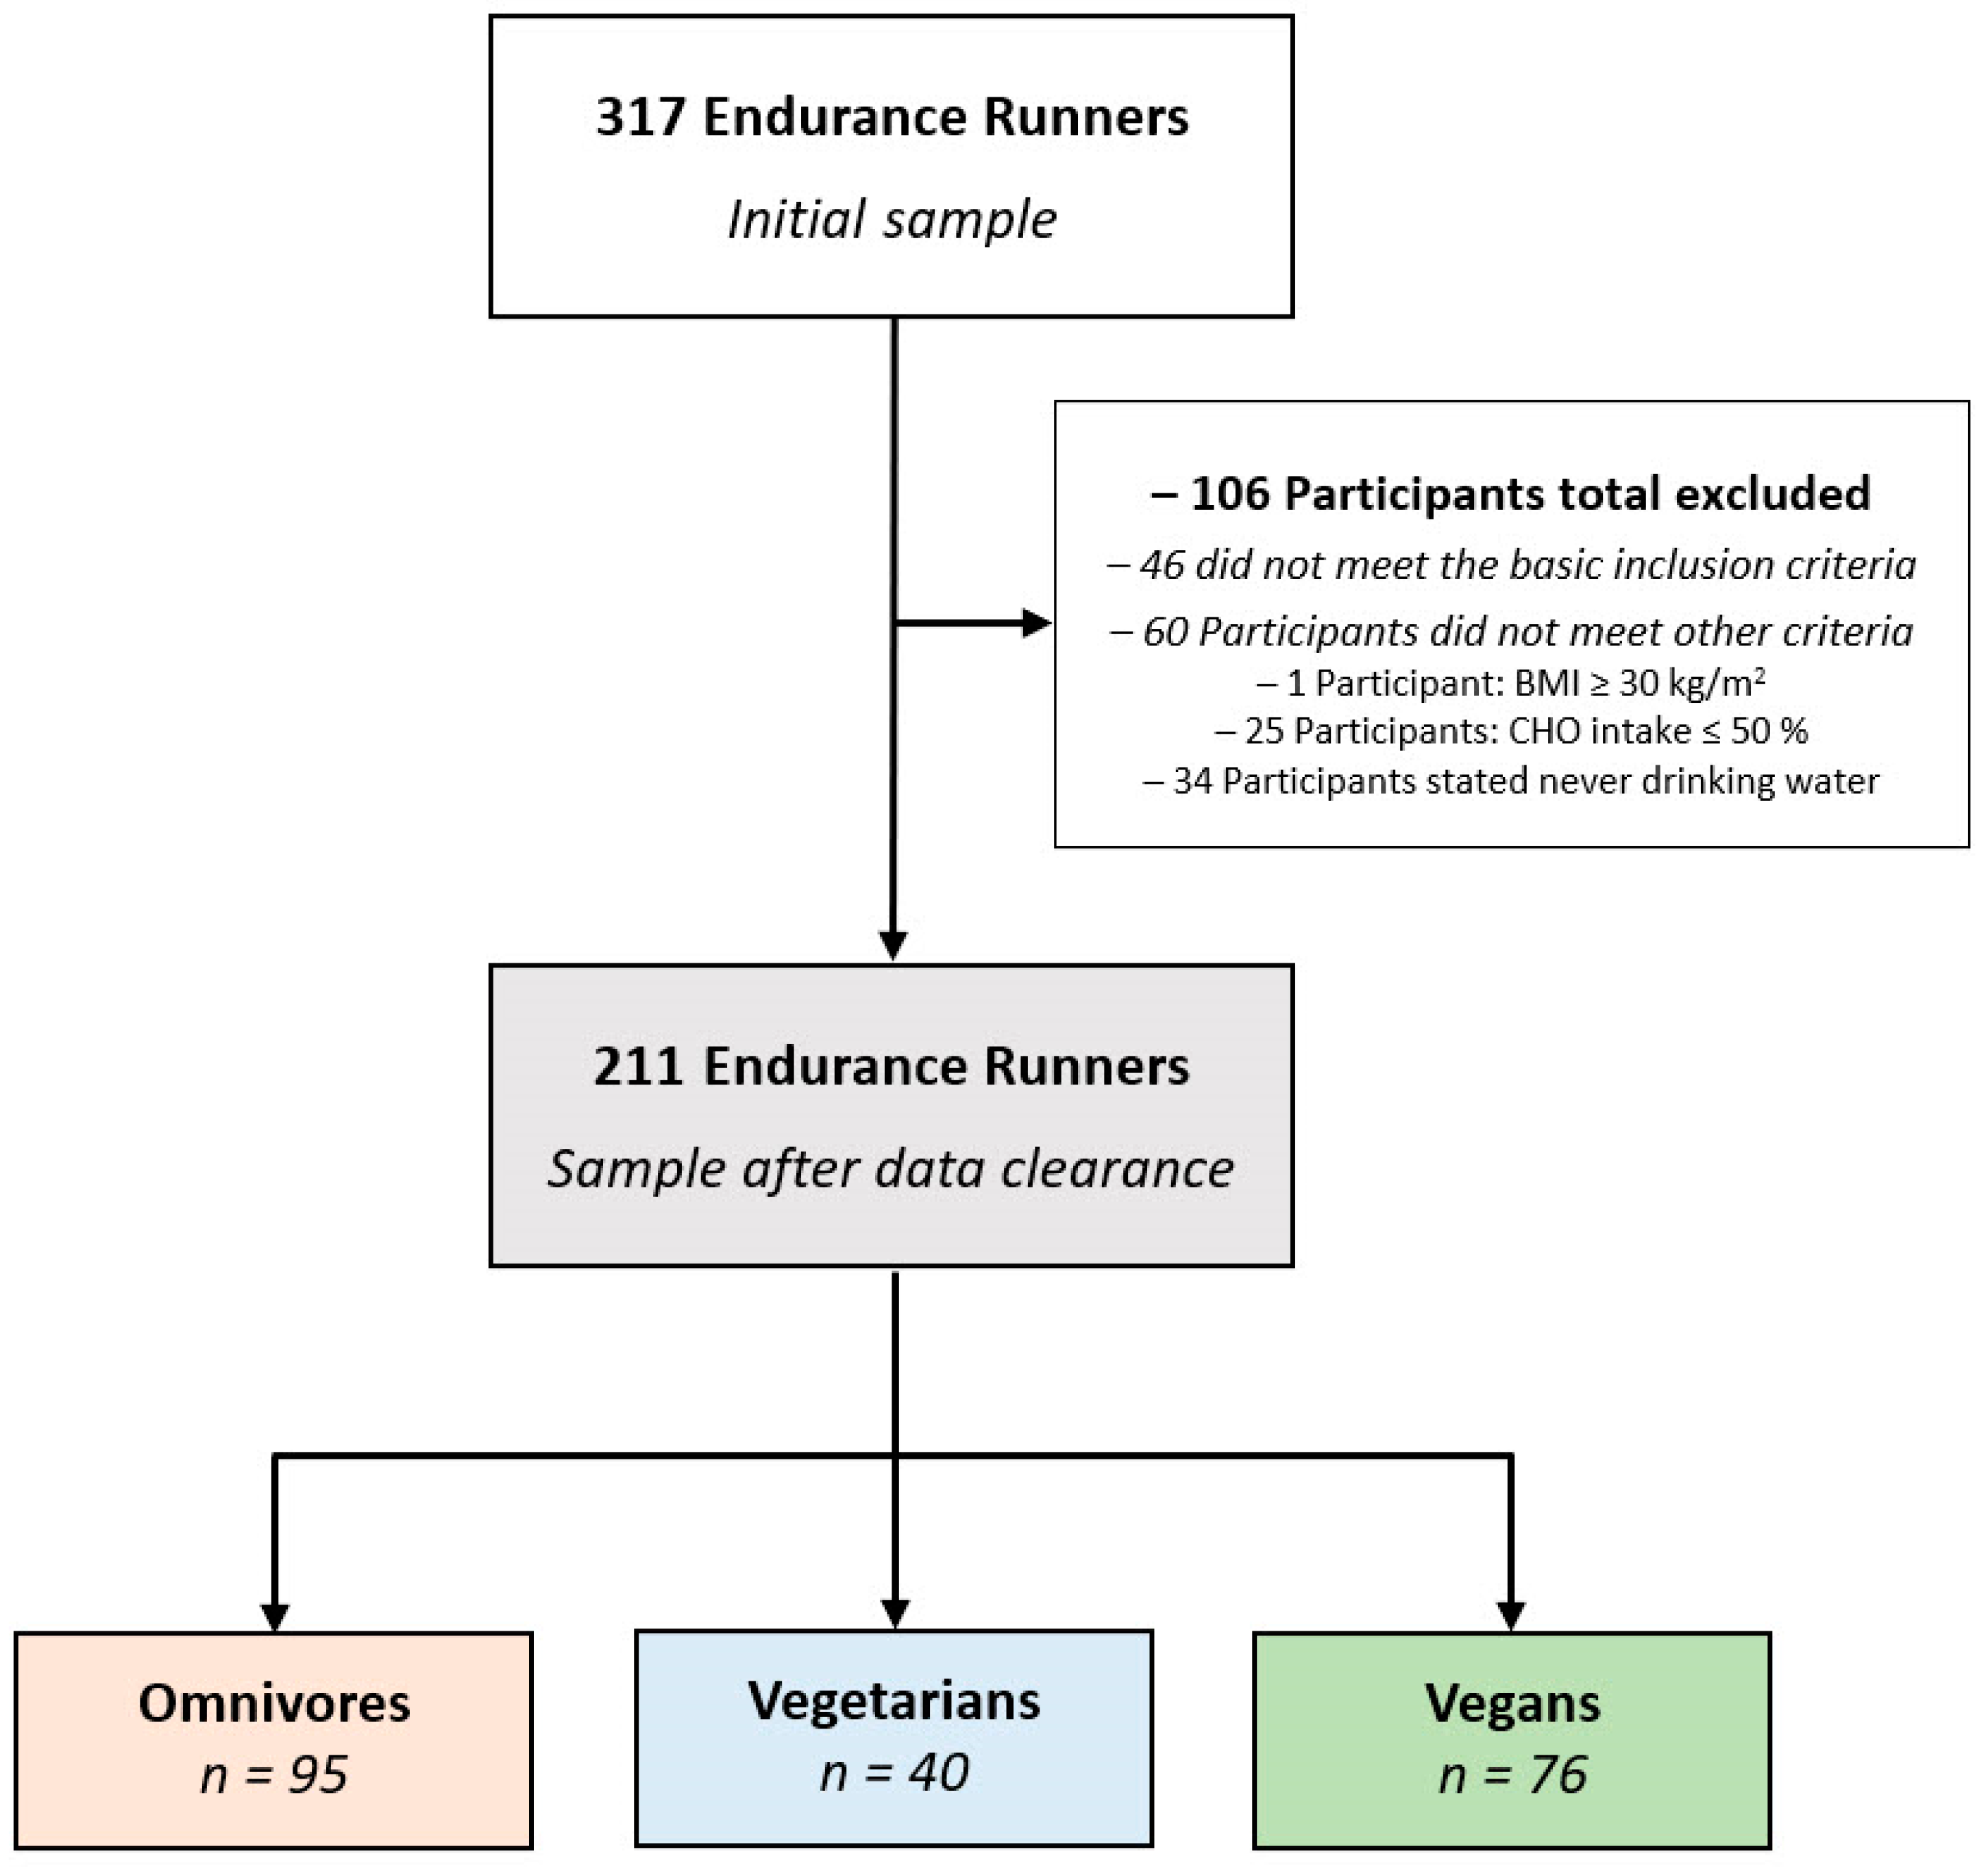
2.2. Study Participants and Experimental Approach
2.3. Data Clearance
2.4. Measures and Analytical Modeling
2.5. Statistical Analysis
3. Results
4. Discussion
5. Conclusions
Author Contributions
Funding
Institutional Review Board Statement
Informed Consent Statement
Data Availability Statement
Acknowledgments
Conflicts of Interest
References
- Wirnitzer, K.C. Vegan diet in sports and exercise–health benefits and advantages to athletes and physically active people: A narrative review. Int. J. Sports Exerc. Med. 2020, 6, 165. [Google Scholar]
- Turner-McGrievy, G.M.; Moore, W.J.; Barr-Anderson, D. The Interconnectedness of diet choice and distance running: Results of the Research Understanding the NutritioN of Endurance Runners (RUNNER) Study. Int. J. Sport Nutr. Exerc. Metab. 2016, 26, 205–211. [Google Scholar] [CrossRef]
- Craig, W.J.; Mangels, A.R. American Dietetic Association. Position of the American Dietetic Association: Vegetarian diets. J. Am. Diet. Assoc. 2009, 109, 1266–1282. [Google Scholar]
- Melina, V.; Craig, W.; Levin, S. Position of the Academy of Nutrition and Dietetics: Vegetarian diets. J. Acad. Nutr. Diet. 2016, 116, 1970–1980. [Google Scholar] [CrossRef] [PubMed]
- Eker, S.; Garcia, D.; Valin, H.; Ruijven, B. Using social media audience data to analyse the drivers of low-carbon diets. Environ. Res. Lett. 2021, 16, 074001. [Google Scholar] [CrossRef]
- Forbes. The Growing Acceptance of Veganism. Available online: https://www.forbes.com/sites/janetforgrieve/2018/11/02/picturing-a-kindler-gentler-world-vegan-month/?sh=3ab6b9332f2b (accessed on 25 July 2022).
- Wirnitzer, K. Nachhaltig gesund—Vegane Ernährung in Bewegung und Sport. Fachz. Beweg. Sport 2021, 3, 27–34. [Google Scholar]
- Bundesministerium für Ernährung und Landwirtschaft (BMEL). Deutschland, Wie Es Isst: Der BMEL-Ernährungsreport. 2021. Available online: https://www.bmel.de/SharedDocs/Downloads/DE/Broschueren/ernaehrungsreport.2021.pdf?__blob=publicationFile&v=5 (accessed on 5 July 2022).
- Scheerder, J.; Breedveld, K.; Borgers, J. Running across Europe: The Rise and Size of One of the Largest Sport Markets, 1st ed.; Palgrave Macmillan: Basingstoke, UK, 2005. [Google Scholar]
- Wilson, P.B. Nutrition behaviors, perceptions, and beliefs of recent marathon finishers. Phys. Sportsmed. 2016, 44, 242–251. [Google Scholar] [CrossRef]
- Kårlund, A.; Gómez-Gallego, C.; Turpeinen, A.M.; Palo-Oja, O.M.; El-Nezami, H.; Kolehmainen, M. Protein supplements and their relation with nutrition, microbiota composition and health: Is more protein always better for sportspeople? Nutrients 2019, 11, 829. [Google Scholar] [CrossRef] [Green Version]
- Black, K.; Slater, J.; Brown, R.C.; Cooke, R. Low energy availability, plasma lipids, and hormonal profiles of recreational athletes. J. Strength Cond. Res. 2018, 32, 2816–2824. [Google Scholar] [CrossRef]
- Meng, K.; Qiu, J.; Benardot, D.; Carr, A.; Yi, L.; Wang, J.; Liang, Y. The risk of low energy availability in Chinese elite and recreational female aesthetic sports. J. Int. Soc. Sports Nutr. 2020, 17, 13. [Google Scholar] [CrossRef] [Green Version]
- Melin, A.K.; Heikura, I.A.; Tenforde, A.; Mountjoy, M. Energy availability in athletics: Health, performance, and physique. Int. J. Sport Nutr. Exerc. Metab. 2019, 29, 152–164. [Google Scholar] [CrossRef] [PubMed] [Green Version]
- Heaney, S.; O’Connor, H.; Michael, S.; Gifford, J.; Naughton, G. Nutrition knowledge in athletes: A systematic review. Int. J. Sport Nutr. Exerc. Metab. 2011, 21, 248–261. [Google Scholar] [CrossRef] [PubMed] [Green Version]
- Bailey, C.P.; Hennessy, E. A review of the ketogenic diet for endurance athletes: Performance enhancer or placebo effect? J. Int. Soc. Sports Nutr. 2020, 17, 33. [Google Scholar] [CrossRef]
- Rogerson, D. Vegan diets: Practical advice for athletes and exercisers. J. Int. Soc. Sports Nutr. 2017, 14, 36. [Google Scholar] [CrossRef] [Green Version]
- Key, T.J.; Appleby, P.N.; Rosell, M.S. Health effects of vegetarian and vegan diets. Proc. Nutr. Soc. 2006, 65, 35–41. [Google Scholar] [CrossRef] [Green Version]
- Rauma, A.L.; Mykkänen, H. Antioxidant status in vegetarians versus omnivores. Nutrition 2000, 16, 111–119. [Google Scholar] [CrossRef]
- Appleby, P.N.; Thorogood, M.; Mann, J.I.; Key, T.J. The Oxford vegetarian study: An overview. Am. J. Clin. Nutr. 1999, 70, 525S–531S. [Google Scholar] [CrossRef]
- Clarys, P.; Deliens, T.; Huybrechts, I.; Deriemaeker, P.; Vanaelst, B.; De Keyzer, W.; Hebbelinck, M.; Mullie, P. Comparison of Nutritional Quality of the Vegan, Vegetarian, Semi-Vegetarian, Pesco-Vegetarian and Omnivorous Diet. Nutrients 2014, 6, 1318–1332. [Google Scholar] [CrossRef] [PubMed]
- Leitzmann, C.; Keller, M. Vegetarische und Vegane Ernährung. 4., Vollständig Überarbeitete und Erweiterte Auflage; UTB: Stuttgart, Germany, 2020. [Google Scholar]
- Ha, B. The power of plants: Is a whole-foods, plant-based diet the answer to health, health care, and physician wellness? Perm. J. 2019, 23, 19-003. [Google Scholar] [CrossRef] [PubMed] [Green Version]
- Leitzmann, C. Vegetarian diets: What are the advantages? Forum. Nutr. 2005, 57, 147–156. [Google Scholar]
- McDougall, C.; McDougall, J. Plant-based diets are not nutritionally deficient. Perm. J. 2013, 17, 93. [Google Scholar] [CrossRef] [PubMed] [Green Version]
- Eisinger, M.; Plath, M.; Jung, K.; Leitzmann, C. Nutrient intake of endurance runners with ovo-lacto-vegetarian diet and regular western diet. Z Ernahr. 1994, 33, 217–229. [Google Scholar] [CrossRef] [PubMed]
- Wirnitzer, K.; Motevalli, M.; Tanous, D.R.; Gregori, M.; Wirnitzer, G.; Leitzmann, C.; Hill, L.; Rosemann, T.; Knechtle, B. Supplement intake in vegan, vegetarian, and omnivorous endurance runners—Results from the NURMI Study (Step 2). Nutrients 2021, 13, 2741. [Google Scholar] [CrossRef] [PubMed]
- Wirnitzer, K.; Boldt, P.; Lechleitner, C.; Wirnitzer, G.; Leitzmann, C.; Rosemann, T.; Knechtle, B. Health status of female and male vegetarian and vegan endurance runners compared to omnivores-results from the NURMI study (step 2). Nutrients 2018, 11, 29. [Google Scholar] [CrossRef] [Green Version]
- Janelle, K.C.; Barr, S.I. Nutrient intakes and eating behavior scores of vegetarian and nonvegetarian women. J. Am. Diet. Assoc. 1995, 95, 180–186. [Google Scholar] [CrossRef]
- Nogueira, J.A.D.; Da Costa, T.H.M. Nutrient intake and eating habits of triathletes on a Brazilian diet. Int. J. Sport Nutr. Exerc. Metab. 2004, 14, 684–697. [Google Scholar] [CrossRef] [PubMed]
- Burke, L.M.; Slater, G.; Broad, E.M.; Haukka, J.; Modulon, S.; Hopkins, W.G. Eating patterns and meal frequency of elite Australian athletes. Int. J. Sport Nutr. Exerc. Metab. 2003, 13, 521–538. [Google Scholar] [CrossRef] [Green Version]
- Erdman, K.A.; Tunnicliffe, J.; Lun, V.M.; Reimer, R.A. Eating patterns and composition of meals and snacks in elite Canadian athletes. Int. J. Sport Nutr. Exerc. Metab. 2013, 23, 210–219. [Google Scholar] [CrossRef] [PubMed]
- Nebl, J.; Schuchardt, J.P.; Wasserfurth, P.; Haufe, S.; Eigendorf, J.; Tegtbur, U.; Hahn, A. Characterization, dietary habits and nutritional intake of omnivorous, lacto-ovo vegetarian and vegan runners—A pilot study. BMC Nutr. 2019, 5, 51. [Google Scholar] [CrossRef] [Green Version]
- Wirnitzer, K.; Seyfart, T.; Leitzmann, C.; Keller, M.; Wirnitzer, G.; Lechleitner, C.; Rüst, C.A.; Rosemann, T.; Knechtle, B. Prevalence in running events and running performance of endurance runners following a vegetarian or vegan diet compared to non-vegetarian endurance runners: The NURMI study. SpringerPlus 2016, 5, 458. [Google Scholar] [CrossRef] [Green Version]
- Boldt, P.; Knechtle, B.; Nikolaidis, P.; Lechleitner, C.; Wirnitzer, G.; Leitzmann, C.; Rosemann, T.; Wirnitzer, K. Quality of life of female and male vegetarian and vegan endurance runners compared to omnivores-results from the NURMI study (step 2). J. Int. Soc. Sports Nutr. 2018, 15, 33. [Google Scholar] [CrossRef] [PubMed] [Green Version]
- World Health Organization (WHO). A Healthy Lifestyle—WHO Recommendations. Available online: http://www.euro.who.int/en/health-topics/disease-prevention/nutrition/a-healthy-lifestyle/body-mass-index-bmi (accessed on 10 May 2022).
- World Health Organization (WHO). Noncommunicable Diseases: Risk Factors. Available online: http://www.who.int/gho/ncd/risk_factors/bmi_text/en/ (accessed on 10 May 2022).
- Elmadfa, I.; Leitzmann, C. Ernährung des Menschen (Human Nutrition), 6th ed.; UTB GmbH: Berlin, Germany, 2019; p. 618. [Google Scholar]
- König, D. Kohlenhydrate im Sport (Carbohydrates in sport). In Lehrbuch der Sporternährung (Textbook of Sports Nutrition), 1st ed.; Lamprecht, M., Ed.; ÖGSE—Österreichische Gesellschaft für Sporternährung: Graz, Austria, 2007; p. 448. [Google Scholar]
- Scheidt-Nave, C.; Kamtsiuris, P.; Goesswald, A.; Hölling, H. German Health Interview and Examination Survey for Adults (DEGS)—Design, objectives and implementations of the first data collection wave. BMC Public Health 2012, 12, 730. [Google Scholar] [CrossRef] [Green Version]
- Haftenberger, M.; Heuer, T.; Heidemann, C.; Kube, F. Relative validation of a food frequency questionnaire for national health and nutrition monitoring. Nutr. J. 2010, 9, 36. [Google Scholar] [CrossRef] [Green Version]
- Monteiro, C.A.; Cannon, G.; Lawrence, M.; Costa Louzada, M.L.P.; Ereira Machado, P. Ultra-Processed Foods, Diet Quality, and Health Using the NOVA Classification System; Food and Agriculture Organization (FAO) of the United Nations (UN): Rome, Italy, 2019. [Google Scholar]
- Open Food Facts—Freie Datenbank für Nahrungsmittel. Nova-Gruppen der Lebensmittelverarbeitung Eine Klassifizierung in 4 Gruppen, um den Grad der Verarbeitung von Lebensmitteln Darzustellen. Available online: https://de.openfoodfacts.org/nova (accessed on 23 August 2021).
- Fachgesellschaft für Ernährungstherapie und Prävention für Professionalität in der Ernährungsberatung (FETeV). 4-StufenSystem für Lebensmittel nach dem Verarbeitungsgrad. Available online: https://fet-ev.eu/lebensmittelbeurteilung/ (accessed on 23 August 2021).
- Redaktion Ernährungsumschau. Lebensmittelkennzeichnung: 4-Stufen-System für Lebensmittel nach dem Verarbeitungsgrad. ERNÄHRUNGSUMSCHAU 4/2020: M192. Available online: https://www.ernaehrungs-umschau.de/print-news/08-04-2020-4-stufen-system-fuer-lebensmittel-nach-dem-verarbeitungsgrad/ (accessed on 23 August 2021).
- Capling, L.; Beck, K.L.; Gifford, J.A.; Slater, G.; Flood, V.M.; O’Connor, H. Validity of dietary assessment in athletes: A systematic review. Nutrients 2017, 9, 1313. [Google Scholar] [CrossRef] [Green Version]
- Baranowski, T. Chapter 4, 24-hour recall and diet record methods. In Nutritional Epidemiology, 3rd ed.; Walter, W., Ed.; Oxford University Press: New York, NY, USA, 2013; pp. 49–69. [Google Scholar]
- Willett, W. Chapter 5, food frequency methods. In Nutritional Epidemiology, 3rd ed.; Walter, W., Ed.; Oxford University Press: New York, NY, USA, 2013; pp. 70–95. [Google Scholar]
- Braakhius, A.K.; Meredith, K.; Cox, G.R.; Hopkins, W.J.; Burke, L.M. Variability in estimation of self reported dietary intake data from elite athletes resulting from processing by different sports dietitians. Int. J. Sport Nutr. Exerc. Metab. 2003, 13, 152–165. [Google Scholar] [CrossRef] [PubMed]
- Burke, L.M. Dietary Assessment Methods for the Athlete: Pros and Cons of Different Methods. Sports Sci. Exch. 2015, 28, 1–6. [Google Scholar]
- Sunami, A.; Sasaki, K.; Suzuki, Y.; Oguma, N.; Ishihara, J.; Nakai, A.; Yasuda, J.; Yokoyama, Y.; Yoshizaki, T.; Tada, Y.; et al. Validity of a semi-quantitative food frequency questionnaire for collegiate athletes. J. Epidemiol. 2016, 26, 284–291. [Google Scholar] [CrossRef]
- Braakhuis, A.J.; Hopkins, W.G.; Lowe, T.E.; Rush, E.C. Development and validation of a food-frequency questionnaire to assess shortterm antioxidant intake in athletes. Int. J. Sport Nutr. Exerc. Metab. 2011, 21, 105–112. [Google Scholar] [CrossRef]
- Burke, L.M.; Jeukendrup, A.E.; Jones, A.M.; Mooses, M. Contemporary nutrition strategies to optimize performance in distance runners and race walkers. Int. J. Sport Nutr. Exerc. Metab. 2019, 29, 117–129. [Google Scholar] [CrossRef] [Green Version]
- Devrim-Lanpir, A.; Hill, L.; Knechtle, B. Efficacy of popular diets applied by endurance athletes on sports performance: Beneficial or detrimental? A narrative review. Nutrients 2021, 13, 491. [Google Scholar] [CrossRef]
- Barnard, N.D.; Goldman, D.M.; Loomis, J.F.; Kahleova, H.; Levin, S.M.; Neabore, S.; Batts, T.C. Plant-Based Diets for Cardiovascular Safety and Performance in Endurance Sports. Nutrients 2019, 11, 130. [Google Scholar] [CrossRef] [PubMed] [Green Version]
- Wirnitzer, K.; Motevalli, M.; Tanous, D.; Wirnitzer, G.; Leitzmann, C.; Wagner, K.-H.; Rosemann, T.; Knechtle, B. Training and Racing Behaviors of Omnivorous, Vegetarian, and Vegan Endurance Runners—Results from the NURMI Study (Step 1). Nutrients 2021, 13, 3521. [Google Scholar] [CrossRef] [PubMed]
- Craig, W.J.; Mangels, A.R.; Fresán, U.; Marsh, K.; Miles, F.L.; Saunders, A.V.; Haddad, E.H.; Heskey, C.E.; Johnston, P.; Larson-Meyer, E.; et al. The safe and effective use of plant-based diets with guidelines for health professionals. Nutrients 2021, 13, 4144. [Google Scholar] [CrossRef] [PubMed]
- Goulet, E.D. Dehydration and endurance performance in competitive athletes. Nutr. Rev. 2012, 70, S132–S136. [Google Scholar] [CrossRef]
- Škof, B.; Rotovnik Kozjek, N. A comparison of dietary habits between recreational runners and a randomly selected adult population in Slovenia. Zdr. Varst. 2015, 54, 212–221. [Google Scholar] [PubMed] [Green Version]
- Leasure, J.L.; Neighbors, C.; Henderson, C.E.; Young, C.M. Exercise and alcohol consumption: What we know, what we need to know, and why it is important. Front. Psychiatry 2015, 6, 156. [Google Scholar] [CrossRef] [PubMed] [Green Version]
- Sechster Schweizerischer Ernährungsbericht. Available online: https://www.blv.admin.ch/dam/blv/de/dokumente/lebensmittel-und-ernaehrung/publikationen-forschung/6-seb-gesamtbericht-final.pdf.download.pdf/gesamtbericht.pdf (accessed on 11 May 2022).
- Kerksick, C.M.; Wilborn, C.D.; Roberts, M.D.; Smith-Ryan, A.; Kleiner, S.M.; Jäger, R.; Collins, R.; Cooke, M.; Davis, J.N.; Galvan, E.; et al. ISSN exercise & sports nutrition review update: Research & recommendations. J. Int. Soc. Sports Nutr. 2018, 15, 38. [Google Scholar]
- Beis, L.Y.; Willkomm, L.; Ross, R.; Bekele, Z.; Wolde, B.; Fudge, B.; Pitsiladis, Y.P. Food and macronutrient intake of elite Ethiopian distance runners. J. Int. Soc. Sports Nutr. 2011, 8, 7. [Google Scholar] [CrossRef] [Green Version]
- Onywera, V.O.; Kiplamai, F.K.; Boit, M.K.; Pitsiladis, Y.P. Food and macronutrient intake of elite Kenyan distance runners. Int. J. Sport Nutr. Exerc. Metab. 2004, 14, 709–719. [Google Scholar] [CrossRef] [Green Version]
- Leischik, R.; Spelsberg, N. Vegan triple-ironman (raw vegetables/fruits). Case Rep. Cardiol. 2014, 2014, 317246. [Google Scholar] [CrossRef] [PubMed] [Green Version]
- Wirnitzer, K.C.; Kornexl, E. Energy and macronutrient intake of a female vegan cyclist during an 8-day mountain bike stage race. Bayl. Univ. Med. Cent. Proc. 2014, 27, 42–45. [Google Scholar] [CrossRef]
- Xie, L.; Wang, B.; Cui, X.; Tang, Q.; Cai, W.; Shen, X. Young adult vegetarians in Shanghai have comparable bone health to omnivores despite lower serum 25(OH) vitamin D in vegans: A cross-sectional study. Asia Pac. J. Clin. Nutr. 2019, 28, 383–388. [Google Scholar] [PubMed]
- Thomas, D.T.; Erdman, K.A.; Burke, L.M. Position of the Academy of Nutrition and Dietetics, Dietitians of Canada, and the American College of Sports Medicine: Nutrition and Athletic Performance. J. Acad. Nutr. Diet. 2016, 116, 501–528. [Google Scholar] [CrossRef] [PubMed]
- Gillen, J.B.; Trommelen, J.; Wardenaar, F.C.; Brinkmans, N.Y.J.; Versteegen, J.J.; Jonvik, K.L.; Kapp, C.; de Vries, J.; van den Borne, J.J.G.C.; Gibala, M.J.; et al. Dietary Protein Intake and Distribution Patterns of Well-Trained Dutch Athletes. Int. J. Sport Nutr. Exerc. Metab. 2017, 27, 105–114. [Google Scholar] [CrossRef] [PubMed]
- Aguilera, E.; Piñero, P.; Infante Amate, J.; González de Molina, M.; Lassaletta, L.; Sanz Cobeña, A. Emisiones de Gases de Efecto Invernadero En El Sistema Agroalimentario y Huella de Carbono de La Alimentación En España; Real Academia de Ingeniería: Madrid, Spain, 2020. [Google Scholar]
- Health Canada. Canada’s Food Guide. Available online: https://food-guide.canada.ca/en/ (accessed on 13 July 2021).
- Wirnitzer, K.; Boldt, P.; Wirnitzer, G.; Leitzmann, C.; Tanous, D.; Motevalli, M.; Rosemann, T.; Knechtle, B. Health status of recreational runners over 10-km up to ultra-marathon distance based on data of the NURMI Study Step 2. Sci. Rep. 2022, 12, 10295. [Google Scholar] [CrossRef]
- Motevalli, M.; Wagner, K.-H.; Leitzmann, C.; Tanous, D.; Wirnitzer, G.; Knechtle, B.; Wirnitzer, K. Female Endurance Runners Have a Healthier Diet than Males—Results from the NURMI Study (Step 2). Nutrients 2022, 14, 2590. [Google Scholar] [CrossRef]
- Grzymisławska, M.; Puch, E.A.; Zawada, A.; Grzymisławski, M. Do nutritional behaviors depend on biological sex and cultural gender? Adv. Clin. Exp. Med. 2020, 29, 165–172. [Google Scholar] [CrossRef] [Green Version]
- Ruby, M.B. Vegetarianism. A blossoming field of study. Appetite 2012, 58, 141–150. [Google Scholar] [CrossRef]
- Wirnitzer, K.; Motevalli, M.; Tanous, D.; Wirnitzer, G.; Leitzmann, C.; Pichler, R.; Rosemann, T.; Knechtle, B. Who Is Running in the D-A-CH Countries? An Epidemiological Approach of 2455 Omnivorous, Vegetarian, and Vegan Recreational Runners—Results from the NURMI Study (Step 1). Nutrients 2022, 14, 677. [Google Scholar] [CrossRef]
- Malsagova, K.A.; Kopylov, A.T.; Sinitsyna, A.A.; Stepanov, A.A.; Izotov, A.A.; Butkova, T.V.; Chingin, K.; Klyuchnikov, M.S.; Kaysheva, A.L. Sports nutrition: Diets, selection factors, recommendations. Nutrients 2021, 13, 3771. [Google Scholar] [CrossRef]
- Janiczak, A.; Devlin, B.L.; Forsyth, A.; Trakman, G.L. A systematic review update of athletes’ nutrition knowledge and association with dietary intake. Br. J. Nutr. 2021, 1–14. [Google Scholar] [CrossRef] [PubMed]
- Margetts, B.; Martine, J.A.; Saba, A.; Holm, L.; Kearney, M. Definitions of “healthy” eating: A pan-EU survey of consumer attitudes to food, nutrition and health. Eur. J. Clin. Nutr. 1997, 51, 23–29. [Google Scholar]
- Vergeer, L.; Vanderlee, L.; White, C.M.; Rynard, V.L.; Hammond, D. Vegetarianism and other eating practices among youth and young adults in major Canadian cities. Public Health Nutr. 2020, 23, 609–619. [Google Scholar] [CrossRef]
- Petroczi, A.; Naughton, D.P. The age-gender-status profile of high performing athletes in the UK taking nutritional supplements: Lessons for the future. J. Int. Soc. Sports Nutr. 2008, 5, 2. [Google Scholar] [CrossRef] [Green Version]
- Waskiewicz, Z.; Nikolaidis, P.T.; Gerasimuk, D.; Borysiuk, Z.; Rosemann, T.; Knechtle, B. What motivates successful marathon runners? The role of sex, age, education, and training experience in polish runners. Front. Psychol. 2019, 10, 1671. [Google Scholar] [CrossRef] [PubMed]


| Basic Food Clusters | ||
| Cluster 1 | Grains | |
| a-grains | cornflakes; white bread; white pasta | |
| b-whole grains | muesli; wholegrain; mixed bread; wholegrain pasta; wholegrain rice; other grains | |
| Cluster 2 | Legumes, nuts, and pulses | pulses; nuts and seeds; legumes |
| Cluster 3 | Fruit and vegetables | vegetable juice; fruit; vegetables |
| Cluster 4 | Dairy products | milk; cheese; yoghurt |
| Cluster 5 | Dairy alternatives | milk alternatives |
| Cluster 6 | Meat | |
| a-meat | chicken; beef; pork; deer | |
| b-processed meat | fried nuggets; hamburger; sausage; kebab; pork; processed meat | |
| Cluster 7 | Meat alternatives | tofu; seitan; tempeh; etc. |
| Cluster 8 | Fish, shellfish, and seafood | |
| Cluster 9 | Eggs | |
| Cluster 10 | Oils and spreads | butter; margarine; oils |
| Cluster 11 | Sweets and snacks | sweets; snacks; salty snacks |
| Cluster 12 | Water and unsweetened tea | |
| Cluster 13 | Beverages | |
| Cluster 14 | Alcohol | |
| Preparation/Umbrella Clusters | ||
| Cluster 15 | Protein | |
| a-plant protein | legumes and beans; vegetables; grains (couscous, quinoa); dairy alternatives (e.g., soy products); meat alternatives | |
| b-animal protein | dairy products; eggs; meat and processed meat products; fish, seafood, and shellfish | |
| Cluster 16 | (Ultra-)processed foodsand free/added sugar | sugary carbonated drinks; kcal reduced/artificially sweetened drinks; fruit juice; free sugar in tea; free sugar in coffee; cereals; sweet and savory spreads; margarine; pasta; sweets, cakes, and biscuits; salty snacks, butter; processed meat; processed plant products |
| Cluster 17 | Free/added sugar | Sweet spread; sugary carbonated drinks; fruit juice; free sugar in tea; free sugar in coffee; cereals; sweets, cakes, and biscuits |
| Totaln = 211 | Omnivorousn = 95 | Vegetariann = 40 | Vegann = 76 | Statistics | ||
|---|---|---|---|---|---|---|
| Age (years) | 38 (IQR 18) | 43 (IQR 18) | 38 (IQR 16) | 36 (IQR 14) | F(2, 208) = 3.26; p = 0.040 | |
| Sex | Females | 57% (121) | 46% (44) | 65% (26) | 67% (51) | χ2(2) = 8.64; p = 0.013 |
| Males | 43% (90) | 54% (51) | 35% (14) | 33% (25) | ||
| Body weight (kg) | 65.0 (IQR 14.1) | 68.3 (IQR 16.0) | 61.0 (IQR 8.1) | 64.1 (IQR 11.0) | F(2, 208) = 6.56; p = 0.002 | |
| Height (m) | 1.7 (IQR 0.1) | 1.7 (IQR 0.1) | 1.7 (IQR 0.1) | 1.7 (IQR 0.1) | F(2, 208) = 1.80; p = 0.167 | |
| BMI (kg/m2) | 21.7 (IQR 3.4) | 22.5 (IQR 3.5) | 20.7 (IQR 3.4) | 21.3 (IQR 3.0) | F(2, 208) = 6.83; p = 0.001 | |
| Nationality | Austria | 17% (36) | 20% (19) | 15% (6) | 14% (11) | χ2(6) = 8.22; p = 0.222 |
| Germany | 74% (156) | 72% (68) | 80% (32) | 74% (56) | ||
| Switzerland | 5% (11) | 7% (7) | 2% (1) | 4% (3) | ||
| Other Countries | 4% (8) | 1% (1) | 2% (1) | 8% (6) | ||
| Marital Status | Divorced/Separated | 5% (11) | 3% (3) | 2% (1) | 9% (7) | χ2(4) = 8.45; p = 0.077 |
| Married/Partner | 68% (143) | 75% (71) | 57% (23) | 64% (49) | ||
| Single | 27% (57) | 22% (21) | 40% (16) | 26% (20) | ||
| Academic Qualification | Upper Secondary | 33% (69) | 37% (35) | 40% (16) | 24% (18) | χ2(6) = 7.88; p = 0.445 |
| A Level or Equivalent | 23% (49) | 24% (23) | 18% (7) | 25% (19) | ||
| University/College | 34% (72) | 33% (31) | 32% (13) | 37% (28) | ||
| No Answer | 9% (21) | 6% (6) | 10% (4) | 13% (10) | ||
| Race Distance | 10 km | 35% (74) | 36% (34) | 30% (12) | 37% (28) | χ2(4) = 1.41; p = 0.843 |
| HM | 39% (83) | 38% (36) | 48% (19) | 37% (28) | ||
| M/UM | 26% (54) | 26% (25) | 22% (9) | 26% (20) | ||
| Total n = 211 | Omnivorous n = 95 | Vegetarian n = 40 | Vegan n = 76 | Statistics | |
|---|---|---|---|---|---|
| Health and Wellbeing | 85% (106) | 78% (18) | 86% (24) | 88% (64) | χ2(2) = 1.25; p = 0.535 |
| Sporting Performance | 51% (63) | 57% (13) | 29% (8) | 58% (42) | χ2(2) = 7.16; p = 0.028 |
| Food Scandals | 35% (44) | 17% (4) | 57% (16) | 33% (24) | χ2(2) = 9.24; p = 0.010 |
| Animal Ethics | 78% (97) | 43% (10) | 75% (21) | 90% (66) | χ2(2) = 22.84; p < 0.001 |
| Ecological Aspects | 73% (91) | 48% (11) | 71% (20) | 82% (60) | χ2(2) = 10.65; p = 0.005 |
| Social Aspects (world hunger) | 49% (61) | 35% (8) | 50% (14) | 53% (39) | χ2(2) = 2.44; p = 0.295 |
| Economic Aspects | 18% (22) | 9% (2) | 11% (3) | 23% (17) | χ2(2) = 3.78; p = 0.151 |
| Religion/Spirituality | 6% (8) | - | 14% (4) | 5% (4) | χ2(2) = 4.55; p = 0.103 |
| Custom/Tradition | 5% (6) | 17% (4) | - | 3% (2) | χ2(2) = 9.99; p = 0.007 |
| Taste and Enjoyment | 44% (54) | 43% (10) | 39% (11) | 45% (33) | χ2(2) = 0.29; p = 0.866 |
| No Specific Reason | <1% (1) | 4% (1) | - | - | χ2(2) = 4.43; p = 0.109 |
| Omnivorous n = 95 | Vegetarian n = 40 | Vegan n = 76 | Statistics | |
|---|---|---|---|---|
| Part A—Basic Clusters | ||||
| FC—1: Total of grains | 18.72 ± 9.18 | 19.63 ± 7.29 | 16.77 ± 8.38 | F(2, 208) = 2.00; p = 0.138 |
| FC—1a (Total of refined grains) | 14.09 ± 9.68 | 13.88 ± 8.23 | 9.39 ± 8.34 | F(2, 208) = 7.21; p = 0.001 |
| Cornflakes | 2.04 ± 5.21 | 0.60 ± 2.27 | 1.39 ± 3.53 | F(2, 208) = 2.53; p = 0.082 |
| White bread | 8.61 ± 8.59 | 10.05 ± 7.95 | 5.87 ± 6.66 | F(2, 208) = 5.07; p = 0.007 |
| White pasta | 12.59 ± 8.98 | 12.25 ± 9.87 | 8.24 ± 8.61 | F(2, 208) = 5.97; p = 0.003 |
| FC—1b (Total of whole grains) | 18.81 ± 9.59 | 20.62 ± 8.13 | 20.07 ± 9.32 | F(2, 208) = 1.11; p = 0.332 |
| Muesli | 15.45 ± 12.68 | 16.26 ± 13.26 | 18.05 ± 13.74 | F(2, 206) = 0.69; p = 0.504 |
| Whole grain bread | 16.79 ± 9.21 | 19.60 ± 10.21 | 14.20 ± 8.05 | F(2, 208) = 4.48; p = 0.012 |
| Whole grain pasta | 8.44 ± 8.32 | 8.90 ± 7.96 | 12.97 ± 8.89 | F(2, 208) = 6.72; p = 0.001 |
| Whole grain rice | 6.36 ± 7.48 | 6.60 ± 7.32 | 8.53 ± 7.47 | F(2, 208) = 2.36; p = 0.097 |
| Other whole grains | 8.61 ± 8.59 | 10.05 ± 7.95 | 5.87 ± 6.66 | F(2, 208) = 5.07; p = 0.007 |
| FC—2: Total of beans and seeds | 20.76 ± 12.34 | 27.55 ± 13.78 | 32.94 ± 13.21 | F(2, 208) = 20.72; p < 0.001 |
| Nuts and seeds | 16.72 ± 13.02 | 19.85 ± 13.32 | 23.16 ± 12.94 | F(2, 208) = 5.55; p = 0.004 |
| Legumes | 11.16 ± 8.55 | 17.15 ± 9.62 | 21.08 ± 11.06 | F(2, 208) = 29.26; p < 0.001 |
| FC—3: Total of fruit and vegetables | 25.71 ± 11.91 | 28.46 ± 10.32 | 38.94 ± 11.66 | F(2, 208) = 30.9; p < 0.001 |
| Vegetable juice | 4.59 ± 9.87 | 2.77 ± 6.04 | 8.28 ± 12.53 | F(2, 208) = 6.25; p = 0.002 |
| Fruit | 17.09 ± 8.03 | 20.30 ± 10.81 | 21.18 ± 8.88 | F(2, 208) = 5.67; p = 0.004 |
| Vegetables | 26.45 ± 11.79 | 30.23 ± 9.69 | 38.38 ± 10.93 | F(2, 208) = 27.54; p < 0.001 |
| FC—4: Total of dairy | 18.33 ± 9.34 | 10.06 ± 9.58 | 0.00 ± 0.00 | F(2, 208) = 205.89; p < 0.001 |
| Milk | 16.08 ± 11.77 | 6.45 ± 9.63 | 0.00 ± 0.00 | F(2, 208) = 118.17; p < 0.001 |
| Cheese | 13.38 ± 7.96) | 7.97 ± 6.76 | 0.00 ± 0.00 | F(2, 208) = 163.04; p < 0.001 |
| Yoghurt | 13.00 ± 10.31 | 8.88 ± 10.96 | 0.00 ± 0.00 | F(2, 208) = 83.21; p < 0.001 |
| FC—5: Dairy alternatives | 9.68 ± 12.82 | 17.10 ± 14.77 | 23.89 ± 15.06 | F(2, 208) = 26.05; p < 0.001 |
| FC—6: Total of meat | 18.10 ± 12.23 | 0.00 ± 0.00 | 0.00 ± 0.00 | F(2, 208) = 221.01; p < 0.001 |
| FC—6a (Total of unprocessed meat) | 19.27 ± 13.02 | 0.00 ± 0.00 | 0.00 ± 0.00 | F(2, 208) = 188.11; p < 0.001 |
| Chicken | 7.79 ± 6.48 | 0.00 ± 0.00 | 0.00 ± 0.00 | F(2, 208) = 112.89; p < 0.001 |
| Beef and pork and deer | 16.18 ± 12.12 | 0.00 ± 0.00 | 0.00 ± 0.00 | F(2, 208) = 163.15; p < 0.001 |
| FC—6b (Total of processed meat) | 14.98 ± 11.89 | 0.00 ± 0.00 | 0.00 ± 0.00 | F(2, 208) = 178.73; p < 0.001 |
| Fried nuggets | 4.17 ± 4.10 | 0.00 ± 0.00 | 0.00 ± 0.00 | F(2, 208) = 113.44; p < 0.001 |
| Hamburger | 2.13 ± 3.18 | 0.00 ± 0.00 | 0.00 ± 0.00 | F(2, 208) = 31.51; p < 0.001 |
| Sausage | 1.71 ± 3.22 | 0.00 ± 0.00 | 0.00 ± 0.00 | F(2, 208) = 20.30; p < 0.001 |
| Kebab | 1.92 ± 2.73 | 0.00 ± 0.00 | 0.00 ± 0.00 | F(2, 208) = 48.12; p < 0.001 |
| Other processed meat | 14.42 ± 13.36 | 0.00 ± 0.00 | 0.00 ± 0.00 | F(2, 208) = 112.8; p < 0.001 |
| FC—7: Meat alternatives | 2.13 ± 3.91 | 8.17 ± 7.84 | 9.86 ± 6.02 | F(2, 208) = 62.14; p < 0.001 |
| FC—8: Fish | 10.12 ± 5.61 | 0.00 ± 0.00 | 0.00 ± 0.00 | F(2, 208) = 411.81; p < 0.001 |
| FC—9: Eggs | 14.32 ± 7.60 | 7.50 ± 7.40 | 0.00 ± 0.00 | F(2, 208) = 194.67; p < 0.001 |
| FC—10: Total of oils | 14.88 ± 13.56 | 14.73 ± 14.72 | 8.29 ± 9.82 | F(2, 208) = 5.55; p = 0.004 |
| Butter | 10.27 ± 12.83 | 7.20 ± 12.53 | 0.00 ± 0.00 | F(2, 208) = 42.45; p < 0.001 |
| Margarine | 4.80 ± 8.66 | 7.60 ± 12.31 | 8.29 ± 9.82 | F(2, 208) = 6.79; p = 0.001 |
| Other oils | 7.25 ± 6.86 | 7.30 ± 7.42 | 4.14 ± 4.91 | F(2, 208) = 4.56; p = 0.012 |
| FC—11: Total of snacks | 11.31 ± 7.40 | 10.97 ± 7.22 | 9.73 ± 6.76 | F(2, 208) = 0.88; p = 0.418 |
| Sweet snacks | 10.99 ± 6.25 | 10.58 ± 6.72 | 8.70 ± 6.74 | F(2, 208) = 3.56; p = 0.030 |
| Salty snacks | 6.39 ± 7.50 | 6.15 ± 8.29 | 6.13 ± 6.19 | F(2, 206) = 0.21; p = 0.808 |
| FC—12: Total of water | 32.16 ± 19.75 | 38.59 ± 23.70 | 37.46 ± 20.77 | F(2, 208) = 1.86; p = 0.159 |
| Water | 57.83 ± 27.05 | 63.20 ± 28.05 | 59.53 ± 28.16 | F(2, 208) = 0.55; p = 0.576 |
| Unsweetened tea | 18.34 ± 14.91 | 23.00 ± 20.99 | 24.91 ± 16.09 | F(2, 208) = 4.67; p = 0.010 |
| FC—13: Beverages | 13.72 ± 4.83 | 13.92 ± 4.77 | 13.99 ± 5.28 | F(2, 208) = 0.04; p = 0.961 |
| FC—14: Alcohol | 4.87 ± 5.46 | 2.50 ± 3.66 | 2.97 ± 4.09 | F(2, 208) = 5.78; p = 0.004 |
| Part B—Umbrella Clusters | ||||
| FC—15: Total of protein | 39.78 ± 14.25 | 31.39 ± 14.12 | 42.56 ± 12.33 | F(2, 208) = 8.12; p < 0.001 |
| FC—15a—Plant protein | 24.50 ± 12.47 | 35.26 ± 11.56 | 42.56 ± 12.33 | F(2, 208) = 48.77; p < 0.001 |
| FC—15b—Animal protein | 29.04 ± 9.34 | 11.89 ± 9.35 | 0.00 ± 0.00 | F(2, 208) = 422.88; p < 0.001 |
| FC—16: Processedfoods and free/added sugar | 27.89 ± 14.08 | 27.82 ± 17.57 | 23.37 ± 12.48 | F(2, 208) = 1.80; p = 0.168 |
| FC—17: Free/added sugar | 14.01 ± 9.24 | 16.16 ± 12.53 | 14.83 ± 9.04 | F(2, 208) = 0.41; p = 0.663 |
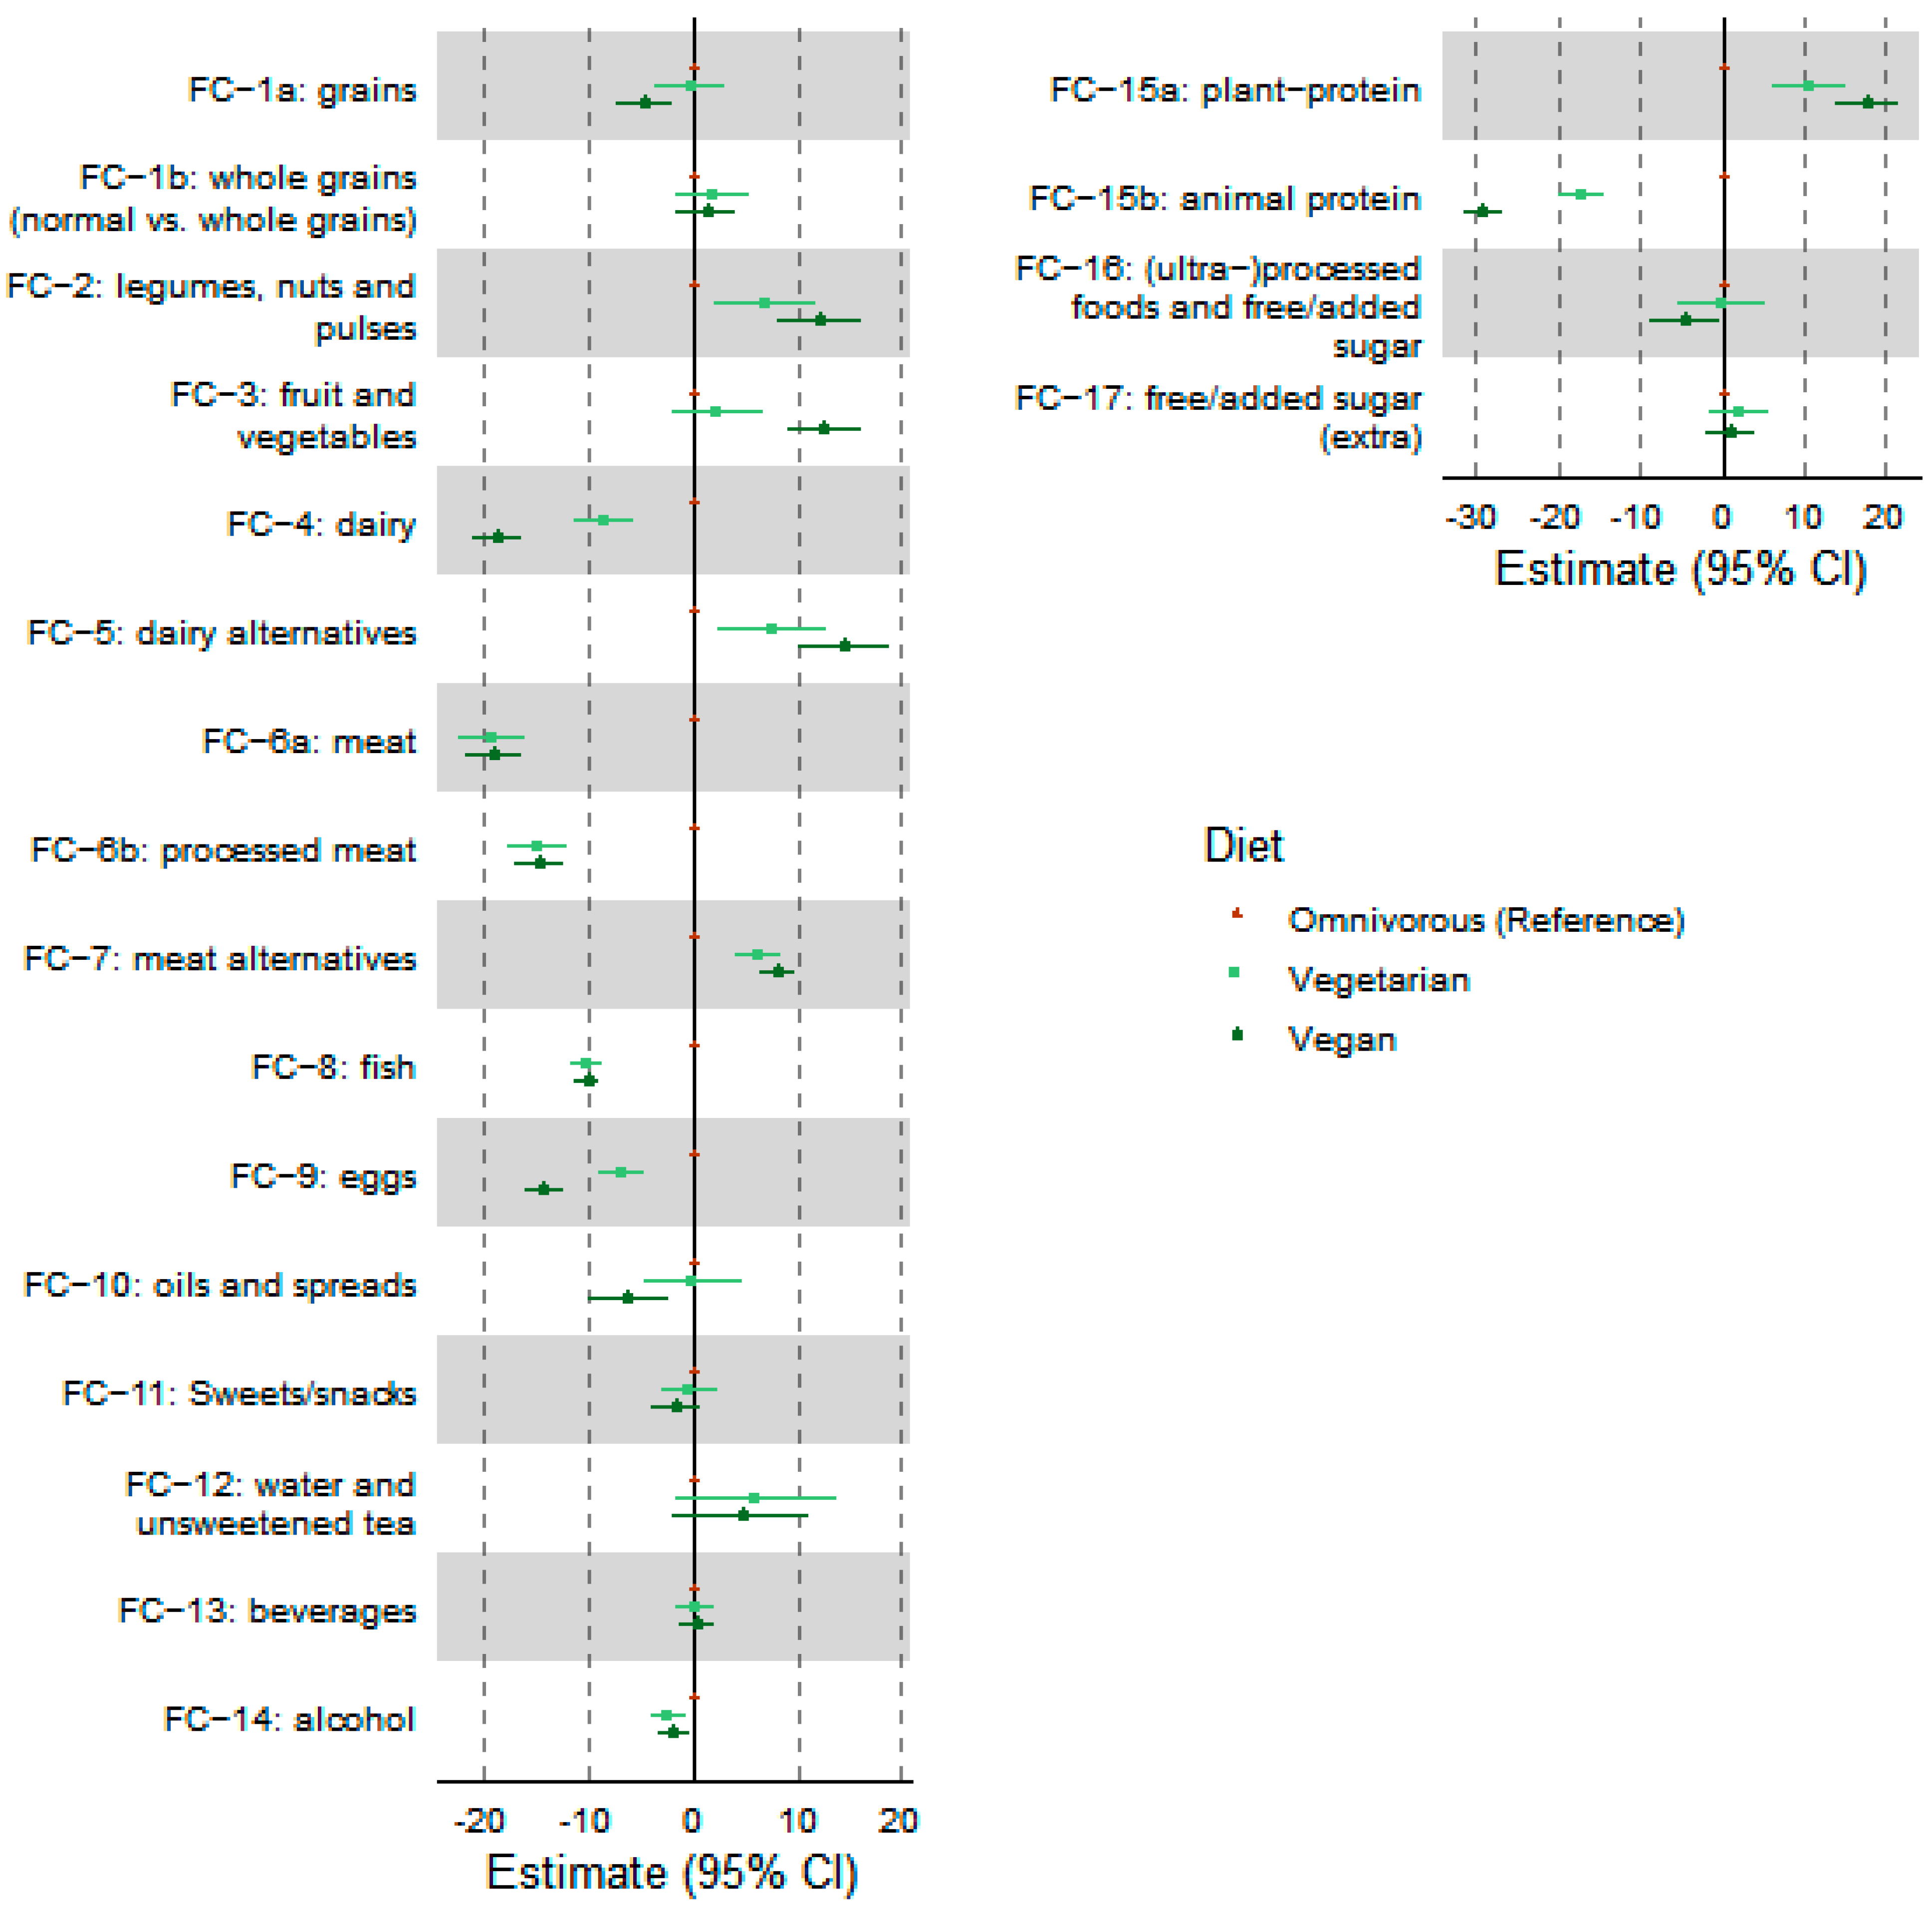
| Age | Omnivorous vs. Vegetarian | Omnivorous vs. Vegan | |||||||
|---|---|---|---|---|---|---|---|---|---|
| β | 95%-CI | p | β | 95%-CI | p | β | 95%-CI | p | |
| Part A—Basic Clusters | |||||||||
| FC—1a: Total of refined grains | 0.05 | [1.21, −1.12] | 0.939 | −0.20 | [3.15, −3.54] | 0.908 | −4.67 | [−1.91, −7.44] | 0.001 |
| FC—1b: Total of whole grains | 0.11 | [1.31, −1.09] | 0.407 | 1.83 | [5.28, −1.62] | 0.297 | 1.31 | [4.16, −1.55] | 0.368 |
| FC—2: Total of beans and seeds | 0.16 | [1.84, −1.53] | 0.855 | 6.83 | [11.66, 2.00] | 0.006 | 12.25 | [16.25, 8.25] | <0.001 |
| FC—3: Total of fruit and vegetables | −1.71 | [−0.23, −3.20] | 0.024 | 2.40 | [6.65, −1.86] | 0.268 | 12.52 | [16.04, 8.99] | <0.001 |
| FC—4: Total of dairy | −0.89 | [0.08, −1.87] | 0.072 | −8.46 | [−5.67, −11.25] | <0.001 | −18.71 | [−16.40, −21.02] | <0.001 |
| FC—5: Dairy alternatives | 0.69 | [2.52, −1.13] | 0.455 | 7.56 | [12.80, 2.32] | 0.005 | 14.50 | [18.83, 10.17] | <0.001 |
| FC—6a: Total of unprocessed meat | 0.41 | [1.55, −0.73] | 0.475 | −19.18 | [−15.92, −22.45] | <0.001 | −19.09 | [−16.39, −21.80] | <0.001 |
| FC—6b: Total of processed meat | 0.47 | [1.51, −0.56] | 0.369 | −14.88 | [−11.90, −17.86] | <0.001 | −14.78 | [−12.31, −17.24] | <0.001 |
| FC—7: Meat alternatives | 0.94 | [1.66, 0.22] | 0.011 | 6.23 | [8.29, 4.17] | <0.001 | 8.12 | [9.83, 6.41] | <0.001 |
| FC—8: Fish | −0.16 | [0.33, −0.65] | 0.512 | −10.15 | [−8.74, −11.56] | <0.001 | −10.18 | [−9.02, −11.35] | <0.001 |
| FC—9: Eggs | 0.17 | [0.96, −0.61] | 0.663 | −6.78 | [−4.53, −9.03] | <0.001 | −14.24 | [−12.38, −16.11] | <0.001 |
| FC—10: Total of oils | 0.81 | [2.45, −0.82] | 0.328 | 0.02 | [4.71, −4.67] | 0.994 | −6.25 | [−2.37, −10.13] | 0.002 |
| FC—11: Total of snacks | −0.07 | [0.86, −1.00] | 0.885 | −0.35 | [2.32, −3.02] | 0.797 | −1.61 | [0.60, −3.81] | 0.153 |
| FC—12: Total of water | −1.62 | [1.09, −4.34] | 0.240 | 6.09 | [13.87, −1.69] | 0.124 | 4.62 | [11.06, −1.82] | 0.159 |
| FC—13: Beverages | 0.25 | [0.90, −0.40] | 0.446 | 0.25 | [2.11, −1.61] | 0.789 | 0.38 | [1.92, −1.16] | 0.625 |
| FC—14: Alcohol | 0.16 | [0.77, −0.45] | 0.603 | −2.34 | [−0.59, −4.09] | 0.009 | −1.83 | [−0.38, −3.28] | 0.014 |
| Part B—Umbrella Clusters | |||||||||
| FC—15a: Plant protein | −0.86 | [0.74, −2.45] | 0.291 | 10.58 | [15.14, 6.02] | <0.001 | 17.70 | [21.47, 13.92] | <0.001 |
| FC—15b: Animal protein | −0.27 | [0.70, −1.25] | 0.581 | −17.20 | [−14.41, −19.99] | <0.001 | −29.15 | [−26.84, −31.46] | <0.001 |
| FC—16: Processed foods and free/added sugar | 0.10 | [1.96, −1.76] | 0.918 | −0.05 | [5.28, −5.38] | 0.987 | −4.47 | [−0.06, −8.88] | 0.047 |
| FC—17: Free/added sugar | 0.14 | [1.43, −1.14] | 0.828 | 2.17 | [5.86, −1.51] | 0.246 | 0.87 | [3.92, −2.18] | 0.573 |
Publisher’s Note: MDPI stays neutral with regard to jurisdictional claims in published maps and institutional affiliations. |
© 2022 by the authors. Licensee MDPI, Basel, Switzerland. This article is an open access article distributed under the terms and conditions of the Creative Commons Attribution (CC BY) license (https://creativecommons.org/licenses/by/4.0/).
Share and Cite
Wirnitzer, K.; Wagner, K.-H.; Motevalli, M.; Tanous, D.; Wirnitzer, G.; Leitzmann, C.; Rosemann, T.; Knechtle, B. Dietary Intake of Vegan and Non-Vegan Endurance Runners—Results from the NURMI Study (Step 2). Nutrients 2022, 14, 3151. https://doi.org/10.3390/nu14153151
Wirnitzer K, Wagner K-H, Motevalli M, Tanous D, Wirnitzer G, Leitzmann C, Rosemann T, Knechtle B. Dietary Intake of Vegan and Non-Vegan Endurance Runners—Results from the NURMI Study (Step 2). Nutrients. 2022; 14(15):3151. https://doi.org/10.3390/nu14153151
Chicago/Turabian StyleWirnitzer, Katharina, Karl-Heinz Wagner, Mohamad Motevalli, Derrick Tanous, Gerold Wirnitzer, Claus Leitzmann, Thomas Rosemann, and Beat Knechtle. 2022. "Dietary Intake of Vegan and Non-Vegan Endurance Runners—Results from the NURMI Study (Step 2)" Nutrients 14, no. 15: 3151. https://doi.org/10.3390/nu14153151