
Rural Specificity as a Factor Influencing Energy Poverty in European Union Countries


Institute of Economics and Finance, University of Rzeszów, 35-959 Rzeszów, Poland
*
Author to whom correspondence should be addressed.
Energies 2022, 15(15), 5463; https://doi.org/10.3390/en15155463
Submission received: 28 June 2022
/
Revised: 25 July 2022
/
Accepted: 26 July 2022
/
Published: 28 July 2022
(This article belongs to the Special Issue Advances in Scientific, Economic and Policy Analysis for Sustainable Development)
Abstract
:This study focuses on the empirical verification of the influence of rural specificity on energy poverty across European Union countries, in the period 2010–2020. The research aimed at specifying the role of the agricultural character of a country, as well as economic disparities between rural and urban areas, in inducing problems of energy affordability. Based on the literature consensus about the most important determinants of energy poverty, namely income, energy prices, energy productivity, quality of dwellings, and climate conditions, a standard model was constructed concerning the role of the rural character of an economy, with its traditional features such as agricultural employment, and indices of rural–urban divide, in terms of median income and material poverty. Models for panel data with fixed effects were estimated. The results indicate agricultural employment as a factor increasing the subjective energy poverty of households. However, the scale of rural settlement cannot be specified as a factor determining energy poverty, neither concerning energy consumption nor self-reported difficulties. This suggests that only the traditional agricultural character of rural areas negatively influences energy poverty. The processes of gentrification of rural areas observable in many EU countries changes the typical pattern of the identification of villagers with the most excluded group.
1. Introduction
Although growing interest has been paid to energy poverty issues, at least since the 1970s, and although the problems increase in importance along with the climate crises [1,2,3,4,5,6,7,8,9,10,11,12], the rural specificity of a country is relatively rarely studied as a determinant of energy poverty [6,13,14,15,16]. Meanwhile, the rural character of an economy traditionally specifies a sectoral engagement of labor resources and, thus, income distribution, which directly influences the energy affordability of each group. Moreover, density characteristics determine the infrastructure development and endanger access to energy, mainly for people living in rural areas. The rural–urban divide typically observed in the European Union [17,18] may, thus, also occur concerning energy issues.
However, the relationship between energy poverty patterns and the urban–rural divide has not reached a scientific consensus [16]. Some researchers claim that rural areas suffer more energy poverty [5,15,19,20,21,22,23,24,25,26], while others proved the opposite [5,16,27,28]. Some authors stress that differences in energy poverty can be explained by taking into account the level of urbanization [5,28,29,30], while others focused rather on more general issues of economic inequality as a source of energy poverty [5,15,31]. The recent state of research makes it necessary to study the potential influence of European rural specificity on energy poverty.
Therefore, this study aimed to empirically verify the influence of rural specificity on energy poverty across European Union countries in the recent period, covering the years 2010–2020. The rural specificity of an economy reveals the scale of the population living in rural areas and, more traditionally, in the scale of economic engagement in agricultural activity. Concerning rural specificity, it is also necessary to take into account income disparities between rural and urban citizens, as these are expected to directly determine the energy affordability of households. The presented research verifies whether rural character has an explanatory power for the problem of energy poverty across the EU member states. It was hypothesized that more rural countries experience higher energy poverty, in terms of both its objective and consensual aspect.
This study adopts a macroeconomic approach to this research issue and compares energy poverty across EU member states. The advantage of adopting an aggregate level of research is the possibility of cross-country comparisons and generalization of results. However, it is impossible to specify the exact vulnerability factors for the energy poverty of households and individuals, which are often determined by socio-economic features or technical aspects of the fulfillment of their energy needs. This study rather focuses on the general level of socio-economic development and the standard of living in the member states as explanatory of energy poverty.
Although the generally high level of socio-economic development of the member states makes the issue of energy infrastructure less essential for energy poverty across the EU, energy affordability still seems to be an issue demanding attention. Therefore, this study focuses on affordability problems, reflected mainly by various demand-side characteristics of energy usage and economic factors influencing energy poverty. However, conceptual ambiguity, measurement problems, and, last but not least, the availability of comparable and reliable data make this a challenging task.
Based on the data availability, as well as the subject literature concerning measurement attitudes [3,4,5,7,12,29,32,33,34,35,36], we use measures of energy poverty such as the energy consumption in households (which is an objective, expenditure-based measure), problems with fulfilling the thermal needs of homes (which is a subjective self-reported measure), and arrears on utility bills (which is also self-reported measure of energy poverty, however, this seems to be less subjective and mainly reflects the financial capability of households). We, thus, verified if the rural specificity of a country increases energy poverty, in terms of decreasing energy consumption and increasing the percentage of population reporting inability to keep their home adequately warm or arrears on utility bills. These affordability measures are strictly determined by the economic conditions of the country and the financial capabilities of its citizens, which are focused on in this study. However, it is also considered that the technical aspects of energy usage or exogenous factors such as climate conditions may strongly influence energy poverty. Therefore, this study examines numerous factors as potential determinants of energy poverty in the affordability dimension. Nevertheless, as the main attention of this study is paid to rural specificity, we especially test such indices as populations living in rural areas, employment in agriculture, relative median income of rural citizens, and relative poverty rate.
The paper is organized as follows. Section 2 delivers a literature review concerning conceptual issues of energy poverty, its measurement and research attitudes, as well as presenting some research about determinants of energy poverty, with special attention paid to rural specificity. Section 3 describes the research attitude adopted in this study, and the data and methods used in the research. The results are presented in Section 4, where EU countries are characterized concerning problems of energy poverty, the main factors determining energy poverty, features of rurality and rural–urban divide, and finally estimations of models verifying the existence of relationships between rural specificity and energy poverty are presented and discussed. The last section concludes the study.
2. Literature Review
2.1. The Concept of Energy Poverty
The concept of energy poverty has been broadly discussed in the literature since the 1970s, when the problem was firstly recognized as a result of the oil crisis and conceptualized (by Hancock and Isherwood [1], Lewis [2], Bradshaw and Hutton [3], Boardman [4], and many others). In the 1990s it was officially included in public policy, as pioneered by the UK government, and later on followed at European Union level and in many of its member states (since the 2019 approval of the Clean Energy for all Europeans Package (CEP) [37]), as well as being adopted by the international community in the Sustainable Development Goals (SDGs) of the United Nations [5,6,7,8,9,38]. Recently, the problem has attracted considerable academic and policy interest, and with the climate crisis and the Russian invasion on Ukraine the issue has further risen in importance. The induced energy transition is accompanied by rising energy prices, due to cost passthroughs to households [10,11,12] and, thus, increased economic restraints to energy usage and the deepening of energy poverty.
Generally, researchers accept a broad definition of energy poverty. Energy poverty is understood as a situation in which households are not able to secure a socially and materially required level of energy services in the home [16,39]; that is, they are not able to adequately heat their homes or meet other energy service needs at an affordable cost [5,40], where the domestic energy services are those required to live a decent and healthy life [29,41]. Many researchers stress that energy poverty is the issue of a lack of access to energy or electricity, the lack of clean fuels and technologies for cooking, or a minimum income for energy spending on basic necessities [15,26,42]. In a definition by the EU Energy Poverty Observatory [43], energy poverty is specified as a condition characterized by experiencing inadequate levels of essential energy services, such as adequate warmth, cooling, lighting, and the energy to power appliances [29]. Inability to keep homes adequately warm, arrears on utility bills, or poor housing conditions are living circumstances often linked to energy poverty [12].
In the literature, the conceptualization of energy poverty often refers to Amartya Sen’s capability approach [44]. It is thus understood as a situation of an inability to realize essential capabilities as a result of insufficient access to energy services, while taking into account the alternative means of realizing these capabilities in a reasonable manner [45,46,47]. The lack of access to energy resources limits human freedom to choose and the capabilities of a person, no matter the particular means or instruments of its availability, and it is stressed that the multidimensional nature of energy poverty extends beyond income [46]. In this vein, energy poverty, defined as “the absence of sufficient choice in accessing adequate, affordable, reliable, high-quality, safe, and environmentally benign energy services to support economic and human development” [48], refers to an absence of choice; the energy services instead of the energy consumption per se; and features of technologies enabling access to energy services, such as adequacy, affordability explained by the energy ladder theory, reliability, safety, being environmental benign, and support for development [26].
Definitions of energy poverty pay attention to its two dimensions: affordability, and access [9,16]. These two aspects differ, especially concerning special problems of developed and developing countries. Numerous studies into energy poverty have focused on high-income economies of Europe, the United States, or the Organization for Economic Co-operation and Development (OECD), examining the prevalence of the affordability problem [9,12]. The other area of research into energy poverty focuses on developing countries, which especially gained attention after 2015. Contrary to what is considered for developed country energy affordability issues, which are human-oriented, studies for developing countries are dominated by issues of energy accessibility, and are infrastructure-oriented [6]. These problems are characterized by the high energy cost in developed countries and a lack of access to modern energy in developing countries [47,49].
In this context, it is worth noting some discrepancies between the terms “energy poverty” and “fuel poverty”. The first is generally used in developing countries to capture problems related to the lack of physical access to energy services [50]. On the other hand, the term “fuel poverty”, stemming from the UK’s pioneering research into the problem, is mainly used in industrialized countries to describe the situation where households lack disposable income to pay for their basic energy needs [50]. Nevertheless, the phrase “energy poverty” is gaining in importance, and both terms are often used interchangeably [6]. In this paper we adopt “energy poverty”, as the category prevailing in the literature, and do not distinguish between both terms, as we consider only one group of relatively similar economies.
As this study is focused on energy poverty problems in the EU, in line with the literature, we consider its affordability dimension, which has a strong economic basis. As in Sen’s approach, we do not discuss detailed technical alternatives of fulfilling energy needs, instead, we take into account those barriers that can be the most serious limitations to the realization of human capabilities, which, in developed countries, are mainly of an economic nature.
2.2. Attitudes to Energy Poverty Measurement and Research
Discussion the about energy poverty concept often focuses on its operationalization; “it has been defined by how it has been measured” [34,51]. In the literature three alternative but complementary approaches to energy poverty measurement can be distinguished: technological threshold, based on the idea that energy poverty is a problem of accessing modern energy services; physical threshold, which estimates the minimum energy consumption associated with basic necessities; and economic threshold, which seeks to establish the maximum percentage of income that it is reasonable to earmark for energy spending [15,26,42]. Studies about energy poverty concern access, affordability, flexibility, energy efficiency, needs, and practices [16], while the energy poverty multidimensional indicator system covers such dimensions as energy availability, energy affordability, and energy cleanability [47], or the measurement is simplified to affordability and access, as the most common proxies for energy poverty [9]. Thus, the research refers not only to the physical (e.g., poor housing quality) or economic (affordability challenges) dimensions of energy insecurity but also to its behavioral dimension (social vulnerabilities, etc.) [52].
Considering such a multidimensional problem, the literature identifies numerous kinds of measures of energy poverty. Most often, they are classified as expenditure/income-based methods, which determine energy poverty on the basis of a households’ actual energy expenditures, often relative to income; and consensual-based methods, which are based on self-reported inability to secure a certain level of domestic energy services; and direct methods, which attempt to measure if the actual access to energy services is sufficient to achieve an adequate, pre-defined standard of living [12,32,33,34]. Some researchers, along with income and expenditure expenses and self-reported household conditions, also pay attention to the assessment of the risk of energy poverty [16,50]. There has also been classification of energy poverty indicators into subjective, qualitative, and developed by the individuals themselves; subjective, qualitative, and developed by third parties; objective, quantitative indicators, and not income-expenditure based; and finally objective, quantitative, and income-based indicators [53,54].
Among energy poverty indicators can thus be found those that are perception-based, also termed as subjective or consensual, and those that are expenditure-based, known as objective [7], or their combination [8]. Objective factual measures are exemplified as those drawn from measurable and observable criteria, which take into account the amount of expenditure needed to fulfill energy needs with respect to the total available financial endowments. Considering objective measures of energy poverty, these are distinguished as direct and objective measurements (temperature approach), where the level of energy services achieved in the home is compared to a set standard [55]; and an objective expenditure approach, where indicators such as income, housing costs, or energy costs are used [5,56,57]. The literature includes the ten percent rule (TPR) indicator, which considers that a household in energy poverty uses more than 10% of their income on fuel costs to maintain an adequate temperature at home [4]; the after fuel cost poverty (AFCP) indicator [35], which considers that a household is in energy poverty if its income is 60% less than the median income after housing and fuel costs for its household type; and the low-income high-cost (LIHC) indicator [36], which considers that a household is in energy poverty on the basis of two criteria: (1) having energy needs higher than the median for the household type, and (2) having an income lower than 60% of the median for the household type. In the most general manner, the minimum income standard (MIS), in terms of energy, specifies the rule “having what you need in order to have the opportunities and choices necessary to participate in society” [3,5,29]. Subjective self-reported measures are described as those based on personal opinions, interpretations, points of view, and judgments, and can be exemplified by questions asked by social investigators in a survey, such as in [58]: “Do you suffer from thermal discomfort?”, “Have you had difficulty in paying your utility bills (in the past)?”, “Can you afford your energy bills?”, or “Are you satisfied with your heating equipment?”. Moreover, composite indices are often argued for, constructed as a compromise between the simplicity of one-dimensional indicators and the need to account for the multidimensional nature of energy poverty [5,29,59].
Another aspect differentiating the measurement of energy poverty is the kind of indicator used, which can be the unidimensional, composite, and hybrid [46,51], and in this context, the methods used to assess energy poverty are broadly divided into unidimensional indicators, a dashboard of individual indicators, and a multidimensional energy poverty index (MEPI) [47].
Generally, some analyses indicate that there are clear differences and a lack of overlap between the commonly used and advocated EP measures [7], and this situation makes it necessary to compare alternative measures of energy poverty, to draw a complete picture of this multidimensional phenomenon. Simultaneously, such a broad range of attitudes to energy poverty measurement, as well as the numerous detailed indicators provided by researchers, with limited database availability, set a huge challenge to researches regarding this issue. This study, balancing both the need to reflect the compound character of energy poverty and problems of data availability, uses three alternative measures of energy poverty, namely, energy consumption in households per capita, inability to keep a home adequately warm, and arrears on utility bills. These have both an objective and subjective character and each takes the form of a numeric unidimensional indicator.
Considering the problems of operationalization and research attitude, studies into energy poverty took either a micro- or macroeconomic perspective. A microeconomic point of view focuses on the individual or household level characteristics that determine energy poverty [5,7,60,61]. Macroeconomic perspective, when searching for the causes and consequences of energy poverty, adopts country-wide measures [7]. Adopting this attitude, a number of studies have analyzed the energy poverty in individual countries, while studies presenting cross-country comparisons are relatively scarce [5,9,12]. Moreover, despite the growing literature, the current studies are largely oriented toward the micro level, leaving the macroeconomic aspect relatively poorly discussed [6]. Meanwhile, comparative country studies can enhance our understanding of the causes and effects of this problem [5]. This kind of approach was used in this study.
2.3. Rural Specificity between Determinants of Energy Poverty
An increasing number of studies have aimed to understand the extent and roots of energy poverty. In the literature, there is a general consensus that the most important determinants of energy poverty are income level, energy price, and energy efficiency (energy productivity or the opposite, energy intensity) [5,15,16,35,62,63]. The difficulty or inability of a household to afford an adequate coverage of its energy needs has been found to be caused by a high cost of energy, low household income, and a building’s energy inefficiency, or a combination of these [8]. Among the pivotal energy vulnerability factors are also enumerated climate, dwelling characteristics, and socio-demographic factors [29]. However, more recent understandings of the driving forces of energy poverty have introduced to the investigations a wider range of dimensions, covering such country-specific features as socio-technical and governance infrastructures [16].
Income level and energy price are the main economic factors that directly influence the purchasing power of households and specify their ability to buy energy for their daily needs. With an increase in income, energy affordability is no longer a severe problem for households, and at a macro level, it is expected that economies with a higher average income will experience less energy poverty, i.e., consume more energy and have less people suffering an from inadequate fulfillment of energy needs. At a macro level, the relations between energy consumption and income are also often tested as a proxy for the environmental Kuznets curve (EKC) hypothesis, which assumes an inverted U-shaped function between the environmental impact indicator and income per capita. However, this hypothesis is still ambiguous, as many researchers instead found that energy use per capita increases progressively with income per capita [64,65,66,67,68,69,70,71,72]. It is widely agreed that gross domestic product (GDP) per capita is closely related to energy consumption [26]. Moreover, numerous research works on energy poverty also confirmed the existence of an energy–income nexus [9], and the EKC between energy poverty and GDP per capita in Europe has also been tested [5,73,74]. However, the curve can be irregular, due to the influences from factors other than income [9]. Nevertheless, generally, researchers specify that energy poverty is associated with poor income [15,46,75,76], as energy poverty has a negative relationship with income and living standards, as measured by GDP per capita [5].
The second main economic factor influencing the affordability of any commodity, i.e., price, is found to directly determine energy affordability as well. An increase in energy prices is often claimed to be the main reason for energy poverty [15,77,78], while reductions in energy prices are perceived as beneficial against energy poverty, as energy poverty has a positive relationship with energy prices [5]. Moreover, different social groups reveal unique elasticity to increases in energy prices, and the rural energy poor are found to be on average more vulnerable to energy price shocks [28]. However, there have also been some research studies that showed that an increase of energy price makes no contribution to energy poverty, particularly in low-energy-poverty countries [74].
Although income has been found to be an important determinant of energy poverty, it is sometimes noticed that more economic growth will not systematically induce less precariousness [73], so measures in favor of energy efficiency must be put in place [5]. Thus, energy efficiency (often proxied by energy intensity) is used as another energy poverty determinant. As a very general indicator it reflects the structure of an economy and its cycle, general standards of living, and the technological advancement in the reference area. It has been found that improvements in energy efficiency were beneficial against energy poverty and that countries with a higher energy efficiency have a better ability to alleviate energy poverty [5].
Another group of factors often perceived as influencing energy vulnerability are the features of dwellings, e.g., their type, surface, and technical condition. It is claimed that housing type determines the risk of falling into energy poverty [29], while some indices of quality of dwelling, such as damp-mold problems, are considered as proxies for energy poverty [8]. Moreover, problems with insulation specify energy inefficiency of buildings and may represent some detailed dimensions of the general energy efficiency of the economy.
Apart from income, prices, and the energy efficiency of an economy or buildings efficiency, a lot of other detailed factors determining energy poverty are examined in the literature. These are also aimed at capturing some country-specific variables, often time-invariant ones, such as geographic conditions and weather [5]. Many researchers present results that support the statement that circumstantial factors such as climate must be taken into account to obtain an accurate picture of energy poverty [29] and show a significant relationship between energy poverty and climatic zone, arguing that moving from warmer to colder climatic zones increases the probability of being energy poor [8]. However, it is also observed that some affluent countries that face the most severe weather have higher energy efficiency standards [22], which lower heating costs. This may help to explain the puzzle of lower energy poverty observed in some rich economies with a colder climate [79], while also paying attention to mutual interrelations between energy poverty determinants.
Although a range of factors considered as potentially determining energy poverty has been considered, a relatively neglected aspect of research into energy poverty is its spatial distribution, in terms of urbanization characteristics. Few studies, among the characteristics inducing energy poverty, have examined spatial-specific variables e.g., urban–rural differences or have added urbanization as a potential determinant of energy poverty, at least for inclusiveness and to limit omitted-variables bias [13,14,15]. Thus, a need for considering such variables that allow capturing urban-level variations in energy access and affordability has been noted [6,16].
The issue of urbanization as a factor influencing energy poverty is strictly connected with more general problems of economic inequality. In numerous considerations [15,80], the Kuznets curve is invoked to explain changes in economic inequality, in terms of economic development, which is specified by shifts in economic structure and induces changes in income distribution between rural and urban areas. Rural areas with lower income and less economic activity may suffer increased energy poverty [19,20,21], and a greater disparity in income between urban and rural areas may lead to an increase in energy poverty [15]. Thus, some authors stress that differences in energy poverty can be explained by taking into account the level of urbanization [29,74]. However, there are divergent opinions about the relationship between energy poverty patterns, on the one hand, and the urban–rural divide, on the other [16].
Some studies into this relationship point out that the degree of inequality in the countries, measured by the Gini index, implies higher levels of energy poverty in less egalitarian countries [5]. It is also claimed that economic inequality is reflected in similar inequality in energy consumption [26] and that urban–rural income disparity has a negative impact on electricity consumption per capita [15,31]. Villalobos, Chávez, and Uribe [34] did not find any evidence supporting an urban–rural energy poverty divide; however, they observed statistically significant urban–rural deprivation gaps among the energy poor. Roberts et al. [28] and Bouzarovski and Thomson [30] found that there is a relationship between population density that captures the degree of urbanization and energy poverty [5]. Thomson and Snell [22] indicated that energy poverty is more pronounced in rural areas of Europe [5], and a similar conclusion was drawn for Poland by Sokołowski et al. [23] and for Greece by Katsoulakos and Kaliampakos [24,25]. González-Eguino [26] pointed out that eight out of every ten people with no access to modern energy services live in rural areas. Huang, Ming, and Duan concluded that urbanization contributes to reducing energy poverty, especially in high-energy-poverty European countries [74]. On the contrary, Scarpellini et al. [27] argued that, in Spain, energy poverty is less severe in rural areas. Bouzarovski, Thomson, and Cornelis [16], and Rodriguez-Alvarez, Llorca, and Jamasb [5] concluded that the most urbanized countries are farthest from their energy poverty minimum level, and an increment in the degree of urbanization of the country implies a higher rate of energy poverty and that energy poverty hides in large cities. Roberts et al. [28] also claimed that the experience of energy poverty in urban areas in the UK is longer, with a higher probability of energy poverty persistence, while Bouzarovski and Thomson [30] found no differences between densely- and thinly-populated areas when considering energy poverty [5]. As the results are not consistent, the influence of rural–urban characteristics on energy poverty remains to be researched.
3. Methods and Materials
This study empirically verifies the influence of rural areas specificity on energy poverty. It adopts a macro-level approach, and this fact determines the choice of proxies both for energy poverty and its determinants. Moreover, it concerns the economically advanced EU member states, with a developed energy infrastructure, which makes the issue of energy affordability the focus of the research about energy poverty. Considering the multidimensional character of the phenomenon of energy poverty and its determinants, this study mainly pays attention to the economic demand-side factors that correspond to the affordability issue.
To fulfill the main task of this study, first, concerning the literature findings, a baseline model of energy poverty is assumed, as follows:
Energy Poverty = Income + Energy Price + Energy Productivity + Quality of Dwellings + Climate Conditions
This model catches the most important determinants of energy poverty, as specified in numerous studies [5,15,35,62]. Income expresses either the general level of socio-economic development of a country and, thus, reflects patterns in energy usage as well as reflecting economic conditions of households and thus specifying their energy affordability. Energy price directly influences the energy affordability in an economy, as growing prices limit the disposable budget of any economic entity, including households. Energy productivity may be understood as a proxy for the advancement in energy technology in a whole economy, allowing for energy usage in a more resource efficient manner. When a modern technology is used in an economy, it is simultaneously expected that some advanced solutions are used by all economic entities, both enterprises and households, also inducing a greater energy efficiency of buildings or equipment or everyday commuting and the usage of a more environmentally friendly energy forms, as the energy ladder theory assumes. Moreover, the quality of dwellings is used as another detailed determinant, to stress the direct relation between housing and energy poverty. Additionally, as energy usage and, thus, energy poverty may be induced by climate conditions, this factor is included in the model as well. It is expected that energy poverty decreases along with growing income and energy productivity, while increases in energy prices, poor quality of dwellings, and colder climate induce a growth of energy poverty.
In the next stage, a model is constructed concerning the rural character of a country, in the form:
Energy Poverty = Income + Energy Price + Energy Productivity + Quality of Dwellings + Climate Conditions + Rural Character
Rural character is tested as a determinant of energy poverty, to verify if more rural societies and economies suffer much intense problems of energy poverty. The previous research [13,14,15] did not reach an agreement about the differences in the scale of energy poverty between rural and urban areas, and thus it was not specified if the rurality of a country (also verified as urbanization or agricultural engagement of labor) increases or decreases the vulnerability to energy poverty. Our study tried to empirically verify this relationship.
Finally, some additional determinants of the rural–urban divide are added to the model, which are specified as:
Energy Poverty = Income + Energy Price + Energy Productivity + Quality of Dwellings + Climate Conditions + Rural Character + Rural-Urban Divide
This extension was introduced to specify the role of disparities in the economic condition of households living in rural and urban areas, which can be decisive for either the spatial distribution of energy poverty or its scale. It is expected that growing disparities increase energy poverty, as in previous research [5,15,31], where it was concluded that income inequality induces energy poverty.
The empirical specification of the models was based on data derived from the Eurostat database [81,82,83,84,85,86,87,88,89,90,91,92,93,94]. This describes 27 European Union countries and covers the period 2010–2020. Thus, panel data were used to test the role of rural specificity on energy poverty at a macro-level using cross-country and over-time comparisons.
Concerning the numerous approaches to energy poverty measurement, three alternative indices of energy poverty were used, to express both objective and subjective methods of specifying the problem:
- energy consumption per capita, which is an objective indicator of energy usage and reflects both energy access and affordability. This indicator connects energy poverty with low energy consumption. The estimates use the variable, e_cons—final energy consumption in households per capita, kilogram of oil equivalent (KGOE) [81];
- inability to keep the home adequately warm, which is a subjective, self-reported indicator derived from a population survey. This indicator specifies an energy poverty scale as the percentage of the population experiencing problems with fulfillment of their needs for thermal comfort. These estimates use the variable, un_khw—percentage of population unable to keep their home adequately warm [82];
- arrears on utility bills, which is a self-reported metric expressing the financial capability of households and reflects how many households have difficulties in making ends meet, in the form of being unable to pay utility bills (heating, electricity, gas, water, etc.) on time, due to financial difficulties. The estimates use variable from the EU-SILC survey: arr_ub—percentage of population reporting arrears on utility bills [83].
The model’s five main determinants of energy poverty were specified as:
- income, which at a macro-level is specified as a real GDP per capita and also reflects the general level of economic development (economic activity and material living standard) of a country. More affluent societies can afford more energy and thus experience less energy poverty. The variable used is gdp_pc—gross domestic product at market prices as chain linked volumes (2010), in euro per capita [84];
- energy price, which reflects economic restraints to energy availability. Increases in prices limit energy affordability and thus energy poverty grows. The variable used is elec_pr—electricity prices for medium size households (Consumption Band Dc with annual consumption between 2500 and 5000 kWh) in euro per kilowatt-hour, including taxes and levies applicable for the first semester of each year, which includes the electricity prices charged to the final consumers [85];
- energy productivity, which reflects energy usage for production, which grows when less energy is consumed to achieve the same production level, due to better technology being used. This measures the productivity of energy consumption and provides a picture of the degree of decoupling of energy use from growth in GDP. A higher energy efficiency makes it possible to limit energy usage, while fulfilling energy needs and thus decreasing energy poverty. The variable used is e_prod—energy productivity in euro per kilogram of oil equivalent (KGOE), which results from the division of the gross domestic product (GDP) by the gross available energy for a given calendar year [86];
- quality of dwellings, which both proxies the technical condition and thus energy efficiency of inhabited buildings in a country and reflects problems of material deprivation of the population, measuring housing poverty. The variable used is the EU-SILC: p_dwell—percentage of total population living in a dwelling with a leaking roof, damp walls, floors or foundation, or rot in window frames or floor [87];
- climate conditions, which take into account different energy needs of households living in different geographic territories induced by weather conditions and average outdoor temperatures. The variable used is: h_d_d—heating degree days by country; annual data [88].
Taking into account the rural character of an economy, two alternative indicators were used:
- rural population in the country, which reflects the urbanization level and changes the pattern of energy usage. The variable used is: rur_pop—percentage of population living in rural areas [89];
- agricultural employment, which indicates the scale of economic engagement of labor forces in the agricultural sector, which is often identified with the rural character of an economy. The higher the share of agricultural employment, the more an economy reveals a traditional rural character. The variable used is: agr_emp—employment in section A of NACE Rev. 2, i.e., agriculture, forestry, and fishing as percentage of total employment in all NACE activities. Employment is measured in thousands and concerns the population from 15 to 64 years [90].
Concerning the problem of rural–urban divide, in terms of income, there are two indicators alternatively used in the models:
- relative poverty rate in rural areas, which compares the percentage of population at risk of poverty in rural areas to total at risk of poverty population, and reflects the severity of income difficulties of the rural population. The variable used is: r-t_pov—at-risk-of-poverty rate in rural areas (percentage) [91] divided by the at-risk-of-poverty rate (percentage) [92], where the cut-off point is 60% of the median equivalized income, after social transfers;
The panel data were not balanced, as for Malta the data describing the poverty rate in rural areas, as well as the median income in rural areas, were available only for 2014–2016. Thus, the models were estimated based on either a full set of information: 297 observations (models 1–3, 8–10, and 15–17) or a limited one: 289 observations (models 4–7, 11–14, and 18–21), when including problems of the rural–urban divide.
Descriptive statistics of the variables used in the models are presented in Table 1.
Concerning the different sets of regressors and based on alternative indicators, 21 final models of energy poverty were determined. Models 1–7 are based on energy consumption as an indicator of energy poverty; models 8–14 adopt a self-reported energy poverty indicator, in the form of an inability to keep the home adequately warm; while in models 15–21, energy poverty is expressed by arrears on utility bills. In any case, the basic model used 5 main determinants of energy poverty (model 1 for energy consumption, model 8 for self-reported thermal comfort, and model 15 for arrears on utility bills), then variables reflecting the rural character of an economy were added (model 2 and 3 for energy consumption, 9 and 10 for self-reported inability to keep home warm, 16 and 17 for arrears on utility bills), and then it was compared to indices of rural–urban divide (models 4–7, models 11–14, and models 18–21 respectively).
As this study is based on panel data, the estimation technique was used after verification with a Breusch–Pagan test and a Hausman test. Finally, all models for panel data were estimated using fixed effects. The significance level was set at 5%; however, the p-values were presented in all cases.
4. Results and Discussion
4.1. Energy Poverty in EU Countries
The problem of energy poverty is varied across EU countries, and in each member state it reveals in different forms (Figure 1). Concerning energy consumption in households per capita as an objective indicator of energy poverty, it is possible to point to such economies as Malta, Portugal, Bulgaria, or Spain as those suffering the most from inability to meet energy needs. However, the low level of energy consumption not only reflects problems with energy affordability, which specify energy poverty, but is also influenced by climate conditions that shape the necessary level of energy usage in each economy. Thus, the South European countries are generally characterized by lower energy consumption than countries of the North. This situation probably smooths the energy poverty disparities, as measured by the average consumption. Nevertheless, the lowest level of energy poverty was found in such economies as Finland, Luxembourg, Denmark, Austria, Sweden, and Belgium, which are also the most affluent. Geographic and income factors seem to coincide in shaping energy poverty in the EU.
As energy consumption is strongly influenced by the average temperature and is not a perfect measure of energy poverty, it is worth taking into account other indicators of energy poverty. The percentage of the population that reports problems with adequate fulfillment of thermal needs at home is considered an important subjective indicator of energy poverty. Considering this measure, particular attention can be paid to Bulgaria, where above 40% of households are unable to keep homes adequately warm. The extent of energy poverty in the country is immense. Severe problems were also identified in Lithuania, Cyprus, Greece, and Portugal. In contrast, less than 2% of the population experience such difficulties in Luxembourg, Finland, or Sweden, and less than 3% in Netherlands, Austria, Estonia, and Denmark.
Energy poverty is also reflected by the financial capability of households to meet energy needs and may be reflected by the percentage of the population with arrears on utility bills. This indicator reveals the most intense problems of energy poverty are in similar countries to the previously mentioned measures, namely Greece and Bulgaria, where about one third of the population experience such difficulties. Energy poverty also appears to be severe in Croatia and Romania, with the percentage of the population reporting arrears on utility bills exceeding 20%. On the other hand, in The Netherlands and Luxembourg such tensions concern only 3% of people. A relatively favorable situation was also observed in Czechia, Germany, Sweden, Austria, and Denmark, with the indicator lower than 4%.
The presented indicators of energy poverty supplement each other. There are a lot of similarities concerning the composition of country groups with more or less intense energy poverty problems, which can be classified in a very general way, along the line of a rich North and poor South. However, the indicators also differ, as the correlation between them is at a moderate level (−0.62 between energy consumption per capita and inability to keep home adequately warm; −0.40 between energy consumption per capita and arrears on utility bills; 0.63 between inability to keep home adequately warm and arrears on utility bills). It is, thus, useful to simultaneously consider different measures for capturing problems of energy poverty.
4.2. Main Determinants of Energy Poverty
Concerning the main determinants of energy poverty, as pointed out in the literature, it is worth stressing the characteristics of the countries under research, such as the GDP per capita, electricity prices, energy productivity, quality of dwellings, and climate conditions (Figure 2).
Luxembourg is definitely a leader concerning the results for the level of GDP per capita. The average income in this economy more than three-times exceeds the EU average. A high level of economic development measured by GDP per capita is also noted in Ireland, Denmark, and Sweden, where it reached above a EUR 40,000 level. At the other end of the ranking, Bulgaria and Romania placed with the poorest results in economic activity, below the level of EUR 10,000. Generally, the countries that accessed the EU in 2004 and after are characterized by a lower GDP per capita level than the more mature market economies. Among the group of the “old” EU members, the countries of Southern Europe experience more economic difficulties, as revealed by their GDP per capita. This divide seems to be in line with the characteristics of energy poverty. As, on the one hand, higher economic activity demands higher energy consumption, and as, on the other hand, higher income limits the economic tensions connected with fulfilling the energy needs of households, it seems to be reasonable to consider GDP per capita as an important factor influencing energy poverty.
The next, conceptually suggested determinant of energy poverty is the level of energy prices. This is a relatively less diversified factor across EU countries, as the prices of energy for households are to some extent regulated in all member states. The highest prices of electricity (in euro per kWh), which is the main component of energy prices directly influencing the fulfillment of household energy needs, are found in Denmark and Germany. The lowest level of electricity prices is noted for Bulgaria. The differences in electricity prices reflect disparities in economic results and the purchasing power in the countries. However, as the price differences are lower than the income disparities, the regulation seems not to be sufficient to lower disparities in energy poverty among the countries.
Considering the results achieved in energy productivity, which reveals the quality of energy technology used in a country, Ireland tops the ranking, just followed by Denmark. In these economies the unit of energy (in KGOE) usage allows producing a value of goods around EUR 15, which is far above the EU average (about EUR 7/KGOE). The poorest results are noted for Bulgaria, Estonia, and Malta, where the value is lower than EUR 4/KGOE. A higher energy productivity is expected to lower energy poverty, as it lowers energy needs for the whole economy, as well as individual households, and thus less people suffer from an inadequate fulfillment. However, some problems with energy poverty measurement using the energy consumption level indicator may appear here, as higher energy productivity is expected to lower energy consumption but decrease energy poverty. Moreover, it seems to be important how the most efficient technology is distributed and accessed by individual energy recipients, as efficient technology availability may be decisive for the scale of energy poverty.
There are strong disparities across the EU member states concerning the share of population living in a dwelling with a leaking roof, damp walls, floors or foundation, or with rot in window frames or floor. This indicator of housing poverty is directly connected with energy poverty, as more energy must be used in badly or non-insulated buildings to meet the same heating needs. The problem is the most severe in Cyprus, Slovenia, and Portugal, where about 30% of people report this poor quality in their houses. In addition, in Hungary and Latvia, around a quarter of the population experience such problems. On the other hand, in Finland, only 5% of households live in poor quality dwellings. Relatively favorable housing conditions are also found in Slovakia and Sweden. This situation may be connected with either the wealth of population and its distribution, climate conditions, or cultural and institutional solutions. Many researchers stress that a high technical quality of dwelling can explain lower energy poverty in rich northern countries such as Finland and Sweden, and the high heating costs and thus energy poverty in southern European countries, despite the comparatively good weather conditions [79].
Climate conditions seem to also be a factor influencing energy usage, which is mainly specified by heating and cooling needs. This influence is reflected by the indicator of heating degree days, which range from 467 in Malta to 5390 in Finland, as an average for 2010–2020. Weather-conditioned heating needs are also not as high in Cyprus and other southern countries such as Portugal, Greece, Spain, and Italy, where the border of 2000 degree days was not crossed. At the other end of the ranking, Sweden is placed just next to Finland, with the indicator exceeding 5000. Estonia, Latvia, and Lithuania are also characterized by high heating needs induced by the weather.
There is no unique ranking of countries concerning the described determinants of energy poverty. Although there are some similarities in these economic and technical conditions, they are sometimes in opposition to the geographic ones. As a result, there is no single place for each country in the rankings, and it is impossible to connect energy poverty with a single main determinant. Moreover, the channels of influence on energy poverty may differ and thus be unequally reflected by different indicators of energy poverty. Therefore, this study examines the influence of numerous factors on energy poverty, measured using its different proxies.
4.3. Rural Character of EU Countries
This study is focused on additional feature of a country that could determine energy poverty, i.e., its rural character. Rurality can be specified as a low level of urbanization, which changes patterns of energy usage, along with growing industrialization and the development of urban agglomerations stimulating energy consumption. Thus, the rural character of a country may be found in a traditional type of economic engagement in agricultural activity. Moreover, agriculture and energy issues are strongly connected, and while the energy consumption in agriculture accounts only for 3–4% of the total in the EU, it is highly concentrated in some economies [95]. On the other hand, as modern economies experience processes of deindustrialization and there are simultaneously observed migration outside the urban cities, the classical indices of socio-economic maturity of country’s development may no longer be valid. Gentrification may disturb the pattern and make it difficult to perceive a rural character as a sign of underdevelopment. However, as it may be expected, in traditional rural societies based on agriculture, energy poverty is a serious problem, and the rural character of a deindustrialized economy and the gentrified population of villages may not be factors of energy poverty risk. That is why rurality and agricultural employment are considered as characteristics potentially important for energy poverty across the EU countries (Figure 3).
The highest shares of rural population across the EU states are observed in the economies of the “new” members, such as Lithuania, Romania, and Slovenia. In these countries, more than, or close to a, half of population live in rural areas. This observation suggests that a rural character is still a sign of underdevelopment. On the other hand, some affluent economies (e.g., Luxembourg, Austria, and Denmark) are situated in the middle of the ranking, which may be connected with gentrification processes having already advanced in these countries. The lowest share of rural population is observed in Malta, which is strongly influenced by its specificity as an island territory, but also in The Netherlands, Belgium, and Italy. The pattern of rurality is thus not a single one in the EU, and as such, it is not obvious how it may influence energy poverty.
As rurality does not reveal a common sign of socio-economic advancement, the share of agricultural employment more directly can indicate this aspect and thus seems to be more directly connected with energy poverty. Within EU countries, Romania can be identified as the most agricultural economy, with a share of employment reaching 23%. It is followed by Greece and Poland, where agriculture engages about a half of the Romanian level, i.e., about 11–12% of employment. The least agricultural countries are Luxembourg, Malta, Belgium, Germany, and Sweden, where the share is lower than 2%. These rankings suggest that agricultural employment may determine energy poverty, as these are both signs of underdevelopment. Usually a lower income earned in agricultural activity induces poverty, and also energy poverty. It forces people to limit energy consumption and intensifies problems with the fulfilment of everyday thermal needs. Moreover, less industrialized economies are usually those with a poorer technical infrastructure, which also limits access to energy.
4.4. Rural–Urban Divide
Connections between energy poverty and the rural character of a country depend on disparities between the rural and urban populations, in terms of their incomes, wealth, type and features of dwelling they live in, as well as disparities in the development of energy infrastructure. These features may also reflect the character of rural settlements, concerning traditional (agricultural engagement) and modern (shown by gentrification) processes. As economic poverty and income level determine the general ability to meet the everyday needs of households, the rural–urban divide is reflected by these indices and their comparison seems to be necessary to specify the influence of spatial inequality on energy poverty.
In the EU, most countries experience higher poverty in rural areas than the total (Figure 4), which is reflected by a relative rural poverty rate exceeding 1. However, such affluent economies as Austria, The Netherlands, Luxembourg, Denmark, France, Belgium, and Germany are instead characterized by poverty problems concentrated in cities. This may be a result of the advanced gentrification of rural areas in these developed economies. In contrary, the most intense problems of poverty in rural areas are observed in Bulgaria and Romania with the lowest economic results. These comparisons support the general statement that in less developed economies, poverty problems mainly occur in rural areas, and rurality may also be a feature inducing energy poverty.
Similar patterns may be revealed when comparing relative rural median income. Only three member states, namely Luxembourg, Austria and Belgium, are distinguished by a higher median income in rural areas than overall. However, the spatial disparities in income level are insignificant in most of the advanced economies, such as The Netherlands and Denmark. On the other hand, a strong economic divide characterizes Romania and Bulgaria, where the median income in rural areas represents about three-quarters of the total level. Moreover, in Lithuania, Spain, Poland, Portugal, Greece, Hungary, Latvia, and Croatia, the median income of the rural population is 90% lower than that of the level for the total population and, thus, for urban dwellers. If these income disparities reflect the energy poverty distribution, one can expect energy poverty to be experienced mainly by rural populations.
4.5. Model Estimation
Estimation of the influence of the factors specified earlier in the study on energy poverty—reflected by either energy consumption per capita level, percentage of population reporting inability to keep home adequately warm, or arrears on utility bills—was preceded by the choice of an appropriate method to be used (Table 2). As described by models 1–21, a Breusch-Pagan (BP) test was used to decide if the OLS model for panel data was better than the random effects model, and a Hausman test indicated whether a random effects (RE) model was better than a fixed effects (FE) model. The final decision was, in every case, towards fixed effects models (Table 2). This suggests that the specificity of each member state is an important factor influencing energy poverty and that problems need to be resolved concerning the individual conditions of each country.
The results of the model estimation (Table 3) generally confirmed a strong influence of a country-level average income on energy poverty. The higher the general level of economic development and average income, the higher the energy consumption, reflecting lower energy poverty (see models 1–7). Moreover, the higher the income, the lower the percentage of the population suffering from inadequate thermal comfort at home, reflecting lower energy poverty (see models 8–14). Similarly, a negative sign of all coefficients was identified in the case of arrears on utility bills, proving that higher income limits the percentage of the population suffering financial difficulties with fulfilling energy needs (see models 15–21). This relationship with income was confirmed in all forms of the model, indicating its basic character. Generally, the results confirmed that higher income limits energy poverty, simultaneously stimulating energy consumption and limiting the scale of self-reported energy affordability problems.
It is expected that alongside economic development, the problem of energy poverty will diminish, at least assuming equal participation of the population in the outcomes of development. However, a growing income of a country is not a universal solution to energy poverty problems. Numerous problems induced by a generally higher energy consumption in more affluent economies can occur, especially in the environmental dimension. It is necessary to draw attention to potential externalities induced in terms of economic development and some “global energy trilemmas” [6], arising in pursuit of sustainable development. They appear concerning the need to stimulate economic growth and thus energy consumption, which both lead to social inequality, as well as in the terms of the energy poverty of numerous groups suffering exclusion, and environmental tensions connected with climate change. Limiting energy consumption may reduce economic growth and increase the scale of energy poverty; however, it is necessary to protect the environment. This trilemma brings the need to search for alternative, more energy efficient, technologies.
Most of the models do not support the statement that energy prices induce energy poverty. The relation with different energy poverty proxies was not significant, with the only exception being models 20 and 21, where higher energy prices induced arrears on utility bills. Additionally, model 17 provides some very weak confirmation of energy prices influencing energy poverty. Nevertheless, all signs of the estimated coefficients, although insignificant, suggest that increasing prices generally increase the range of energy poverty proxies by different measures. The financial capability of households could be affected by energy prices. The ambiguity of results may be influenced by the choice of the proxy for energy prices, i.e., electricity prices, which only partly reflect energy price levels and were included in the models because of data availability. Moreover, the insignificant results may have been caused by strong state interventions concerning electricity prices for medium households in EU countries. Such regulations are aimed at energy poverty reduction and are country specific, thus disturbing any observable relationship between energy prices and energy poverty.
The models found that energy productivity is an important determinant of energy poverty, in terms of average energy consumption (see models 1–7). Higher energy productivity allows for a reduction of energy consumption. It cannot, however, be interpreted as growing energy poverty, as it is rather the possibility for fulfilment of energy needs, with lower resource usage. Moreover, while the relationship with energy usage characteristics occurs at a country-wide level, concerning the self-reported energy poverty specified by the individual fulfillment of thermal needs, the relationship appears less significant (as for models 8–14). The growing share of the population reporting inadequate thermal comfort, with growing energy productivity, may suggest an unequal distribution of benefits, stemming from better usage of energy resources. This suggests that material poverty may create strong barriers to energy-efficient technology usage, and thus higher general energy productivity does not limit the range of energy poverty. Additionally, concerning arrears on utility bills as an indicator of energy poverty, no significant relationship with energy productivity was found (models 15–21). This suggests that the affordability dimension of energy poverty is not directly connected with the technological advancement of a country and is mainly affected by the daily economic constraints of households.
The results do not confirm the determining character of a bad technical condition of a dwelling on energy consumption (models 1–7). This may have resulted from the simultaneously appearing opposite influences of poor dwelling quality, which through the channel of building efficiency, increases the energy consumption to fulfill the same energy needs of households, and, on the other hand, being a sign of the poor economic condition of households, induces constraints on energy consumption, as the dilemma of “heat or eat” [35,79]. The technical features of homes force households to consume more energy, while a need to insulate their dwellings limits their already low financial capabilities and induces a reduction of energy spending. This situation makes their struggle to meet energy needs even more challenging and puts them into a vicious circle of interrelations between the poor condition of a dwelling and energy need fulfillment. As the results show, a growing share of people living in a low-quality dwellings increases the energy poverty, measured in terms of an inability to keep a home adequately warm (models 8, 9, 11, 12) or in terms of arrears on utility bills (models 15, 16, 18 19). Moreover, although in some models, the coefficients were not statistically significant, they obtained a positive sign (models 10, 13, 14, 17, 20, 21), giving additional support to the statement of an interrelation existing between dwelling quality and energy poverty.
Climate conditions appeared to be a strong determinant of energy consumption, while they only slightly influence energy poverty, in terms of the inability to keep a home warm and arrears on utility bills. In each model, a growth in heating degree days induced a growth in energy consumption in households, and this observation is consistent with the sensitivity of the measure of energy poverty on climate conditions widely discussed in the literature [8,29,79]. Simultaneously, in most of the models with self-reported measures of energy poverty, the influence of severe climate conditions was weaker (models 8–10 and 15) or even not statistically significant (models 11–14 and 16–21); however, with a positive sign. Thus, it may be concluded that a colder climate increases the problem of energy poverty.
In terms of the variables reflecting the rural character of an economy, none of the alternative proxies, namely rural population or agricultural employment, revealed a significant influence on energy poverty, in terms of energy consumption. However, concerning self-reported energy poverty, in the form of an inability to keep a home adequately warm, and especially arrears on utility bills, agricultural employment appears to be a stimulant (models 10, 14, as well as 17, 20, 21). It can be concluded that more agrarian economies suffer from a wider range of energy poverty, suggesting that agriculture, as a sector of economic activity, limits the energy affordability of the population, probably via the channel of lower incomes. The strong relationships with the arrears on utility bills indicator confirmed the essential role of economic strains experienced by agricultural employees. The results reveal the problems of income distribution between socio-economic groups engaged in different kinds of economic activity. This indicates that more agrarian societies are potentially more vulnerable to energy poverty. Simultaneously, the influence of rural settlement on energy poverty was not confirmed (models 9, 11, 12, 16, 18, 19). It may be concluded that, in EU countries, the spatial distribution of population does not specify energy poverty. This situation may be connected with the growing gentrification of rural areas, which are becoming places to live for people occupying higher positions in the social stratification [96]. Thus, the specificity of rural employment, in terms of traditional agricultural engagement of the population against the modern character of settlement, specified by the pursuit of a better quality of life, is an indicator of the difficulties in fulfilling essential needs, and also energy affordability.
Other conclusions are drawn concerning factors referring to the rural–urban divide. Neither of its forms, i.e., income disparities or relative poverty, influenced energy poverty in any dimensions of the phenomenon, i.e., in terms of energy consumption (see models 4–7), self-reported thermal comfort (see models 11–14), and arrears on utility bills (see models 18–21). The coefficients for the relative rural poverty are as expected; however, they are not statistically significant. In the case of the income disparities between rural and urban population, the signs of coefficients were inconsistent concerning each energy poverty dimension and also not statistically significant. Thus, this observation does not resolve the dilemma about the interrelation between rural poverty and income disparity with energy poverty, which is suggested in the literature [15,26,31]. Further research is needed to reveal the detailed situation of different socio-economic groups of households and in separate groups of countries, as well as in terms of rural settlements and their traditional versus gentrified character.
5. Conclusions
This study draws attention to the rural specificity of a country as an important characteristic influencing energy poverty, and one usually omitted in research. It is possible to conclude that in EU countries, the traditional agricultural character of an economy may help to explain the scale of energy poverty. Some key findings of our research merit particular attention in this context:
- First, it is worth stressing that rural settlement in EU countries is no longer an indicator of energy poverty (neither energy consumption or subjective energy poverty in terms of thermal control or arrears on utility bills), which may be explained by the growing gentrification of rural areas.
- Similarly, agricultural employment cannot be recognized as a factor determining the level of energy consumption across EU countries, which may be explained by the marginal role of agriculture in structurally advanced economies, where economic development is specified by deindustrialization and where this process is expected to change patterns of energy demand.
- On the contrary, the traditional character of rural areas specified by agricultural employment explains the energy poverty scale, as reported in household surveys. More agrarian economies suffer from a greater extent of energy poverty. Thus, the structural transformation of traditional economies is necessary, to overcome the problems of energy affordability at a household level.
- A potential channel of the influence of agricultural character on energy poverty seems to be the unequal distribution of income and material poverty. However, the presented research has not confirmed the influence of the rural–urban divide on energy poverty. This relationship could be disturbed by the progressing gentrification of rural areas observable in some EU countries. In-depth research is needed, to test the potential role of gentrification. It is probable that the results would differ concerning subgroups of EU member states.
The findings of this study need further confirmation, as there are a lot of limitations to the research. First, the choice of energy poverty indicator strongly influenced the results. The three measures alternatively used in this study do not exhaust the possibilities of a proxy for energy poverty, as this is a compound multidimensional phenomenon. It would be useful to consider other indices, to capture different aspects of the energy poverty problem. Some aggregate measures of the phenomenon should be developed and included in future models. However, this direction of research is strongly limited by data availability. This fact reflects a need to elaborate a common methodology for measuring energy poverty and gathering data in a unified way, to ensure cross-country comparability.
Moreover, this study focused on the affordability dimension of energy poverty. The accessibility aspects, especially concerning infrastructural differences between rural and urban areas, could explain some relationships uncovered by the study. Simultaneously, it is important to recognize details of technological determinants of energy accessibility and to identify their relations with economic indices of energy affordability. It would be scientifically valuable to relate the demand and supply sides of energy usage and thus deepen the research into energy poverty.
The presented results are of preliminary character and reveal the need to deepen the research about the role of structural changes within economies on the problems of energy poverty. This study sheds some light on the importance of economic inequality, in terms of spatial and sectoral distribution, for the intensity of problems with energy affordability. Especially, it stresses that difficulties are still concentrated in the rural areas of EU states; however, they are caused by motives of settlement and the prevailing kind of economic activity, not by the rural settlement per se. Thus, the factors specifying spatial patterns of development and the rural–urban divide should be taken into account when explaining energy poverty. Moreover, in-depth research into the socio-economic features of households living in urban and rural areas is needed, as this has the potential to explain some of the differences in patterns of meeting energy needs and struggling with energy poverty.
Author Contributions
Conceptualization, M.C. and P.C.; methodology, M.C. and P.C.; software, M.C. and P.C.; validation, M.C. and P.C.; formal analysis, M.C. and P.C.; investigation, M.C. and P.C.; resources, M.C. and P.C.; data curation, M.C. and P.C.; writing—original draft preparation, M.C. and P.C.; writing—review and editing, M.C. and P.C.; visualization, M.C. and P.C.; supervision, M.C. and P.C.; project administration, M.C. and P.C.; funding acquisition, M.C. and P.C. All authors have read and agreed to the published version of the manuscript.
Funding
The APC was funded by University of Rzeszów, Poland within statutory activities.
Data Availability Statement
All data used in the study were derived from Eurostat database https://ec.europa.eu/eurostat/data/database (accessed on 21 April 2022, 5 July 2022, and 11 July 2022).
Conflicts of Interest
The authors declare no conflict of interest. The funders had no role in the design of the study; in the collection, analyses, or interpretation of data; in the writing of the manuscript, or in the decision to publish the results.
References
- Hancock, R.; Isherwood, B. Household Expenditure on Fuel: Distributional Impacts; DHSS: London, UK, 1979.
- Lewis, P. Fuel Poverty Can Be Stopped; National Right to Fuel Campaign: Bradford, UK, 1982. [Google Scholar]
- Bradshaw, J.; Hutton, S. Social policy options and fuel poverty. J. Econ. Psychol. 1983, 3, 249–266. [Google Scholar] [CrossRef]
- Boardman, B. Fuel Poverty: From Cold Homes to Affordable Warmth; Belhaven Press: London, UK, 1991. [Google Scholar]
- Rodriguez-Alvarez, A.; Llorca, M.; Jamasb, T. Alleviating energy poverty in Europe: Front-runners and Laggards. Energy Econ. 2021, 103, 105575. [Google Scholar] [CrossRef]
- Primc, K.; Dominko, M.; Slabe-Erker, R. 30 years of energy and fuel poverty research: A retrospective analysis and future trends. J. Clean. Prod. 2021, 301, 127003. [Google Scholar] [CrossRef]
- Deller, D.; Turner, G.; Waddams Price, C. Energy poverty indicators: Inconsistencies, implications and where next? Energy Econ. 2021, 103, 105551. [Google Scholar] [CrossRef]
- Papada, L.; Kaliampakos, D. Measuring energy poverty in Greece. Energy Policy 2016, 94, 157–165. [Google Scholar] [CrossRef]
- Bhattacharya, M.; Inekwe, J.; Yan, E. Dynamics of energy poverty: Evidence from nonparametric estimates across the ASEAN+6 region. Energy Econ. 2021, 103, 105549. [Google Scholar] [CrossRef]
- Heindl, P.; Schüßler, R.; Löschel, A. Ist die energiewende sozial gerecht? Wirtschaftsdienst 2014, 94, 508–514. [Google Scholar] [CrossRef] [Green Version]
- Neuhoff, K.; Bach, S.; Diekmann, J.; Beznoska, M.; El-Laboudy, T. Distributional effects of energy transition: Impacts of renewable electricity support in Germany. Econ. Energy Environ. Policy 2013, 2, 41–54. [Google Scholar] [CrossRef]
- Drescher, K.; Janzen, B. Determinants, persistence, and dynamics of energy poverty: An empirical assessment using German household survey data. Energy Econ. 2021, 102, 105433. [Google Scholar] [CrossRef]
- Jamasb, T.; Mota, R.; Newbery, D.; Pollitt, M. Electricity Sector Reform in Developing Countries: A Survey of Empirical Evidence on Determinants and Performance; Policy Research Working Paper 3549; The World Bank: Washington, DC, USA, 2005. [Google Scholar]
- Khandker, S.R.; Barnes, D.F.; Samad, H.A. Energy Poverty in Rural and Urban India: Are the Energy Poor Also Income Poor? Policy Research Working Paper 3549; The World Bank: Washington, DC, USA, 2010. [Google Scholar]
- Nguyen, C.P.; Nasir, M.A. An inquiry into the nexus between energy poverty and income inequality in the light of global evidence. Energy Econ. 2021, 99, 105289. [Google Scholar] [CrossRef]
- Bouzarovski, S.; Thomson, H.; Cornelis, M. Confronting Energy Poverty in Europe: A Research and Policy Agenda. Energies 2021, 14, 858. [Google Scholar] [CrossRef]
- Brasington, D. Differences in the production of education across regions and urban and rural areas. Reg. Stud. 2002, 36, 137–145. [Google Scholar] [CrossRef]
- Wosiek, M. Rural–urban divide in human capital in Poland after 1988. Oecon. Copernic. 2020, 11, 183–201. [Google Scholar] [CrossRef] [Green Version]
- Rock, M.T.; Angel, D.P. Grow first, clean up later? Industrial transformation in East Asia. Environ. Sci. Policy Sustain. Dev. 2007, 49, 8–19. [Google Scholar] [CrossRef]
- Barnes, D.F.; Khandker, S.R.; Samad, H.A. Energy poverty in rural Bangladesh. Energy Policy 2011, 39, 894–904. [Google Scholar] [CrossRef]
- Lariviere, I.; Lafrance, G. Modelling the electricity consumption of cities: Effect of urban density. Energy Econ. 1999, 21, 53–66. [Google Scholar] [CrossRef]
- Thomson, H.; Snell, C. Quantifying the prevalence of fuel poverty across the European Union. Energy Policy 2013, 52, 563–572. [Google Scholar] [CrossRef]
- Sokołowski, J.; Lewandowski, P.; Kiełczewska, A.; Bouzarovski, S. A Multidimensional Index to Measure Energy Poverty: The Polish Case. Energy Sources Part B Econ. Plan. Policy 2020, 15, 92–112. [Google Scholar] [CrossRef]
- Katsoulakos, N.M.; Kaliampakos, D.C. Mountainous Areas and Decentralized Energy Planning: Insights from Greece. Energy Policy 2016, 91, 174–188. [Google Scholar] [CrossRef]
- Katsoulakos, N.M.; Kaliampakos, D.C. The Energy Identity of Mountainous Areas: The Example of Greece. J. Mt. Sci. 2018, 15, 1429–1445. [Google Scholar] [CrossRef]
- González-Eguino, M. Energy poverty: An overview. Renew. Sustain. Energy Rev. 2015, 47, 377–385. [Google Scholar] [CrossRef]
- Scarpellini, S.; Alexia Sanz Hernández, M.; Moneva, J.M.; Portillo-Tarragona, P.; Rodríguez, M.E.L. Measurement of Spatial Socioeconomic Impact of Energy Poverty. Energy Policy 2019, 124, 320–331. [Google Scholar] [CrossRef]
- Roberts, D.; Vera-Toscano, E.; Phimister, E. Fuel poverty in the UK: Is there a difference between rural and urban areas? Energy Policy 2015, 87, 216–223. [Google Scholar] [CrossRef] [Green Version]
- Kahouli, S.; Okushima, S. Regional energy poverty reevaluated: A direct measurement approach applied to France and Japan. Energy Econ. 2021, 102, 105491. [Google Scholar] [CrossRef]
- Bouzarovski, S.; Thomson, H. Towards an Inclusive Energy Transition in the European Union: Confronting Energy Poverty Amidst a Global Crisis; Publications Office of the European Union, Energy Poverty Observatory: Luxembourg, 2020. [Google Scholar] [CrossRef]
- Dong, X.-Y.; Hao, Y. Would income inequality affect electricity consumption? Evidence from China. Energy 2018, 142, 215–227. [Google Scholar] [CrossRef]
- Thomson, H.; Bouzarovski, S.; Snell, C. Rethinking the measurement of energy poverty in Europe: A critical analysis of indicators and data. Indoor Built Environ. 2017, 26, 879–901. [Google Scholar] [CrossRef] [PubMed] [Green Version]
- Tirado Herrero, S. Energy poverty indicators: A critical review of methods. Indoor Built Environ. 2017, 26, 1018–1031. [Google Scholar] [CrossRef]
- Villalobos, C.; Chávez, C.; Uribe, A. Energy poverty measures and the identification of the energy poor: A comparison between the utilitarian and capability-based approaches in Chile. Energy Policy 2021, 152, 112146. [Google Scholar] [CrossRef]
- Hills, J. Fuel Poverty: The Problem and Its Measurement. Interim Report of the Fuel Poverty Review; CASE Report 69; Center for Analysis of Social Exclusion: London, UK, 2011; Available online: http://sticerd.lse.ac.uk/dps/case/cr/CASEreport69.pdf (accessed on 24 June 2022).
- Hills, J. Getting the Measure of Fuel Poverty. Final Report of the Fuel Poverty Review; CASE Report 72; Center for Analysis of Social Exclusion: London, UK, 2012; Available online: http://sticerd.lse.ac.uk/dps/case/cr/CASEreport72.pdf (accessed on 24 June 2022).
- European Commission. Clean Energy for All Europeans Package. Available online: https://energy.ec.europa.eu/topics/energy-strategy/clean-energy-all-europeans-package_en (accessed on 23 June 2022).
- United Nations. The Sustainable Development Goals Report 2020. Available online: https://unstats.un.org/sdgs/report/2020/The-Sustainable-Development-Goals-Report-2020.pdf (accessed on 23 June 2022).
- Bouzarovski, S.; Petrova, S. A global perspective on domestic energy deprivation: Overcoming the energy poverty-fuel poverty binary. Energy Res. Soc. Sci. 2015, 10, 31–40. [Google Scholar] [CrossRef]
- Pye, S.; Dobbins, A.; Baffert, C.; Brajković, J.; Deane, P.; De Miglio, R. Addressing energy poverty and vulnerable consumers in the energy sector across the EU. L’Eur. Form. 2015, 378, 64–89. [Google Scholar] [CrossRef]
- Middlemiss, L.; Gillard, R. Fuel poverty from the bottom-up: Characterising household energy vulnerability through the lived experience of the fuel poor. Energy Res. Soc. Sci. 2015, 6, 146–154. [Google Scholar] [CrossRef] [Green Version]
- Pachauri, S.; Spreng, D. Measuring and monitoring energy poverty. Energy Policy 2011, 39, 7497–7504. [Google Scholar] [CrossRef]
- European Commission. Energy Poverty Advisory Hub. Available online: https://energy-poverty.ec.europa.eu/about-us_en (accessed on 23 June 2022).
- Sen, A. Development as Freedom; Oxford University Press: Oxford, UK, 2000. [Google Scholar]
- Day, R.; Walker, G.; Simcock, N. Conceptualising energy use and energy poverty using a capabilities framework. Energy Policy 2016, 93, 255–264. [Google Scholar] [CrossRef]
- Sadath, A.C.; Acharya, R.H. Assessing the extent and intensity of energy poverty using Multidimensional Energy Poverty Index: Empirical evidence from households in India. Energy Policy 2017, 102, 540–548. [Google Scholar] [CrossRef]
- Che, X.; Zhu, B.; Wang, P. Assessing global energy poverty: An integrated approach. Energy Policy 2021, 149, 112099. [Google Scholar] [CrossRef]
- Reddy, A. Energy and social issues. In Energy and the Challenge of Sustainability. World Energy Assessment; UNDP: New York, NY, USA, 2000; pp. 39–60. [Google Scholar]
- Lin, B.; Wang, Y. Does energy poverty really exist in China? From the perspective of residential electricity consumption. Energy Policy 2020, 143, 111557. [Google Scholar] [CrossRef]
- Castaño-Rosa, R.; Solís-Guzmán, J.; Rubio-Bellido, C.; Marrero, M. Towards a multiple-indicator approach to Energy Poverty in the European Union: A review. Energy Build. 2019, 193, 36–48. [Google Scholar] [CrossRef]
- Bazilian, M.; Nussbaumer, P.; Cabraal, A.; Centurelli, R.; Detchon, R.; Gielen, D.; Howells, M.; McMahon, H.; Modi, V.; O’Gallachoir, B.; et al. Measuring Energy Access Supporting a Global Target; United Nations Industrial Development Organization: Vienna, Austria, 2010; pp. 1–22. [Google Scholar]
- Čermáková, K.; Hromada, E. Change in the Affordability of Owner-Occupied Housing in the Context of Rising Energy Prices. Energies 2022, 15, 1281. [Google Scholar] [CrossRef]
- Heindl, P. Measuring fuel poverty: General considerations and application to German household data. FinanzArchiv Public Financ. Anal. 2015, 71, 178–215. [Google Scholar] [CrossRef] [Green Version]
- Romero, J.C.; Linares, P.; López, X. The policy implications of energy poverty indicators. Energy Policy 2018, 115, 98–108. [Google Scholar] [CrossRef]
- Oreszczyn, T.; Hong, S.H.; Ridley, I.; Wilkinson, P. Determinants of winter indoor temperatures in low income households in England. Energy Build. 2006, 38, 245–252. [Google Scholar] [CrossRef]
- Legendre, B.; Ricci, O. Measuring fuel poverty in France: Which households are the most fuel vulnerable? Energy Econ. 2015, 49, 620–628. [Google Scholar] [CrossRef] [Green Version]
- Burlinson, A.; Giulietti, M.; Battisti, G. The elephant in the energy room: Establishing the nexus between housing poverty and fuel poverty. Energy Econ. 2018, 72, 135–144. [Google Scholar] [CrossRef] [Green Version]
- Chapman, A.; Okushima, S. Engendering an inclusive low-carbon energy transition in Japan: Considering the perspectives and awareness of the energy poor. Energy Policy 2019, 135, 111017. [Google Scholar] [CrossRef]
- Okushima, S. Understanding regional energy poverty in Japan: A direct measurement approach. Energy Build. 2019, 193, 174–184. [Google Scholar] [CrossRef]
- Llorca, M.; Rodriguez-Alvarez, A.; Jamasb, T. Objective vs. subjective fuel poverty and self-assessed health. Energy Econ. 2020, 87, 104736. [Google Scholar] [CrossRef] [Green Version]
- Siksnelyte-Butkiene, I.; Streimikiene, D.; Lekavicius, V.; Balezentis, T. Energy poverty indicators: A systematic literature review and comprehensive analysis of integrity. Sustain. Cities Soc. 2021, 67, 102756. [Google Scholar] [CrossRef]
- Moore, R. Definitions of fuel poverty: Implications for policy. Energy Policy 2012, 49, 19–26. [Google Scholar] [CrossRef]
- Thomson, H.; Snell, C.; Bouzarovski, S. Health, Well-Being and Energy Poverty in Europe: A Comparative Study of 32 European Countries. Int. J. Environ. Res. Public Health 2017, 14, 584. [Google Scholar] [CrossRef] [Green Version]
- Suri, V.; Chapman, D. Economic growth, trade and the energy: Implications for the environmental Kuznets curve. Ecol. Econ. 1998, 25, 195–208. [Google Scholar] [CrossRef]
- Cole, M.A.; Rayner, A.J.; Bates, J.M. The environmental Kuznets curve: An empirical analysis. Environ. Dev. Econ. 1997, 2, 401–416. [Google Scholar] [CrossRef]
- Galli, R. The relationship between energy intensity and income levels: Forecasting log-term energy demand in Asian emerging countries. Energy J. 1998, 19, 85–105. [Google Scholar] [CrossRef]
- Stern, D.I. The Rise and Fall of the Environmental Kuznets Curve. World Dev. 2004, 32, 1419–1439. [Google Scholar] [CrossRef]
- Stern, D.I. Environmental Kuznets Curve. Encycl. Energy 2004, 2, 517–525. [Google Scholar]
- Luzzati, T.; Orsini, M. Investigating the energy-environmental Kuznets curve. Energy 2009, 34, 291–300. [Google Scholar] [CrossRef]
- Zaman, K.; Shahbaz, M.; Loganathan, N.; Raza, S.A. Tourism development, energy consumption and Environmental Kuznets Curve: Trivariate analysis in the panel of developed and developing countries. Tour. Manag. 2016, 54, 275–283. [Google Scholar] [CrossRef]
- Dinda, S. Environmental Kuznets Curve Hypothesis: A Survey. Ecol. Econ. 2004, 49, 431–455. [Google Scholar] [CrossRef] [Green Version]
- Shahbaz, M.; Mutascu, M.; Azim, P. Environmental Kuznets Curve in Romania and the Role of Energy Consumption. MPRA Paper 2011, No. 32254. Available online: https://mpra.ub.uni-muenchen.de/32254/ (accessed on 11 February 2021).
- Cadoret, I.; Thelen, V. Précarité énergétique en Europe: Existe-t-il une Relation de Kuznets? Rev. Int. Econ. Lang. Fr. 2020, 5, 166–186. Available online: http://aielf.org/wp-content/uploads/2016/03/RIELF-2020-511.pdf (accessed on 14 July 2022).
- Huang, Z.; Ming, X.; Duan, H. Heterogeneous effects of energy poverty convergence in Europe. Energy Strategy Rev. 2022, 41, 100822. [Google Scholar] [CrossRef]
- Khandker, S.R.; Barnes, D.F.; Samad, H.A. Energy Poverty in Rural and Urban India: Are the Energy Poor Also Income Poor? World Bank Policy Research Working Paper No. 5463; The World Bank: Washington, DC, USA, 2010. [Google Scholar] [CrossRef]
- Khandker, S.R.; Barnes, D.F.; Samad, H.A. Are the energy poor also income poor? Evidence from India. Energy Policy 2012, 47, 1–12. [Google Scholar] [CrossRef]
- Chester, L.; Morris, A. A new form of energy poverty is the hallmark of liberalized electricity sectors. Aust. J. Soc. Issues 2011, 46, 435–459. [Google Scholar] [CrossRef]
- Okushima, S. Gauging energy poverty: A multidimensional approach. Energy 2017, 137, 1159–1166. [Google Scholar] [CrossRef] [Green Version]
- Antepara, I.; Papada, L.; Gouveia, J.P.; Katsoulakos, N.; Kaliampakos, D. Improving Energy Poverty Measurement in Southern European Regions through Equivalization of Modeled Energy Costs. Sustainability 2020, 12, 5721. [Google Scholar] [CrossRef]
- Kakwani, N. Income Inequality, Welfare and Poverty in a Developing Economy with Applications to Sri Lanka; WIDER Working Papers 295569; United Nations University, World Institute for Development Economic Research (UNU-WIDER): Helsinki, Finland, 1986. [Google Scholar] [CrossRef]
- Eurostat Database, [SDG_07_20]. Available online: https://ec.europa.eu/eurostat/data/database (accessed on 21 April 2022).
- Eurostat Database, [SDG_07_60]. Available online: https://ec.europa.eu/eurostat/data/database (accessed on 21 April 2022).
- Eurostat Database, [ILC_MDES07__custom_3021084]. Available online: https://ec.europa.eu/eurostat/data/database (accessed on 5 July 2022).
- Eurostat Database, [SDG_08_10]. Available online: https://ec.europa.eu/eurostat/data/database (accessed on 21 April 2022).
- Eurostat Database, [TEN00117]. Available online: https://ec.europa.eu/eurostat/data/database (accessed on 21 April 2022).
- Eurostat Database, [T2020_RD310]. Available online: https://ec.europa.eu/eurostat/data/database (accessed on 21 April 2022).
- Eurostat Database, [ILC_MDHO01__custom_3035655]. Available online: https://ec.europa.eu/eurostat/data/database (accessed on 11 July 2022).
- Eurostat Database, [NRG_CHDD_A__custom_3049038]. Available online: https://ec.europa.eu/eurostat/data/database (accessed on 11 July 2022).
- Eurostat Database, [ILC_LVHO01]. Available online: https://ec.europa.eu/eurostat/data/database (accessed on 21 April 2022).
- Eurostat Database, [LFSA_EGAN2__custom_2550591]. Available online: https://ec.europa.eu/eurostat/data/database (accessed on 21 April 2022).
- Eurostat Database, [ILC_LI43]. Available online: https://ec.europa.eu/eurostat/data/database (accessed on 21 April 2022).
- Eurostat Database, [ILC_LI02__custom_2551064]. Available online: https://ec.europa.eu/eurostat/data/database (accessed on 21 April 2022).
- Eurostat Database, [ILC_DI17__custom_2550690]. Available online: https://ec.europa.eu/eurostat/data/database (accessed on 21 April 2022).
- Eurostat Database, [ILC_DI03__custom_2550714]. Available online: https://ec.europa.eu/eurostat/data/database (accessed on 21 April 2022).
- Gołasa, P.; Wysokiński, M.; Bieńkowska-Gołasa, W.; Gradziuk, P.; Golonko, M.; Gradziuk, B.; Siedlecka, A.; Gromada, A. Sources of Greenhouse Gas Emissions in Agriculture, with Particular Emphasis on Emissions from Energy Used. Energies 2021, 14, 3784. [Google Scholar] [CrossRef]
- Zwęglińska-Gałecka, D. Rural Gentrification in Central and Eastern Europe. Pol. Sociol. Rev. 2021, 4, 533–551. [Google Scholar] [CrossRef]
Figure 1.
Energy poverty across the EU member states. Source: own research based on Eurostat data [81,82,83].

Figure 2.
Main determinants of energy poverty across EU member states. Source: own research based on Eurostat data [84,85,86,87,88].

Figure 3.
Rural specificity of the EU member states. Source: own research based on Eurostat data [89,90].

Figure 4.
Rural–urban divide across the EU member states. Source: own research based on Eurostat data [91,92,93,94].


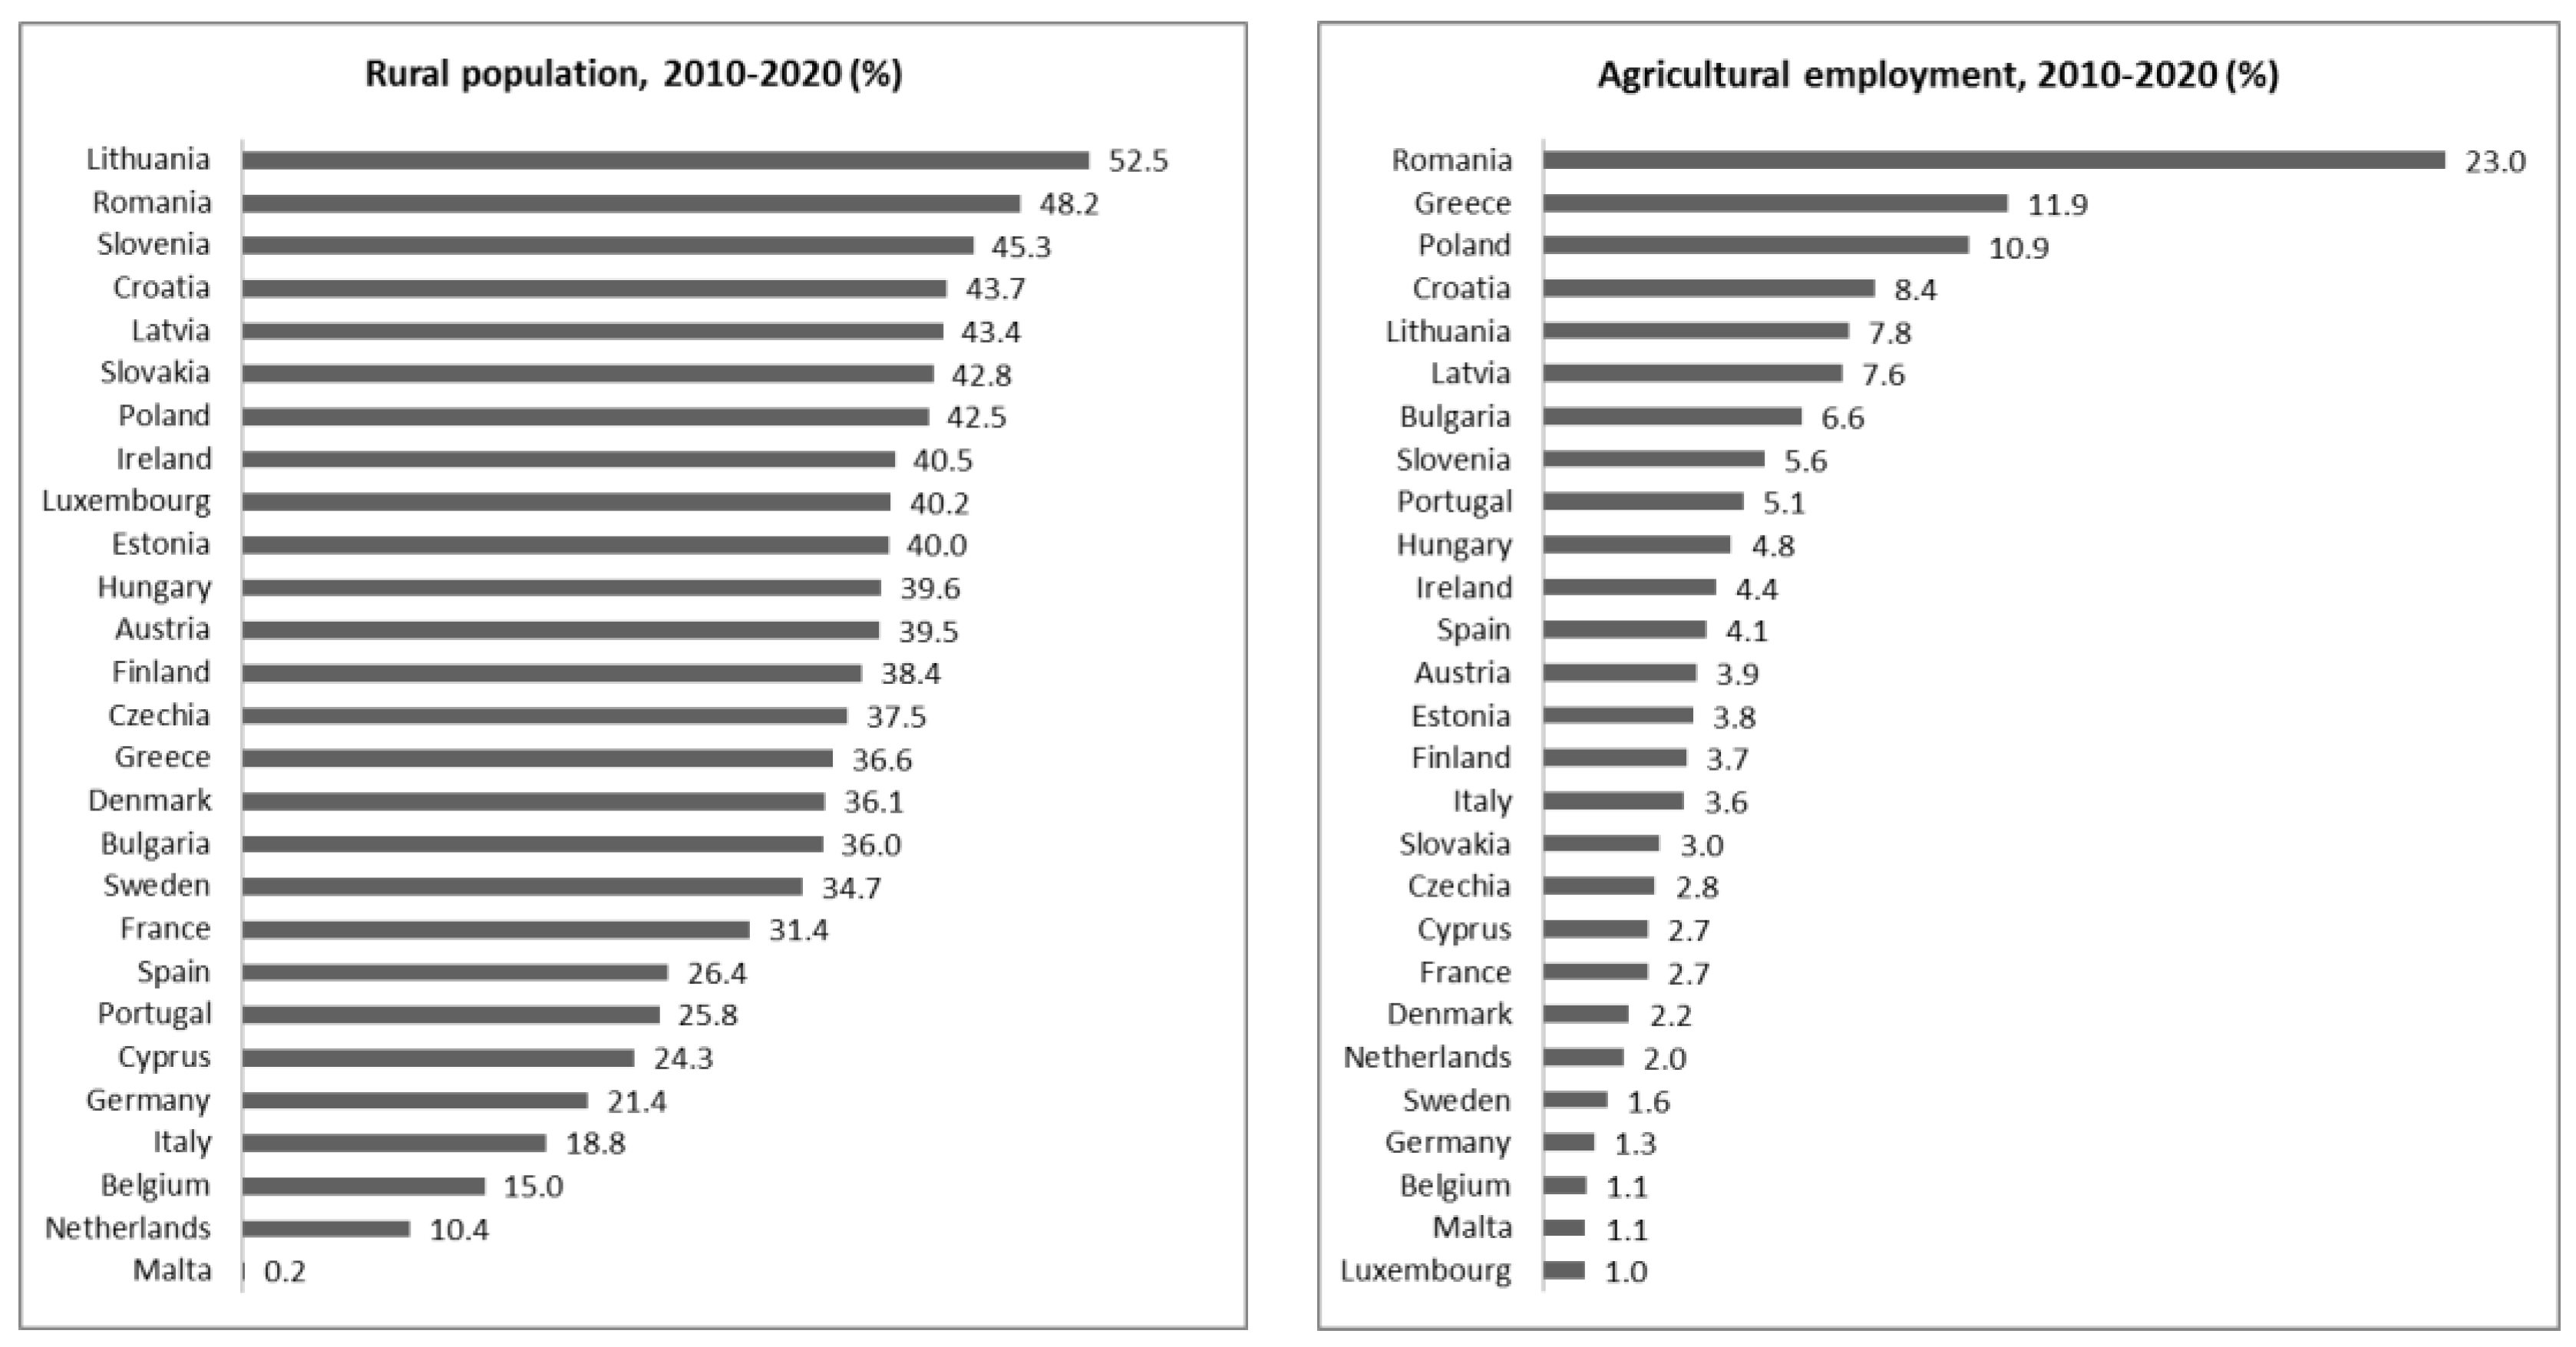
Table 1.
Descriptive statistics.
| Avg. | SD | V (%) | Min | Max | Obs. | |
|---|---|---|---|---|---|---|
| e_cons | 575.5 | 194.7 | 33.8 | 165.0 | 1084.0 | 297 |
| un_khw | 10.67 | 10.42 | 97.7 | 0.50 | 66.50 | 297 |
| arr_ub | 10.94 | 8.84 | 80.8 | 1.5 | 42.2 | 297 |
| gdp_pc | 25,502 | 16,798 | 65.9 | 5080 | 85,030 | 297 |
| elec_pr | 0.1760 | 0.0527 | 30.0 | 0.0813 | 0.3126 | 297 |
| e_prod | 6.83 | 3.27 | 47.9 | 2.03 | 22.61 | 297 |
| p_dwell | 15.5 | 6.7 | 43.1 | 4.1 | 39.1 | 297 |
| h_d_d | 2783 | 1155 | 41.5 | 322 | 6180 | 297 |
| rur_pop | 33.8 | 13.6 | 40.2 | 0.1 | 62.5 | 297 |
| agr_emp | 5.1 | 4.6 | 91.6 | 0.6 | 27.7 | 297 |
| r-t_pov | 1.141 | 0.251 | 22.0 | 0.176 | 2.152 | 289 |
| r-t_med_inc | 0.923 | 0.074 | 8.0 | 0.668 | 1.159 | 289 |
Table 2.
Specification of the model estimation technique.
| Model | p-Value for BP Test | p-Value for Hausman Test | Final Estimation Method |
|---|---|---|---|
| 1 | 1.5307e-236 | 0.00683412 | FE |
| 2 | 2.44976e-236 | 0.0165556 | FE |
| 3 | 1.15253e-237 | 0.0145019 | FE |
| 4 | 8.58555e-180 | 0.000428332 | FE |
| 5 | 1.21043e-196 | 0.000839978 | FE |
| 6 | 3.63101e-172 | 9.26643e-005 | FE |
| 7 | 2.76464e-198 | 0.000852492 | FE |
| 8 | 7.67247e-210 | 0.00741825 | FE |
| 9 | 1.65407e-213 | 0.0231799 | FE |
| 10 | 1.59041e-213 | 0.00455749 | FE |
| 11 | 7.99995e-155 | 0.000700745 | FE |
| 12 | 6.46719e-188 | 0.0487094 | FE |
| 13 | 4.45852e-128 | 5.33699e-006 | FE |
| 14 | 1.0051e-181 | 0.00666546 | FE |
| 15 | 3.16392e-155 | 4.36064e-005 | FE |
| 16 | 4.33304e-158 | 0.000190374 | FE |
| 17 | 1.01015e-171 | 3.16637e-005 | FE |
| 18 | 1.7599e-143 | 2.83484e-005 | FE |
| 19 | 2.14867e-143 | 6.653e-005 | FE |
| 20 | 7.03438e-160 | 1.04851e-005 | FE |
| 21 | 5.89726e-158 | 1.43626e-005 | FE |
Table 3.
Models of energy poverty estimations a.
| Model | Explained Variable | gdp_pc | elec_pr | e_prod | p_dwell | h_d_d | rur_pop | agr_emp | r-t_pov | r-t_med_inc | Const | Obs. | jtonr (p-Value) | LSDV R-sq | AIC |
|---|---|---|---|---|---|---|---|---|---|---|---|---|---|---|---|
| 1 | e_cons | 0.0074745 *** (0.0012) | −168.950 (0.2304) | −25.5939 *** (0.0001) | 0.0222922 (0.9859) | 0.0916561 *** (1.43e-07) | 333.966 *** (1.31e-07) | 297 | 1.94199e-010 | 0.980897 | 2861.49 | ||||
| 2 | e_cons | 0.0072306 *** (0.0017) | −162.261 (0.2367) | −25.0741 *** (0.0002) | 0.168469 (0.8909) | 0.0946293 *** (4.90e-07) | −0.442243 (0.4775) | 339.854 *** (7.65e-08) | 297 | 4.04194e-010 | 0.981077 | 2860.67 | |||
| 3 | e_cons | 0.0072127 *** (0.0006) | −216.504 (0.1205) | −26.5380 *** (4.65e-05) | 0.903097 (0.4181) | 0.0935118 *** (9.58e-08) | −596.292 * (0.0658) | 366.881 *** (8.37e-08) | 297 | 1.35723e-010 | 0.981577 | 2852.73 | |||
| 4 | e_cons | 0.0071858 *** (0.0033) | −154.821 (0.2675) | −25.3586 *** (0.0004) | 0.234535 (0.8526) | 0.0951199 *** (5.34e-07) | −0.519832 (0.4091) | 48.2935 (0.4814) | 303.819 *** (0.0006) | 289 | 7.9768e-010 | 0.978857 | 2793.07 | ||
| 5 | e_cons | 0.0071767 *** (0.0037) | −152.216 (0.2703) | −25.0644 *** (0.0003) | 0.227953 (0.8564) | 0.0953723 *** (8.31e-07) | −0.472779 (0.4528) | −5.42301 (0.6509) | 350.060 *** (2.71e-08) | 289 | 7.73602e-011 | 0.978818 | 2793.60 | ||
| 6 | e_cons | 0.0072094 *** (0.0011) | −211.131 (0.1355) | −26.8726 *** (0.0001) | 0.969870 (0.3932) | 0.0936615 *** (1.13e-07) | −615.729 * (0.0640) | 35.1354 (0.6071) | 342.296 *** (8.64e-05) | 289 | 4.93744e-010 | 0.979408 | 2785.43 | ||
| 7 | e_cons | 0.00717500 *** (0.0012) | −207.923 (0.1411) | −26.6119 *** (8.11e-05) | 0.980836 (0.3852) | 0.0941060 *** (1.37e-07) | −612.943 * (0.0615) | −5.77469 (0.6302) | 378.238 *** (5.92e-08) | 289 | 1.298e-010 | 0.979393 | 2785.65 | ||
| 8 | un_khw | −0.000860 *** (0.0059) | 11.6002 (0.5494) | 1.41413 ** (0.0279) | 0.335158 ** (0.0155) | 0.00245820 ** (0.0286) | 8.88248 (0.1707) | 297 | 0.00808684 | 0.914488 | 1567.75 | ||||
| 9 | un_khw | −0.000826 *** (0.0073) | 10.6533 (0.5919) | 1.34053 ** (0.0372) | 0.314463 ** (0.0158) | 0.00203728 ** (0.0360) | 0.0626083 (0.3106) | 8.04894 (0.2107) | 297 | 0.013039 | 0.915750 | 1565.33 | |||
| 10 | un_khw | −0.000823 *** (0.0063) | 18.2667 (0.3162) | 1.54648 ** (0.0190) | 0.211681 (0.1722) | 0.00219804 ** (0.0403) | 83.5918 ** (0.0481) | 4.26828 (0.4330) | 297 | 0.00233574 | 0.919150 | 1553.10 | |||
| 11 | un_khw | −0.000664 *** (0.0043) | 5.36736 (0.7876) | 0.939601 ** (0.0334) | 0.298694 ** (0.0192) | 0.00170536 * (0.0528) | 0.0614567 (0.2878) | 5.93521 (0.4092) | 3.06611 (0.7257) | 289 | 0.0142422 | 0.920240 | 1515.23 | ||
| 12 | un_khw | −0.000641 *** (0.0045) | 4.45814 (0.8216) | 0.963820 ** (0.0317) | 0.275591 ** (0.0268) | 0.00155778 * (0.0787) | 0.0829479 (0.1810) | 3.12081 (0.1075) | 4.41313 (0.4564) | 289 | 0.00454289 | 0.921185 | 1511.79 | ||
| 13 | un_khw | −0.000662 *** (0.0036) | 12.8749 (0.4840) | 1.13718 ** (0.0139) | 0.195369 (0.2155) | 0.00184581 * (0.0576) | 83.7209 * (0.0570) | 7.14289 (0.4258) | −1.79728 (0.8409) | 289 | 0.00349784 | 0.923801 | 1502.03 | ||
| 14 | un_khw | −0.000650 *** (0.0038) | 13.0210 (0.4668) | 1.21122 ** (0.0126) | 0.168444 (0.2740) | 0.00183543 * (0.0739) | 91.2293 ** (0.0337) | 3.03984 (0.1545) | 0.534768 (0.9210) | 289 | 0.00138405 | 0.924584 | 1499.05 | ||
| 15 | arr_ub | −0.000682 *** (0.0044) | 26.3470 (0.2045) | 0.387050 (0.3666) | 0.428742 ** (0.0124) | 0.00166940 ** (0.0419) | 9.79231 (0.1367) | 297 | 0.000310217 | 0.911360 | 1480.60 | ||||
| 16 | arr_ub | −0.000665 *** (0.0055) | 25.8577 (0.2217) | 0.349026 (0.4244) | 0.418050 ** (0.0132) | 0.00145192 * (0.0780) | 0.0323483 (0.4852) | 9.36164 (0.1429) | 297 | 0.000505791 | 0.911829 | 1481.03 | |||
| 17 | arr_ub | −0.000616 *** (0.0029) | 38.3989 * (0.0606) | 0.626320 (0.1589) | 0.205514 (0.1796) | 0.00119908 * (0.0921) | 151.122 *** (5.84e-08) | 1.45047 (0.7408) | 297 | 6.03756e-017 | 0.932542 | 1401.50 | |||
| 18 | arr_ub | −0.000705 *** (0.0086) | 30.3738 (0.1627) | 0.406390 (0.4038) | 0.422857 ** (0.0143) | 0.00154835 * (0.0689) | 0.0335982 (0.5115) | −2.93885 (0.6724) | 11.4672 (0.1972) | 289 | 0.00139547 | 0.914488 | 1442.55 | ||
| 19 | arr_ub | −0.000704 *** (0.0089) | 30.1918 (0.1631) | 0.388263 (0.4102) | 0.422833 ** (0.0131) | 0.00152959 * (0.0713) | 0.0310345 (0.5036) | 0.402272 (0.7664) | 8.57053 (0.2539) | 289 | 0.00164889 | 0.914434 | 1442.73 | ||
| 20 | arr_ub | −0.000651 *** (0.0050) | 42.7463 ** (0.0407) | 0.695095 (0.1544) | 0.206999 (0.1723) | 0.00131432 * (0.0741) | 152.017 *** (4.54e-08) | −5.66164 (0.1225) | 5.75043 (0.2817) | 289 | 2.03415e-015 | 0.935283 | 1362.02 | ||
| 21 | arr_ub | −0.000643 *** (0.0054) | 42.1723 ** (0.0423) | 0.655455 (0.1746) | 0.201942 (0.1805) | 0.00123132 * (0.0930) | 152.351 *** (3.79e-08) | 1.40604 (0.2396) | −0.602528 (0.9142) | 289 | 7.52445e-016 | 0.935300 | 1361.95 |
Publisher’s Note: MDPI stays neutral with regard to jurisdictional claims in published maps and institutional affiliations. |
© 2022 by the authors. Licensee MDPI, Basel, Switzerland. This article is an open access article distributed under the terms and conditions of the Creative Commons Attribution (CC BY) license (https://creativecommons.org/licenses/by/4.0/).
Share and Cite
MDPI and ACS Style
Cyrek, M.; Cyrek, P. Rural Specificity as a Factor Influencing Energy Poverty in European Union Countries. Energies 2022, 15, 5463. https://doi.org/10.3390/en15155463
AMA Style
Cyrek M, Cyrek P. Rural Specificity as a Factor Influencing Energy Poverty in European Union Countries. Energies. 2022; 15(15):5463. https://doi.org/10.3390/en15155463
Chicago/Turabian StyleCyrek, Magdalena, and Piotr Cyrek. 2022. "Rural Specificity as a Factor Influencing Energy Poverty in European Union Countries" Energies 15, no. 15: 5463. https://doi.org/10.3390/en15155463
Note that from the first issue of 2016, this journal uses article numbers instead of page numbers. See further details here.