
Growing Crops in Arid, Drought-Prone Environments: Adaptation and Mitigation


1
Centro de Investigaciones Socioeconómicas CISE, Universidad Autónoma de Coahuila, Saltillo 25280, Mexico
2
Vancouver School of Economics VSE, University of British Columbia, Vancouver, BC V6T 1L4, Canada
*
Author to whom correspondence should be addressed.
Hydrology 2022, 9(8), 129; https://doi.org/10.3390/hydrology9080129
Submission received: 29 May 2022
/
Revised: 15 July 2022
/
Accepted: 19 July 2022
/
Published: 22 July 2022
(This article belongs to the Special Issue Drought and Water Scarcity: Monitoring, Modelling and Mitigation)
Abstract
:Drought poses significant risks to society, in particular irrigated-crop production, which accounts for a large share of global freshwater use. Given its key role in the production of food, feed and fiber crops, there exists a need for policy measures to prevent and mitigate the impacts of drought on irrigated agriculture. This paper proposes that the design of drought policy should take into account actual farmer behavior in response to water scarcity. To this end, we offer a detailed analysis of land allocation and crop-choice decisions over time in an irrigation district located in the dry plains of Northern Mexico. We find that farmers systematically change their crop mix in response to water availability. In particular, in times of drought, irrigation water flows to higher-yield and higher-price crops (which also require more intense irrigation) to the detriment of less water-demanding (but lower value) crops. Farmers use water with the goal of earning a living—economizing on water per se has no relevance in that context. Policies that do not explicitly recognize this may result in ineffective, inefficient and/or unfair outcomes.
1. Introduction
How should crop producers adapt to water scarcity? In particular, how should they mitigate the impacts of exceptionally low water availability, i.e., drought? This paper addresses this normative issue of importance for policy design based on the following positive premise: effective, efficient and fair water and drought policies require an understanding of how crop producers actually deal with water scarcity and drought.
To this end, the paper presents an empirical analysis of production records for a large irrigation district located in the dry plains of northern Mexico, over a two-decade period of time. The data-driven exercise focuses on land-use decisions and the mix of crops chosen by producers in the face of variable irrigation-water availability. Results show that producers have developed various responses to deal with water scarcity and drought.
Although the literature on water and agriculture is extensive, crop producers’ adaption and mitigation responses to variability in water availability and drought—the central contribution of this paper—have received scant attention. Three issues dealt with in the literature hold importance for this paper: the impacts of water markets on crop production, the economic value of irrigation water and agricultural land and water planning.
Water markets in principle should expand producers’ options in terms of land and water use. In an empirical study comparing Texas counties (one group with an agricultural water market, the other group without), [1] finds that water markets promote the reallocation of water away from crops that generate relatively less revenue per unit of water, especially in times of drought. Field work in the Limari Valley (Chile) irrigated-crop-production system, over the course of an agricultural season in a drought year, leads [2] to conclude that prices in the local water market are driven by producers dedicated to high-value perennial crops (e.g., grapes). This paper argues that the adaptation and mitigation responses we identify in our region of study crucially depend on the existence of a water market, which would be deserving of an in-depth study of farmers’ and other stakeholders’ attitudes and perceptions, along the lines of a survey carried out in southern Spain [3].
The economic value of irrigation water has attracted attention for water policy, in particular as a criterion for allocating water among distinct users. For example, a recent global-scale study [4] suggests that the actual distribution of crops does not maximize agricultural-water value in much of the world and [5] uses the economic value of irrigation water to put a price on in-stream river flows. This paper uses a simple descriptive measure of the economic value of irrigation water, for the purpose of assessing the performance of irrigators’ adaption and mitigation responses to water scarcity.
The agricultural land- and water-planning literature focuses on proposing optimizing solutions for the use resources, for example, in order to mitigate the impact of climate change [6], to increase crop yields [7] or to minimize the environmental and social impacts of irrigated agriculture [8]. These studies typically rely on numerical simulations; in contrast, the work presented here is based on the analysis of actual production data, which could provide a solid baseline scenario for further optimization/simulation work.
Mexico currently ranks as the 10th-most-populous country in the world, with over 130 million inhabitants in 2021 [9]. The physical geography and climate of its vast territory (1.96 million square kilometers, 14th in size globally) present significant challenges for agriculture, in particular the predominance of mountainous terrain and arid or semi-arid climate conditions. In this context, irrigation has proved vital for agriculture. Moreover, it has allowed Mexico to become a major producer and exporter of agricultural goods—for a full, up-to-date review of the travails and accomplishments of the country’s agricultural sector, see [10]. This paper focuses on one of the 86 irrigation districts operating in the country on a total area of 3.3 million hectares of irrigable land.
The rest of the paper is organized as follows. Section 2 describes the region of study, including its climate and water-availability characteristics, and defines the exploratory, data-driven research approach adopted in this paper. Section 3 presents and interprets the results obtained on irrigators’ behavior in the face of variability in water availability. Section 4 discusses these results in light of their relevance for water and drought policy, before the paper concludes.
2. Materials and Methods
2.1. Region of Study
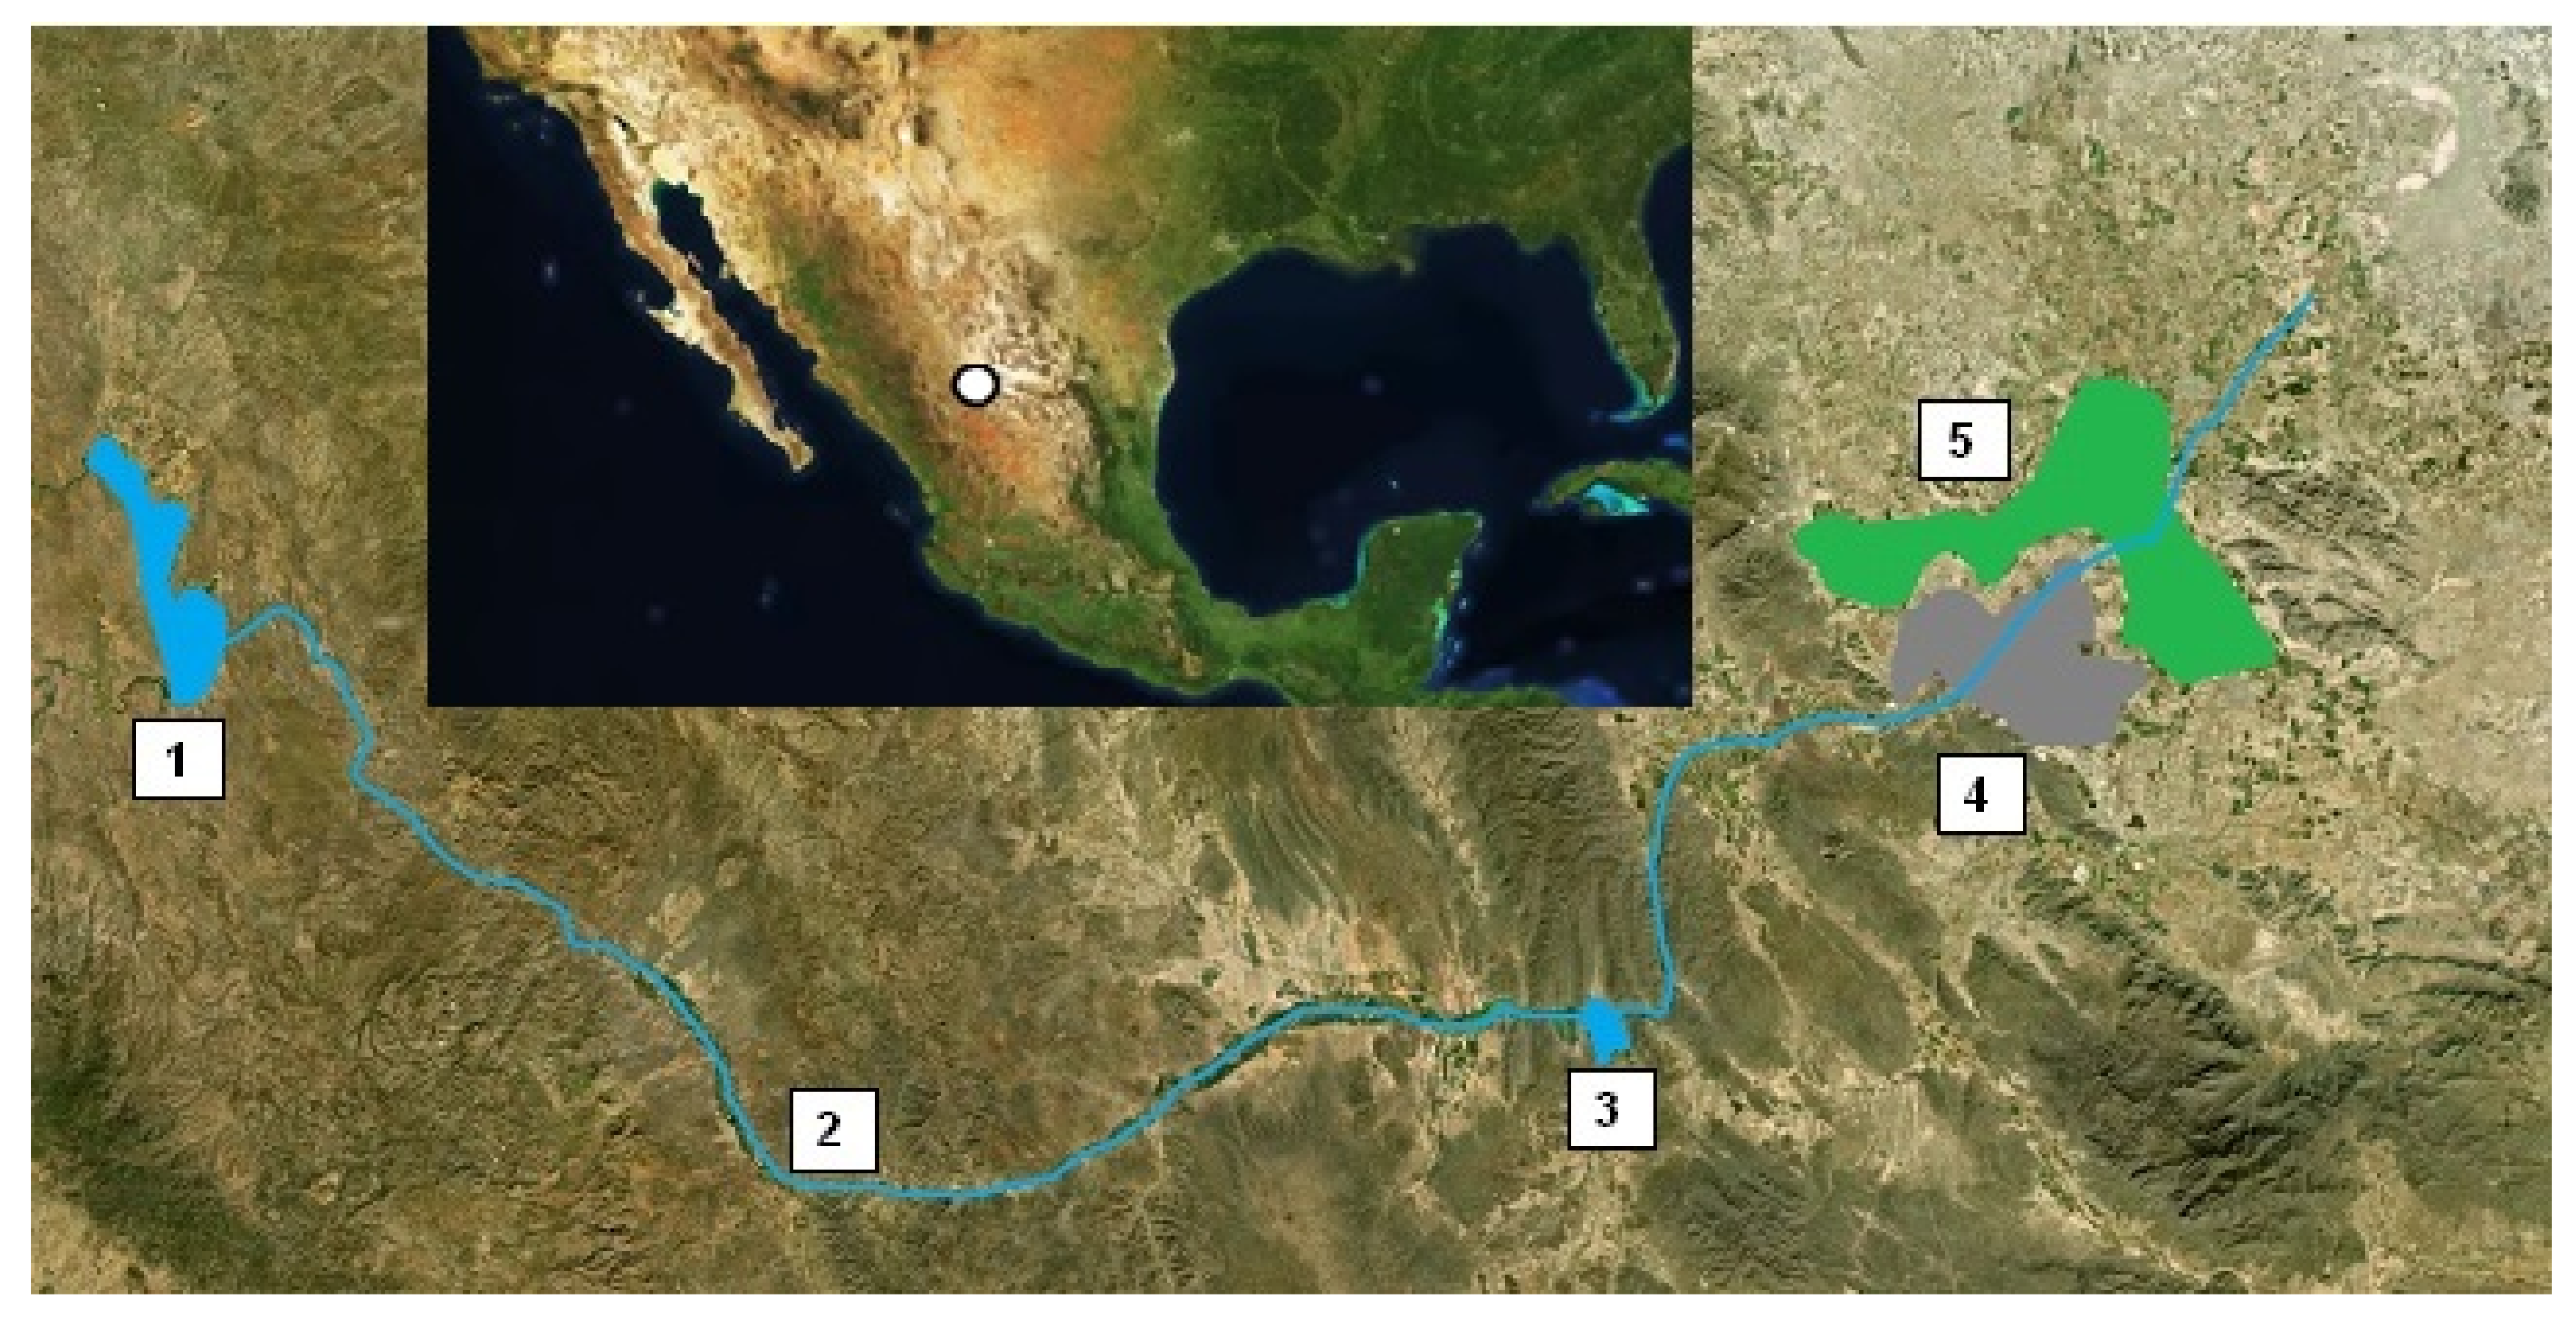
Located in the dry plains of orthern Mexico, Irrigation District 017 (officially designated as Distrito de Riego 017 Comarca Lagunera) produces a variety of feed, fiber and food crops for local, national and export markets. The District’s 72,000 hectares straddle the states of Coahuila and Durango, in the lower part of the endorheic (closed) Nazas River Basin. Local precipitation, at about 200 mm per year on average, is insufficient for rainfed farming in the District. For irrigation purposes, producers depend entirely on run-off generated in the more humid upper part of the basin. The Lázaro Cárdenas dam/reservoir, with a capacity of 2873 million cubic meters, provides almost all of this water, which flows downslope through the Nazas River for about 220 km to feed the District’s canal system. On its way, the river meets the relatively small Francisco Zarco dam/reservoir, which mostly functions as a regulating buffer (Figure 1).
Situated in the vicinity of an urban area of 1.2 million inhabitants, formed by the contiguous municipalities of Torreón, Lerdo and Gómez Palacio, the District plays a key role in the local and regional economy. The region also hosts a large livestock industry—with more than 900,000 heads of dairy and beef cattle as of 2020—and is home to one of the biggest dairy and meat products conglomerates in Latin America, Grupo Lala.
The Upper Nazas River Basin—the source of water for Irrigation District 017—consists of more than 18,000 square kilometers of rugged, mountainous terrain with peaks of up to 3300 m above sea level. Precipitation varies from year to year as well as spatially within the area (historical yearly averages range from 350 mm to 900 mm), and a previous study of long-term meteorological data [11] reveals numerous episodes of severe droughts over the past century—of particular relevance here, from the late 1990s to the early 2000s and again in the early 2010s.
Inter-annual variability in precipitation modulates the run-off captured by the Lázaro Cárdenas dam/reservoir, located within the upper basin at just under 1600 m above sea level. Over the period 1998–2018, beginning-of-year storage in the reservoir has averaged 1726.3 million cubic meters. Yearly figures have fluctuated widely around that average, with periods of relative scarcity up to 2004 and again in 2013, as well as relative abundance for the three consecutive years of 2009–2011 (Figure 2). For crop producers, water-storage variability in the reservoir translates into variable availability of irrigation water from year to year, which makes District 017 an adequate object of study for this paper.
2.2. Data Exploration and Interpretation
In order to analyze adaptation and mitigation behavior in District 017 in response to variable water availability, the paper follows a data-driven approach. First, we formulate two specific questions: how do producers adjust their land use and crop mix in response to water availability? In addition, how effective are these responses in terms of the District’s agronomic and economic performance? The paper proceeds with an exploration of the District’s production data record for the 1998–2018 period, in order to identify patterns and trends of interest and derive interpretations.
To address the first question, we explore the relationships over time between the volume of water delivered to the District and the surface of land irrigated (taking into account the District’s fixed land capacity), as well as the crop mix within the surface of land irrigated. Patterns identified are then interpreted in light of the crops’ distinct water requirements, yields (tons produced per hectare) and value (price per ton).
To address the second question, we analyze trends in crop yields (including crop failure events), revenue generated per hectare of cultivated land and revenue generated per unit of irrigation water. Additionally, we explore possible linkages between the District’s feed-crop output and two important downstream regional industries: dairy and beef cattle and milk production.
All data employed to develop this paper originate from annual reports published by official sources, which are in the public domain and are freely available on-line. In the case of the District’s production records, the source is Mexico’s federal water authority, as cited in [6]. For data on the cattle and dairy industries, the source is Mexico’s federal agricultural authority, as cited in [8,9], respectively. Data used to produce the calculations, graphs and tables included in this paper are presented in Appendix A.
3. Results
This section presents the answers developed for the two previously formulated research questions, in sequence. In each case, the results are presented in lockstep with the research procedure described in the previous section.
3.1. Water Availability, Land Use and the Crop Mix
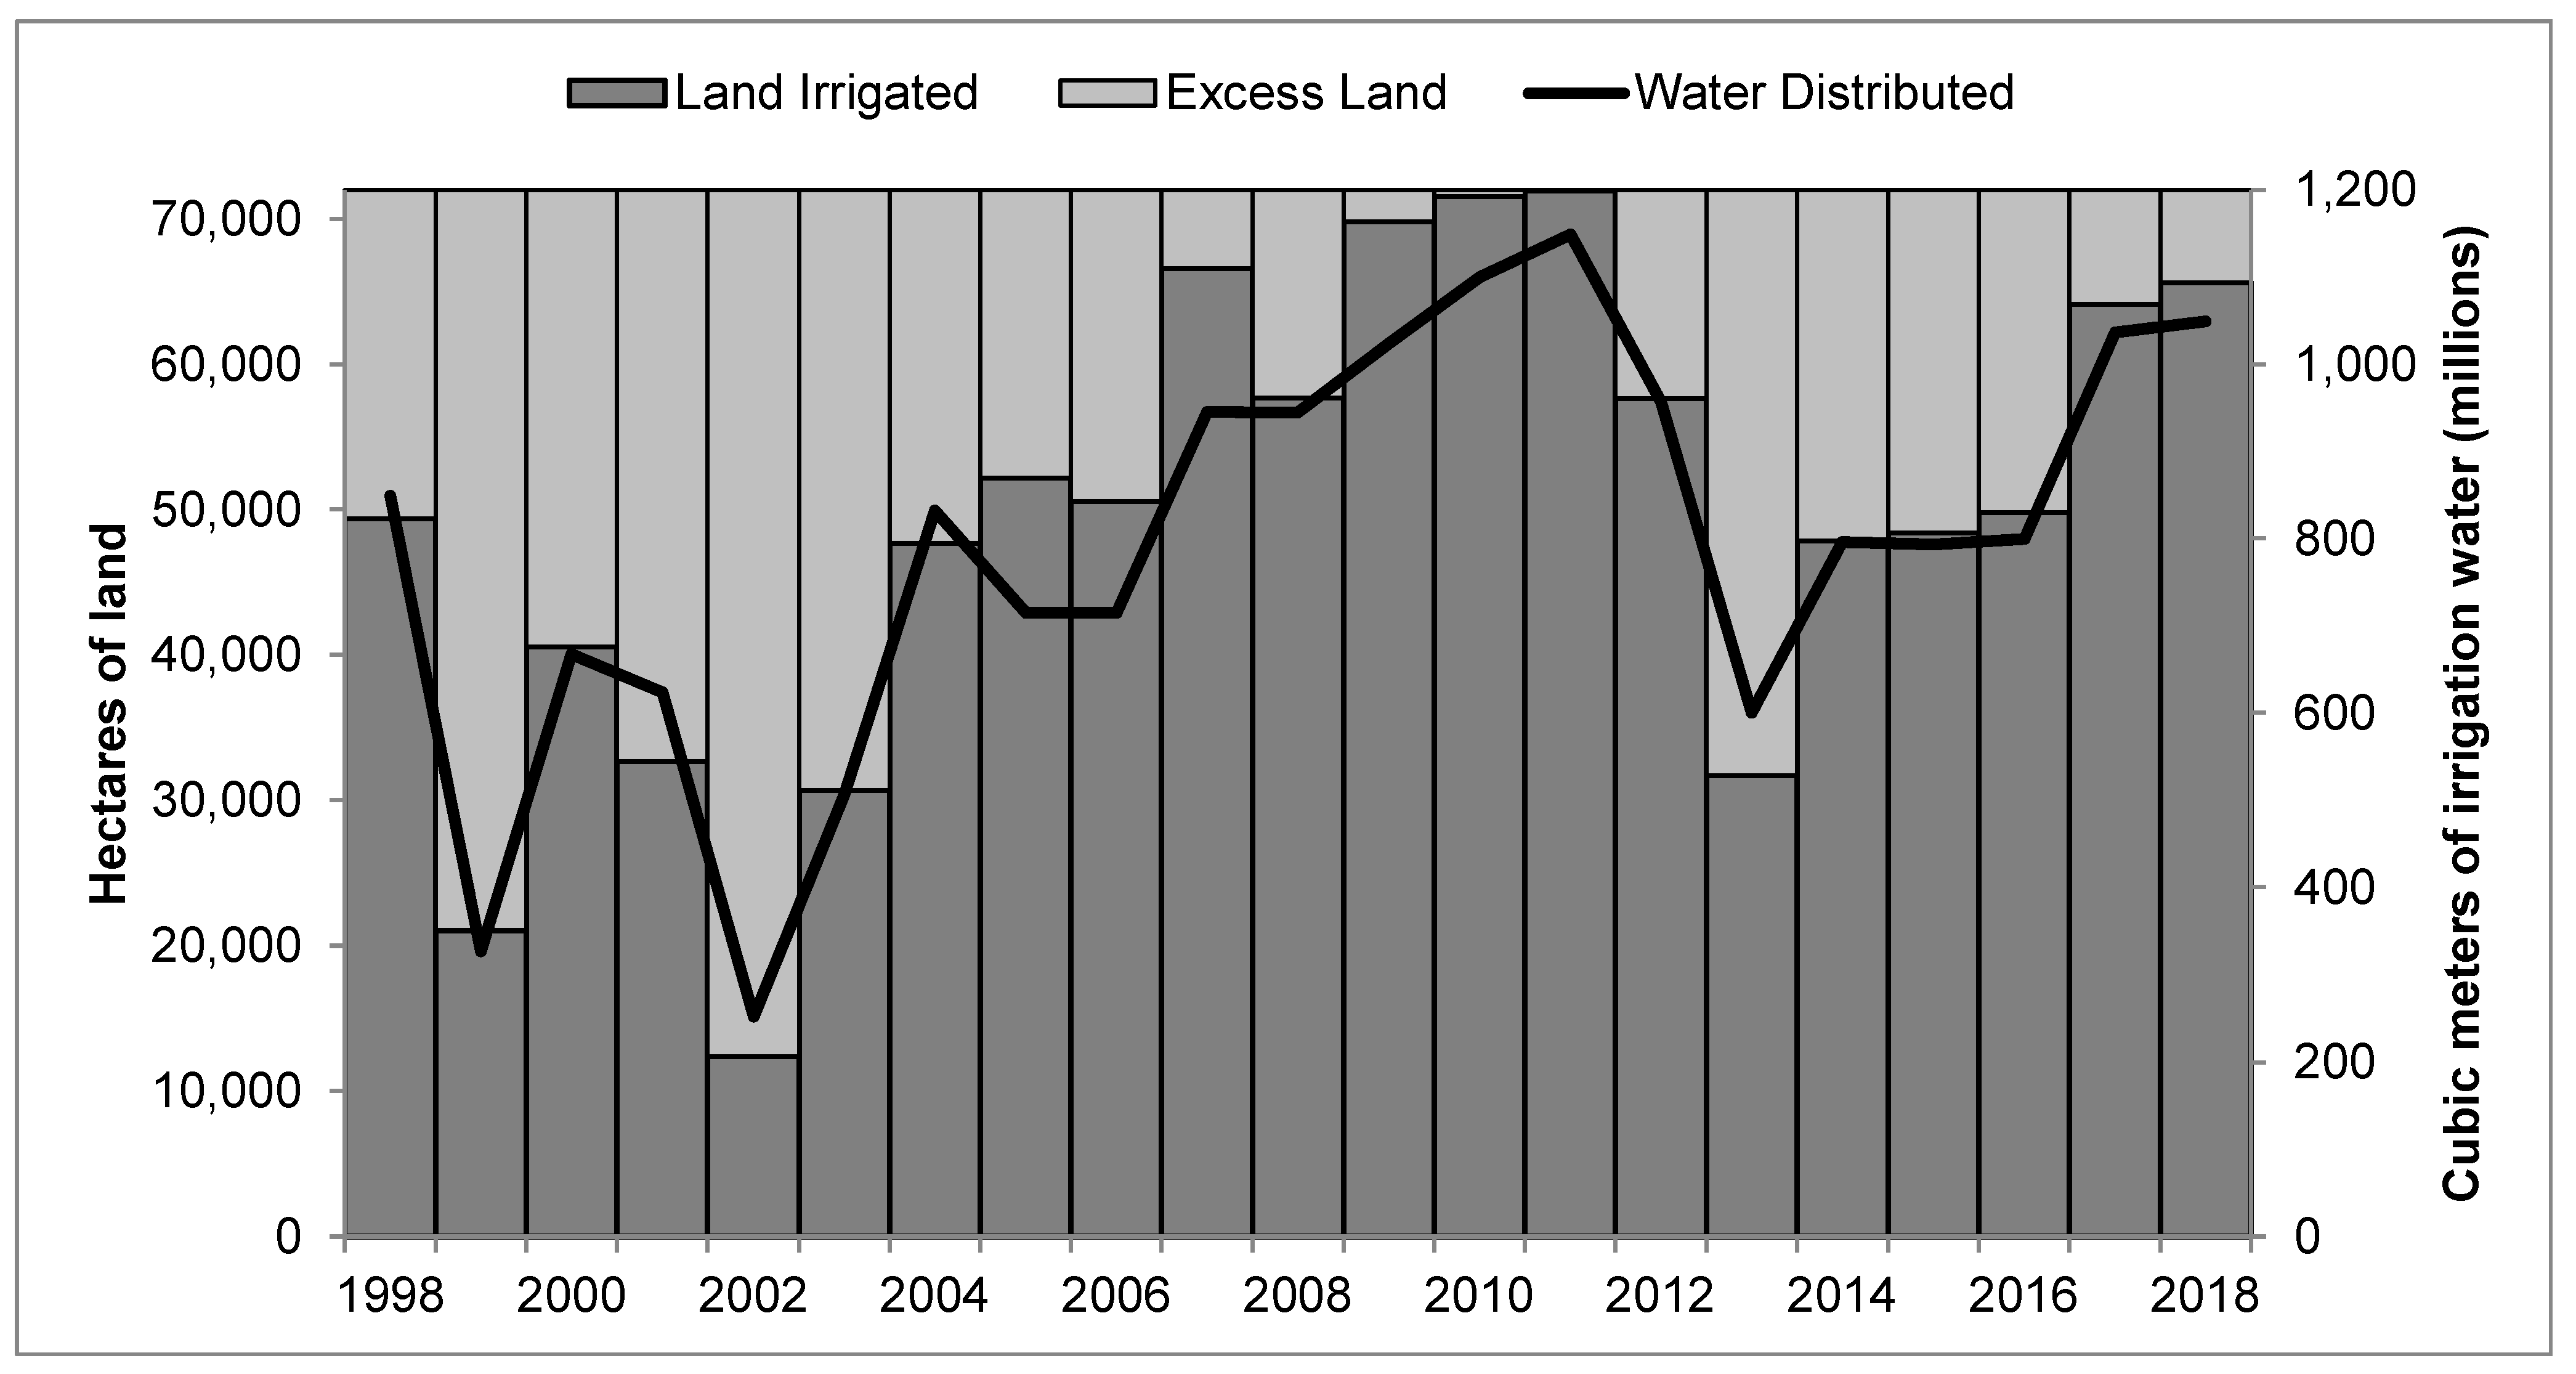
The volume of water distributed to the District in any given year depends on the amount of water stored in the reservoir, dam operating and management policies and conveyance losses. Over the 1998–2018 period, the water distributed and the surface of land irrigated have varied in close relation in the District (Figure 3). The District has tended to operate below its 72,000 hectares capacity (i.e., the maximum surface of irrigable land), suggesting water has proven scarce relative to land. In most years, a significant extent of excess land (i.e., land left uncultivated) is observed, except during the 2009–2011 period of relatively abundant water. In 2002, at the peak of drought, only 12,378 hectares received irrigation.
The tight relationship between water distributed and land irrigated (correlation coefficient of 0.97) suggests the District’s producers follow a simple rule to deal with water scarcity and variability, which consists of adjusting the surface of irrigated land in approximate proportion to the volume of water available. Further exploration of the data, however, reveals that, in addition, the mix of crops cultivated in the District also responds strongly to water availability.
The more than two dozen food, feed and fiber crops reported in the District’s production records for the 1998–2018 period fall into two main categories: seasonal and perennial. Cotton and two feed crops (corn green forage and sorghum) have dominated land use in the District. These three seasonal crops accounted for almost 70% of total cumulative land use during the 1998–2018 period. Two perennial crops (alfalfa grown for feed and walnut) cumulated a further 19% of land use. A handful of seasonal fruits and vegetables (watermelon, cantaloupe, green chili, red tomatoes and beans) accounted for half of the remaining 11% of cumulative land use in the District.
Year-to-year land use has differed widely for the two crop categories (Figure 4). The surface dedicated to perennial crops has tended to grow steadily over time, from 8500 hectares in 1998 to 12,300 hectares in 2018, albeit with fluctuations around that trend. In contrast, land for seasonal crops has varied widely and in close relationship with water available for irrigation (correlation coefficient of 0.96). The simple rule described earlier evidently includes a clause whereby seasonal crops bear the brunt of the adjustment of land with respect to water. Note that for both seasonal and perennial crops, the minimum in surface cultivated occurred in 2002, the year of maximum water scarcity.
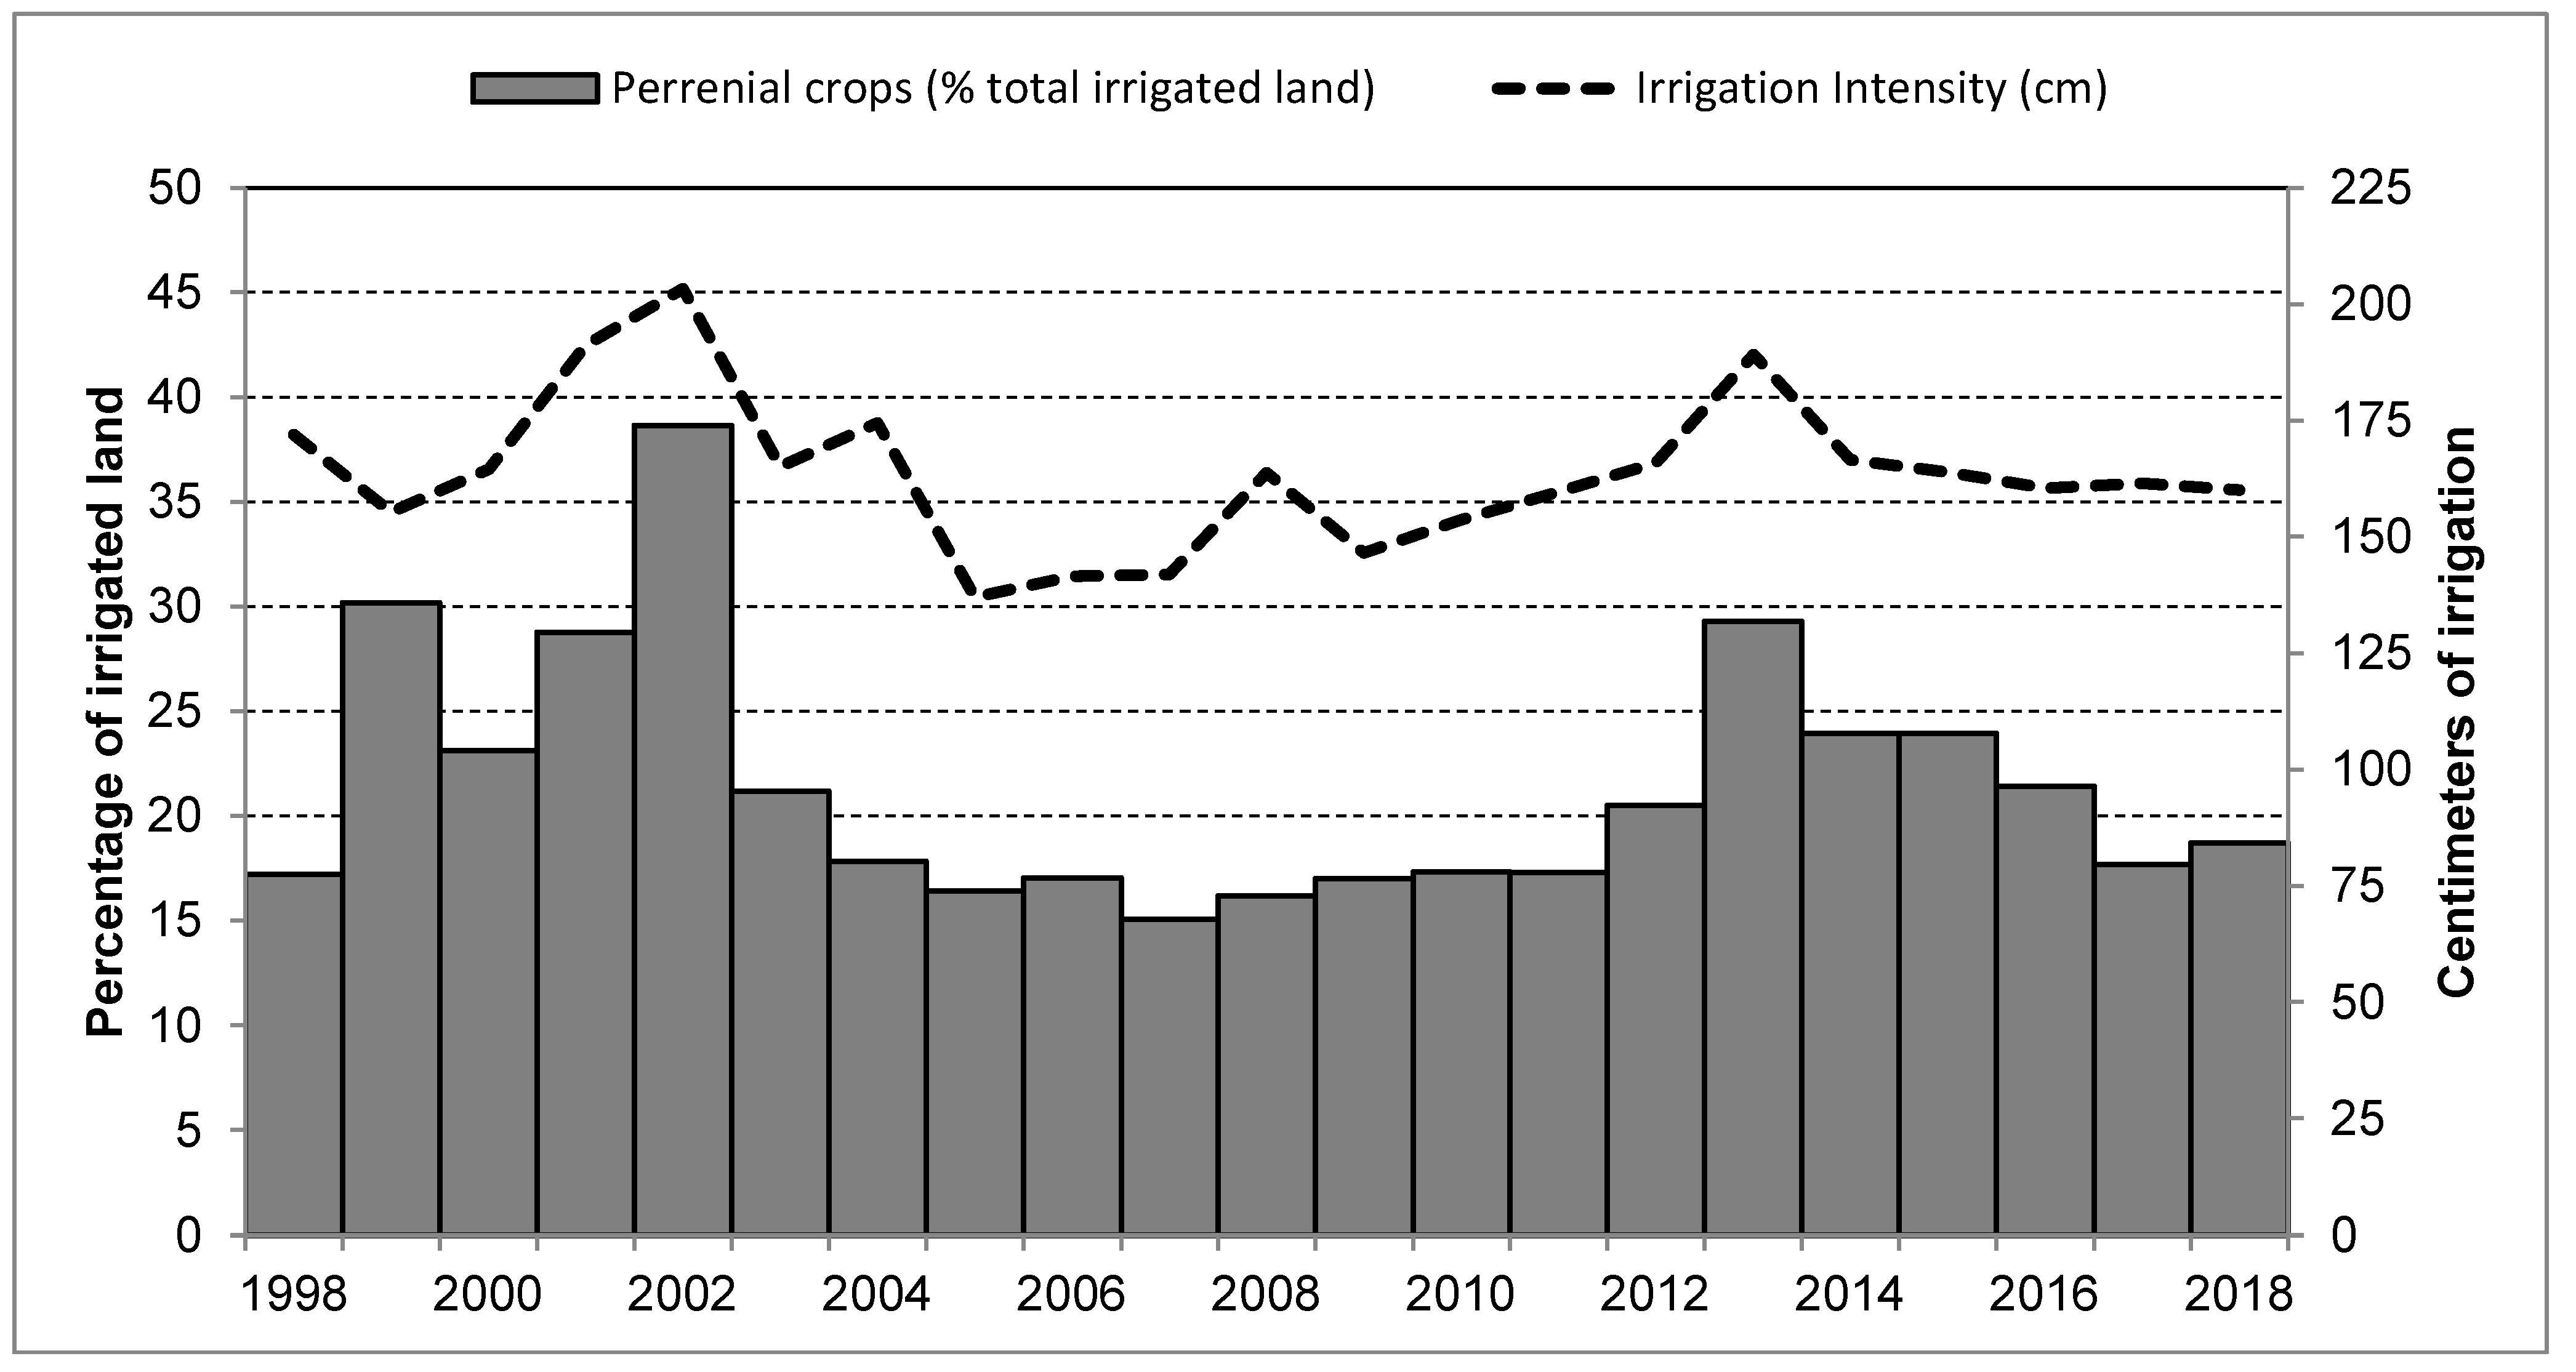
Distinct crops may have different irrigation requirements. In the District’s case, the perennial crops grown (e.g., walnut) tend to have higher water requirements than the seasonal crops (e.g., sorghum). Changes in the crop mix may, thus, affect irrigation intensity, i.e., the ratio of irrigation water per unit of land, expressed here as depth of water applied in centimeters—as a reference, consider that 1 cubic meter of water applied to 1 square meter of land means 100 cm of water. As shown below, the larger the percentage of land allocated to perennial crops is, the higher the irrigation intensity (Figure 5), a strong relationship with a correlation coefficient of 0.74. Irrigation intensity reached a maximum of 203.3 cm in 2002, the peak drought year, above the average of 163.7 cm registered during the 1998–2018 period.
Summing up, crop growers in Irrigation District 017 have adapted to their environment with a complex mechanism to manage variability in irrigation-water availability. First, water availability determines the total surface of land cultivated, more or less in a linear, one-to-one fashion. Underneath this seemingly simple reaction, changes in the crop mix show additional adaption and mitigation responses. In years of relative water abundance, a higher proportion of water is allocated to seasonal crops, and the land dedicated to these crops expands. In drought years, land under seasonal crops shrinks; land dedicated to perennial crops stays more or less constant, so that these crops receive a larger share of available water. Therefore, seasonal crops play the role of a buffer to absorb water shocks. Increased water scarcity causes a slightly more intense use of water per unit of cultivated land, as perennial crops have greater water requirements than seasonal crops. The existence of a water market in the District is crucial for these adaption and mitigation patterns, as the massive reallocations of water revealed in the data could not conceivably be implemented in its absence.
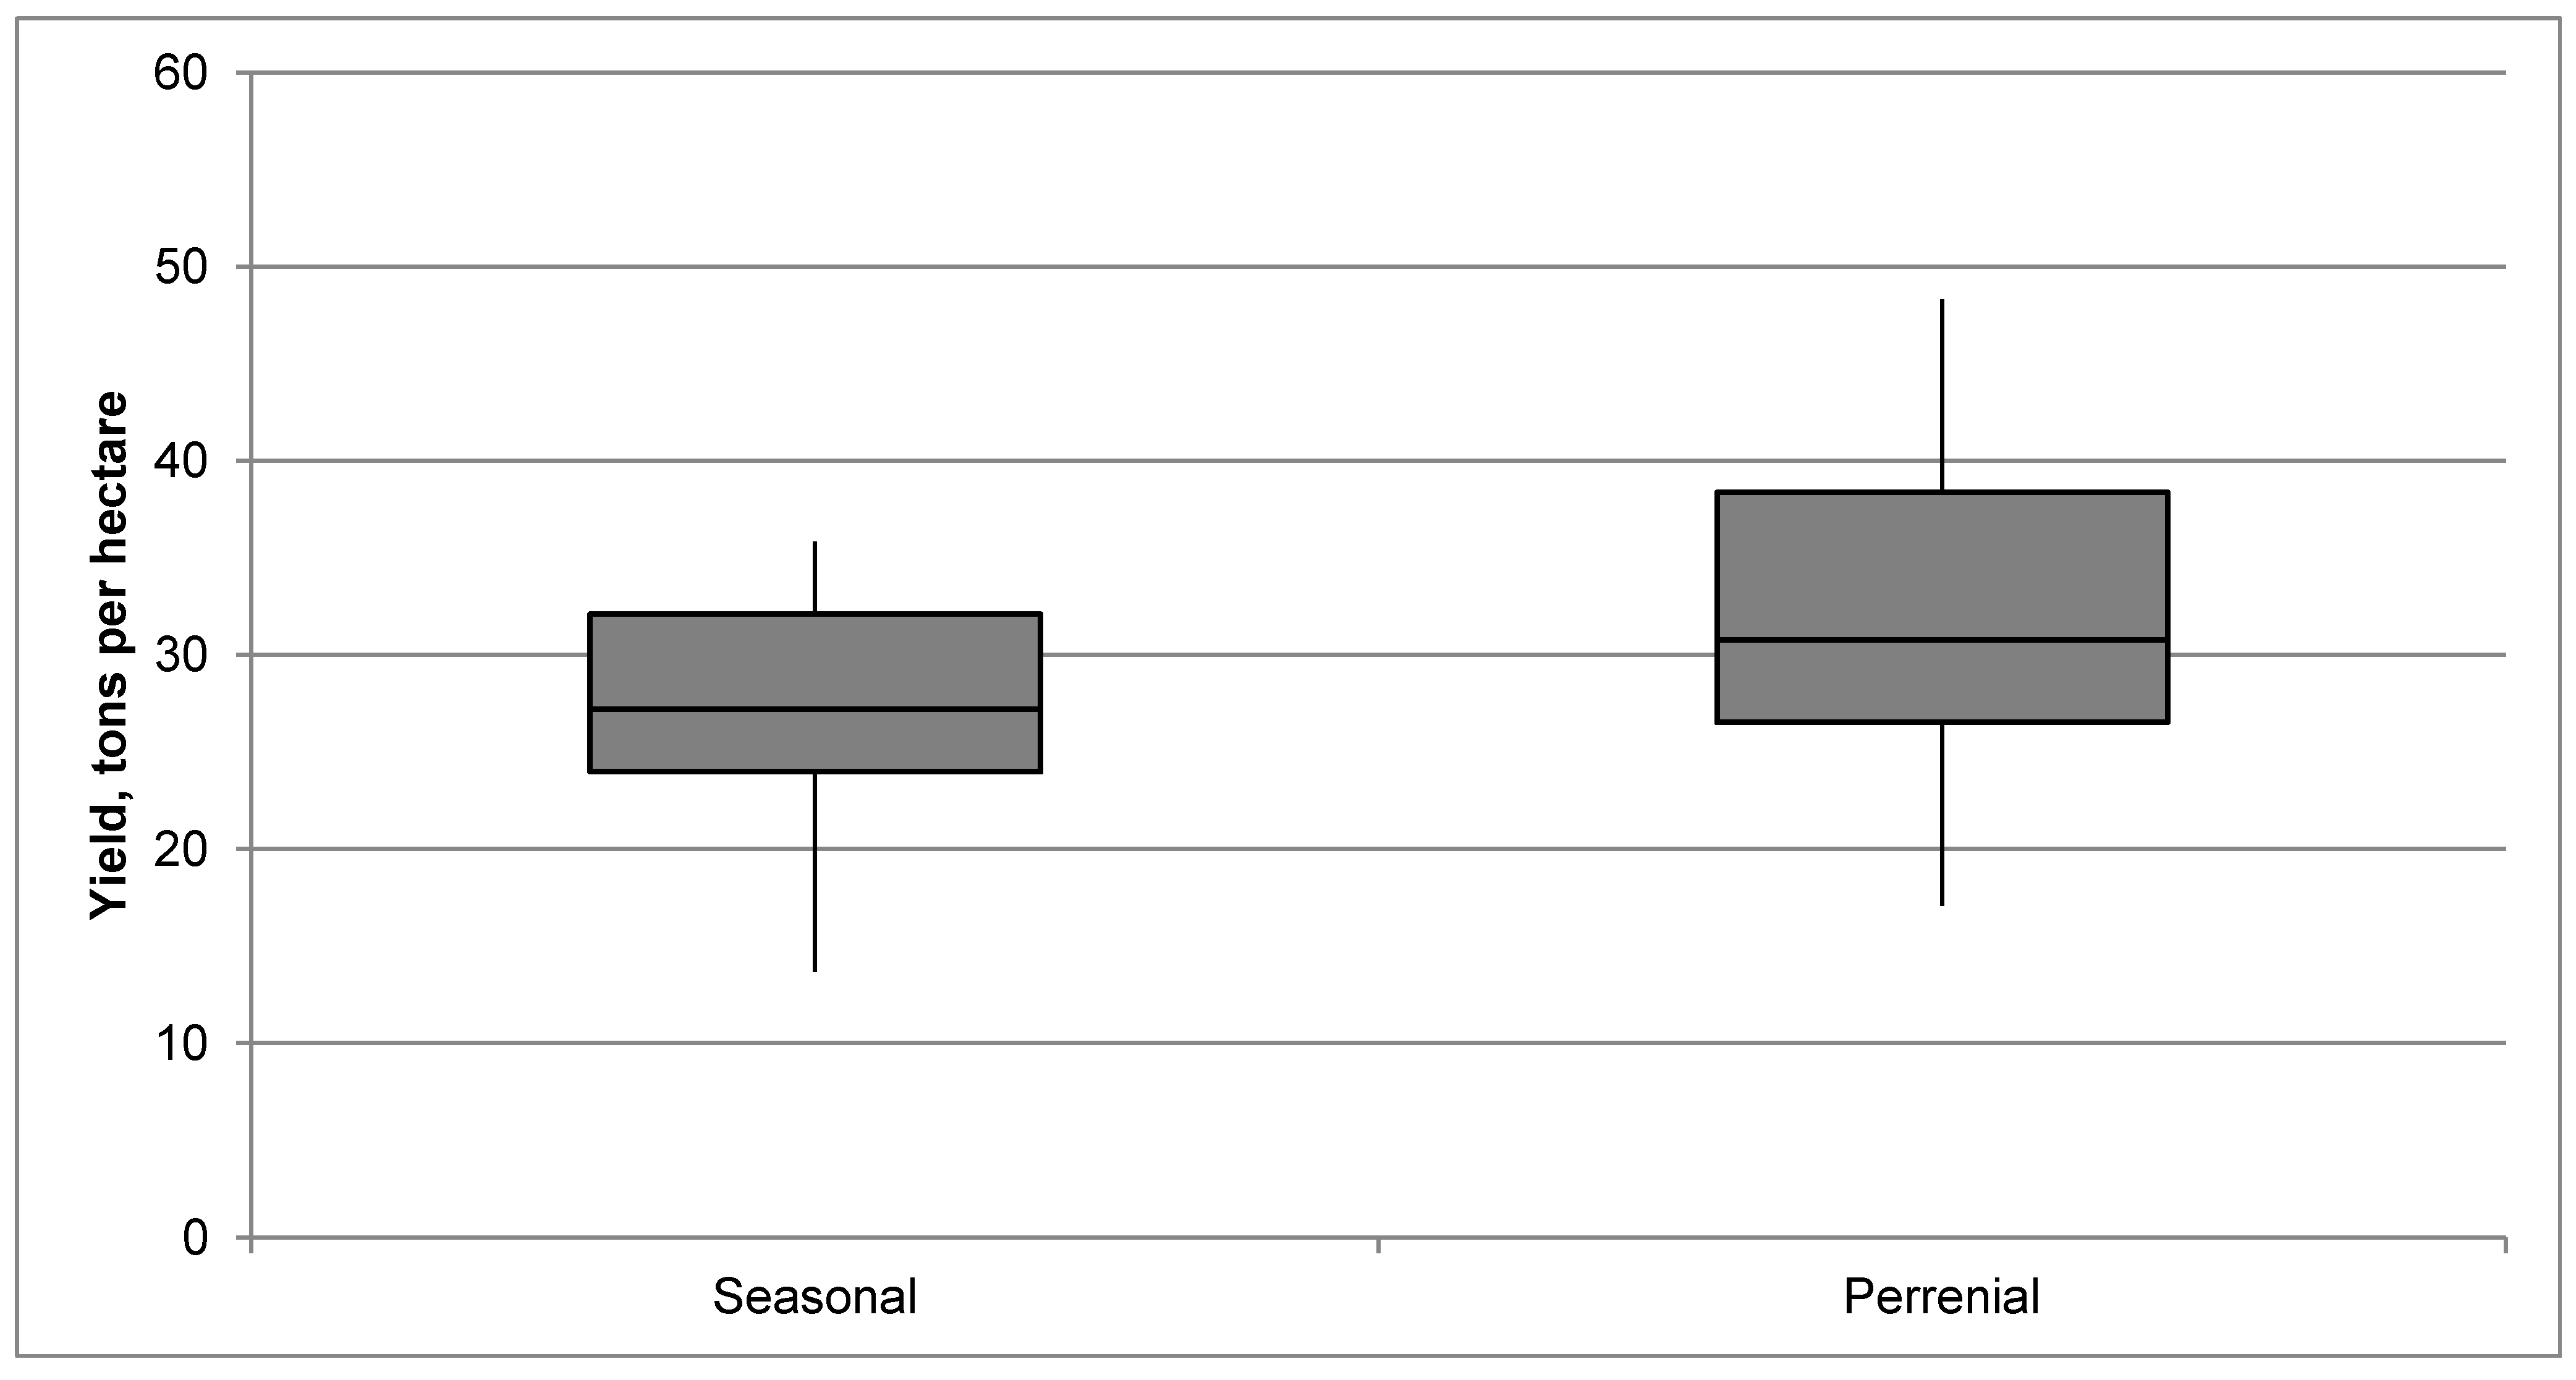
The logic behind the mechanism is two-fold. First, perennials constitute long-term revenue-generating assets worth protecting in dry years. Second, the perennial crops grown in the District tend to produce higher yields (i.e., tons of crops per hectare) than seasonal crops. Figure 6 illustrates this with a box diagram, which reports the whole range of observed yield values, from the minimum to the maximum; the box captures quartiles two and three of the distribution of values, the horizontal line within the box represents the median value and the bottom (top) vertical segment captures the first (fourth) quartile. In this case, the distribution of yield values for perennial crops absolutely dominates that for seasonal crops: higher minimum, median and maximum values.
Perennial crops also tend to command higher prices per ton (Figure 7, which uses the same data-visualization technique described for the previous figure). Prices are reported in the country’s national currency, the Mexican peso, for which the international currency code is MXN—for reference, the United States dollar currently is valued at about 20 Mexican Pesos, i.e., USD 1 = MXN 20.
Due to their higher yields and prices, perennial crops tend to generate higher revenues per unit of land in comparison to seasonal crops. Therefore, maintaining perennial crops in times of increased water scarcity, while reducing land dedicated to seasonal crops can be understood as a mitigating measure that reduces the impact of drought on revenues.
A closer look at yield and price data for the District’s main crops provides additional evidence about the relative attractiveness of perennial crops. Alfalfa (a perennial feed crop) produces more per hectare, on average 56 tons, than either corn or sorghum (two seasonal feed crops), for which average yields are 44 tons and 48 tons, respectively (Table 1). Moreover, alfalfa offers a higher price than its two seasonal counterparts: MXN 701 on average, versus MXN 538 for corn and MXN 509 for sorghum, while walnut at MXN 42,310 is by far the most valuable of all district crops (Table 2).
3.2. District’s Performance
3.2.1. Agronomical Performance: Crop Failures and Yields
Of the cumulative 1,039,987 hectares cultivated in the District from 1998 to 2018, 1947 (less than a fifth of one percent) failed to produce a harvest. No seasonal crop has suffered failure and all failure events have involved only two perennial crops. The last crop-failure event occurred in 2011, when 20 hectares of fig trees did not yield fruit; all previous events affected walnut orchards (Figure 8). The data suggest walnut growers have managed to gradually solve this problem—from 2005 on, walnut orchards have produced on 100% of their land area.
Yields in the district have varied from year to year, but the data do not reveal any discernible trends. Corn green fodder lends itself particularly well to international comparisons, as the harvest consists of the whole plant and is usually weighed as fresh matter. Fresh matter yields of corn green fodder range from 10 to 50 t/ha globally [7]; the District has consistently performed in the upper part of that band (Figure 9).
3.2.2. Economic Performance: Revenue per Hectare and Revenue per Unit of Water
The District’s yearly total revenue varies according to the quantity of crops produced, which relates to water availability and the extent of land irrigated. To assess economic performance, we focus on revenue per unit of land and revenue per unit of irrigation water.
The trajectories of revenue per hectare and revenue per cubic meter of irrigation water in the District present similarities (Figure 10 and Figure 11). In both cases, the figure reports the data in nominal and real terms, i.e., taking into account the inflation rate in Mexico. Revenue, per hectare and per unit of water, exhibits a noisy pattern that reflects the volatility of crop prices. More importantly, in both cases, revenue shows a statistically significant upward trend (i.e., a positive slope coefficient), confirmed through a simple linear-trend analysis (Table 3). In real terms, revenue per hectare has increased at an average rate of 3.3% per year over the 1998–2018 period. In the case of revenue per cubic meter of irrigation, growth has proved even more robust, with an average rate of increase of 4.0% per year in real terms.
3.2.3. Impacts of Feed Output on the Regional Dairy and Meat Industries
The District forms part of a larger agro-industrial regional system; in particular, it supplies feed (corn, sorghum and alfalfa) to the neighboring dairy and beef cattle industry. The total quantity of feed produced yearly in the District depends on water availability and the previously described mechanism irrigators employ to manage water scarcity and drought. During 1998–2018, yearly feed production has averaged 1,274,490 tons, but, in 2002 at the height of drought, the harvest amounted to only 282,759 tons. Data available on total milk production in the region [16] suggest the dairy industry is largely immune to the variability in the District’s feed output (Figure 12). As for dairy and beef cattle, available data [17] reveal that the number of heads has grown from 561,276 in 2011 to 917,023 in 2020, an increase of 63%. While a full analysis of the linkages between the District and downstream regional industries lies beyond the scope of this paper, the evidence reported here indicates that the latter suffer no significant impacts from the variability in the former’s feed output.
4. Discussion and Conclusions
The results of the previous section indicate that the District provides an example of a resilient, well-functioning system adapted to a challenging water environment. The District has shown itself to be capable of mitigating the impacts of climate variability, in particular the cycle of periods of drought and relative abundance of water.
The District’s recent history provides insights about the causes that underlie its performance and its ability to adapt to challenges. The current irrigation system, relying exclusively on surface water, dates to the late 1990s. Before that, the District made extensive use of underground water [18] and cultivated an area of up to 105,000 hectares, 45% more the 72,000 hectares available today. However, in the late 1990s, the District’s producers lost access to underground water, as a result of a series of reforms executed by the national water authority (in Mexico, water is national property, and the federal government regulates its use across sectors). This led inevitably to a downsizing of operations, but irrigators also gained the right to trade their water allocations among themselves.
Studies about the market that developed to facilitate water trading in the District have raised questions about its fairness [19]. Results presented here suggest that the District’s water market operates steadily and continuously and has contributed to efficiency by allowing the smooth reallocation of available water to its most effective use from year to year, in a changing environment characterized by several water cycles. The District is neither a corporation nor a Soviet-type collective. Rather, it is an association of several thousand independent farmers, each of whom is economically separate and possesses their own land endowment and water rights. Patterns of land allocation and water use, such as those described in Figure 4—perennials consuming a larger share of water available in dry years and a smaller fraction in the years when water is abundant—would be impossible to achieve without a functioning water market between the farmers. Thus, our paper provides indirect evidence that the water market (which is unobservable to outsiders, as it does not provide any data on its operations), must be active and functioning consistently in the District. Our paper also suggests that the price of water in dry years must be high enough to incentivize famers usually growing seasonal crops to stop producing and instead offer their water allocations on the market.
Our paper has implications for water and drought policy. Farmers grow crops for one purpose: to make a living. Their water and land usage are driven by the same logic. As an analogy, consider the issue of mechanization for harvesting crops. A farmer will acquire equipment on the basis of costs and benefits, not for the sake of some other purpose such as reducing labor usage. Therefore, water- and drought-policy measures (whether preventive or emergency) should explicitly take into account farmer (i.e., human) economic behavior, otherwise the results could turn out ineffective, inefficient and/or unfair. For example, in this case, irrigators do not shift to relatively low water-consuming crops in times of acute water scarcity. Mandating such practice (which could appear reasonable from a strict environmental viewpoint) would cause them harm and impair future productivity.
Optimal adaption to water cyclicality can also explain the patterns of crops and land allocation in the District. Walnut (a perennial crop grown in orchards) is by far the most valuable crop, so it may appear surprising that its share of land in the District has remained fairly stable—around 10,000 hectares out of 72,000—despite the potential for higher revenues from walnut cultivation compared to seasonal alternatives. Based on our results, the most compelling explanation is that such patterns emerge as a response to investment risk caused by water-availability fluctuations. As our results demonstrate, walnut growers already consume a large fraction of water in dry years, which must come from other farmers’ allocations and be obtained from the water market. Expanding walnut orchards would introduce the risk that the required water may not be available on the market during drought years, which would lead to irreversible loss of substantial investment (walnut trees take six to eight years to reach productive age and remain productive for about two decades) or that the water would have to be purchased from outside sources at a very high price to save said investment.
Water cyclicality with regularly occurring droughts poses many difficult challenges for all economic sectors and society at large. Following our approach, studies like the one presented here could be replicated in different locations to build knowledge on how farmers deal with drought according to their circumstances, from the characteristics of the water environment they face to the institutional arrangements that facilitate (or impede) their decision-making. Such knowledge, beyond informing policy design at a local level, could lead to the identification of significant patterns of economic behavior and adaption.
Author Contributions
Conceptualization, N.P.S., S.S. and G.A.M.; methodology, N.P.S.; formal analysis, N.P.S. and S.S.; investigation, N.P.S., S.S. and G.A.M.; writing, N.P.S. All authors have read and agreed to the published version of the manuscript.
Funding
Sergei Severinov acknowledges financial support from the Social Sciences and Humanities Research Council of Canada through SSHRC grant #435-2017-0540.
Institutional Review Board Statement
Not applicable.
Informed Consent Statement
Not applicable.
Data Availability Statement
The data employed in this study are available in Appendix A. All data employed to develop this paper originate from annual reports published by official sources, which are in the public domain and are freely available online. Sources are cited in the text, and details (including links) are presented in the References.
Acknowledgments
The authors wish to thank the anonymous referees who generously offered their time to review this manuscript. The final version has greatly benefitted from the changes suggested by these referees.
Conflicts of Interest
The authors declare no conflict of interest.
Appendix A. Data with Annotations
| A | B | C | D | E | F | G | H | I | |||||||||||||||||||||
| Water (Millions of m3) | Land (Hectares) | Irrigation (cm) | |||||||||||||||||||||||||||
| Reservoir | Distributed | Irrigated | Excess | Capacity | Seasonal | Perennial | |||||||||||||||||||||||
| 1998 | 1151.70 | 848.92 | 49,372 | 22,628 | 72,000 | 40,883 | 8489 | 171.9 | |||||||||||||||||||||
| 1999 | 594.80 | 326.62 | 21,028 | 50,972 | 72,000 | 14,679 | 6349 | 155.3 | |||||||||||||||||||||
| 2000 | 981.80 | 667.65 | 40,588 | 31,412 | 72,000 | 31,211 | 9377 | 164.5 | |||||||||||||||||||||
| 2001 | 844.60 | 624.00 | 32,639 | 39,361 | 72,000 | 23,241 | 9398 | 191.2 | |||||||||||||||||||||
| 2002 | 547.60 | 251.65 | 12,378 | 59,622 | 72,000 | 7593 | 4785 | 203.3 | |||||||||||||||||||||
| 2003 | 743.70 | 506.45 | 30,685 | 41,315 | 72,000 | 24,187 | 6498 | 165.0 | |||||||||||||||||||||
| 2004 | 1255.10 | 832.08 | 47,668 | 24,332 | 72,000 | 39,175 | 8493 | 174.6 | |||||||||||||||||||||
| 2005 | 1742.60 | 715.13 | 52,192 | 19,808 | 72,000 | 43,625 | 8567 | 137.0 | |||||||||||||||||||||
| 2006 | 1485.60 | 715.13 | 50,572 | 21,428 | 72,000 | 41,970 | 8602 | 141.4 | |||||||||||||||||||||
| 2007 | 2536.80 | 945.22 | 66,599 | 5401 | 72,000 | 56,568 | 10,031 | 141.9 | |||||||||||||||||||||
| 2008 | 2137.80 | 944.32 | 57,683 | 14,317 | 72,000 | 48,352 | 9331 | 163.7 | |||||||||||||||||||||
| 2009 | 3126.15 | 1023.76 | 69,820 | 2180 | 72,000 | 57,956 | 11,864 | 146.6 | |||||||||||||||||||||
| 2010 | 2925.66 | 1100.00 | 71,573 | 427 | 72,000 | 59,166 | 12,407 | 153.7 | |||||||||||||||||||||
| 2011 | 2955.93 | 1148.52 | 71,964 | 36 | 72,000 | 59,530 | 12,434 | 159.6 | |||||||||||||||||||||
| 2012 | 1819.60 | 956.55 | 57,654 | 14,346 | 72,000 | 45,822 | 11,832 | 165.9 | |||||||||||||||||||||
| 2013 | 1341.35 | 600.00 | 31,721 | 40,279 | 72,000 | 22,431 | 9289 | 189.1 | |||||||||||||||||||||
| 2014 | 1817.93 | 796.11 | 47,845 | 24,155 | 72,000 | 36,390 | 11,456 | 166.4 | |||||||||||||||||||||
| 2015 | 1795.14 | 793.23 | 48,386 | 23,614 | 72,000 | 36,804 | 11,582 | 163.9 | |||||||||||||||||||||
| 2016 | 1764.85 | 799.62 | 49,835 | 22,165 | 72,000 | 39,171 | 10,664 | 160.5 | |||||||||||||||||||||
| 2017 | 1764.85 | 1036.01 | 64,173 | 7827 | 72,000 | 52,826 | 11,347 | 161.4 | |||||||||||||||||||||
| 2018 | 2918.99 | 1049.51 | 65,612 | 6388 | 72,000 | 53,325 | 12,287 | 160.0 | |||||||||||||||||||||
| Key (by Column) | |||||||||||||||||||||||||||||
| A | Year of observation | ||||||||||||||||||||||||||||
| B | Water stored at beginning of year, Lázaro Cárdenas dam/reservoir, million cubic meters (Figure 2) | ||||||||||||||||||||||||||||
| C | Water distributed to District 017, annually, million cubic meters (Figure 3) | ||||||||||||||||||||||||||||
| D,E,F | Surface of land irrigated, excess land (not cultivated), land capacity (maximum surface of irrigable land) (Figure 3) | ||||||||||||||||||||||||||||
| G | Surface of land irrigated, seasonal crops (Figure 4) | ||||||||||||||||||||||||||||
| H | Surface of land irrigated, seasonal crops (Figure 4) | ||||||||||||||||||||||||||||
| I | Computed as: water distributed (Column C)/land irrigated (Column D), scaled in centimeters (Figure 5) | ||||||||||||||||||||||||||||
| J | K | L | M | N | O | P | Q | ||||||||||||||||||||||
| Perennial Crops (% Total Irrigated Land) | Yields (Tons per Hectare) | ||||||||||||||||||||||||||||
| Seasonal | Perennial | Cotton | Corn | Sorghum | Alfalfa | Walnut | |||||||||||||||||||||||
| 1998 | 17.2 | 30.56 | 27.18 | 5.20 | 42.99 | 47.40 | 55.29 | 2.13 | |||||||||||||||||||||
| 1999 | 30.2 | 31.82 | 29.01 | 5.16 | 45.00 | 47.40 | 55.16 | 1.58 | |||||||||||||||||||||
| 2000 | 23.1 | 32.11 | 26.55 | 5.06 | 43.64 | 45.19 | 51.00 | 1.87 | |||||||||||||||||||||
| 2001 | 28.8 | 25.11 | 29.97 | 5.01 | 42.43 | 31.40 | 54.90 | 1.44 | |||||||||||||||||||||
| 2002 | 38.7 | 32.16 | 28.12 | 5.11 | 46.42 | 51.49 | 47.71 | 1.93 | |||||||||||||||||||||
| 2003 | 21.2 | 35.84 | 30.77 | 4.94 | 45.83 | 50.61 | 53.38 | 1.78 | |||||||||||||||||||||
| 2004 | 17.8 | 32.80 | 33.08 | 5.52 | 47.14 | 53.03 | 50.63 | 1.42 | |||||||||||||||||||||
| 2005 | 16.4 | 27.22 | 32.54 | 4.96 | 44.44 | 47.47 | 53.77 | 1.78 | |||||||||||||||||||||
| 2006 | 17.0 | 26.36 | 24.57 | 2.41 | 44.06 | 50.18 | 47.15 | 0.84 | |||||||||||||||||||||
| 2007 | 15.1 | 35.01 | 23.26 | 4.77 | 44.90 | 57.79 | 39.18 | 1.63 | |||||||||||||||||||||
| 2008 | 16.2 | 34.24 | 33.46 | 4.87 | 51.20 | 50.05 | 58.62 | 1.94 | |||||||||||||||||||||
| 2009 | 17.0 | 26.51 | 44.73 | 4.92 | 35.40 | 44.10 | 73.95 | 2.01 | |||||||||||||||||||||
| 2010 | 17.3 | 21.18 | 38.28 | 5.02 | 44.94 | 46.70 | 70.00 | 1.80 | |||||||||||||||||||||
| 2011 | 17.3 | 20.69 | 38.37 | 5.02 | 45.09 | 46.57 | 70.00 | 1.80 | |||||||||||||||||||||
| 2012 | 20.5 | 26.16 | 24.30 | 4.90 | 45.07 | 48.23 | 44.86 | 2.11 | |||||||||||||||||||||
| 2013 | 29.3 | 29.47 | 19.28 | 4.40 | 45.00 | 55.24 | 36.40 | 2.12 | |||||||||||||||||||||
| 2014 | 23.9 | 30.36 | 17.09 | 4.30 | 38.36 | 51.77 | 28.68 | 1.60 | |||||||||||||||||||||
| 2015 | 23.9 | 21.80 | 47.56 | 3.09 | 43.58 | 48.96 | 76.33 | 1.71 | |||||||||||||||||||||
| 2016 | 21.4 | 24.00 | 42.90 | 4.30 | 45.70 | 42.80 | 63.10 | 1.80 | |||||||||||||||||||||
| 2017 | 17.7 | 20.10 | 44.10 | 3.50 | 41.30 | 50.80 | 69.00 | 1.10 | |||||||||||||||||||||
| 2018 | 18.7 | 13.70 | 48.30 | 4.00 | 36.70 | 41.70 | 69.00 | 1.50 | |||||||||||||||||||||
| Key (by Column) | |||||||||||||||||||||||||||||
| J | Percentage of irrigated land dedicated to perennial crops (Figure 5) | ||||||||||||||||||||||||||||
| K,L | Yield (tons of crop per hectare), for all seasonal and perennial crops, respectively (Figure 6) | ||||||||||||||||||||||||||||
| M,N,O,P,Q | Yield (tons of crop per hectare), for the main seasonal crops (cotton, corn, sorghum) and main perennial crops (alfalfa, walnut) (Table 1; corn yields reported in Figure 9) | ||||||||||||||||||||||||||||
| R | S | T | U | V | W | X | Y | ||||||||||||||||||||||
| Prices (MXN per Ton of Crop) | Crop Failure (Hectares) | ||||||||||||||||||||||||||||
| Seasonal | Perennial | Cotton | Corn | Sorghum | Alfalfa | Walnut | |||||||||||||||||||||||
| 1998 | 1586 | 4268 | 13,802 | 800 | 750 | 795 | 85,000 | 549 | |||||||||||||||||||||
| 1999 | 2159 | 3427 | 11,147 | 780 | 2718 | 793 | 100,294 | 198 | |||||||||||||||||||||
| 2000 | 1237 | 3472 | 11,977 | 699 | 524 | 700 | 80,025 | 620 | |||||||||||||||||||||
| 2001 | 1243 | 2166 | 10,079 | 539 | 446 | 708 | 65,869 | 261 | |||||||||||||||||||||
| 2002 | 1013 | 1811 | 8965 | 502 | 424 | 704 | 38,486 | 91 | |||||||||||||||||||||
| 2003 | 861 | 1586 | 8903 | 616 | 483 | 853 | 29,718 | 144 | |||||||||||||||||||||
| 2004 | 1528 | 1218 | 9039 | 1697 | 521 | 711 | 33,874 | 64 | |||||||||||||||||||||
| 2005 | 1382 | 2253 | 11,748 | 508 | 468 | 722 | 68,948 | 0 | |||||||||||||||||||||
| 2006 | 851 | 2091 | 11,354 | 426 | 353 | 1039 | 56,407 | 0 | |||||||||||||||||||||
| 2007 | 725 | 1847 | 5260 | 339 | 392 | 950 | 30,158 | 0 | |||||||||||||||||||||
| 2008 | 914 | 1485 | 7412 | 485 | 408 | 657 | 32,762 | 0 | |||||||||||||||||||||
| 2009 | 819 | 1354 | 5990 | 474 | 352 | 802 | 31,008 | 0 | |||||||||||||||||||||
| 2010 | 1271 | 1547 | 6420 | 428 | 375 | 771 | 36,380 | 0 | |||||||||||||||||||||
| 2011 | 1226 | 1469 | 6000 | 400 | 350 | 750 | 34,000 | 20 | |||||||||||||||||||||
| 2012 | 835 | 2033 | 5444 | 250 | 328 | 808 | 30,579 | 0 | |||||||||||||||||||||
| 2013 | 453 | 2772 | 6050 | 200 | 150 | 1500 | 25,000 | 0 | |||||||||||||||||||||
| 2014 | 562 | 1350 | 4000 | 450 | 370 | 500 | 22,000 | 0 | |||||||||||||||||||||
| 2015 | 683 | 617 | 4200 | 250 | 300 | 250 | 20,000 | 0 | |||||||||||||||||||||
| 2016 | 649 | 768 | 5000 | 300 | 180 | 350 | 26,002 | 0 | |||||||||||||||||||||
| 2017 | 625 | 379 | 5000 | 250 | 200 | 160 | 22,000 | 0 | |||||||||||||||||||||
| 2018 | 1381 | 384 | 5000 | 900 | 600 | 190 | 20,003 | 0 | |||||||||||||||||||||
| Key (by Column) | |||||||||||||||||||||||||||||
| R,S | Price (MXN per ton of crop), for all seasonal and perennial crops, respectively (Figure 7) | ||||||||||||||||||||||||||||
| T,U,V,W,X | Price (MXN per ton of crop), for the main seasonal crops (cotton, corn, sorghum) and main perennial crops (alfalfa, walnut) (Table 2) | ||||||||||||||||||||||||||||
| Y | Surface affected by crop failure in hectares (Figure 8) | ||||||||||||||||||||||||||||
| Z | AA | AB | AC | AD | AE | AF | AG | ||||||||||||||||||||||
| Revenue per Hectare | Revenue per Cubic Meter | CPI | Feed Production (Tons) | Milk Production (Thousands of Liters) | Cattle (Heads) | ||||||||||||||||||||||||
| Nominal | Real | Nominal | Real | ||||||||||||||||||||||||||
| 1998 | 18.9 | 51.8 | 1.09 | 2.98 | 36.41 | 787,025 | |||||||||||||||||||||||
| 1999 | 13.8 | 32.4 | 0.88 | 2.07 | 42.45 | 507,756 | |||||||||||||||||||||||
| 2000 | 19.4 | 41.7 | 1.16 | 2.50 | 46.48 | 998,182 | |||||||||||||||||||||||
| 2001 | 19.0 | 38.4 | 0.98 | 1.99 | 49.43 | 841,016 | |||||||||||||||||||||||
| 2002 | 19.4 | 37.3 | 0.95 | 1.82 | 51.92 | 282,759 | |||||||||||||||||||||||
| 2003 | 21.7 | 40.0 | 1.31 | 2.41 | 54.28 | 727,723 | 1,870,186 | ||||||||||||||||||||||
| 2004 | 26.7 | 47.0 | 1.53 | 2.69 | 56.83 | 1,077,567 | 1,899,394 | ||||||||||||||||||||||
| 2005 | 30.5 | 51.6 | 2.22 | 3.76 | 59.09 | 1,015,054 | 1,995,463 | ||||||||||||||||||||||
| 2006 | 32.4 | 52.9 | 2.29 | 3.74 | 61.24 | 1,011,772 | 2,122,092 | ||||||||||||||||||||||
| 2007 | 27.6 | 43.3 | 1.94 | 3.05 | 63.67 | 1,757,661 | 2,173,483 | ||||||||||||||||||||||
| 2008 | 34.3 | 51.2 | 2.09 | 3.13 | 66.93 | 1,773,614 | 2,255,272 | ||||||||||||||||||||||
| 2009 | 28.4 | 40.3 | 1.94 | 2.75 | 70.48 | 2,086,224 | 2,090,707 | ||||||||||||||||||||||
| 2010 | 27.5 | 37.4 | 1.79 | 2.43 | 73.41 | 1,684,007 | 2,092,807 | ||||||||||||||||||||||
| 2011 | 43.8 | 57.7 | 2.74 | 3.61 | 75.91 | 1,832,022 | 2,117,562 | 561,276 | |||||||||||||||||||||
| 2012 | 48.1 | 60.9 | 2.90 | 3.67 | 79.03 | 1,750,660 | 2,198,846 | 575,205 | |||||||||||||||||||||
| 2013 | 36.1 | 44.0 | 1.91 | 2.33 | 82.04 | 1,031,960 | 2,222,040 | 577,859 | |||||||||||||||||||||
| 2014 | 37.0 | 43.3 | 2.22 | 2.60 | 85.33 | 1,375,422 | 2,274,475 | 598,196 | |||||||||||||||||||||
| 2015 | 39.3 | 44.8 | 2.40 | 2.73 | 87.65 | 1,151,192 | 2,412,329 | 749,580 | |||||||||||||||||||||
| 2016 | 50.9 | 56.5 | 3.17 | 3.52 | 90.13 | 1,419,949 | 2,433,821 | 778,844 | |||||||||||||||||||||
| 2017 | 74.1 | 77.6 | 4.59 | 4.80 | 95.57 | 1,852,341 | 2,453,770 | 829,938 | |||||||||||||||||||||
| 2018 | 61.1 | 61.1 | 3.82 | 3.82 | 100.00 | 1,800,374 | 2,448,598 | 838,062 | |||||||||||||||||||||
| 2019 | 855,355 | ||||||||||||||||||||||||||||
| 2020 | 917,023 | ||||||||||||||||||||||||||||
| Key (by Column) | |||||||||||||||||||||||||||||
| Z,AA | Revenue per hectare, nominal and real, in thousands MXN (Figure 10) | ||||||||||||||||||||||||||||
| AB, AC | Revenue per cubic meter of water, nominal and real, in MXN (Figure 11) | ||||||||||||||||||||||||||||
| AD | Consumer Price Index, used to convert nominal revenue into real revenue, in 2018 values | ||||||||||||||||||||||||||||
| AE | District production of corn, sorghum and alfalfa, in tons (Figure 12) | ||||||||||||||||||||||||||||
| AF | Regional milk production, in thousands of liters (Figure 12) | ||||||||||||||||||||||||||||
| AG | Regional beef and dairy cattle, heads (data referred to in Section 3.2.3) | ||||||||||||||||||||||||||||
References
- Debaere, P.; Li, T. The effects of water markets: Evidence from the Rio Grande. Adv. Water Resour. 2020, 145, 103700. [Google Scholar] [CrossRef]
- Zegarra, E. Water Market and Coordination Failures: The Case of Limari Valley in Chile. Ph.D. Thesis, University of Wisconsin, Madison, WI, USA, 2002. [Google Scholar]
- Giannocarro, G.; Pedraza, V.; Berber, J. Analysis of Stakeholder Attitude towards Water Markets in Southern Spain. Water 2013, 5, 1517–1532. [Google Scholar] [CrossRef]
- D’Odorico, P.; Chiarellib, D.D.; Rosaa, L.; Binia, A.; Zilbermanc, D.; Rullib, M.C. The global value of water in agriculture. Proc. Natl. Acad. Sci. USA 2020, 117, 21985–21993. [Google Scholar] [CrossRef]
- Sisto, N.P. Environmental flows for rivers and economic compensation for irrigators. J. Environ. Manag. 2009, 90, 1236–1240. [Google Scholar] [CrossRef] [PubMed]
- Okazaki, M.; Lizumi, T.; Sakamoto, T.; Kotoku, M.; Sakurai, G.; Hijioka, Y.; Nishimori, M. Varying Benefits of Irrigation Expansion for Crop Production under a Changing Climate and Competitive Water Use Among Crops. Earth’s Future 2018, 6, 1207–1220. [Google Scholar] [CrossRef]
- Rosa, L.; Rulli, M.C.; Davis, K.F.; Chiarelli, D.D.; Passera, C.P.; D’Odorico, P. Closing the Yield Gap While Ensuring Water Sustainability. Environ. Res. Lett. 2018, 13, 104002. [Google Scholar] [CrossRef] [Green Version]
- Rosegrant, W.; Ringler, C.; McKinney, D.C.; Cai, X.; Keller, A.; Donoso, G. Integrated economic-hydrologic water modeling at the basin scale: The Maipo River Basin. Agric. Econ. 2000, 24, 33–46. [Google Scholar] [CrossRef]
- World Bank. World Development Indicators Database. Available online: http://data.worldbank.org/data-catalog/world-development-indicators (accessed on 14 July 2022).
- Ochoa-Noriega, C.A.; Aznar-Sánchez, J.A.; Velasco-Muñoz, J.F.; Álvarez-Bejar, A. The Use of Water in Agriculture in Mexico and Its Sustainable Management: A Bibliometric Review. Agronomy 2020, 10, 1957. [Google Scholar] [CrossRef]
- Esquivel-Arriaga, G.; Cerano-Paredes, J.; Sánchez-Cohen, I.; Velásquez-Valle, M.A.; Flores-López, F.; Bueno-Hurtado, P. Temporal analysis of droughts (1922–2016) in the upper Nazas River Basin using SPI and its relationship with ENSO. Tecnol. Cienc. Agua 2019, 10, 126–153. [Google Scholar] [CrossRef]
- Comisión Nacional del Agua, Sistema Nacional de Información del Agua. Presas Principales. Available online: http://sina.conagua.gob.mx/sina/tema.php?tema=presasPrincipales&n=nacional (accessed on 27 May 2022).
- Comisión Nacional del Agua, Subdirección General de Operación, Gerencia de Distritos y Unidades de Riego. Estadísticas Agrícolas de los Distritos de Riego. Available online: https://www.gob.mx/conagua/documentos/estadisticas-agricolas-de-los-distritos-de-riego (accessed on 27 May 2022).
- Heuzé, V.; Tran, G.; Edouard, N.; Lebas, F. Maize Green Forage. Feedipedia, a Programme by INRAE, CIRAD, AFZ and FAO. 2017. Available online: https://www.feedipedia.org/node/358 (accessed on 27 May 2022).
- INEGI Instituto Nacional de Estadística, Geografía e Informática. Banco de Información Económica, Índices de Precios. Available online: https://www.inegi.org.mx/sistemas/bie/ (accessed on 27 May 2022).
- Secretaría de Agricultura y Desarrollo Rural; Servicio de Información Agroalimentaria y Pesquera. Boletín de Leche. Available online: https://www.gob.mx/siap/documentos/boletin-de-leche?state=draft (accessed on 27 May 2022).
- Secretaría de Agricultura y Desarrollo Rural; Servicio de Información Agroalimentaria y Pesquera. Producción Ganadera. Available online: https://www.gob.mx/siap/acciones-y-programas/produccion-pecuaria (accessed on 27 May 2022).
- Cruz, A.; Levine, G. El Uso de Aguas Subterraneas en el Distrito de Riego 017, Region Lagunera, Mexico In Spanish. Mexico, D.F., Mexico: Colombo, Sri Lanka: International Water Management Institute (IWMI). Mexico Program xv, 1998. 27p. (IWMI Serie Latinoamericana 003). Available online: https://www.iwmi.cgiar.org/publications/other-publication-types/latin-american-series/ (accessed on 27 May 2022).
- Hernandez, M.F.; Alhers, R. Naturaleza y Extension del Mercado del Agua en el D.R.017 de la Comarca Lagunera, Mexico. In Spanish. Mexico, D.F., Mexico: International Water Management Institute (IWMI). Mexico Program xv, 1999. 63p. (IWMI Serie Latinoamericana 010). Available online: https://www.iwmi.cgiar.org/publications/other-publication-types/latin-american-series/ (accessed on 27 May 2022).
Figure 1.
Irrigation District 017 and surrounding region. Key: (1) Lázaro Cárdenas dam/reservoir (Upper Nazas River Basin); (2) Nazas River; (3) Francisco Zarco dam/reservoir (Middle Nazas River Basin); (4) urban area: cities of Torreón, Coahuila (right bank), Lerdo and Gómez Palacio, Durango (left bank); (5) Irrigation District 017 (Lower Nazas River Basin). Source: Authors.

Figure 2.
Water stored at beginning of year, Lázaro Cárdenas dam/reservoir, millions of cubic meters, 1998–2018. Source: Authors with statistics compiled using raw data obtained from Mexico’s federal water authority [12], all of which are presented in Appendix A.
Figure 2.
Water stored at beginning of year, Lázaro Cárdenas dam/reservoir, millions of cubic meters, 1998–2018. Source: Authors with statistics compiled using raw data obtained from Mexico’s federal water authority [12], all of which are presented in Appendix A.

Figure 3.
Water distributed and land irrigated per year, Irrigation District 017, 1998–2018. Source: Authors with statistics compiled using raw data obtained from Mexico’s federal water authority [13], all of which are presented in Appendix A.
Figure 3.
Water distributed and land irrigated per year, Irrigation District 017, 1998–2018. Source: Authors with statistics compiled using raw data obtained from Mexico’s federal water authority [13], all of which are presented in Appendix A.

Figure 4.
Land irrigated by crop type (seasonal and perennial), Irrigation District 017, 1998–2018. Source: Authors with statistics compiled using raw data obtained from Mexico’s federal water authority [13], all of which are presented in Appendix A.
Figure 4.
Land irrigated by crop type (seasonal and perennial), Irrigation District 017, 1998–2018. Source: Authors with statistics compiled using raw data obtained from Mexico’s federal water authority [13], all of which are presented in Appendix A.

Figure 5.
Irrigation intensity and percentage of irrigated land allocated to perennial crops, Irrigation District 017, 1998–2018. Source: Authors with statistics compiled using raw data obtained from Mexico’s federal water authority [13], all of which are presented in Appendix A.
Figure 5.
Irrigation intensity and percentage of irrigated land allocated to perennial crops, Irrigation District 017, 1998–2018. Source: Authors with statistics compiled using raw data obtained from Mexico’s federal water authority [13], all of which are presented in Appendix A.

Figure 6.
Yields by crop type, box diagram, Irrigation District 017, 1998–2018. Source: Authors with statistics compiled using raw data obtained from Mexico’s federal water authority [13], all of which are presented in Appendix A.
Figure 6.
Yields by crop type, box diagram, Irrigation District 017, 1998–2018. Source: Authors with statistics compiled using raw data obtained from Mexico’s federal water authority [13], all of which are presented in Appendix A.

Figure 7.
Price per ton by crop type, box diagram, Irrigation District 017, 1998–2018. Source: Authors with statistics compiled using raw data obtained from Mexico’s federal water authority [13], all of which are presented in Appendix A.
Figure 7.
Price per ton by crop type, box diagram, Irrigation District 017, 1998–2018. Source: Authors with statistics compiled using raw data obtained from Mexico’s federal water authority [13], all of which are presented in Appendix A.

Figure 8.
Crop failure (hectares), Irrigation District 017, 1998–2018. Source: Authors with statistics compiled using raw data obtained from Mexico’s federal water authority [13], all of which are presented in Appendix A.
Figure 8.
Crop failure (hectares), Irrigation District 017, 1998–2018. Source: Authors with statistics compiled using raw data obtained from Mexico’s federal water authority [13], all of which are presented in Appendix A.

Figure 9.
Corn green fodder yield, Irrigation District 017 and international upper and lower bounds, 1998–2018. Source: Authors with statistics compiled using raw data obtained from Mexico’s federal water authority [13], all of which are presented in Appendix A; the upper and lower bounds yields are taken from an official FAO source, cited in [14].

Figure 10.
Revenue per hectare, Irrigation District 017, 1998–2018. Source: Authors with statistics compiled using raw data obtained from Mexico’s federal water authority [13], all of which are presented in Appendix A; nominal values converted to real values using the consumer price index from Mexico’s statistical bureau [15], which are presented in Appendix A.

Figure 11.
Revenue per unit of water (cubic meter), Irrigation District 017, 1998–2018. Source: Authors with statistics compiled using raw data obtained from Mexico’s federal water authority [13], all of which are presented in Appendix A; nominal values converted to real values using the consumer price index from Mexico’s statistical bureau [15], which are presented in Appendix A.

Figure 12.
Feed production, Irrigation District 017, 1998–2018 and regional milk production (million liters), 2003–2018. Source: Authors with statistics compiled using raw data obtained from Mexico’s federal water authority [13] and federal agricultural authority [16], all of which are presented in Appendix A.


Table 1.
Yields (tons per hectare), main crops, Irrigation District 017, 1998–2018.
| Seasonal | Perennial | ||||
|---|---|---|---|---|---|
| Cotton | Corn | Sorghum | Alfalfa | Walnut | |
| Minimum | 2.41 | 35.40 | 31.40 | 28.68 | 0.84 |
| Median | 4.92 | 44.90 | 48.23 | 54.90 | 1.78 |
| Mean | 4.59 | 43.77 | 48.04 | 55.62 | 1.71 |
| Maximum | 5.52 | 51.20 | 57.79 | 76.33 | 2.13 |
Source: Statistics compiled by the authors, with raw data obtained from Mexico’s federal water authority [13], all of which are presented in Appendix A.
Table 2.
Prices (MXN per ton of crop), main crops, Irrigation District 017, 1998–2018.
| Seasonal | Perennial | ||||
|---|---|---|---|---|---|
| Cotton | Corn | Sorghum | Alfalfa | Walnut | |
| Minimum | 4000 | 200 | 150 | 160 | 20,000 |
| Median | 6420 | 474 | 392 | 722 | 32,762 |
| Mean | 7752 | 538 | 509 | 701 | 42,310 |
| Maximum | 13,802 | 1697 | 2718 | 1500 | 100,294 |
Source: Statistics compiled by the authors, with raw data obtained from Mexico’s federal water authority [13], all of which are presented in Appendix A.
Table 3.
Regression results (linear trend), revenue per hectare and revenue per cubic meter of water, Irrigation District 017, 1998–2018.
Table 3.
Regression results (linear trend), revenue per hectare and revenue per cubic meter of water, Irrigation District 017, 1998–2018.
| Dependent Variable | Constant (t-Statistics) | Slope Coefficient (t-Statistics) | R2 (Adjusted) |
|---|---|---|---|
| Revenue per hectare (real) | 38.3 (10.27) | 0.958 (3.09) | 0.30 |
| Revenue per cubic meter (real) | 2.31 (8.55) | 0.0.67 (2.88) | 0.27 |
Source: Statistics compiled by the authors, with raw data obtained from Mexico’s federal water authority [13], all of which are presented in Appendix A.
Publisher’s Note: MDPI stays neutral with regard to jurisdictional claims in published maps and institutional affiliations. |
© 2022 by the authors. Licensee MDPI, Basel, Switzerland. This article is an open access article distributed under the terms and conditions of the Creative Commons Attribution (CC BY) license (https://creativecommons.org/licenses/by/4.0/).
Share and Cite
MDPI and ACS Style
Sisto, N.P.; Severinov, S.; Aboites Manrique, G. Growing Crops in Arid, Drought-Prone Environments: Adaptation and Mitigation. Hydrology 2022, 9, 129. https://doi.org/10.3390/hydrology9080129
AMA Style
Sisto NP, Severinov S, Aboites Manrique G. Growing Crops in Arid, Drought-Prone Environments: Adaptation and Mitigation. Hydrology. 2022; 9(8):129. https://doi.org/10.3390/hydrology9080129
Chicago/Turabian StyleSisto, Nicholas P., Sergei Severinov, and Gilberto Aboites Manrique. 2022. "Growing Crops in Arid, Drought-Prone Environments: Adaptation and Mitigation" Hydrology 9, no. 8: 129. https://doi.org/10.3390/hydrology9080129
Note that from the first issue of 2016, this journal uses article numbers instead of page numbers. See further details here.