Article

Evaluation of the Influence of Rootstock Type on the Yield Parameters of Vines Using a Mathematical Model in Nontraditional Wine-Growing Conditions

1
Department of Applied Mathematics and Informatics, University of Life Sciences in Lublin, Głęboka 28, 20-612 Lublin, Poland
2
Faculty of Chemistry, Wrocław University of Science and Technology, Gdańska 7/9, 50-344 Wrocław, Poland
3
Department of Pomology, Nursery and Enology, University of Life Sciences in Lublin, Gleboka 28, 20-612 Lublin, Poland
*
Author to whom correspondence should be addressed.
Appl. Sci. 2022, 12(14), 7293; https://doi.org/10.3390/app12147293
Submission received: 17 June 2022 / Revised: 14 July 2022 / Accepted: 19 July 2022 / Published: 20 July 2022
(This article belongs to the Section Agricultural Science and Technology)

Abstract

:
Great interest in viticulture in temperate climates results from the introduction of new interspecies hybrids of grapevines which are quite popular due to their high resistance to fungal diseases and lower temperature. However, the impact of rootstocks, common in vine cultivation, is little to not known, which makes setting up vineyards a challenge. This study aimed to evaluate the effect of the following six rootstock types: 101-14 Mgt, SORI, 161-49 C, 5 BB, SO4, 125 AA, and grapevines with their own roots on the yield quantity and berry quality (expressed by Brix extract) of Regent grapevines in temperate climates (southeastern Poland). A five-year experiment alongside a novel numerical model is applied to formulate precise and constructive findings about the rootstock impact in a temperate climate. Both the experimental and numerical part are supported by detailed statistical analysis. The five-year period of study indicates that the vines on rootstock 125 AA yielded the best, significantly. Shrubs grafted on rootstock 161-49 yielded the lowest, while the fruit extract content grafted on rootstock 101-14 was significantly lower among the evaluated ones. The parameters of own-rooted bushes and those grafted on SO4 rootstock did not differ significantly, except for the extract. The model leads to convergent conclusions with statistical analysis of raw experimental data. The 125 AA rootstock was the best for all nine tested case scenarios. On the other hand, 161-49 rootstock was the weakest, justified only in the most challenging conditions.

1. Introduction

On a global scale, the vine is a species of very high economic importance [1,2]. With a farm gate value in 2016 of USD 68 billion, grapes are the world’s third most valuable horticultural crop (after potatoes and tomatoes) [3]. The grapevine (Vitis vinifera L.) is one of the most important fruit crops, with up to 7 million hectares cultivated worldwide in 2020 [4]. Grapevines are mainly grown for wine production and for fresh and dry fruit consumption, but they is also used for seed oil extraction, alcoholic beverage, and vinegar production; moreover, several social, touristic, and cultural activities are linked to its cultivation, generating a positive impact on the economy. In temperate climates, for example in Poland, the cultivation of grapevine enjoys a growing interest and more and more vineyards are being established every year. It should be emphasized that in this condition, cultivation can cause many agrotechnical problems, which result from low knowledge of this thermophilic species [5]. Great interest in viticulture in colder climates results, among other things, from the introduction of new interspecies hybrids of grapevines into the cultivation, the so-called hybrids, which are quite popular due to their high resistance to fungal diseases, especially in organic vineyards. The botanical species Vitis vinifera includes the varieties PIWI (from the German “pilzwiderstandsfähige rebsorten”-vine varieties resistant to fungal diseases), often grown in northern European countries [6,7].
Grapevine cultivation is mainly based on the use of shrubs improved on rootstocks [8,9]. In Poland, where the traditions of vineyard planting are relatively short, and climatic and soil conditions are different than in other wine-growing regions, the use of rootstocks requires many years of observation and research in order to select the most suitable one. Native commercial vineyards are increasingly often established from cuttings grafted on rootstocks imported from Europe. The lack of many years of tradition and practical knowledge of cultivation does not facilitate the selection of rootstocks and varieties. In addition, in recent years, the selection of suitable rootstocks has been made more difficult by the appearance of many new types [10]. According to [11], there is no ideal rootstock that would work well in all positions. It has been found that the rootstocks must be tested for each variety and location because the efficiency of rootstocks is not the same [12]. The grafting of vines has been known since the 2nd century BC. On a larger scale, this method of propagation began to be used after 1880, when there was a serious problem with the root aphid, Daktulosphaira vitifoliae (Fitch), which contributed to the mass extinction of vineyards [13].
By proper selection of rootstock, the grower can influence the degree of vine resistance to vine phylloxera, pH, salinity, and nutrient abundance [14]. Properly selected rootstocks affect growth, yield, and fruit quality as well as wine quality [15,16,17,18,19]. The effect of rootstocks on the different growth and development traits of grapevine vines can be seen to varying degrees because the effects of rootstock on the cultivar and their interactions are still not fully recognized as they depend on many factors, e.g., environmental, physiological, and agrotechnical [20]. It is known that rootstocks affect the size and vigor of plants, and consequently the yield [21,22]. Additionally, the effects of rootstocks may be modified by the cultivar genotype and soil conditions [17]. Many scientific studies have confirmed the beneficial effect of rootstocks on the growth, size, and yield quality of grapevines compared with vines on their own roots [23,24,25,26,27,28,29,30]. A negative or neutral effect of grafting vines on vine productivity has also been demonstrated [31,32,33,34]. Many studies have been conducted on the effect of rootstocks on the degree of frost hardiness, which is important for knowledge and practice due to the location of Polish vineyards. A study by [24] showed a significant effect of rootstock type on frost hardiness of shoots and buds: vines on 3309C rootstocks turned out to be hardier and recovered better after frost damage than on K5BB and S04 rootstocks. The experiments of [25] show that the frost resistance of grafted White Riesling vines is higher than that of own-rooted vines. A significant effect of rootstock on the studied trait was shown for Cabernet Sauvignon and Chardonnay cultivars, as vines grafted on K5BB and 1103P were less damaged than on S04 and 420A rootstocks [26].
The effects of rootstocks on yield, vine vigor, and longevity compared with own-root plants have been studied repeatedly in different wine regions [27,28,29,33,35,36,37,38]. It is worth noting that the obtained results are repeatedly mutually exclusive and do not allow a clear answer regarding the influence of rootstock type on yield parameters [39].
The research presented in this work is innovative, as the evaluation of the PIWI varieties in terms of the impact of the type of rootstock and own-root shrubs on the size and quality of the vine yield is little known compared with varieties commonly grown on a global scale, which belong to the Vitis vinifera species [15,16,17,18,19]. It is worth knowing that the scientific assessment between the own-root shrubs and the stock on rootstocks in the case of Vitis vinifera jumps ahead of the above. The aim of the current work was to study and evaluate the effect of six rootstock types: 125 AA, 101-14, SO4, 5 BB, 161-49, and vines growing on their own roots on the yield size and quality of Regent grapevine under the conditions of southeastern Poland. The presented results will significantly facilitate crop design for production optimization. To increase these advantages, a novel mathematical model of vine growth is constructed [40,41,42]. The objective for this model construction was to provide a comprehensive tool for rootstock selection, based on expected rainfall and annual mean temperature in climate and soil conditions of the Sandomierz Upland in Poland. The Sandomierz Upland is located in southeastern Poland. It occupies the eastern part of the Macroregion of the Kielce Upland with an area of about 1140 km 2 . A characteristic feature is the occurrence of fertile black soil (so-called Chernozem) belonging to the azonal soils. They are distinguished by a significant thickness of caries levels exceeding 40 cm and a high content of caries (about 4%). Black clergy is less, which is subjected to severe erosion, which results in frequently occurring loess gorges. Lessa shows the ability to accumulate a large amount of water available to plants and contains chemical elements necessary for their development. The soil and atmospheric conditions make Sandomierz highlands used for agriculture, mainly for vine, vegetable or fruit growing.

2. Materials and Methods

2.1. Field Measurements and Statistical Analysis

The research was conducted from 2016 to 2020 at NOBILIS Vineyard (50 39 N; 21 34 E) in the Sandomierz Upland in southeastern Poland. The research material consisted of Regent variety vines, which were planted in spring 2010 at 2.0 × 1.0 m spacing (5000 pcs × ha 1 ) on lessive soil made from loess, which comprised 2.1% organic matter. The plants were managed as a single Guyot twine with a trunk height of 40 cm, a single bed of about 0.9 m length, and 1 two-eyed pivot. In the course of the experiment, regular protection against diseases, pests, and weeds was provided in accordance with the current vine protection 10 of 15 recommendations. The bushes were not irrigated, and soil pH ranged from 6.0 to 6.5, depending on the study year. In the bud-bursting phase, Hydrocomplex fertilizer (12N-11P-18K) was applied in the soil at a dose of 300 kg ha 1 , and other macro- and microelements were supplemented through foliar fertilization when needed.
In the experiment, the effect of rootstock type on the quantity and quality of Regent grapevine yield was evaluated. The vines of the studied cultivars grew on 6 types of the following rootstocks: 101-14 Mgt, SORI, BB-49, 161-49 C, SO4, and 125 AA, the control were the bushes that were not grafted, growing on their own roots.
The following parameters were analyzed: number and weight of grapes, number and weight of berries, and total Brix extract content (as arbitrary measurement of berries quality). Yield and number of grapes per bush were determined by counting and weighing berries from each bush with an accuracy of 0.001 kg. Average berry weight was determined by weighing and counting berries from five medium-sized clusters from each replicate. The fruit extract content was measured on the harvest day using a refractometer Abbe WAY 2W (EnviSense, Lublin, Poland) in juice squeezed from 100 representative berries collected from each combination. Alongside the plants parameters, the weather conditions were registered as they are very important factors influencing growth [43].
Meteorological data was collected using the Pessl Instruments: iMETOS meteorological stations. The data recorder was located in Pęchów, about 8 km from the place of research. iMETOS was powered by a battery and solar panel. The data recorder had a built-in UMTS/CDMA modem for direct communication with the FieldClimate platform. The system had internal memory and could store up to 8 MB of registered data (approx. 1 month). The data was regularly sent and stored on FieldClimate platform.
The experiment was set up in a randomized block design, including 7 combinations with 5 repetitions. The repetitions were plots in which 3 plants were growing.
After completion of the experiment, the obtained results were subjected to statistical analysis using one-way analysis of variance. Moreover, the obtained results were presented in graphical form. The inference was performed at the significance level of p < 0.05. Using Pearson correlation coefficients, correlations were established between individual measured parameters. In addition, multivariate data analysis techniques were performed using cluster analysis, the purpose of which was to group rootstock types into homogeneous groups, such that in one cluster the objects were more similar to each other than to the objects of other clusters. The results of the conducted analysis were presented by means of a dendrogram. All analyses performed were conducted using SAS Enterprise Guide 5.1 software.

2.2. Model Development and Optimization

The experimental data described in the previous section were utilized to construct and optimize a mathematical model, biding environmental conditions, such as average temperature (T a v g ) and rainfall (R s u m ) in the selected season, with expected berry yield and the impact of the rootstock [44]. The calculation was performed in the MATLAB environment, more specifically with The Curve Fitting Toolbox and The Optimization Toolbox. The methodology was split into two parts. First, a raw fitting of the polynomial 3d surface of the selected parameter was performed versus experimental data. The polynomial has the following form:
f T a v g , R s u m = p 00 + p 10 T a v g + p 01 R s u m + p 11 T a v g R s u m + p 02 R s u m 2
The next step was intended to increase the accuracy by including interactions between modeled parameters. In addition, the impact of the monthly deviation between temperature and rain measured in the selected year was included. This was obtained by including the standard deviation ( T S D , and R S D ) of these two parameters in the model equation. The calculations were performed by the fmincon algorithm [45], started within the GlobalSearch procedure, to limit the possibility of a local minimum trap [46]. The exact number and type of interaction was dependent on statistical analysis (see Results and Discussion Section). The final forms for the mentioned parameters are presented below:
N C i n t e r T a v g , R s u m = N C T a v g , R s u m + B W T a v g , R s u m p B W _ n c + N B T a v g , R s u m p N B _ n c + E B T a v g , R s u m p E B _ n c + T S D p T _ n c + R S D p R _ n c
N B i n t e r T a v g , R s u m = N B T a v g , R s u m + N C T a v g , R s u m p N C _ n b + E B T a v g , R s u m p E B _ n b + T S D p T _ n b + R S D p R _ n b
B W i n t e r T a v g , R s u m = B W T a v g , R s u m + N C T a v g , R s u m p N C _ b w + T S D p T _ b w + R S D p R _ b w
E B i n t e r T a v g , R s u m = E B T a v g , R s u m + N C T a v g , R s u m p N C _ e b + N B T a v g , R s u m p B B _ e b + T S D p T _ e b + R S D p R _ e b
where pX_x denominates the coefficients to be optimized within fmincon algorithm [47].

3. Results and Discussion

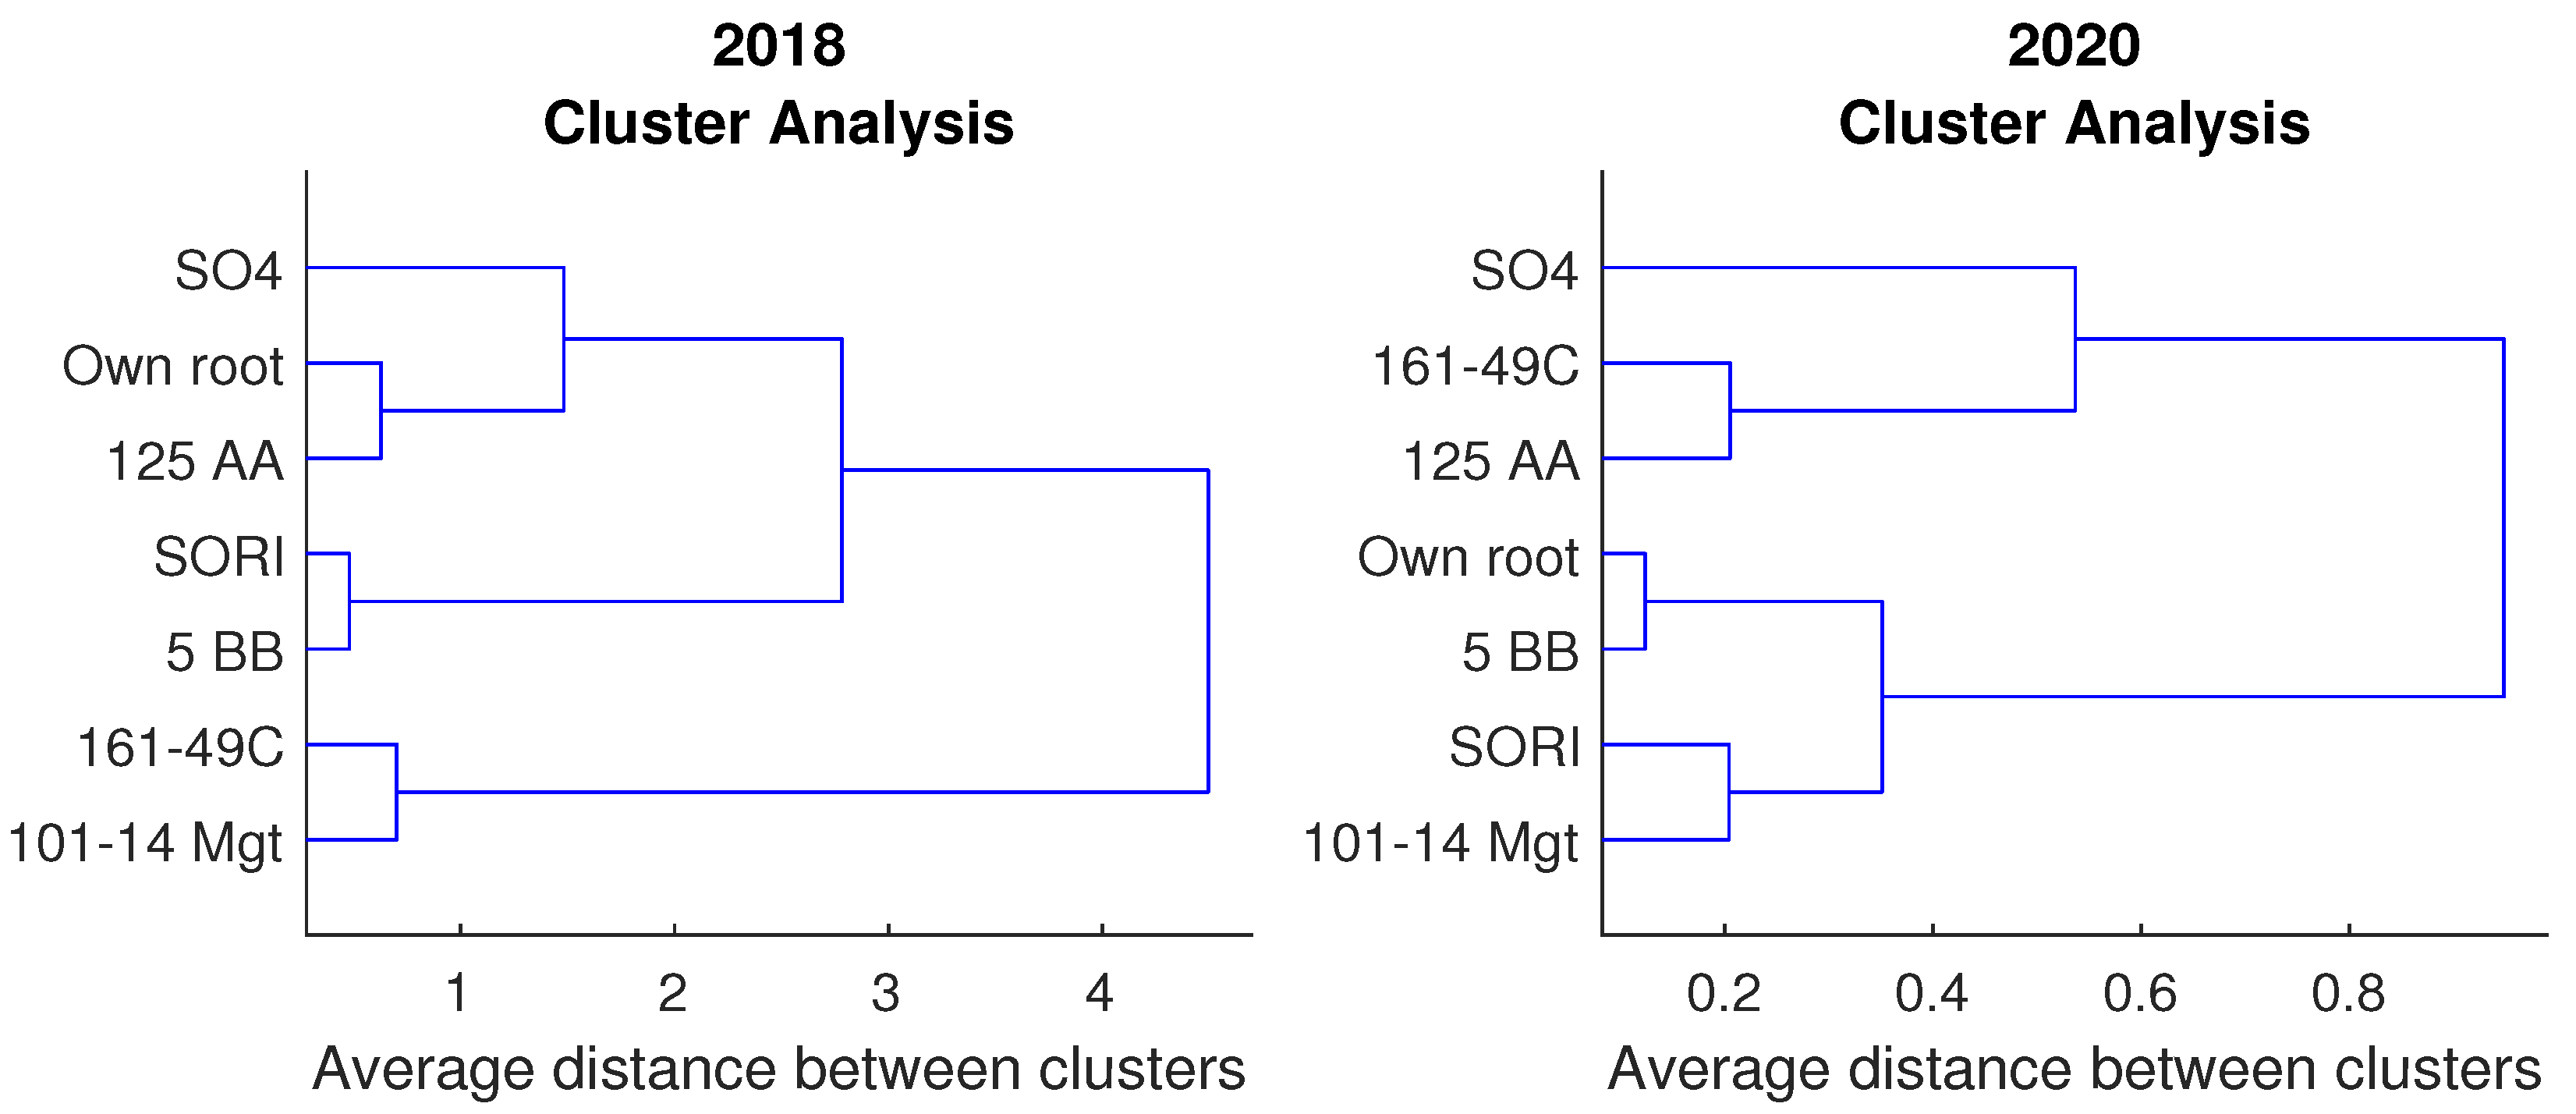
3.1. Summary of 5-Year Observation

Table 1 shows the average monthly air temperatures and precipitation totals for the months of April to October from 2016 to 2020. It was observed that the weather conditions during most of the growing seasons were favorable for grapevine cultivation. The average air temperature in the months from April to October in the consecutive years of the study was higher than the multiyear average. The warmest year was 2018, while the coolest year was 2017. Precipitation totals during the months of April through October in 2017 were greater than multiyear totals. The trend was the opposite in the other years of the study. The average air temperature was higher than the average for many years, the opposite relationship was observed in the case of the sum of precipitation.
The five-year observation showed a significant effect of rootstock type on the yield and properties of Regent grapevines. The average number of grapes on a vine of Regent cultivar ranged from 17.76 to 20.86 and differed significantly between the assessed rootstock types (Table 2). The significantly highest number of grapes was on vines grafted on 125 AA rootstock and the least on 161-49 C rootstock. Statistical analysis showed no significant differences in the evaluation of the examined parameter between SO4 rootstocks and own-root shrubs as well as 101-14 Mgt, SORI, and 5 BB. The years of the study significantly modified the level of the evaluated yield parameter. It was found that in 2018, the number of clusters per bush was significantly higher than in the other years of the study, while significantly, the fewest clusters were observed in 2020. Research conducted by [34] did not show significant differences in the number of clusters of the eight grape varieties assessed between bushes grafted on S04 and 5 BB. A study by [30] showed an effect of rootstock on the number of grapes of the Thompson Seedless grape variety; on average, for the four years of the study, shrubs grafted on 110R rootstock produced the most grapes. [27], evaluating Cabernet Franc vines showed that they produced fewer grapes on their own roots than on rootstocks: 3309C, 101-14 Mgt, 5C, 1616E, 18-815C, and 5 BB.
The cluster weight ranged from 97.20 to 133.78 g and was significantly modified by the type of rootstock used. It was found that the shrubs grafted on 125 AA rootstock had the largest clusters, significantly, while the smallest ones, significantly, were on 5 BB and 161-49 C rootstocks. No significant differences in the evaluation of the examined trait were found between SO4 rootstocks, own-root shrubs, and SORI or between 5 BB, 161-49 D, and 101-14 Mgt. The years of the study had a significant effect on the cluster size of Regent grapevines. It was shown that the 2018 vines had significantly heavier clusters than the other years of the study, while they had the smallest clusters in 2020, significantly. Ref. [29] found that grafted Sultana bushes always had smaller fruit than from bushes on their own roots. Observations by [30] showed that in most cases shrubs grafted on rootstocks produced larger clusters than own-rooted shrubs, the exception being plants grafted on ST. George. Ref. [34], evaluating Chardonnay, Gewurztraminer, Ortega, Riesling, DeChaunae, Marechal Foch, Okanagan Riesling, Seyval Blanc, and Verdelet vines grafted on 3309C, K5BB, 5C, and S04 rootstocks, did not find any significant effect of rootstock on yield, number, or weight of grapes and berries. They suggested that the use of rootstocks has no significant advantage over shrubs on their own roots under Pacific North Western U.S. and British Columbia conditions. A study by [48] showed a significant effect of rootstock type on cluster weight and berry quality parameters of Round Seedless grapevines. On average, significantly higher weight was achieved by clusters of vines grafted on 110R than on Rup, Du Lot, and 1616C. Significantly larger berries were obtained from vines grafted on 110R than on the others. Similar effects of rootstock type on grapevine yield and properties were shown by [30,49,50].
The number of berries per cluster ranged from 75.66 to 88.27 and differed significantly between the assessed rootstock types (Table 2). Shrubs grafted on SO4 rootstock were characterized by clusters with the highest number of berries, while in the case of shrubs on 161-49C and 5 BB this relationship was reversed. The years of the study had a significant effect on the degree of filling of clusters with berries. In 2018, regardless of the type of rootstock used, the clusters of the studied grape variety produced the most berries, significantly, while in 2020 the least, significantly. A significant effect of rootstock type on the number in a cluster was also demonstrated by [34], in the case of the Gewurztraminer cultivar, who found that bushes on SO4 rootstock produced significantly more berries than on 5 BB. The authors mentioned above observed that the number of berries in clusters from own-rooted bushes and those grafted on SO4 rootstocks did not differ significantly in the case of Seyval, Verdelet, and Ortega cultivars, while in Marechal Foch and Gewurztraminer cultivars the bushes on their own roots formed clusters with significantly more berries than those grafted on SO4. [27] demonstrated the lack of significant effect of rootstock type on the examined parameter in shrubs of De Chaunae, Okanagan Riesling, Chardonnay, and Riesling cultivars, while in Cabernet Frane cultivar, they found that rootstocks S04, 5C, and 18-815C tended to produce large clusters with a high number of berries, while own-root shrubs produced small clusters with a lower number of berries.
The berry weight of Regent grapevines differed significantly depending on the type of rootstock used: shrubs grafted on 125 AA produced the heaviest berries among the combinations evaluated, significantly, and the lightest on 101-14 Mgt, significantly (Table 2). The analysis showed no significant differences in berry weight between the 161-49 rootstocks, SO4, and own-rooted vines as well as between SORI, 5 BB, SO4, and own-rooted vines, as well as 101-14 Mgt, SORI, and 5 BB. The 2020 Regent vines produced the smallest fruit over the entire study cycle, significantly.
The grape extract level of the studied grape variety was significantly modified by the type of rootstock used. Grapes from bushes grafted on SO4 rootstock were characterized by the highest extract level, while from 101-14 Mgt rootstock by the lowest. There was no significant effect of rootstock on the level of the examined parameter in the case of types: SORI, 161-49 C, 5 BB, and 125 AA. The years of the study significantly modified the level of the evaluated parameter. The fruit had the highest extract in 2018 and the lowest in 2020, significantly. Ref. [19] demonstrated a significant impact of the year of research on the level of grapevine extract of the Albariño variety grafted on nine types of rootstocks. Ref. [51], evaluating the effect of rootstocks on the extract content of Chardonel grapevines, found that own-root vines were characterized by significantly higher extract levels than those grafted on Cyntiana and 5 BB rootstocks.
Grapevine fruit yield of Regent cultivar ranged from 1.78 to 2.87 kg·bush 1 , i.e., from 8.90 to 14.35 t·ha 1 , and it differed significantly among the evaluated combinations (Table 2). It was shown that on average for the whole cycle of studies, shrubs grafted on 125 AA rootstock yielded the best among all evaluated plants, significantly, while the 101-14 Mgt, 161-49, and 5 BB grafts yielded the lowest, significantly. There were no significant differences in yield between shrubs grafted on SO4 and own-rooted ones. A significant effect of the year of study on the evaluated parameter was found. In 2018, the bushes of the studied grapevine cultivar yielded the best, significantly, while in 2020 the lowest, significantly. The positive influence of rootstocks on yield, vine vigor, and longevity in comparison with own-rooted plants was shown by [35] by evaluating 14 rootstocks and 12 grapevine cultivars. A different relationship was shown by [38] by evaluating the effect of 1103 P, SO4, Dog Ridge rootstocks, and own-rooted vines on the yield of Thompson Seedless, Flame Seedless, and Kishmish cultivars, finding that regardless of cultivar, own-rooted vines yielded better than those grafted on SO4 rootstock. Among the grafted shrubs, shrubs on SO4 yielded the least, while those on Dog Ridge yielded the best. Ref. [36] showed that the yields of all grafted vine varieties evaluated in his study were significantly higher than those of varieties on their own roots, with special attention paid to the rootstocks: Ramsey and Dog Ridge. Similarly, ref. [27] showed higher productivity of grafted Cabernet Fran and White Riesling varieties than own-root varieties. Ref. [28] showed that Grüner Veltliner vines grafted on SO4, K5BB, and 5C rootstocks had higher growth vigor and wood production (green matter) than vines on their own roots. Ref. [33] showed no differences in yield, fruit composition, and green matter removed between shrubs on rootstocks and on own roots in the Gewürztraminer cultivar. Ref. [37] showed that Erbaluce shrubs grafted on 101-14, 420 A, Rupestris du Lot, K5BB, and SO4 were characterized by lower viability than on their own roots.
Additional analysis of selected parameters, i.e., fruit extract (Figure 1), total yield (Figure 2), and berry weight (Figure 3), for two extreme years of the study was conducted.
Three distinct clusters were observed in fruit extract in both years. Cluster one in both analyzed vintages is SO4 rootstock, similarly shaped to cluster three, which consists of 125 AA and 101-14 Mgt rootstocks. Cluster two in both vintages is the largest and is divided into two subgroups. In 2018, one subgroup was 5BB and the SORI and own-root rootstocks, while the outlier was 161-49C. In 2020, two subgroups were separated, the first being SORI and 5 BB rootstocks, and the second being own root and 161-49C.
Two distinct clusters were observed in total yield in both years. In 2018, the first cluster consists of own root and rootstock 125 AA and outlier SO4. The second cluster consists of two subgroups, the first being SORI and 5 BB rootstocks, and the second being 161-49C and 101-14 Mgt. The year 2020 shows a similar split between the two clusters and subgroups. The first cluster consists of pads 161-49C and 125 AA and outlier SO4. The second cluster consists of two subgroups, the first being similarities between own root and rootstock 5 BB, and the second being SORI and 101-14 Mgt.
Three distinct clusters were observed in berry weights in both years analyzed. The third cluster in both years consists of SORI and 101-14 Mgt rootstocks. In 2018, cluster one consisted of own root and rootstock 125 AA, while cluster two consisted of SO4 and 5 BB, showing the least similarity to 161-49C. In 2020, the first cluster consisted of the 125 AA rootstock, which was also the outlier, and the other types analyzed. The second-largest cluster consisted of two subgroups, the first being own root and rootstock 5 BB, while the second subgroup consisted of SO4 and 161-49C.
Pearson correlation analysis showed significant correlations between the assessed parameters of yield quantity and quality of Regent grapevine (Table 3). A significant correlation was found between berry weight and the number of clusters per bush, the number of berries per cluster, and the extract. It was found that the number of clusters per bush correlated strongly with cluster weight, number of berries per cluster, and extract, while cluster weight with berry weight and extract, number of berries per cluster with extract, and total yield with berry weight and extract. A very strong correlation was shown between total yield and number of clusters per bush, cluster weight and the number of berries per cluster, and between cluster weight and the number of berries per cluster.
The multivariate correlation coefficient showed a significant effect of time on the analyzed parameters of yield quantity and berries quality (Table 4). As the considered vine age increased, a decrease in all analyzed parameters was found.
The sum PC of the total variable for the analyzed traits in 2018 was 85.89% (64.8% for PC1 and 21.09% for PC2, respectively (Figure 4)). Analyzing the evaluated parameters in 2018, three groups of clusters were found. The first is the extract and the second is the relationship between the number of clusters per bush and berry weight. The third-largest cluster is the relationship between yield, cluster weight, and the number of berries per cluster. The sum of the PC of the integer variable for the analyzed features in 2020 was 81.77% (58.04% for PC1 and 23.73% for PC2, respectively (Figure 4)). When analyzing the assessed parameters in 2020, two groups of clusters were distinguished. The first is the number of clusters per bush, and the second is the largest cluster containing the remaining parameters: the relationship between the extract, berry weight, yield, cluster weight, and the number of berries.

3.2. Model Optimization Result and Its Final Accuracy

Statistical analysis was required to indicate which interactions between optimized parameters are statistically important and should be included in the final model equations. Pearson’s correlation was used to arbitrarily determine the importance (see Table 5). The average p-value within all samples tested was 0.58. However, for the weight of the berry, the correlations were generally weaker, varying between 0.3289 and 0.4801. For this reason, the threshold was assumed to be 0.45. Any correlations below this value were assumed to be too weak to be considered in the model. In the result, the number of clusters was recognized to be connected to the number of berries, the weight of the berries, and the Brix Extract. The number of clusters is backward-related to the number of clusters, as well as with the extract. The weight of the berries indicated a correlation only with the number of clusters. The extract was correlated with the number of berries but also with its weight. No backward correlation was recognized with the weight of the berry.
The benchmark of obtained model equations (see Model Development and Optimization Section) indicated a very high correlation between predicted values and actual measurements. The total error was calculated as the mean of relative errors (where n is the number of experimental points) for all variables, which was also the objective function for the fmincon algorithm.
E total = 1 n N C inter N C experimetal N C experimetal + N B inter N B experimetal N B experimetal + B W inter B W experimetal B W experimetal + E B inter E B experimetal E B experimetal
An interesting observation can be also noted for specific rootstock types (Table 6). The total sum of relative errors for all four tested parameters was the lowest for SO4 (under 7%), while significantly higher for SORI and 125 AA. The own root was ranked in the middle. It is also worth looking at 5 BB rootstock. This is the only one case where including interaction had a mixed impact on the accuracy of measured parameters. The precision slightly decreased for the number of clusters, berry weight, and Brix extract but strongly increased for the number of berries. This resulted in a more balanced distribution of errors between variables but insignificantly better total accuracy (0.70%). The opposite tendency can be noticed for SO4 and own root, where the interactions raised the precision by over 35%, the most strongly for the number of berries prediction. This proves that any of the presented rootstocks indicate different properties and should be considered individually.

3.3. Case Study with the Presented Model

To present the practical application of the obtained model, a case study was performed. The total number of nine scenarios was entered into the model, representing different combinations of the temperature and rainfall values. Each parameter was examined on three different levels. The upper temperature value was selected equal to the highest annual mean registered within the experimental data used in this study (15.88 °C). The middle value was the mean of all the considered years (14.53 °C), and the lower limit was 13.56 °C, which was equal to the minimum within all annual means. Analogical assigning was made for rainfall of 51.05 mm, 41.74 mm, and 31.88 mm, respectively. The standard deviation for both parameters was selected to represent relatively stable conditions; thus, it was calculated as the mean value within all years tested (4.27 °C, 17.64 mm) and remained the same for all scenarios tested. Although the model predicted all four mentioned parameters, the objective for the case study was the total yield of berry from the wine vine.
Yield = NC × NB × BW
For moderate annual temperatures, the benefits of alternate rootstocks increased (Table 7). For high rainfall values, this was not so clear, as the own root indicated a slightly higher yield. However, for the middle and lower values of this parameter, the 125 AA rootstock provided significantly better results. With a deeper decline of temperatures, this tendency strengthens. Again, the 125 AA rootstock is a good solution in 2 of 3 cases. However, the most surprising is Case 8, which was determined as the most challenging for vine harvesting. Low annual temperatures and rainfall lead to a very unfavorable situation of very low yield. The 161-49C rootstock indicated the highest yield, but it was still much lower than in other conditions. Even more interestingly, this rootstock was definitely the weakest in the six scenarios tested. This leads to the conclusion that the only situation when this rootstock should be connected with vine variety considered in this study is when expected conditions will be very challenging. In any other cases, it is recommended to use some of the other solutions, such as 125 AA or own rootstock.

4. Conclusions

By using different types of rootstocks in grapevine cultivation under the conditions of southeastern Poland, we can influence the yield and overall consumer values of the Regent variety berries. The obtained results may be useful for vine cultivation in the Sandomierska Upland. Several years of observation showed that the vines grafted on 125 AA rootstock yielded the best among the evaluated rootstocks, significantly. They were also characterized by the highest number and weight of grapes and the highest weight of berries. Shrubs grafted on rootstock 161-49 yielded the lowest and were characterized by the lowest number of grapes per shrub, while the fruit extract content of Regent cultivar grafted on rootstock 101-14 was significantly lower among the evaluated ones. The evaluated parameters of yield quantity, berries, consumer values of own-rooted bushes, and those grafted on SO4 rootstock did not differ significantly from each other, except for the extract.
In the last decade, an increase in weather anomalies has been observed, which can have a key effect on the amplitude that was presented and highlighted in the developed model. However, short extreme weather conditions are highly unpredictable and cannot be included in the models. The proposed model leads to convergent conclusions with statistical analysis of raw experimental data. The 125 AA rootstock was arbitrarily the best for all nine tested scenarios, sometimes sharing the lead with own-root vines. On the other hand, the 161-49 rootstock was the weakest, justified only in the most challenging conditions. Nonetheless, it was mentioned that this conclusion is valid only for the Regent variety. Combinations of other varieties and rootstocks may have different reactions. The model precision was very satisfying. The Mean value of relative errors for all rootstocks and tested parameters was 2.15%. The obtained tools also allow formulating general conclusions about the impact of temperature and rainfall on expected berry yield.

Author Contributions

Conceptualization, K.K. and K.P.; methodology K.P.; formal analysis K.K.; investigation M.K. (Magdalena Kapłan); writing—original draft preparation, K.K. and K.P.; supervision. M.K. (Marek Kułażyński). All authors have read and agreed to the published version of the manuscript.

Funding

This work was financed by a statutory activity for the year 2021 from the Polish Minister of Education and Science.

Institutional Review Board Statement

Not applicable.

Informed Consent Statement

Not applicable.

Data Availability Statement

The data presented in this study are available on request from the corresponding author.

Acknowledgments

The authors would like to show their gratitude to the NOBILIS Vineyard (Sandomierz Upland, Świętokrzyskie Voivodeship, Poland) for providing the research material.

Conflicts of Interest

The authors declare no conflict of interest.

Abbreviations

The following abbreviations are used in this manuscript:
101-14 MgtRootstock 101-14 Millardet et de Grasset
125 AARootstock KOBER 125 AA
161-49CRootstock 161-49 Couderc
5 BBRootstock KOBER 5 BB
B W Berry weight [g], measured or from raw interpolation
C W Cluster weight [g]
E B Extract Brix, measured or from raw interpolation
N B Number of berries [pcs], measured or from raw interpolation
N C Number of clusters [pcs], measured or from raw interpolation
p X X Polynomial coefficient
p X X x x interaction coefficient of model for a denoted pair of parameters
R S D Seasonal sum of precipitation [mm]
R s u m Seasonal sum of precipitation [mm]
S O 4 Rootstock Selektion Oppenheim 4
S O R I Rootstock SORI
T a v g Average seasonal temperature [°C]
T S D Standard deviation of temperature in season [°C]
X X i n t e r Value of denoted variable, modeled including interactions
Y h a Grape yield per hectare [t/ha]

References

  1. Cancelli, U.; Montevecchi, G.; Masino, F.; Mayer-Laigle, C.; Rouau, X.; Antonelli, A. Grape Stalk: A First Attempt to Disentangle Its Fibres via Electrostatic Separation. Food Bioprod. Process. 2020, 124, 455–468. [Google Scholar] [CrossRef]
  2. Bettenfeld, P.; Canals, J.C.I.; Jacquens, L.; Fernandez, O.; Fontaine, F.; van Schaik, E.; Courty, P.E.; Trouvelot, S. The Microbiota of the Grapevine Holobiont: A Key Component of Plant Health. J. Adv. Res. 2021. [Google Scholar] [CrossRef]
  3. Alston, J.M.; Sambucci, O. Grapes in the World Economy. In The Grape Genome; Cantu, D., Walker, M.A., Eds.; Compendium of Plant Genomes; Springer International Publishing: Cham, Switzerland, 2019; pp. 1–24. [Google Scholar] [CrossRef]
  4. FAOSTAT, (Food and Agriculture Organization). Available online: https://www.fao.org/faostat/en/#data/QCL (accessed on 6 July 2022).
  5. Myśliwiec, R. Uprawa Winorośli; Plantpress: Kraków, Poland, 2009. [Google Scholar]
  6. Raddova, J.; Stefkova, A.; Sotolar, R.; Baranek, M. Genetic Analysis of Vitis Interspecific Hybrids Occurring in Vineyards of the Czech Republic. Pak. J. Bot. 2016, 48, 681–688. [Google Scholar]
  7. De la Fuente Lloreda, M. Use of Hybrids in Viticulture. A Challenge for the OIV. OENO One 2018, 52, 231–234. [Google Scholar] [CrossRef]
  8. Xie, L.; Wang, P.; Luo, J.; Yi, W.; Deng, J. Optimisation and Numerical Simulation of Shearing Blade Used for Citrus Seedling Grafting. Biosyst. Eng. 2022, 215, 67–79. [Google Scholar] [CrossRef]
  9. Koundouras, S.; Tsialtas, I.T.; Zioziou, E.; Nikolaou, N. Rootstock Effects on the Adaptive Strategies of Grapevine (Vitis Vinifera L. Cv. Cabernet–Sauvignon) under Contrasting Water Status: Leaf Physiological and Structural Responses. Agric. Ecosyst. Environ. 2008, 128, 86–96. [Google Scholar] [CrossRef]
  10. Hajdu, E.; Korac, N.; Cindric, P.; Ivanisevic, D.; Medic, M. The Importance of Clonal Selection of Grapevine and the Role of Selected Clones in Production of Healthy Propagating Stocks. Int. J. Hortic. Sci. 2011, 17, 15–24. [Google Scholar] [CrossRef] [Green Version]
  11. Li, M.; Guo, Z.; Jia, N.; Yuan, J.; Han, B.; Yin, Y.; Sun, Y.; Liu, C.; Zhao, S. Evaluation of Eight Rootstocks on the Growth and Berry Quality of ‘Marselan’ Grapevines. Sci. Hortic. 2019, 248, 58–61. [Google Scholar] [CrossRef]
  12. da Silva, M.J.R.; Paiva, A.P.M.; Pimentel, A.; Sánchez, C.A.P.C.; Callili, D.; Moura, M.F.; Leonel, S.; Tecchio, M.A. Yield Performance of New Juice Grape Varieties Grafted onto Different Rootstocks under Tropical Conditions. Sci. Hortic. 2018, 241, 194–200. [Google Scholar] [CrossRef] [Green Version]
  13. Robinson, J. The Oxford Companion to Wine, 2nd ed.; Oxford University Press: Oxford, UK; New York, NY, USA, 1999. [Google Scholar]
  14. Medrano, H.; Tomás, M.; Martorell, S.; Escalona, J.M.; Pou, A.; Fuentes, S.; Flexas, J.; Bota, J. Improving Water Use Efficiency of Vineyards in Semi-Arid Regions. A Review. Agron. Sustain. Dev. 2015, 35, 499–517. [Google Scholar] [CrossRef] [Green Version]
  15. Sivilotti, P.; Zulini, L.; Peterlunger, E.; Petrussi, C. Sensory Properties of ’Cabernet Sauvignon’ Wines as Affected by Rootstock and Season. Acta Hortic. 2007, 754, 443–448. [Google Scholar] [CrossRef]
  16. Sabir, A.; Doğan, Y.; Tangolar, S.; Kafkas, S. Analysis of Genetic Relatedness among Grapevine Rootstocks by AFLP (Amplified Fragment Length Polymorphism) Markers. J. Food Agric. Environ. 2010, 8, 210–213. [Google Scholar]
  17. Keller, M.; Mills, L.J.; Harbertson, J.F. Rootstock Effects on Deficit-Irrigated Winegrapes in a Dry Climate: Vigor, Yield Formation, and Fruit Ripening. Am. J. Enol. Vitic. 2012, 63, 29–39. [Google Scholar] [CrossRef]
  18. de Souza, C.R.; da Mota, R.V.; França, D.V.C.; Pimentel, R.M.d.A.; Regina, M.D.A. Cabernet Sauvignon Grapevine Grafted onto Rootstocks during the Autumn-Winter Season in Southeastern Brazilian. Sci. Agric. 2015, 72, 138–146. [Google Scholar] [CrossRef] [Green Version]
  19. Vilanova, M.; Genisheva, Z.; Tubío, M.; Alvarez, K.; Lissarrague, J.R.; Oliveira, J.M. Rootstock Effect on Volatile Composition of Albariño Wines. Appl. Sci. 2021, 11, 2135. [Google Scholar] [CrossRef]
  20. Rizk-Alla, M.S.; Sabry, G.H.; Abd-El-Wahab, M.A. Influence of Some Rootstocks on the Performance of Red Globe Grape Cultivar. J. Am. Sci. 2011, 7, 71–81. [Google Scholar]
  21. Sampaio, T.L.B. Using Rootstocks to Manipulate Vine Physiological Performance and Mediate Changes in Fruit and Wine Composition; Oregon State University: Corvallis, OR, USA, 2007. [Google Scholar]
  22. Kapłan, M.; Klimek, K.; Borowy, A.; Najda, A. Effect of Rootstock on Yield Quantity and Quality of Grapevine ‘Regent’ in southeastern Poland. Acta Sci. Pol. Hortorum Cultus 2018, 17, 117–127. [Google Scholar] [CrossRef]
  23. Hedberg, P.R.; McLeod, R.; Cullis, B.; Freeman, B.M. Effect of Rootstock on the Production, Grape and Wine Quality of Shiraz Vines in the Murrumbidgee Irrigation Area. Aust. J. Exp. Agric. 1986, 26, 511–516. [Google Scholar] [CrossRef]
  24. Miller, D.P.; Howell, G.S.; Striegler, R.K. Cane and Bud Hardiness of Selected Grapevine Rootstocks. Am. J. Enol. Vitic. 1988, 39, 55–59. [Google Scholar]
  25. Miller, D.P.; Howell, G.S.; Striegler, R.K. Cane and Bud Hardiness of Own-Rooted White Riesling and Scions of White Riesling and Chardonnay Grafted to Selected Rootstocks. Am. J. Enol. Vitic. 1988, 39, 60–66. [Google Scholar]
  26. Palliotti, A.; Cartechini, A.; Proietti, P. Influence of rootstock and height of training system on spring frost sensibility of Chardonnay and Cabernet Sauvignon grape cultivars in the Umbria region. Ann. Della Fac. Agrar. Univ. Degli Studi Perugia Italy 1991, 45, 283–291. [Google Scholar]
  27. Ferree, D.C.; Cahoon, G.A.; Ellis, M.A.; Scurlock, D.M.; Johns, G.R. Influence of Eight Rootstocks on the Performance of ’White Riesling’ and ’Cabernet Franc’ over Five Years. Fruit Var. J. 1996, 50, 124–130. [Google Scholar]
  28. Wunderer, W.; Fardossi, A.; Schmuckenschlager, J. Influence of Three Different Rootstock Varieties and Two Training Systems on the Efficiency of the Grape Cultivar Grüner Veltliner in Klosterneuburg. Mitteilungen Klosterneubg. Rebe Wein Obstbau FrÜchteverwertung 1999, 49, 57–64. [Google Scholar]
  29. Sommer, K.J.; Islam, M.; Clingeleffer, P.R. Sultana Fruitfulness and Yield as Influenced by Season, Rootstock and Trellis Type. Aust. J. Grape Wine Res. 2001, 7, 19–26. [Google Scholar] [CrossRef]
  30. Satisha, J.; Somkuwar, R.G.; Sharma, J.; Upadhyay, A.K.; Adsule, P.G. Influence of Rootstocks on Growth Yield and Fruit Composition of Thompson Seedless Grapes Grown in the Pune Region of India. S. Afr. J. Enol. Vitic. 2010, 31, 1–8. [Google Scholar] [CrossRef] [Green Version]
  31. Boselli, M.; Fregoni, M.; Vercesi, A.; Volpe, B. Variation in Mineral Composition and Effects on the Growth and Yield of Chardonnay Grapes on Various Rootstocks. Agric. Ric. 1992, 14, 138–139. [Google Scholar]
  32. Ferroni, G.; Scalabrelli, G. Effect of Rootstock on Vegetative Activity and Yield in Grapevine. Acta Hortic. ISHS 1993, 388, 37–42. [Google Scholar] [CrossRef]
  33. Reynolds, A.; Wardle, D. Performance of ‘Gewurztraminer’ (Vitis Vinifera L.) on Three Rootsystems. Fruit Var. J. 1995, 49, 31–33. [Google Scholar]
  34. Reynolds, A.; Wardle, D. Rootstocks Impact Vine Performance and Fruit Composition of Grapes in British Columbia. Hortic. Technol. 2001, 11, 419–427. [Google Scholar] [CrossRef] [Green Version]
  35. Loomis, N.H. Effect of Fourteen Rootstocks on Yield, Vigor, and Longevity of Twelve Varieties of Grapes at Meridian, Mississippi. Proc. Am. Soc. Hortic. Sci. 1952, 59, 125–132. [Google Scholar]
  36. Hedberg, P. Increased Winegrapes Yields with Rootstocks. Farmers Newsl. 1980, 147, 22–24. [Google Scholar]
  37. Novello, V.; De Palma, L.; Bica, D. Rootstock Effects on Vegetative-Productive Indices in Grapevine Cv Erbaluce Trained to Pergola System. Acta Hortic. 1996, 427, 233–240. [Google Scholar] [CrossRef]
  38. Menora, N.; Joshi, V.; Kumar, V.; Vijaya, D.; Debnath, M.; Pattanashe, S.; Padmavatha, A.; Variath, M.; Biradar, S.; Khadakabhavi, S. Influence of Rootstock on Bud Break, Period of Anthesis, Fruit Set, Fruit Ripening, Heat Unit Requirement and Berry Yield of Commercial Grape Varieties. Int. J. Plant Breed. Genet. 2015, 9, 126–135. [Google Scholar] [CrossRef] [Green Version]
  39. Nordey, T.; Schwarz, D.; Kenyon, L.; Manickam, R.; Huat, J. Tapping the Potential of Grafting to Improve the Performance of Vegetable Cropping Systems in Sub-Saharan Africa. A Review. Agron. Sustain. Dev. 2020, 40, 23. [Google Scholar] [CrossRef]
  40. Palacios, F.; Melo-Pinto, P.; Diago, M.P.; Tardaguila, J. Deep Learning and Computer Vision for Assessing the Number of Actual Berries in Commercial Vineyards. Biosyst. Eng. 2022, 218, 175–188. [Google Scholar] [CrossRef]
  41. Mio, A.; Bertagna, S.; Cozzarini, L.; Laurini, E.; Bucci, V.; Marinò, A.; Fermeglia, M. Multiscale Modelling Techniques in Life Cycle Assessment: Application to Nanostructured Polymer Systems in the Maritime Industry. Sustain. Mater. Technol. 2021, 29, e00327. [Google Scholar] [CrossRef]
  42. Mammarella, M.; Comba, L.; Biglia, A.; Dabbene, F.; Gay, P. Cooperation of Unmanned Systems for Agricultural Applications: A Case Study in a Vineyard. Biosyst. Eng. 2021. [Google Scholar] [CrossRef]
  43. Shamshiri, R. Measuring Optimality Degrees of Microclimate Parameters in Protected Cultivation of Tomato under Tropical Climate Condition. Measurement 2017, 106, 236–244. [Google Scholar] [CrossRef]
  44. Barkunan, S.R.; Bhanumathi, V.; Balakrishnan, V. Automatic Irrigation System with Rain Fall Detection in Agricultural Field. Measurement 2020, 156, 107552. [Google Scholar] [CrossRef]
  45. Villaverde, A.F.; Fröhlich, F.; Weindl, D.; Hasenauer, J.; Banga, J.R. Benchmarking Optimization Methods for Parameter Estimation in Large Kinetic Models. Bioinformatics 2019, 35, 830–838. [Google Scholar] [CrossRef]
  46. Ugray, Z.; Lasdon, L.; Plummer, J.; Glover, F.; Kelly, J.; Martí, R. Scatter Search and Local NLP Solvers: A Multistart Framework for Global Optimization. INFORMS J. Comput. 2007, 19, 328–340. [Google Scholar] [CrossRef]
  47. Postawa, K.; Szczygieł, J.; Kułażyński, M. Methods for Anaerobic Digestion Model Fitting–Comparison between Heuristic and Automatic Approach. Biomass Convers. Biorefinery 2020. [Google Scholar] [CrossRef]
  48. Kamİloğlu, Ö. The Effects of Rootstocks and Training Systems on the Growth and Fruit Quality of the ’Round Seedless’ Grape. J. Food Agric. Environ. 2012, 10, 350–354. [Google Scholar]
  49. Ilhan, I.; Yilmaz, N.; Gokçay, E. Comparision of Some Rootstocks Used for ‘Round Seedless’ Grape Variety from the Point of Yield and Quality. In Proceedings of the 4th Viticulture Symposium, Yalova, Turkey, 20–23 October 1998; pp. 212–216. [Google Scholar]
  50. Çelik, M.; Kismali, İ. The Researches on the Effects of Some Rootstocks on Yield, Quality and Vegetative Growth of Round Seedless Cultivar. J. Agric. Fac. Ege Univ. 2003, 40, 1–8. [Google Scholar]
  51. Main, G.; Morris, J.R.; Striegler, K. Rootstock Effects on Chardonel Productivity, Fruit, and Wine Composition. Am. J. Enol. Vitic. 2002, 53, 37–40. [Google Scholar]
Figure 1. Cluster analysis of Regent grape fruit extract considered in the extreme years of the study.
Applsci 12 07293 g001
Figure 2. Cluster analysis of Regent grapevine total yield considered in the extreme years of the study.
Applsci 12 07293 g002
Figure 3. Cluster analysis of Regent grape berry weight considered in the extreme years of the study.
Applsci 12 07293 g003
Figure 4. Principal component analysis of yield quantity and quality of Regent grapevines irrespective of rootstock type considered in the extreme years of the study.
Applsci 12 07293 g004
Table 1. Average monthly air temperatures and total precipitation according to the Agrometeorological Station in Pęchów during the months of April to October in 2016–2020 (Horti ProCam).
Air Temperature, °C
IVVVIVIIVIIIIXXMean from IV to X °C
20169.514.719.119.417.815.67.314.8
20177.614.118.718.719.613.39.014.4
201814.017.619.220.520.415.79.816.7
201910.013.322.619.220.414.510.415.8
20209.511.918.619.320.515.39.915.0
Averagetemperature10.114.319.619.419.714.99.315.3
Mean (1988–2008)8.814.216.919.118.413.48.614,2
Total precipitation, mm
IVVVIVIIVIIIIXX∑ precipitation
201622.438.021.055.247.417.236.6237.8
201780.649.631.426.644.277.072.4381.8
201815.445.240.486.666.238.433.4325.6
201942.259.614.436.451.445.635.0284.6
202011.054.664.244.043.858.278.2354.0
Average precipitation34.349.434.349.850.647.351.1316.8
Mean (1988–2008)45.757.068.782.458.757.037.9361.7
Table 2. Effect of rootstock on size and properties of yield of grapevine Regent cultivar in 2016–2020.
Average Number
of Cluster (pcs)
Cluster Weight (g)Number of Berries
per Cluster (pcs)
Berry Weight (g)Extract, BrixYield (kg·vine−1)Yield (t·ha−1)
Combination (A)101-14 Mgt18.6 ±1.7101.8 ±25.384.2 ±17.51.20 ± 0.119.5 ± 1.21.9 ± 0.69.6 ± 3.0
SORI18.5 ± 2.1108.9 ± 36.287.7 ± 23.21.2 ± 0.220.5 ± 1.62.1 ± 0.810.4 ± 4.1
161-49 C17.8 ± 2.899.0 ± 17.575.7 ± 11.31.3 ± 0.120.6 ± 1.71.8 ± 0.58.9 ± 2.5
5 BB18.7 ± 2.897.2 ± 28.976.9 ± 17.21.3 ± 0.120.7 ± 1.61.9 ± 0.79.3 ± 3.8
SO420.1 ± 2.5113.7 ± 29.888.3 ± 19.61.3 ± 0.121.6 ± 2.22.4 ± 0.811.8 ± 4.2
125 AA20.9 ± 2.5133.8 ± 36.185.8 ± 22.61.6 ± 0.120.8 ± 1.62.9 ± 0.914.4 ± 4.8
Own root20.5 ± 2.4114.8 ± 35.287.7 ± 21.11.3 ± 0.121.2 ± 1.52.4 ± 0.912.1 ± 4.6
p-value *<0.0001<0.0001<0.0001<0.0001<0.0001<0.0001<0.0001
Year (B)201619.7 ± 2.3123.8 ± 21.391.2 ± 7.71.4 ± 0.221.1 ± 0.62.5 ± 0.612.3 ± 3.2
201718.2 ± 2.2103.4 ± 18.481.3 ± 5.51.3 ± 0.219.6 ± 0.71.9 ± 0.59.6 ± 2.7
201821.5 ± 1.1148.5 ± 18.4109.3 ± 10.31.4 ± 0.122.9 ± 1.33.2 ± 0.516.1 ± 2.5
201921.2 ± 0.9109.9 ± 13.483.9 ± 7.71.3 ± 0.121.3 ± 0.12.3 ± 0.311.6 ± 1.6
202015.8 ± 0.463.9 ± 6.753.1 ± 2.61.2 ± 0.118.5 ± 0.41.0 ± 0.15.0 ± 0.6
p-value *<0.0001<0.0001<0.0001<0.0001<0.0001<0.0001<0.0001
A×Bp-value *<0.0001<0.0001<0.0001<0.0001<0.0001<0.0001<0.0001
± Means standard deviation. * Means values marked with the same letters do not differ significantly at p = 0.05.
Table 3. Pearson correlation for quantity and quality parameters of Regent grapevine yield regardless of the year of research and the type of rootstock.
Number of Clusters (pcs)Cluster Weight (g)Number of Berries per Cluster (pcs)Berry Weight (g)Extract, °BrixYield (kg·vine−1)Yield (t·ha−1)
Number of clusters (pcs)1
Cluster weight (g)0.7770
<0.0001
1
Number of berries per cluster (pcs)0.7458
<0.0001
0.9155
<0.0001
1
Berry weight (g)0.4801
<0.0001
0.6749
<0.0001
0.3289
<0.0001
1
Extract, °Brix0.7707
<0.0001
0.7624
<0.0001
0.7705
<0.0001
0.3951
<0.0001
1
Yield (kg·vine−1)0.8793
<0.0001
0.9781
<0.0001
0.8946
<0.0001
0.6571
<0.0001
0.7983
<0.0001
1
Yield (t·ha−1)0.8793
<0.0001
0.9781
<0.0001
0.8946
<0.0001
0.6571
<0.0001
0.7983
<0.0001
0.9789
<0.0001
1
Table 4. Multivariate Pearson correlation analysis for time and weather conditions regardless of rootstock type against yield size and quality parameters.
Number of Clusters (pcs)Cluster Weight (g)Number of Berries per Cluster (pcs)Berry Weight (g)Extract, °BrixYield (kg·vine−1)Yield (t·ha−1)
Year−0.2617−0.4993−0.5317−0.2330−0.2807−0.4131−0.4135
0.0005<0.0001<0.00010.00190.0002<0.0001<0.0001
Table 5. Pearson’s analysis for optimized constants.
Number of Clusters (pcs)Number of Berries per Cluster (pcs)Berry Weight (g)Extract, °Brix
Short nameNCNBBWEB
Number of clusters (pcs)10.7458
<0.0001
0.4801
<0.0001
0.7707
<0.0001
Number of berries per clusters (pcs)0.7458
<0.0001
10.3289
<0.0001
0.7705
<0.0001
Berry weight (g)0.4801
<0.0001
0.3289
<0.0001
10.3951
<0.0001
Extract, °Brix0.7707
<0.0001
0.7705
<0.0001
0.3951
<0.0001
1
Table 6. Results of model benchmark for all variables and rootstocks.
Rootstock Type/VariableNCNBBWEBTotal
101-14 MgtChange[%]7.2226.831.432.1611.32
Final error[%]1.822.894.211.1710.09
SORIChange[%]1.0445.770.652.7217.74
Final error[%]1.793.367.281.1713.60
161-49CChange[%]0.951.613.283.362.57
Final error[%]1.141.953.831.148.06
5 BBChange[%]−0.772.75−0.49−2.100.70
Final error[%]1.114.894.161.3611.53
SO4Change[%]3.8579.542.5917.5435.46
Final error[%]0.930.863.521.636.95
125 AAChange[%]1.516.020.530.694.10
Final error[%]0.908.172.691.3413.11
Own rootChange[%]2.2583.461.091.1836.46
Final error[%]1.350.935.100.988.36
MeanChange[%]2.2935.141.303.6515.48
Final error[%]1.293.294.401.2610.24
Table 7. Model-based berry yield predictions for tested scenarios.
CaseTemp.RainfallBestYieldWorstYield
[°C][mm] [kg/vine] [kg/vine]
1HighHighOwn root9.413161-49C2.406
2HighMidOwn root3.617161-49C2.578
3HighLow125 AA13.47161-49C5.420
4MidHighOwn root4.469161-49C1.841
5MidMid125 AA1.233Own root0.8444
6MidLow125 AA5.881161-49C2.749
7LowHigh125 AA2.7275 BB1.273
8LowMid161-49C0.5143Own root0.01241
9LowLow125 AA2.680161-49C1.401
Publisher’s Note: MDPI stays neutral with regard to jurisdictional claims in published maps and institutional affiliations.

