
Sustainable Design Strategy of Cosmetic Packaging in China Based on Life Cycle Assessment

School of Art and Design, Shanghai University of Engineering Science, Shanghai 201620, China
*
Author to whom correspondence should be addressed.
Sustainability 2022, 14(13), 8155; https://doi.org/10.3390/su14138155
Submission received: 31 May 2022
/
Revised: 1 July 2022
/
Accepted: 1 July 2022
/
Published: 4 July 2022
(This article belongs to the Collection Circular Economy Approaches for Lifecycles of Products and Services)
Abstract
:Consumptions of cosmetics present a steady growth trend from 2018 to 2021 in China. While environmental impact generated are becoming prominent issues. Numbers of research on the sustainability of cosmetics are focusing on ingredient choices and production; however, the packaging generates more impact than the ingredient extraction in some specific scenarios, and it should be paid more attention to. The role of packaging deserves deep consideration under the background of a circular economy. This research aims to: (i) figure out the impact hotspot through life cycle assessment (LCA) of representative cosmetic packaging in the Chinese market, (ii) conduct a series of sensitivity analyses to figure out to what extent these potential scenarios influence the environmental performance of the packaging, (iii) obtain the significance of these variables to the sustainable design of the packaging. Finally, a set of sustainable design strategies for cosmetic packaging are proposed for the designer from the aspect of facilitating user reuse and recycling behaviour, material selection, and others.
1. Introduction
With the rapid development of the living standard in China, the demand for cosmetics has grown steadily in recent years. The pursuit of external beauty and a delicate impression may become the major drives after the rise in living conditions, along with economic growth. Cosmetics are switching their role from alternative merchandise to daily necessities underpinned by thriving e-commerce.
As Figure 1 shows, the retail value of the cosmetics category in China kept growing from 2018 to 2021. Current period values illustrated there were three sales peaks in one year, March, the period after the Chinese New Year, June and November, and two shopping festivals, 618 and Double 11. The year-on-year and cumulative growth rates were greater than zero in most of the period; it only dropped below zero during the initial stage of the COVID-19 epidemic period, from January to June 2020, and grew again after the epidemic was under control; moreover, a huge growth appeared in March 2021. A notable growth in retail sales can be predicted. Accordingly, cumulative values presented an increasing trend as the peaks were higher and higher yearly [1].
Meanwhile, a male consumption consciousness of cosmetics is awakening recently; 10 million units of merchandise were stocked for Double Eleven Shopping Day in 2020, which was almost twice as much as in 2019. In addition, imported cosmetics for men have grown rapidly, by nearly 3000%; a previous report has shown that 31% of men expressed they would never use them, but the proportion had decreased to 10% in 2019 [2]. Skincare products for men increased by 30% in 2020 [3].
With the rapid rise in sales, waste of cosmetic packaging after the use stage increases at the same time. Furthermore, a shift from reusable packaging to single-use one due to globalisation and simplification of the supply chain is observed [4]. The relationship between humans and the environment deserves deep consideration under the background of the circular economy. Reducing the environmental impact of the packaging during the whole life cycle through a recycling-oriented material selection, reasonable purchase and consumption, instructive recycling and reuse is the pursuit of the circular economy [5].
Life Cycle Assessment (LCA) is a powerful tool for quantitative research on the sustainability of a system or product as an observer; it has been used to evaluate the environmental impact of a set of raw materials for packaging, including wood and plastic material [6], PET bottle [7], biomass-based and oil-based plastics [8], beverage packaging [9], multilayer polymer bag [10] and bio-plastic for food packaging [11]. LCA is also recommended by Escursell et al. [12] as a tool to verify the environmental performance of the new solutions for packaging design. Sustainable or ecological design becomes more effective if working with LCA. Civancik-Uslu et al. [13] used LCA to figure out the key life cycle stage of cosmetic packaging to implement eco-design is the raw material production and recycling; in the case study, mineral fillers are partially used for production instead of virgin petrochemicals to reduce the eco-impact of the packaging.
So far, most of the research on the sustainability of packaging mainly focuses on food-related products, because it is strongly associated with human daily health. Numbers of research on the sustainability of cosmetics put attention on the ingredient choices and production but not the packaging aspect [14,15]; however, in some specific scenarios, the packaging generates more impact than the ingredient extraction [16], and it should be brought to the forefront now.
Reuse and recycling play important roles in sustainable packaging. Well-designed, refillable and reusable packaging, considering re-sealability, user-friendliness, and choice of material, can reduce environmental impact [4,17]. In addition, reuse has a greater effect than recycling, as the latter depends on consumer recycling behaviour [18,19].
However, a study illustrates that purchasing and recycling behaviours of consumers depend on their environmental awareness, positive attitude to green purchasing, etc. [20]. The question is that consumers evaluate packaging through subjective feelings to design, graphics, material, and supposed recyclability [21,22]; besides, they can be easily misled by salient cues that may not reflect actual environmental impacts. Two recent pieces of research indicated that consumer perceptions do not align with LCA results; plastic is underestimated, and glass and biodegradable plastics are overestimated [21,23].
Furthermore, some sustainable packaging has eco-label, but consumers have limited knowledge [22]. A survey reveals that urban consumers had an overall low perception of carbon-labelled products in Chengdu, China, which will influence purchase behaviour significantly [24].
Several studies show a set of potential solutions for filling the gap between consumers and sustainable packaging. Sustainable packaging needs to be designed with good communication and interaction, to highlight the environmental benefits of the product and the packaging, and to inform consumers of the proper way to reuse and recycle, and how their behaviours can contribute to reducing the environmental impact [21,25,26].
On the other hand, robust modelling of the use phase considering consumer behaviour is crucial during the LCA and sustainable design. Intervention that changes consumer behaviour generated by redesigning the packaging will be a good approach for reducing the impact [27].
In other words, the designer can influence consumer purchase, consumption, recycling and reuse behaviour through the sustainable design approach. Therefore, the design phase is a crucial life cycle stage for cosmetics because the environmental impact of other stages and the whole system are generally defined at this phase; this means it has a higher decisive effect on the environmental performance of the product than other stages [28].
This research aims to figure out to what extent sustainable design influences the environmental performance of the packaging and propose a set of sustainable design strategies for cosmetic packaging through the following processes:
- To perform a literature review on aspects of cosmetic packaging design, sustainable design, consumer behaviour and LCA.
- To conduct LCA of a group of representative cosmetic packaging according to the product that an international leading cosmetic company put on the China market in 2021, and figure out the main contribution to the environmental impact and opportunities for sustainable design.
- To propose a series of potential scenarios for improving the environmental performance from aspects including recycling, material use, appropriate use, transportation, and direct reuse. To evaluate the improved concepts through LCA and sensitivity analysis.
- To evaluate the significance of these variables in scenarios to the sustainable design of these cosmetic packaging through sensitivity analysis.
- To propose a set of sustainable design strategies for cosmetic packaging.
2. Materials and Methods
2.1. Introduction of LCA
Life Cycle Assessment (LCA) is a quantitative analysis tool for evaluating the sustainability of a system or product’s life cycle, including raw material extraction, manufacturing, distribution, use, and end-of-life; it consists of goal and scope, life cycle inventory (LCI) analysis, Life Cycle Impact Assessment (LCIA), and interpretation [29,30]. The LCA conducted in this research follows the ISO 14040/14044.
2.2. Goal of the LCA
In order to find a group of representative cosmetic packaging as the object of research, the products that an international leading cosmetic company put on the China market from January to July 2021 are investigated. The data have sufficient representativeness in the specific period, as these products from the company share the most market occupancy; 224 beauty and personal care products have been put on the market, including 196 colour cosmetics, 24 skincare, and 4 hair products; 185 products use plastic, including PE, PET, and others, as the packaging material, share 82.59%; 14 products use plain and coloured glass, and share 6.25%; the other 25 products are not specified [31], which indicates that plastic and glass are major materials that cosmetic packaging used in China market in 2021.
In this research, three actual samples of cosmetic packaging obtained from the manufacturer are used as the objects of the study. No. 1 is a 200 mL bottle made of PET. No. 2 is a 120 mL bottle made of glass. No. 3 is a 150 mL bottle made of PET. All caps are made of HDPE.
The goal of the LCA in this research is to evaluate the environmental impact of these representative cosmetic packaging quantitatively and to identify the hotspot of the contribution and opportunities for sustainable design.
2.3. Scope of the LCA
2.3.1. Functional Unit
The functional unit is the product quantity to be assessed in the LCA. To compare the environmental impacts of different products, it must be equivalent.
In this case, the functional unit must be a volume that makes the amount of three bottles integral logically. As Table 1 shows, to achieve equivalent volume and integral amount of bottle for all, 9 pieces of No. 1—200 mL bottle, 15 pieces of No. 2—120 mL bottle, and 12 pieces of No. 3—150 mL bottle are required. The Functional unit is 1800 mL.
2.3.2. System Boundaries and Excluded Processes
In order to analyse the life cycle of the packaging comprehensively and reveal the effect of design on using and recycling behaviours of the user. The system boundary considered in the LCA is from cradle to grave, including extraction and transportation of raw materials, manufacturing and assembly, transportation from factory to retailer and retailer to consumer, use, and end-of-life stages, as Figure 2 shows.
For focusing on the research subject and limiting the scope to an appropriate range, the following processes are not included in the system boundary due to that their impact is not directly relevant to the research, or it is an accidental event:
- Production, maintenance, and disposal of infrastructure and capital equipment such as buildings, machines, roads, etc.
- Auxiliary materials such as flexible foam inside the cap, because the consumption is relatively low.
- Product losses due to unusual damage, such as natural disasters or accidental fires.
- Handling processes at the distribution centre and retail store.
2.3.3. Assumption and Limitation
The key assumptions and limitations are listed below:
- According to the data acquired [31], 224 products are manufactured in France, Spain, the UK, the USA, Japan, and South Korea. Electricity for the global market is used.
- Transportation from the manufacturer to retailer is assumed as from France to China, because most of the products are manufactured in France. The distance is calculated as 16,720 km, transported by transoceanic ship. Transportation from retailer to consumer is assumed to be a return trip, 10 km, transported by a passenger car with EURO 4 emissions, which shares the most proportion of the passenger car in China at present. The total weight of all goods purchased is 10 kg.
- No damage data are available in the use stage. The research assumes that the consumer does not damage the packaging by accident.
- 100% of consumers follow the municipal waste disposal rules in the end-of-life stage.
2.3.4. Data Collection
For the data collection, specific and generic data are used in the research as follows:
- Material mass is collected by weight.
- Generic data including the manufacture process, electricity use, transportation, disposal, etc. are sourced from the ecoinvent 3.5 database [32], which is the most comprehensive and widely used background database in LCA provided by the ecoinvent Association based in Zurich, Switzerland.
- The data related to the geographical locations where the processes occurred.
- The technology represented the average technologies at the time of data collection.
2.4. Life Cycle Inventory (LCI) Analysis
This section presents the inventory of the life cycle of these three bottles.
2.4.1. Raw Material and Manufacture
As Table 2 shows, the mass of three bottles and caps are weighed by electronic scale. Material and process used for manufacture are also listed below.
2.4.2. Transportation
Transportation includes two aspects, from manufacturer to retailer, and from retailer to consumer. The distances are assumed as 16,270 km and 5 km based on the acquired geography information. In the ecoinvent database, the data for the transoceanic ship includes the weight of packaging and distance, but the data for the passenger car only includes distance. Therefore, data allocation needs to be conducted according to the weight of the purchase assumption.
It is assumed that the consumer purchases not only cosmetic goods with the packaging in one shopping trip, but also other kinds of goods. The total weight of all goods purchased is 10 kg; moreover, it should be a return trip for the shopping, which means the distance travelled is double, 10 km. As a result, the transportation calculation from retailer to consumer is equal to the weight of the packaging divided by 10 kg and multiplied by 10 km, as Table 3 shows.
2.4.3. Use
In this research, a use efficiency parameter is set to simulate whether the user has over-use or appropriate use behaviour during the use stage; it is set to 1 in the default scenario, which indicates the user uses a 100% common usage amount of the product. In the discussion section, two types of user behaviour mentioned above will be simulated by changing the parameter from 80% to 120% to investigate to what extent user behaviour or usage amounts influence the environmental impact of the packaging. At the end of the stage, a clean behaviour after being used up implied by the user is also included before the end-of-life stage; it uses 500 mL of tap water by default and will be changed in scenarios in the discussion.
2.4.4. End-of-Life
Waste scenario and treatment are modelled based on the default waste treatment process in the ecoinvent [32] and modified according to the plastic disposal data published in China [33]; 32% of plastic waste in China in 2019 went to landfill, 31% went to incineration, 30% went to recycling, and 7% is abandoned. The scenario simulated the situation. The waste stream goes to the first level of waste treatment such as ‘Packaging glass, white (waste treatment) {GLO}|recycling of packaging glass, white|APOS, U’, ‘PE (waste treatment) {GLO} recycling of PE|APOS, U’ etc. And remaining waste goes to the second level, such as ‘Municipal solid waste {Row}|treatment of, incineration|APOS U’, etc. Four parameters, recycling rate for glass (rr4g), PE (rr4p), PET (rr4pt), and landfill of plastics (landfill) are added for further discussion as Table 4 shows.
3. Results
3.1. Life Cycle Impact Assessment Method and Tool
The world-leading and widely used LCA software SimaPro 9 [34] is used as an LCA tool in the research. The LCIA method used in the research is ReCiPe 2016 Endpoint (H) v1.03 developed by RIVM and Radboud University, CML, and PRé Consultants; it includes 18 midpoints focusing on single environmental issues and 3 endpoint indicators illustrating environmental impact on human health, biodiversity and resource scarcity [35]. The method has a solid research foundation as it is developed based on CML 2001 and Ecoindicator 99 methodologies; it has comprehensive midpoint results for expert and straightway endpoint results for the common reader, and moreover, it is well-integrated with the SimaPro as the default method.
3.2. Comparative LCIA Results of Three Bottles
Figure 3 and Figure 4 show the comparative LCIA results of three bottles, which have the same functional unit, 1800 mL.
Figure 3 shows the relationship of impacts in three endpoints in percentage, including Human health, Ecosystems, and Resources. Obviously, No. 2 generates the greatest impacts on human health and Ecosystems, and the second on Resources. No. 1 generates the greatest impact on Resources and the second on others. No. 3 generates the lowest impacts on all three categories.
The proportions in each impact are clear, but these impacts in different categories are not comparable as they are in different measures. Normalisation and weighting make the results in three endpoint categories comparable by multiplying by two sets of factors, ‘world (2010) H/A’. The impact on Human health is emphasized distinctly.
Figure 4 shows single score results of three bottles, which put scores of each bottle in three endpoint categories in one line; it is obvious that No. 2 generates the greatest impact, 609.20 mPoint (mPt), and No. 3 has the lowest impact, 366.20 mPt, of all three bottles. Table 5 lists their specific scores.
3.3. LCIA Results of Each Bottle
The LCIA results of the three bottles show the comparative impacts. This section shows the results of each bottle for further process contribution analysis to explore the hotspot of impacts. Due to the limitation of space, a 3% cut-off is applied, and only top processes are shown.
3.3.1. LCIA of No. 1
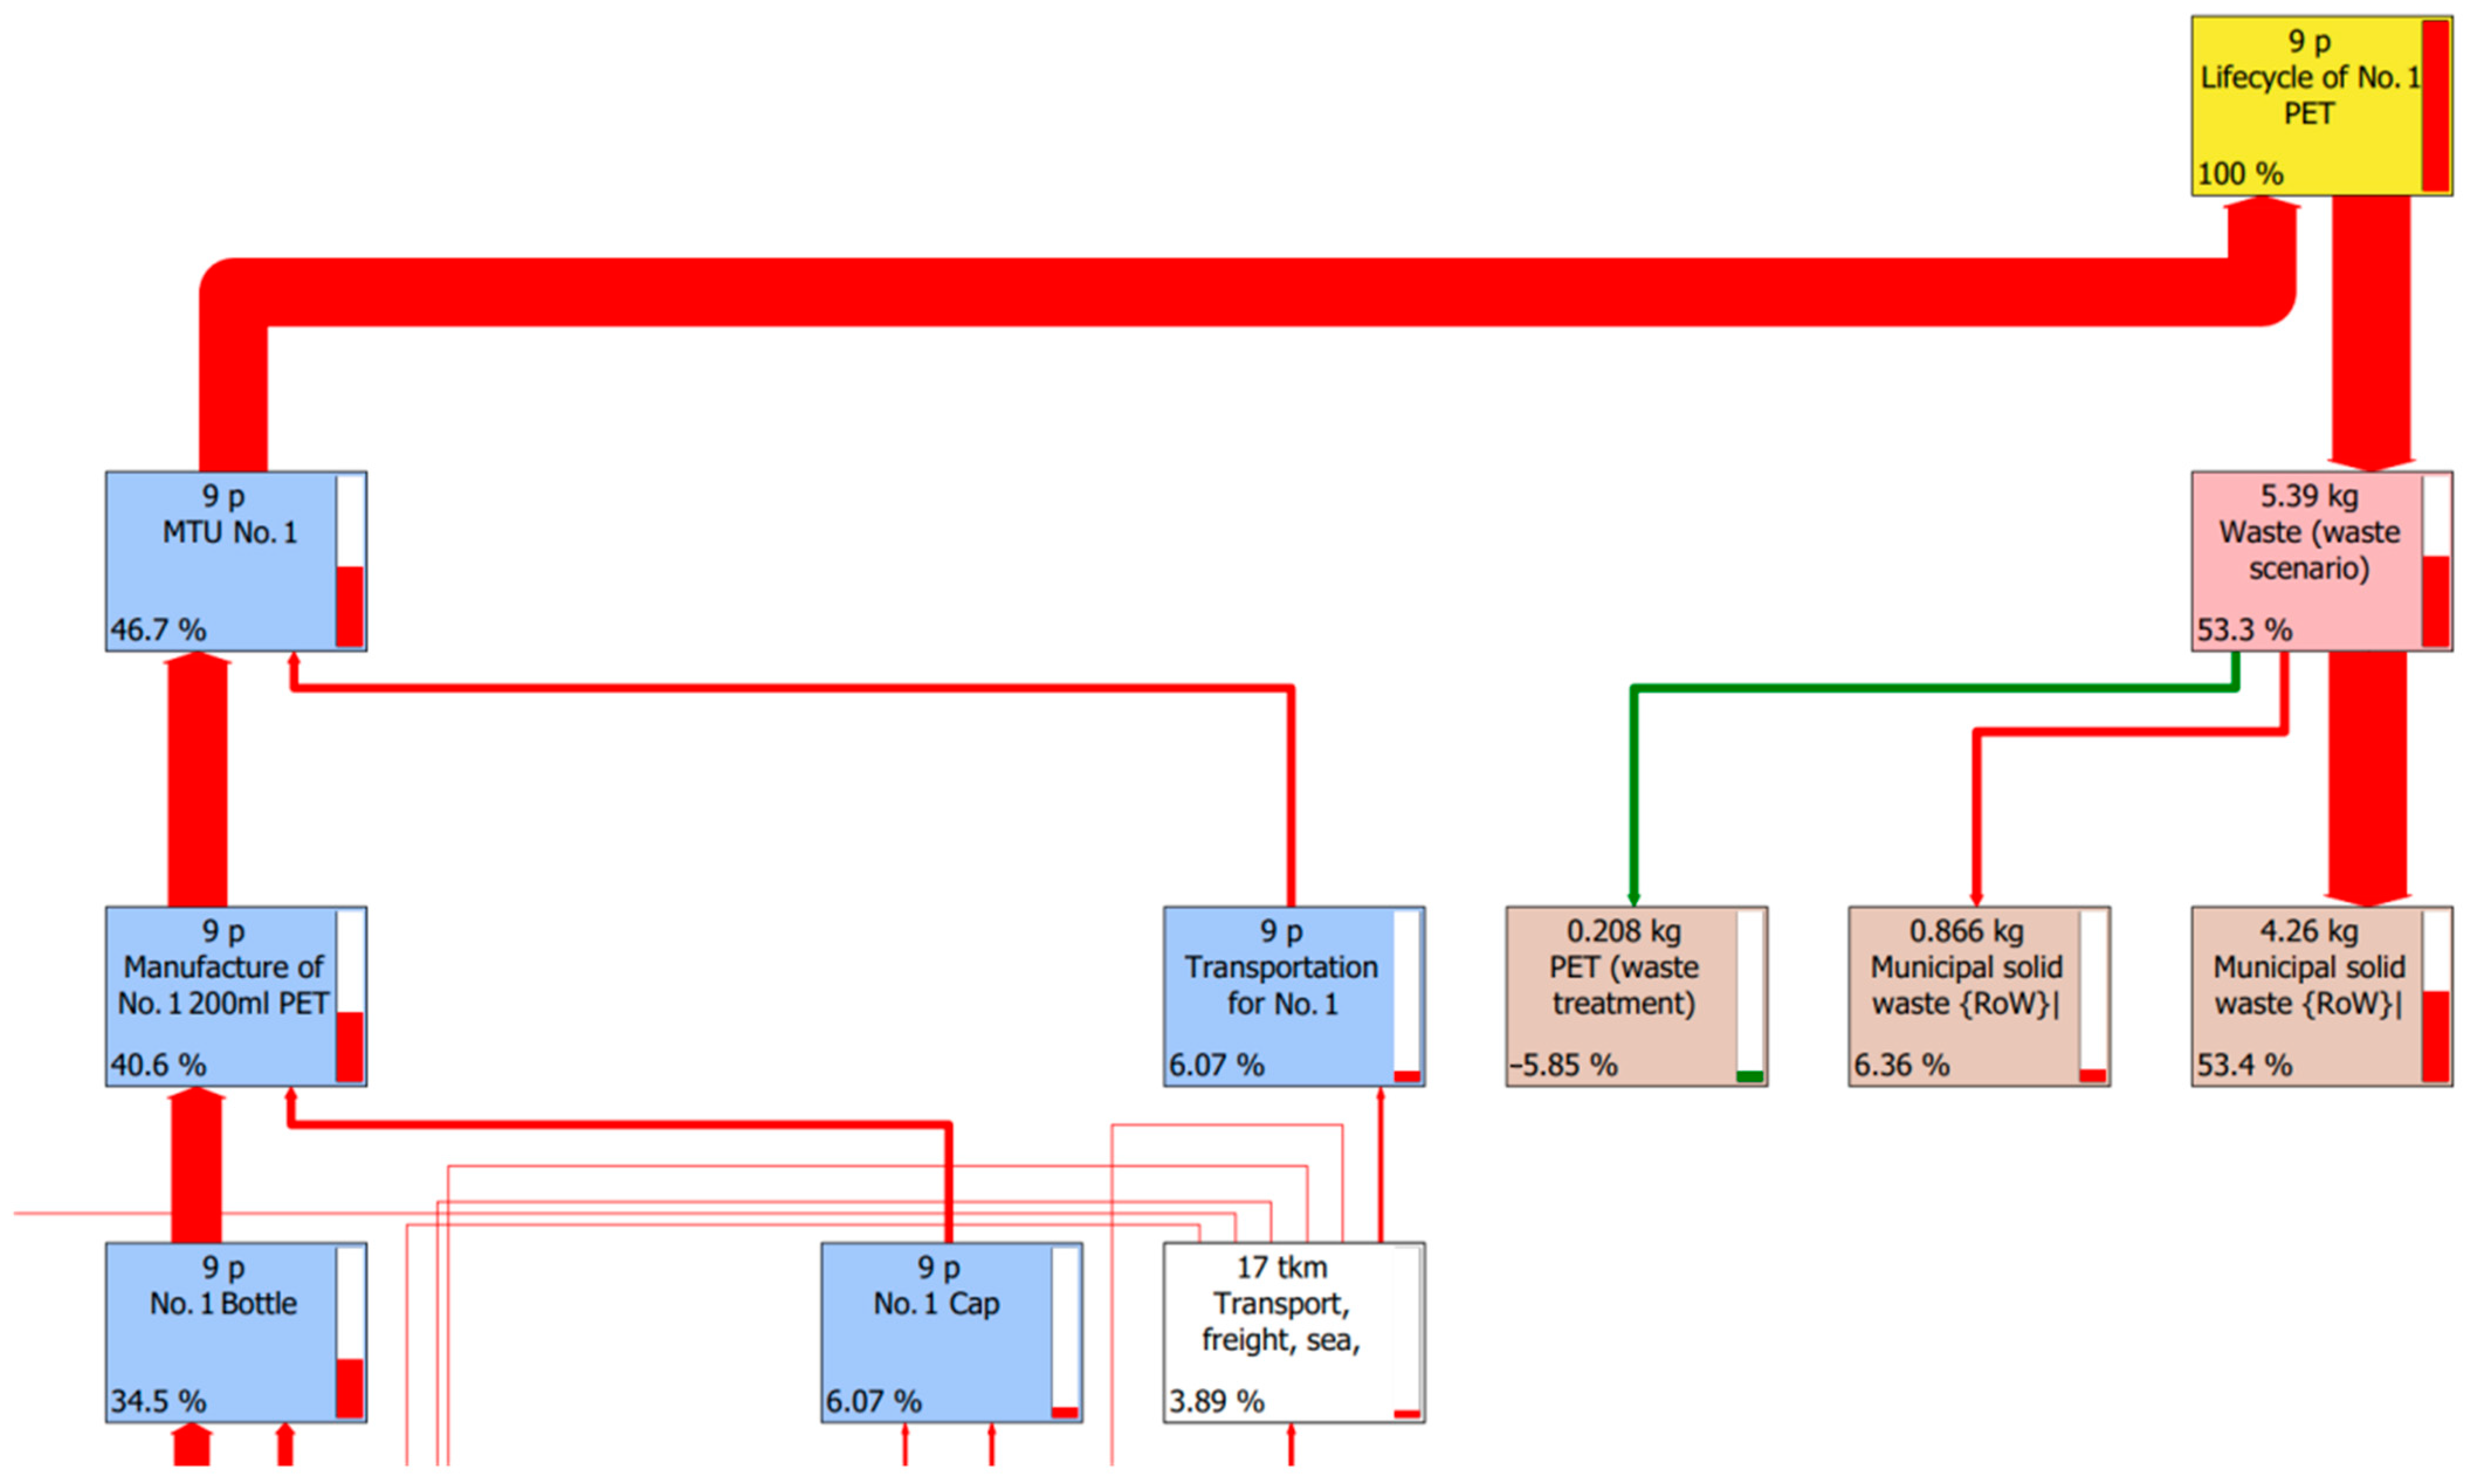
Figure 5 shows the environmental impact contribution network of the No. 1 bottle. Each block represents a kind of material or process involved in the lifecycle. The name and amount are displayed in each block. The proportion of contribution is labelled in the left bottom corner of each block. Accordingly, a bar graph shows the percentage of the contribution on the right side of each block, and the width of the flow line represents the degree of contribution.
End-of-life, which is called waste scenario and treatments in the figure, contributes the largest impact, 53.3% of all. In the waste treatment, PET recycling contributes −5.83%, which means a beneficial impact on the environment generated. Incineration of municipal solid waste shares 6.36%. Sanitary landfill of municipal solid waste shares the largest one, 53.4%. ‘MTU No. 1’ represents the manufacture, transportation and use stage of the bottle, which shares 46.7%. Manufacture and transportation share 40.6% and 6.07%, respectively. Manufacture of bottle and cap share are 34.5% and 6.07%, respectively.
3.3.2. LCIA of No. 2
As shown in Figure 6, impacts come from two sides, manufacture transportation, use, and waste scenario. The former contributes 42.6%, whilst the latter contributes 57.5%. Manufacture of No. 2 bottle shares 28.6%, including 23.2% from bottle and 5.4% from the cap. Transportation shares 13.9%, including 7.91% from the transoceanic ship and 6.29% from the passenger car. Waste scenario contributes 57.4%, including −12.7% from the recycling of packaging glass, 7.52% from incineration, and 63.1% from sanitary landfills; although, the recycling of the packaging glass has a greater beneficial impact on the environment than the recycling of PET of the No. 1, the waste scenario of No. 2 contributes more proportion of impact than that of No. 1.
3.3.3. LCIA of No. 3
For the No. 3 bottle shown in Figure 7, the manufacture contributes 19.8%. The waste scenario contributes more proportion of impact than the other two, which reach up to 77.1%. Incineration and sanitary landfills share 8.54% and 71.7%, respectively. The impact of the landfill is dominant and noticeable.
In summary, No. 2 and No. 3 generate the greatest and the lowest impact among these three bottles. Sanitary landfill shares the largest impact on the life cycles of all these three bottles. The second contribution is from the manufacture of bottles. Incineration, transportation, and manufacture of cap follow. The recycling process contributes a beneficial but limited impact.
4. Discussion
From the results of the LCIA comparison, No. 3 has the lowest impact of all, 366.20 mPt. No. 2 generates the highest impact, 609.20 mPt. No. 1 has a slightly higher impact than No. 3, 401.18 mPt; it indicates that these two bottles made of plastic have better environmental performance than the one made of glass under the circumstance described in the research. No. 3 and No. 1 generate 60.11% and 65.85% environmental impact than that of No. 2, respectively. In other words, it has the potential for decreasing from 35% to 40% impact.
Based on the findings from LCIA networks, reducing the impact generated by sanitary landfills is the most crucial task to improve the environmental performance of these cosmetic packaging bottles. Alternatively, reducing the impacts from manufacture, transportation, and incineration are optional implementations.
- Sensitivity analysis:
In order to develop the sustainable design strategy, the following sensitivity analysis scenarios are conducted to figure out to what extent these scenarios influence the sustainable performance of the packaging, or the significance of these variables to the sustainable design of these bottles. The variation range is from −20% to +20%. The amount of variation is 10%.
- Scenarios:
Scenarios and variations for the sensitivity analysis are shown in Table 6.
- To increase or decrease the recycling rate of bottles. Accordingly, to decrease or increase the rate of landfill.
- To increase or decrease the material use in manufacture.
- To increase or decrease the usage amount of users.
- To increase or decrease the transoceanic transportation distance.
- To increase direct reuse by users. The variation is assigned as 10% and 20% for the purpose of sensitivity analysis and comparison with other scenarios. In practice, the amount of reused bottles should be an integer. A negative one is not available for the scenario.
Table 7, Table 8, Table 9, Table 10 and Table 11 illustrate the analysis results for each scenario. The bigger the absolute value of the variation, the more influence the variable changing in the scenario brings. Table 7 shows the results of the scenario of changing the recycling rate. The variation range of the three bottles is ±1.92%, ±4.79%, and ±0.93%, respectively. Changing the recycling rate has the greatest influence on No. 2.
Table 8 shows the results of the scenario of changing material use in manufacture. The variation range of three bottles are ±9.48%, ±8.46%, and ±4.64%, respectively. Changing material use has the greatest influence on No. 1 and a slightly lower influence on No. 2.
Table 9 shows the results of the scenario of changing product usage amount. The scenario simulates two types of user behaviour, over-use, and appropriate use; it is assumed that using 80% and 90% of the product has the same effect on the user as using 100%, and over-use behaviour has no better performance to the user. The variation ranges of the three bottles are ±20% equally.
Table 10 shows the results of the scenario of changing transportation distance. The variation ranges of the three bottles are ±0.66%, ±1.52%, and ±0.33%, respectively. Changing transportation distance has the greatest influence on No. 2.
It is assumed that 10% and 20% of bottles are reused directly by the user for the last scenario. Therefore, the amount of tap water used for cleaning after being used up is increased by 10% and 20% respectively. The environmental impact is shared on the reused bottle, which becomes 90.91% (100%/110%) and 83.33% (100%/120%). Table 11 shows the results of the scenario considering direct reuse by the user. The variation range of three bottles is from 0 to −16.67%.
According to the variation range of the scenarios, the significance of these variables to the sustainable design of these bottles is obtained, as Table 12 shows.
5. Conclusions
This research conducts a set of LCA of cosmetics packaging to determine to what extent do these scenarios, including material selection or reduction, over-use or appropriate use, increasing recycling rate, reducing transportation distance, and increasing direct reuse, influence the environmental performance of the packaging. The practical significance is that the designer can conduct a streamlined LCA during the evaluation stage of concept design, using primary data of previous generation products from a cooperative manufacturer, or secondary data from relevant industry databases with sensitivity analysis. In this case, the LCA results will indicate which design concept performs better for the environment, reveal the priority and importance of these design variables, and guide designers to improve the environmental performance of the product at the very beginning. In addition, it emphasises that the designer not only has the right to determine structure and appearance, to select material and manufacturing process, but also has the power to influence recycling, reuse, and appropriate use behaviours of the user. The sustainable design approach becomes more plentiful and diversified.
Based on the results of the LCIA and the sensitivity analysis, sustainable design strategies and corresponding potential schemes of cosmetic packaging are proposed as follows in descending order of significance from the aspect of facilitating user reuse and recycling behaviour, material selection, and others.
- To select PET rather than glass if the cosmetic product has no specific protection requirement.
- To reduce the usage amount of the product under the premise of ensuring the designated use effect.
- Design for appropriate use, mensurable and adjustable dispenser.
- Instruction for appropriate use, universal graphic instruction for improved recognisability and readability, visual guidance of use effect, use efficiency self-assessment.
- To advertise rational purchase and consumption.
- To increase the direct reuse by the user.
- Design for easy cleaning and reuse.
- Design for long service life.
- Providing refill packaging.
- Straightforward graphic instruction for reuse and visible benefit advertising.
- To reduce material use in manufacture.
- More reasonable and responsible structure and function design.
- The emerging technology of manufacture.
- Recycling material is preferred.
- To increase the recycling rate of packaging materials.
- Design for disassembly and recycling.
- Instruction and universal graphic design for proper recycling.
- Recycling oriented material selection.
- To reduce the transportation distance of the packaging.
- To select raw material of product and packaging from a nearby location.
- Local packaging and suppliers are preferred.
Furthermore, this research is based on a set of assumptions and has some limitations. The following works need to be studied in the future to reinforce the research outcome.
- Primary data acquisition of manufacturing and waste scenario in China.
- Design for reuse and recycling, and user behaviour research.
- Appropriate use and use effect research.
Author Contributions
Conceptualization, Z.R.; methodology, Z.R.; software, Z.R.; validation, Z.R. and D.Z.; formal analysis, Z.R.; investigation, D.Z. and Z.R.; resources, Z.R., D.Z. and Z.G.; data curation, D.Z. and Z.R.; writing—original draft preparation, Z.R.; writing—review and editing, Z.R. and Z.G.; visualization, Z.R.; supervision, Z.R.; project administration, Z.R.; funding acquisition, Z.R. All authors have read and agreed to the published version of the manuscript.
Funding
This research received no external funding.
Institutional Review Board Statement
Not applicable.
Informed Consent Statement
Not applicable.
Data Availability Statement
The data presented in this study are available on request from the corresponding author. Some of the data are not publicly available due to commercial security.
Conflicts of Interest
The authors declare no conflict of interest.
References
- National Bureau of Statistics of China. Available online: https://data.stats.gov.cn/index.htm (accessed on 10 July 2021).
- The Stock for Men’s Make-up Grows 3000% in Double 11. Analysis of the Investment Outlook for Men’s Cosmetics Market in 2020. Available online: https://www.chinairn.com/hyzx/20201021/174130938.shtml (accessed on 10 July 2021).
- CBNData&NEWRETAIL: 2021 New Consumption Report of Face Score Economy. Available online: http://www.199it.com/archives/1230235.html (accessed on 10 July 2021).
- Coelho, P.M.; Corona, B.; Klooster, R.T.; Worrell, E. Sustainability of Reusable Packaging–Current Situation and Trends. Resour. Conserv. Recycl. X 2020, 6, 100037. [Google Scholar] [CrossRef]
- Babbitt, C.W.; Gaustad, G.; Fisher, A.; Chen, W.; Liu, G. Closing the loop on circular economy research: From theory to practice and back again. Resour. Conserv. Recycl. 2018, 135, 1–2. [Google Scholar] [CrossRef]
- Civancik-Uslu, D.; Puig, R.; Ferrer, L.; Fullana-i-Palmer, P. Influence of end-of-life allocation, credits and other methodological issues in LCA of compounds: An in-company circular economy case study on packaging. J. Clean. Prod. 2019, 212, 925–940. [Google Scholar] [CrossRef]
- Marathe, K.V.; Karan, R.; Chavan, K.R.; Nakhate, P. 8—Life Cycle Assessment (LCA) of PET Bottles. In Plastics Design Library, Recycling of Polyethylene Terephthalate Bottles; Thomas, S., Rane, A., Kanny, K., Abitha, V.K., Thomas, M.G., Eds.; William Andrew Publishing: Norwich, NY, USA, 2019; pp. 149–168. ISBN 9780128113615. [Google Scholar] [CrossRef]
- Santulli, C.; Mastrolonardo, L. 11—LCA of biomass-based food packaging materials. In Woodhead Publishing Series in Composites Science and Engineering, Biopolymers and Biocomposites from Agro-Waste for Packaging Applications; Saba, N., Jawaid, M., Thariq, M., Eds.; Woodhead Publishing: Norwich, NY, USA, 2021; pp. 219–234. ISBN 9780128199534. [Google Scholar] [CrossRef]
- Sazdovski, I.; Bala, A.; Fullana-i-Palmer, P. Linking LCA literature with circular economy value creation: A review on beverage packaging. Sci. Total Environ. 2021, 771, 145322. [Google Scholar] [CrossRef]
- Siracusa, V.; Ingrao, C.; Giudice, A.L.; Mbohwa, C.; Rosa, M.D. Environmental assessment of a multilayer polymer bag for food packaging and preservation: An LCA approach. Food Res. Int. 2014, 62, 151–161. [Google Scholar] [CrossRef]
- Bishop, G.; Styles, D.; Lens, P.N.L. Environmental performance of bioplastic packaging on fresh food produce: A consequential life cycle assessment. J. Clean. Prod. 2021, 317, 128377. [Google Scholar] [CrossRef]
- Escursell, S.; Llorach-Massana, P.; Roncero, M.B. Sustainability in e-commerce packaging: A review. J. Clean. Prod. 2021, 280 Pt 1, 124314. [Google Scholar] [CrossRef]
- Civancik-Uslu, D.; Puig, R.; Voigt, S.; Walter, D.; Fullana-i-Palmer, P. Improving the production chain with LCA and eco-design: Application to cosmetic packaging. Resour. Conserv. Recycl. 2019, 151, 104475. [Google Scholar] [CrossRef]
- Secchi, M.; Castellani, V.; Collina, E.; Mirabella, N.; Sala, S. Assessing eco-innovations in green chemistry: Life Cycle Assessment (LCA) of a cosmetic product with a bio-based ingredient. J. Clean. Prod. 2016, 129, 269–281. [Google Scholar] [CrossRef]
- Glew, D.; Lovett, P.N. Life cycle analysis of shea butter use in cosmetics: From parklands to product, low carbon opportunities. J. Clean. Prod. 2014, 68, 73–80. [Google Scholar] [CrossRef]
- Martinez, S.; Bessou, C.; Hure, L.; Guilbot, J.; Hélias, A. The impact of palm oil feedstock within the LCA of a bio-sourced cosmetic cream. J. Clean. Prod. 2017, 145, 348–360. [Google Scholar] [CrossRef]
- Okada, T.; Shibata, M.; Sakata, Y.; Nakajima, A.; Itsubo, N. Life cycle assessment (LCA) of the innovative eco-designed container for shampoo. Clean. Responsible Consum. 2021, 3, 100027. [Google Scholar] [CrossRef]
- Kunamaneni, S.; Jassi, S.; Hoang, D. Promoting reuse behaviour: Challenges and strategies for repeat purchase, low-involvement products. Sustain. Prod. Consum. 2019, 20, 253–272. [Google Scholar] [CrossRef]
- Isaac Jordan Gatt, Paul Refalo, Reusability and recyclability of plastic cosmetic packaging: A life cycle assessment. Resour. Conserv. Recycl. Adv. 2022, 15, 200098. [CrossRef]
- Martinho, G.; Pires, A.; Portela, G.; Fonseca, M. Factors affecting consumers’ choices concerning sustainable packaging during product purchase and recycling. Resour. Conserv. Recycl. 2015, 103, 58–68. [Google Scholar] [CrossRef]
- Otto, S.; Strenger, M.; Maier-Nöth, A.; Schmid, M. Food packaging and sustainability—Consumer perception vs. correlated scientific facts: A review. J. Clean. Prod. 2021, 98, 126733. [Google Scholar] [CrossRef]
- Boesen, S.; Bey, N.; Niero, M. Environmental sustainability of liquid food packaging: Is there a gap between Danish consumers’ perception and learnings from life cycle assessment? J. Clean. Prod. 2019, 210, 1193–1206. [Google Scholar] [CrossRef]
- Steenis, N.D.; van Herpen, E.; van der Lans, I.A.; Ligthart, T.N.; van Trijp, H.C. Consumer response to packaging design: The role of packaging materials and graphics in sustainability perceptions and product evaluations. J. Clean. Prod. 2017, 162, 286–298. [Google Scholar] [CrossRef]
- Zhao, R.; Geng, Y.; Liu, Y.; Tao, X.; Xue, B. Consumers’ perception, purchase intention, and willingness to pay for carbon-labeled products: A case study of Chengdu in China. J. Clean. Prod. 2018, 171, 1664–1671. [Google Scholar] [CrossRef]
- Santos, V.; Gomes, S.; Nogueira, M. Sustainable packaging: Does eating organic really make a difference on product-packaging interaction? J. Clean. Prod. 2021, 304, 127066. [Google Scholar] [CrossRef]
- Kolling, C.; Ribeiro, J.L.D.; de Medeiros, J.F. Performance of the cosmetics industry from the perspective of Corporate Social Responsibility and Design for Sustainability. Sustain. Prod. Consum. 2022, 30, 171–185. [Google Scholar] [CrossRef]
- Polizzi di Sorrentino, E.; Woelbert, E.; Sala, S. Consumers and their behavior: State of the art in behavioral science supporting use phase modeling in LCA and ecodesign. Int. J. Life Cycle Assess. 2016, 21, 237–251. [Google Scholar] [CrossRef] [Green Version]
- Bom, S.; Jorge, J.; Ribeiro, H.M.; Marto, J. A step forward on sustainability in the cosmetics industry: A review. J. Clean. Prod. 2019, 225, 270–290. [Google Scholar] [CrossRef]
- Environmental Management—Life Cycle Assessment—Principles and Framework. Available online: https://www.iso.org/standard/37456.html (accessed on 11 July 2021).
- Environmental Management—Life Cycle Assessment—Requirements and Guidelines. Available online: https://www.iso.org/standard/38498.html (accessed on 11 July 2021).
- Mintel GNPD Product Search. Available online: https://www.gnpd.com/sinatra/shared_link/3d09be60-d3c0-4fbe-96cd-a91102fd41ed (accessed on 11 July 2021).
- Ecoinvent Database. Available online: https://www.ecoinvent.org/ (accessed on 12 July 2021).
- Recycle Rate 30%, 1890 Tons of Waste Plastics Is Recycled in China in 2019. Available online: http://www.sh-recycle.org/articledetail.asp?id=4074 (accessed on 12 July 2021).
- SimaPro. Available online: https://simapro.com/ (accessed on 12 July 2021).
- LCIA: The ReCiPe Model. Available online: https://www.rivm.nl/en/life-cycle-assessment-lca/recipe (accessed on 13 July 2021).
Figure 1.
Retail value and growth rate of cosmetics category in China from August 2018–June 2021.

Figure 2.
System boundary.

Figure 3.
LCIA damage assessment results of three bottles.

Figure 4.
LCIA single score results of three bottles.

Figure 5.
LCIA network results of No. 1 PET bottles.

Figure 6.
LCIA network results of No. 2 glass bottles.

Figure 7.
LCIA network results of No. 3 PET bottles.


Table 1.
Functional unit of the LCA.
| Bottle No. | Volume (mL) | Amount (p) | Functional Unit (mL) |
|---|---|---|---|
| No. 1 | 200 | 9 | 1800 |
| No. 2 | 120 | 15 | 1800 |
| No. 3 | 150 | 12 | 1800 |
Table 2.
Material and process of the three bottles.
| Bottle No. | Part | Material | Process | Weight (g) | Total Weight (g) |
|---|---|---|---|---|---|
| No. 1 | Bottle | PET | Injection moulding | 77.1 | 98.75 |
| Cap | HDPE | Injection moulding | 21.65 | ||
| No. 2 | Bottle | Glass | Packaging glass, white, production 1 | 188.78 | 206.31 |
| Cap | HDPE | Injection moulding | 17.53 | ||
| No. 3 | Bottle | PET | Injection moulding | 25.59 | 33.14 |
| Cap | HDPE | Injection moulding | 7.55 |
1 Integrated in the material process of the ecoinvent database.
Table 3.
Transportation.
| Transportation Stage | Vehicle | Distance (km) | Calculation |
|---|---|---|---|
| From manufacturer in France to retailers in China | Transoceanic ship | 16,270 | Weight of packaging × 16,270 (kg·km) |
| From retailer to consumer | Passenger car with EURO 4 emission | 5 | Weight of packaging/10 × (5 + 5) (km) |
Table 4.
Waste scenario and treatment.
| Waste Treatment | Materials/Waste Types | Percentage (Default Value) |
|---|---|---|
| Packaging glass, white (waste treatment) {GLO}|recycling of packaging glass, white|APOS, U | Glass | rr4g (46.5) |
| PE (waste treatment) {GLO}|recycling of PE|APOS, U | PE | rr4p (30) |
| PET (waste treatment) {GLO}|recycling of PET|APOS, U | PET | rr4pt (30) |
| Waste plastic, mixture {RoW}|treatment of waste plastic, mixture, sanitary landfill|APOS, U | Plastics | landfill (32) |
| Waste plastic, mixture {RoW}|treatment of waste plastic, mixture, municipal incineration|APOS, U | Plastics | 31 |
| Remaining Waste | ||
| Municipal solid waste {RoW}|treatment of, incineration|APOS, U | 16.9 | |
| Municipal solid waste {RoW}|treatment of, sanitary landfill|APOS, U | 83.1 | |
Table 5.
LCIA single score results of three bottles.
| Bottle No. | Human Health | Ecosystems | Resource | Total (mPt) |
|---|---|---|---|---|
| Lifecycle of No. 1 PET | 380.40 | 16.74 | 4.04 | 401.18 |
| Lifecycle of No. 2 Glass | 581.68 | 23.59 | 3.92 | 609.20 |
| Lifecycle of No. 3 PET | 351.35 | 12.95 | 1.89 | 366.20 |
Table 6.
Scenarios and variations for sensitivity analysis.
| Scenarios | Variation 1 | Variation 2 | Variation 3 | Variation 4 |
|---|---|---|---|---|
| 1.Recycling rate | −20% | −10% | +10% | +20% |
| 2.Material use in manufacture | −20% | −10% | +10% | +20% |
| 3.Usage amount | −20% | −10% | +10% | +20% |
| 4.Transportation distance | −20% | −10% | +10% | +20% |
| 5. Direct reuse by user | N/A | +10% | +20% | |
Table 7.
Sensitivity analysis results of scenario 1, recycling rate.
| Bottle No. | −20% | Variation | −10% | Variation | Original (mPt) | +10% | Variation | +20% | Variation |
|---|---|---|---|---|---|---|---|---|---|
| Lifecycle of No. 1 PET | 408.86 | 1.92% | 405.02 | 0.96% | 401.18 | 397.33 | −0.96% | 393.49 | −1.92% |
| Lifecycle of No. 2 Glass | 638.41 | 4.79% | 623.80 | 2.40% | 609.20 | 594.59 | −2.40% | 579.99 | −4.79% |
| Lifecycle of No. 3 PET | 369.62 | 0.93% | 367.91 | 0.47% | 366.20 | 364.48 | −0.47% | 362.77 | −0.93% |
Table 8.
Sensitivity analysis results of scenario 2, material use in manufacture.
| Bottle No. | −20% | Variation | −10% | Variation | Original (mPt) | +10% | Variation | +20% | Variation |
|---|---|---|---|---|---|---|---|---|---|
| Lifecycle of No. 1 PET | 363.13 | −9.48% | 382.15 | −4.74% | 401.18 | 420.20 | 4.74% | 439.22 | 9.48% |
| Lifecycle of No. 2 Glass | 557.67 | −8.46% | 583.43 | −4.23% | 609.20 | 634.96 | 4.23% | 660.72 | 8.46% |
| Lifecycle of No. 3 PET | 349.21 | −4.64% | 357.70 | −2.32% | 366.20 | 374.69 | 2.32% | 383.18 | 4.64% |
Table 9.
Sensitivity analysis results of scenario 3, usage amount.
| Bottle No. | −20% | Variation | −10% | Variation | Original (mPt) | +10% | Variation | +20% | Variation |
|---|---|---|---|---|---|---|---|---|---|
| Lifecycle of No. 1 PET | 320.94 | −20.00% | 361.06 | −10.00% | 401.18 | 441.29 | 10.00% | 481.41 | 20.00% |
| Lifecycle of No. 2 Glass | 487.36 | −20.00% | 548.28 | −10.00% | 609.20 | 670.12 | 10.00% | 731.04 | 20.00% |
| Lifecycle of No. 3 PET | 292.96 | −20.00% | 329.58 | −10.00% | 366.20 | 402.82 | 10.00% | 439.43 | 20.00% |
Table 10.
Sensitivity analysis results of scenario 4, transportation distance.
| Bottle No. | −20% | Variation | −10% | Variation | Original (mPt) | +10% | Variation | +20% | Variation |
|---|---|---|---|---|---|---|---|---|---|
| Lifecycle of No. 1 PET | 398.51 | −0.66% | 399.84 | −0.33% | 401.18 | 402.51 | 0.33% | 403.84 | 0.66% |
| Lifecycle of No. 2 Glass | 599.91 | −1.52% | 604.56 | −0.76% | 609.20 | 613.84 | 0.76% | 618.48 | 1.52% |
| Lifecycle of No. 3 PET | 365.00 | −0.33% | 365.60 | −0.16% | 366.20 | 366.79 | 0.16% | 367.39 | 0.33% |
Table 11.
Sensitivity analysis results of scenario 5, direct reuse by user.
| Bottle No. | −20% | Variation | −10% | Variation | Original (mPt) | +10% | Variation | +20% | Variation |
|---|---|---|---|---|---|---|---|---|---|
| Lifecycle of No. 1 PET | N/A | 401.18 | 364.70 | −9.09% | 334.31 | −16.67% | |||
| Lifecycle of No. 2 Glass | 609.20 | 553.82 | −9.09% | 507.66 | −16.67% | ||||
| Lifecycle of No. 3 PET | 366.20 | 332.90 | −9.09% | 305.16 | −16.67% | ||||
Table 12.
Variation range and significance ranking.
| Scenarios | Variation Range | Significance Ranking |
|---|---|---|
| 1. Recycling rate | ±4.79% | 4 |
| 2. Material use in manufacture | ±9.48% | 3 |
| 3. Usage amount | ±20% | 1 |
| 4. Transportation distance | ±1.52% | 5 |
| 5. Direct reuse by user | 0 to −16.67% | 2 |
Publisher’s Note: MDPI stays neutral with regard to jurisdictional claims in published maps and institutional affiliations. |
© 2022 by the authors. Licensee MDPI, Basel, Switzerland. This article is an open access article distributed under the terms and conditions of the Creative Commons Attribution (CC BY) license (https://creativecommons.org/licenses/by/4.0/).
Share and Cite
MDPI and ACS Style
Ren, Z.; Zhang, D.; Gao, Z. Sustainable Design Strategy of Cosmetic Packaging in China Based on Life Cycle Assessment. Sustainability 2022, 14, 8155. https://doi.org/10.3390/su14138155
AMA Style
Ren Z, Zhang D, Gao Z. Sustainable Design Strategy of Cosmetic Packaging in China Based on Life Cycle Assessment. Sustainability. 2022; 14(13):8155. https://doi.org/10.3390/su14138155
Chicago/Turabian StyleRen, Zhongming, Doudou Zhang, and Zhu Gao. 2022. "Sustainable Design Strategy of Cosmetic Packaging in China Based on Life Cycle Assessment" Sustainability 14, no. 13: 8155. https://doi.org/10.3390/su14138155
Note that from the first issue of 2016, this journal uses article numbers instead of page numbers. See further details here.