
Abstract
Municipal solid waste (MSW) is one of the key components of India’s prominent mission “Swachh Bharat Abhiyan.” Rising urbanization, faster economic growth, and lifestyle changes all contribute to higher waste generation in India. Unscientific treatment, improper collection, and low use of technology-based solutions for handling MSW lead to hazards like environmental degradation, water pollution, air pollution, and soil pollution. The review paper describes the current status of MSW in different states and union territories as well as reviews the MSW generation, characteristics, and processing methods as practiced in India. It also highlighted government policy and various geographic constraints while rolling out an effective municipal solid waste management (MSWM) system. Furthermore, a comparison of MSW has been described for advanced, developing, and lesser developed countries based on adopted technology, policies, and infrastructure. The study will help decision-makers and scholars formulate more effective strategies for an effective way forward plan for MSWM.
Introduction
Due to rapid population expansion, industry, monetary development, urbanization, and an increase in human lifestyles, the amount of municipal solid trash generated in India has increased. Traditional and unscientific methods of MSWM impact the environment and cause various health hazards to residents (Minghua et al. 2009; Rathi 2006; Sharholy et al. 2005; Ray et al. 2005; Jha et al. 2003; Kansal 2002). Uncollected garbage pollutes open drains, waterways, and other bodies of water in the vicinity, harming human health and posing an environmental hazard. Residents can be exposed through a variety of channels including inhaling toxins emitted by garbage, direct contact with polluted water or soil, or consuming items or contaminated water. Moreover, the population living near waste disposal landfills and incinerators is often more deprived and possible health effects are cancers, birth outcomes, and lung, skin, and abdominal discomfort or illnesses.
Furthermore, the side effects of such negative environmental activities not only cause the formation of leachate, obnoxious odors, and methane gasses but also affect the water below the dumping site and harm the surrounding atmosphere. The obnoxious odors are caused by the breakdown of organic material. Bacteria consume organic matter and make sulfides, which decompose into H2S, a pungent source of odors in the atmosphere, which may also lead to the spread of diseases like malaria and plague (Priyadarshi et al. 2019; Chadar and Chadar 2017). An inadequate solution for waste collection and poor transportation is responsible for the accretion of garbage at every corner and junction. In urban cities, municipalities are responsible for waste management. They used to face so many challenges such as financial assistance, lack of good organization, political will, and organizational complexity (Sujauddin et al. 2008; Burnley 2007; Joshi and Ahmed 2016). Therefore, to boost effective solid waste management (SWM) in India, citizen involvement should be encouraged, exclusively in source segregation and treatment methods (Kumar et al. 2009). India has an area of 3.29 million square kilometers and is ranked the seventh biggest country area-wise in the world and has a 1.38 billion population.
India is a diverse country, having massive differences in geographical regions and people living in these areas have consequently different garbage generation patterns. However, no tangible roadmaps have yet been put in place to examine area-specific and region-wise generation trends of waste. In the past decade, a rapid increase has been seen in the rate of urbanization across the country. MSW generation is increasing due to massive population growth. Since limited data is available for urban cities and hence for the same scholars have to depend upon the Central Pollution Control Board (CPCB) in New Delhi; the National Environmental Engineering Research Institute (NEERI) in Nagpur; the Central Institute of Plastics Engineering & Technology in Chennai; and the Federation of Indian Chambers of Commerce & Industry at New Delhi (Narayana 2009).
The population size is directly propositional to waste proliferation as the population increases waste proliferation rate, per capita also increases. As per the CPCB 2000b* report and by the author Annepu (2012)**, Table 1 shows the per capita garbage generation rate and its growth over a decade based on population size. Population growth will lead to greater waste generation daily. It is estimated that the population of India will be around 1823 million by 2051, and approximately 300 million tons of municipal waste will be generated annually, requiring around 1450 km2 of land area to dispose of this volume systematically. However, these forecasts are cautious, assuming a 1.33% yearly increase in MSW generation per capita. However, for the sustainable model in metropolitan cities, solid waste is a critical issue, which includes the collection, storage, transportation, segregation, processing, and dumping of trash to curtail its adverse impact on human health and the environment. The informal economy plays a significant role in extracting value from waste; currently, 90% (approximately) of residual trash is dumped rather than perfectly landfilled (Misra and Pandey 2005). Hence, a self-reliant MSWM system so required efficient collection, segregation, and an optimal transportation system. The Recycling Index assesses a country’s desire and capacity to maintain the solid waste in a circular material flow-friendly way. In India, recycling accounts for 30 to 60% of paper products, 50 to 80% of plastic, and approximately 100% of glass containers. According to the Material Recycling Association of India, India’s recycling rate is 30% (Loizia et al. 2021). Recycle bins per population (RBP) are a vital indicator as they provide policymakers with vital information regarding the population density that can be supplied by current infrastructure (Pappas et al. 2021).
Many researchers recommended that proper recycling or re-utilization of solid waste is a tenable solution that is economically, environmentally, and socially viable (Kiriaki 2018; Dawit et al. 2019; Malakahmad et al. 2010). In this scenario, promoting domestic garbage recycling is crucial for reducing waste volumes, conserving natural resources, and transitioning to a circular economy. Governing authorities should examine the environmental implications of various types of waste disposal throughout the life cycle and build sustainable household waste recycling systems in collaboration with academic research. The elements that influence citizens’ attitudes and desire to recycle must be strongly contemplated in the policy-making process. It has been realized that adopting weight-based garbage billing reduces a greater amount of waste than a fixed garbage fee. The Ministry of Environment, Forests, and Climate Change (MoEF & CC) has also notified rules for SWM; however, compliance is fickle and narrow. Population growth means massive and crowded cities increased MSW generation in each respective city. In a report by author R.K. Annepu, data for 366 Indian cities were analyzed from 2001 to 2011 and found a 50% increase in MSW generation in one decade (Annepu et al. 2012). Furthermore, also predicted, urban India will generate 107.01 million tons per year (TPY) by 2031 and 160.96 million TPY by 2041 as shown in Fig. 1 which is an approximately five-fold proliferation in four decades. The said huge amount of urban waste is required to be appropriately managed so that no adverse effects on human health, the environment, and the standard of living in Indian cities.

Prediction of urban waste generation for the urban population in India
Research questions/hypothesis
-
1.
What is the current status of waste in India?
-
2.
Waste disposal is linked to one’s health in a good and substantial way.
-
3.
Hypotheses to assess the value of the 3 obligations of ecological sustainability (environmental, societal, and economical.
-
4.
What are the different policies and missions for waste management in India?
-
5.
How we can formulate a way forward strategy for MSWM in India.
The remaining paper is organized into various sections: Section 2 is related to some factual analysis of solid waste as practiced in the Indian cities; in Section 3, layered structure of various components has been discussed. Some important government missions and policies for waste management have been discussed in Section 4. Section 5 has been related to a geographic-specific recommendation for MSW; Section 6, indicative strategy and useful guidelines for making the waste management action plan have been suggested. Section 7 is related to the critical discussion. Based on various parameters, a comparison study of MSWM for developed, developing, and lesser developed countries has been described in Section 8. Finally, in Section 9, review paper has been concluded with a way forward strategy.
Statistcal analysis of solid waste in Indian scenario
Urbanization
India is the world’s second-largest country, accounting for 17.5% of the global population. Urban areas are growing faster than in 7935 cities/towns, where 377 million people live, which is 31.6% of India’s total population. Delhi, Kolkata, and Greater Mumbai are cities with a population size of 10 million-plus, 53 cities/towns have a population size of more than 1 million, and 415 cities/towns have a size of population 1 lakh or more (POMPI INDIA 2011). Figure 2 depicts the information about the top five urban agglomeration (UA) cities in terms of population. It shows that the UA cities having more population are generating the maximum waste.

India’s top five urban agglomeration (UA) cities in terms of the population (Loizia et al. 2021)
Waste generation per capita
Waste generation per capita rate is dependent upon city size, population, lifestyle, and types of region. There is a close link between trash generation and pollution (per capita) and the country’s gross domestic product (GDP); greater GDP means greater waste generation. Waste generation rates (WGR) are approximations of how much rubbish is generated by households or enterprises over some time (day, year, etc.) (Loizia et al. 2021; Pappas et al. 2021).
In India average, waste generation rate (per capita) is 370 grams/day as analyzed with other countries such as 2200 grams/day, 2000 grams/day, and 700 grams/day which are produced by countries such as Denmark, the USA, and China, respectively (Mammides 2019; Tennessee Valley Authority 2009; Liu and Xin-wu 2011). The Waste Generation Index (WGI) is a statistical expression of a country’s waste generation rate, taking into account a variety of waste kinds such as MSW, toxic materials, household waste, and waste plastic (Loizia et al. 2021; Pappas et al. 2021). Population expansion, globalization, urbanization, and economic growth are all contributing to an increase in solid waste. Table 2 shows that high-income countries generate more garbage per capita than low-income countries. Middle-income countries, such as India, have benefited from expansibility and urbanization. Some of the causes driving India’s consumerist growth are:
-
1.
India’s population is growing, as is the middle class.
-
2.
Particularly in emerging rural areas, there is a lot of value for money.
-
3.
Technological implications, as well as the growing effect of social media on consumer behavior.
-
4.
An increase in the number of individuals employed and economic growth.
The pace of waste production rate indicates the use of materials and energy, as well as the degradation of Earth’s renewable and non-renewable resources. In India, the garbage generation rate is growing at around 1.3% annually and between 200 and 870 g per day in cities (Ministry of Finance Department of Economic Affairs 2009). Table 3 illustrates the uppermost and lowermost waste generation rates in tons per day (TPD) and per capita waste origination (kg per day) within the metropolitan city, class 1 city, union territory (UTs), states, and different zones of India. After analysis, it is found that towns/cities in southern India were producing the maximum quantity of trash 560 g per day, in the northern part 520 g per day, in the East Indian zone 500 g per day, and lowermost in western India of only 440 g per day. Manipur, an eastern state, has a minimum waste generation rate (220 g per day), and Goa, a western state, has a maximum waste generation rate (620 g per day) and both are relatively small states. Delhi is the biggest union territory to generate per capita waste, i.e., 650 g per day (Kumar et al. 2009). As per the CPCB report 2016, Indian cities produce 52 million tons of trash per year and approximately 0.144 million tons per day, of which only 23% is processed and disposed of using some other technologies (Mohd Arshad Siddiqui 2018). All data related to states and UT depicted in Table 4 is obtained from the report of the Ministry of New and Renewable Energy (MNRE) in 2016 (Sharma and Jain 2019), Lok Sabha, and Rajya Sabha (Ministry of Housing and Urban Affairs 2020), Govt of India (Forest Ministry of Environment and Climate Change 2019). Table 4 shows waste generation, collection, treatment, and potential of energy recovered for the year 2015 and waste processing percentage for 2018 and 2020, which shows waste processing percentage is increasing in a year-to-year basis.
Properties and types of municipal solid waste
It has been observed that rural houses produce more carbon-based waste as compared to urban houses. In municipal zones, the main portion of waste is compostable ingredients (40–60%) and inert waste (30–50%). In rural houses, the percentage of recyclable garbage like paper, glass, plastic, and metals is very low, due to the lack of proper segregation methods and rag pickers who do not segregate recyclable garbage at collection points (Gupta et al. 2015).
Waste composition
During the scrutinization of waste, samples were taken from various areas like industrial, residential, and commercial. The trash samples were analyzed for different physical and chemical parameters. The physical composition is separated by hand into compostable, reusable, and residue after being collected. Furthermore, the chemical composition could be checked in the laboratories. Some hilly cities like Shimla, Shillong, and Kohima have a higher moisture content rate in the mixed municipal soil waste due to heavy rainfall (Kumar et al. 2016). The chemical composition of MSW in India according to the population range (in million) is shown in Table 5 and the physical composition is depicted in Table 6 (Nandan et al. 2017).
It has been observed that the waste is to fluctuate with population density. The results are based on the NEERI report (1995) strategy paper on SWM in India. Collection frequencies for residual waste under the observation of the Indian cities were every 2 weeks. All values in Tables 5 and 6 are expressed in percentages and are based on a wet weight basis. Thus, waste has variable physical and chemical characteristics depending on its sources.
Major types of waste
Waste generation depends upon different activities and sources like regions, climate, human lifestyle, type of work, food habits, and culture. Based on sources, MSW is categorized (United Nations Environment Division of Technology n.d.) into different categories. Sometimes, other assorted waste like electronic waste, nuclear waste, and chemical waste also gets mixed up with MSW. Major classifications of solid waste are as under:
-
1)
Residential waste
Waste generation from single-family homes and large-family homes is called residential waste. The waste is like food containers, newspapers, clothes, bottles, wooden, plastics, cans, cut glasses, other wastes (massive items, microchip technology-based equipment, lubricant, tires, etc.) domestic harmful trash, etc.
-
2)
Commercial/institutional waste
The waste generation from single large sources such as schools, institutes, market areas, prisons, government, and private offices. The types of waste under this category are metals, hazardous waste, paper, electronic waste, food waste, glass, chemical, plastic waste, and so forth. When food decays anaerobically, oxygen is depleted and methane is generated, both of which contribute to greenhouse gas emissions. According to the published article, India’s families throw out 50 kg of food per capita per year, the lowest in South Asia. In 2019, 931 million tons of food was wasted globally, with households wasting 570 million tons, followed by the foodservice sector and retailers (Ramaswami 2021). Figure 3 shows an average, high-income countries’ per capita food waste footprint on the environment (CO2) is much more than twice as large low-income ones, owing to inefficient distribution of food and consumption habits.
Fig. 3 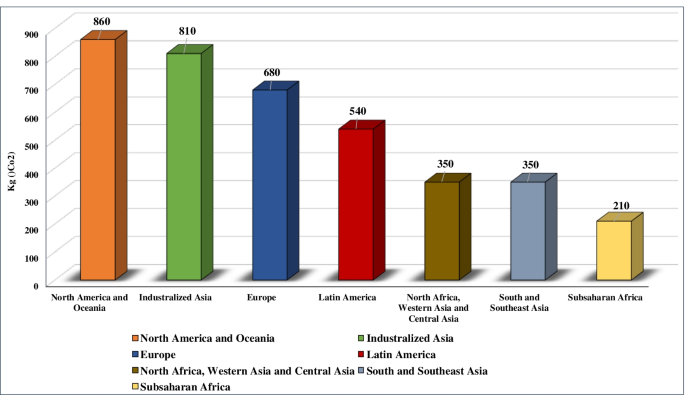
Per capita food waste footprint on climate in different countries

-
3)
Municipality area waste
Typically, sources of these wastes are park or street cleaning, entertainment areas, beaches, landscaping, etc. Such waste is generated by cleaning activities in municipal areas.
-
4)
Hazardous waste
The waste includes all types of waste generated in hospitals, healthcare facilities, laboratories, and research centers, which are radioactive, infectious, and toxic. Worldwide, approximately sixteen billion injections are governed annually; however, subsequently, entire syringes and needles are not appropriately disposed of. Several writers suggested that if sterilizing is done at the generation level, then it could reduce infection substances and also be helpful to mend safety management. The bio-medical waste in landfills generated from hospitals can contaminate ground and surface drinking due to the bad construction of landfills. World Health Organization (WHO) declares some hazardous waste (World health organization n.d.), as illustrated in Table 7.
Table 7 Classification of hazard waste as reported by WHO (Forest Ministry of Environment and Climate Change 2019)
Key performance indicators (KPIs)
Figure 4 explains KPIs chosen by the stakeholders (van Schaik et al. 2021).

Key performance indicators selected by the stakeholders
Economic
-
(a)
Capital cost and Capital exp
Waste treatment is considered to be expensive, not only in terms of capital costs (Capitalcost) such as the acquisition, development, and installation of treatment trains (TT), but also in terms of daily operational and maintenance costs. The TT’s capital expenditure (Capitalexp) of a unit process (in euros) represents the single-time cost of buying the unit processes (UP), which includes the land cost. The total annual expense for power, chemical products, changed components, and required manpower to run and sustain a UP includes the labor cost. The amount of resources recovered via TT, such as water, minerals, and power, and the nation-specific value of the recoverable material are expected to determine income generation.
-
(b)
Financial willingness to pay (FWP)
The desire to pay the additional tax is influenced by the local economic and environmental context, as well as the expenses of implementation and operation (Rodríguez-Entrena et al. 2012).
Technical
-
(a)
Reliability:
Reliability refers to the performance of the TT. Since wastewater treatment and resource, recovery trains are a series of UPs in which the performance of one UP affects the performance of the other UPs.
-
(b)
Flexibility:
Conventionally, in the context of waste treatment, flexibility is related to (i) TT performance robustness with changing influent quality and quantity but also to (ii) modularity which refers to the ease of change in the TT design configuration.
Environmental
-
(a)
Odor:
The odor released from sewage treatment plants varies depending on the process, but normally it decreases as you progress from primary to tertiary treatment. This can be linked to the type of process, such as biological organic matter degradation, and the state of the wastewater, such as pollutant concentrations.
-
(b)
Noise:
UPs might have a special maximum noise potential when it comes to wastewater treatment plants. As a result, as stated in the equation, the overall level of noise is influenced logarithmically by the noise levels (dB) emitted by all UPs in the TT.
-
(c)
Footprint:
The footprint of a WWTP refers to the amount of land used to meet municipal sewage standards. It applies a semi-quantitative assessment to include it in decision-making for wastewater recovery uses “land requirement” as a KPI and employs a semi-quantitative assessment to factor it into decision-making for effluent water recovery.
-
(d)
Index of effluent quality compliance:
The major indicator for measuring the functioning of a waste treatment plant is the effluent quality. Traditionally, waste treatment plants are run to ensure that the finished effluent meets local disposal restrictions. Effluent restrictions vary by nation and are broken down by contaminant.
Layered structure of various components of MSWM system
An effective MSWM system is working to address environmental and public health issues, assets, artistic, appropriate land use, and clearance of garbage (Ferronato et al. 2018; Marshall and Farahbakhsh 2013). MSW management consists of various components like the collection of waste, segregation, transportation to landfills, processing of waste in plants, and disposal at landfills/dumping sites. The efficiency of the management system of municipalities depends upon the better working of these components. Still, in Indian urban cities/towns, MSW is disposed of commonly in open dumps or low-lying areas, unscientifically without proper safeguards, which adversely impacts human health and the environment (Kumar et al. 2010; Alam and Kulkarni 2016; Mandal et al. 2019; Gidde et al. 2008; Kalyani and Pandey 2014; Kumar and Samadder 2017; Mani and Singh 2016; Sharma et al. 2000; Rajput et al. 2009; Sahu et al. 2014). As per the CPCB annual report (2019–2020) (Central Pollution Control Board 2019), details of municipal solid with different parameters in India are shown in Table 8. A detailed layered structure of all these components is shown in Fig. 5 and explained herein under:

Layered structure of various components of solid waste management system: Layer 1 waste collection layer, Layer 2 segregation layer, Layer 3 transportation layer, Layer 4 processing layer, and Layer 5 disposal layer
Collection
The responsibilities of waste management are lying with municipal corporations and urban local bodies, and their function in the urban areas, towns, and cities is being notified by the government. According to the CPCB annual report, during the year 2018–2019, all states and union territories collected 1,49,748 TPD out of the 1,52,076 TPD solid waste generated in India. For a smooth collection of garbage, municipal administration uses several methods which are as below:
-
Municipal community bin collection
-
Door to door collection
-
Collection on a routine basis must be announced in advance
By integrating the aforesaid approaches, we can achieve greater collection efficiency (Vij 2012). However, generally in Indian cities, waste collection is highly unorganized either at the household level or community level. Mostly the urban towns/cities are lacking efficient methods for storage of MSW at the source level. In several towns/cities, collection bins used are neither designed well nor appropriately placed. It leads to poor efficiency in collections of MSW; thus, average collection costs in the Indian towns/cities are 50–70% of the total budget for waste, which is a key component for the cost reduction (Talyan et al. 2008; Saxena et al. 2010). At the collection point, segregation of garbage is not being performed and different types of wastes such as decomposable and non-decomposable are placed in common bins and, at last, disposed of at a collective dumping epicenter. According to the position, two types of bins are used for collections of waste, i.e., fixed and moveable. Due to the flexibility in transportation, the movable bins are not very durable (Siddiqui et al. 2006; Central Pollution Control Board 2016) as compared to the fixed bins. Solutions that combine Internet of Things (IoT) technologies with alternative techniques for sustainably handling disposable food containers.
Furthermore, the design of recycling bins has been found to have a significant impact on waste management. To promote recycling, its actors should consider the design features of recycling containers. The structure, color, and design of the bin; cover; and sign must all show which materials can be recycled. The color of the bins usually indicates the type of recycling material; common bin colors include green, orange, red, blue, white, yellow, beige, and gray. The most significant purpose of color is to visually transmit information and to promote behavior changes toward recycling intentions. Furthermore, Table 9 depicts a comparison of several studies showing that different colors in different recycling programs convey the same meaning, message, and information.
Many big cities just start the house-to-house garbage collection with the assistance of welfare associations and non-governmental organizations (NGOs) on notified monthly payments. Municipalities provide transportation facilities from the public dustbins up to the dumping sites. NGOs and citizen teams are also employed to supervise visits. Most states are unable to provide the facility because of a lack of effective collection methods, missing better transportation services, no proper techniques for reuse and recycling, and lack of manpower (Nema 2004; Malviya et al. 2002; Bundela et al. 2010; Gupta and Arora 2016; Khajuria et al. 2011; Kaushal et al. 2012; Pariatamby et al. 2015; Hazra and Goel 2009).
Segregation
For effective MSW management, waste segregation is the biggest issue not only in developing countries but also in developed countries. The waste treatment unit’s performance waste treatment unit rises with a good feed of waste such as plastics, paper yard waste, and wood products. The segregation process takes place in a risky and harmful atmosphere; thus, the efficiency of the separation is very poor, as valuable objects are segregated from the waste by the unorganized sector, which returns a high market value in the recycling market (Sharholy et al. 2008). It has been observed from the report of CPCB (2013) that sometimes during the ferry of garbage to disposal sites, the detached material got mixed over again due to mismanagement. According to the 2020 Swachhata Sandesh Newsletter by the MoHUA, Tamil Nadu has attained complete segregation in 20 of its 50 small municipalities, with the remaining municipalities achieving 80–90% segregation. But, in the majority of states, the blending of segregated and unsorted garbage is still a major issue. In Chhattisgarh and Kerala, waste segregation has been practiced by all houses in all wards. Daman and Diu and Dadra and Nagar Haveli have attained 100% segregation at source among the UTs.
Transportation
Transportation is the main component to make the MSWM more effective. Different modes of transportation are trucks, dumpers, bullock carts, rickshaws, etc. There is no proper transportation system in the small towns; generally, small trucks having a capacity of 5 to 9 tons are being used. The maintenance of garbage collector vehicles is generally furnished in a garage of urban local bodies. However, mostly the garage provides the only trivial repair. The waste transportation through stationary compactors, mobile compactors, and tarpaulin is about 65%, 15%, and 20%, respectively. No surprise, at the time of failure of such automobiles, the entire assembly, carriage, and clearance proficiency shrink harshly (Upadhyay et al. 2012).
Activities and approaches/techniques for waste processing
According to the MoEFCC, only 75–80% of municipal waste is collected, and only 22–28% of that is handled and treated.
Prevention activities
Trash prevention will be explained as the avoidance, reduction, and reuse of waste at the source, excluding off-site recycling. Garbage prevention also entails taking steps to minimize the negative effects of waste on the atmosphere and public health (Zorpas et al. 2014). Waste prevention or minimization is placed at the top of the waste management policy (hierarchy). The prevention plan aims to manage trash by the waste hierarchy, minimize waste’s carbon footprint, and develop a range of strategies to promote waste processing and reuse, resulting in higher resource efficiency (Zorpas et al. 2017). To reduce waste management costs, the state may enact policies to limit the growth of unnecessary garbage within the city and to reduce waste generation at the source. Home composting and communal biogas, as well as other activities such as cattle feed, can all help to reduce trash. Horticultural waste, drain silt, demolition/construction debris, and other items must be handled and managed individually. For trash minimization and segregation, the awareness program will be an effective tool. Immediate attention is required to focus on the generation/handling of bio-degradable components of waste as it has the potential to produce negative health impacts and require immediate stabilization.
Awareness activities
-
1.
Raising awareness about trash segregation and its advantages.
-
2.
Set up a wet waste composting plant.
-
3.
Include waste management education into the curriculum of the school; emphasize the necessity of waste prevention, repurposing, and recycling; and teach pupils about the causes and effects of trash disposal.
-
4.
To change public behavior through awareness and sensitization activities in the field of SWM. People should be encouraged to separate moist, dried, and harmful garbage from their homes.
The different techniques and methods are being used depending upon the type of waste for processing solid waste. Figure 6 shows different types of techniques for wet and dry waste. Here, the type of waste means dry and wet waste. Further technology used for processing is based on the type of waste and its characteristics.

Processing technique used according to the type of waste (Pariatamby et al. 2015)
Techniques for waste processing
-
1.
Composting
Compost consists of lots of non-organic materials which makes it difficult to produce good quality products. In rural India, composting is used traditionally for the disposal of garbage. In India, the first large-scale aerobic composting plant was set up in 1992 by Excel Industries Ltd. to knob 500 tons per day of solid waste in Mumbai city, and nowadays various plants have been established in the major cities of the nation. The productivity of the composting plant is rendered useless due to the lack of proper garbage segregation. The projected potential in India for generating compost from MSW will be approximately 4.3 million tons annually, which will be helpful to minimize the gap between the necessity and availability of compost (Nagari 2017; Kodali and Gorantla 2017).
However, neither those who generate garbage nor those who collect it make a serious endeavor to distinguish between different categories of waste, whether it is plastic or food. The same treatment is given to all types of waste that are simply dumped randomly and allowed to accumulate at the dumping site. However, no hard effort to differentiate between the various types of garbage, whether that is foodstuff or plastic, by folks like us who generate it or even by authorities who have the responsibility to collect it. Waste segregation is the fundamental step in waste management, proceeded by wet waste composting and dry waste recycling. Furthermore, waste management entails an array of things and initiatives that individuals and governments must undertake to lessen their CO2 emissions. Waste management is being promoted through a sensitization campaign and citizen participation. To maximize citizen participation, citizens must be persuaded via interactive platforms such as the web, apps, and mobile exhibitions that provide knowledge about composting and highlight that waste infrastructure alone is insufficient. More citizen participation will not only aid in maintaining a healthy ecosystem in the city but will also help in decreasing the quantity of waste produced. In India, wet garbage accounts for half of the average waste generated, which largely includes kitchen waste and yard waste. This garbage has a high tendency of being recycled at the source of origin and turned into high-quality compost. Composting at home is a simple method for treating organic waste produced in homes and offices using natural organic processes. Managing segregated waste in a decentralized way has several of advantages, including minimizing transportation costs, minimizing the need for frequent waste collection, boosting recycling efficiencies, and improving waste suitability for processing, allowing waste to be managed as a valuable resource. Individuals without specialized skill sets or equipment can practice it.
Some important features of composting are:
-
Low cost, low infrastructure, and required minimum set-up.
-
Compost is a marketable product.
-
Give useful contributions to agriculture.
The processing and utilization of municipal garbage as compost support the Government of India’s “SWACHH BHARAT ABHIYAN” campaign. India is first in terms of the number of organic farmers and ninth in terms of organic farming area. Sikkim has become the world’s first entirely organic state, and other states such as Tripura and Uttarakhand have set similar goals. Composting not only brings higher prices for organically grown crops but also helps break up thick clay soils and adds essential nutrients to the soil. Furthermore, it aids in the reduction of methane emissions from dumps and the reduction of carbon footprint. Organic farming is a sustainable agriculture system. In India, 51% of MSW is organic, 17.5% is recyclable (plastic, paper, metal, and glass), and 31% is inert. It reveals that organic waste makes up the majority of garbage, rendering composting the best option in India. Composting helps to ensure environmental sustainability. The different composting techniques, each having its pros and cons, are used in India, i.e., aerobic or windrow, anaerobic composting, and vermicomposting. Aerobic is a commonly used method, which can better handle bulk quantity as compared to vermicomposting, but required high maintenance. In anaerobic, organic materials are naturally broken down and piled up. A pungent smell is generated due to a large amount of methane produced. Vermicomposting is a nature-friendly and bio-oxidative mechanism that stabilizes organic waste into useful bio-products. It provides major and minor quality nutrients to the plants and needs high maintenance and more start-up resources either in money/time and labor (Kurian 2002).
-
2.
Waste to energy (WtE)
The approximate power generation capacity in India from solid waste is 538.3 megawatts (MW). Government is continously making effort to enhance the overall capacity. India will achieve 1075 MW by 2031 and further to 2780 MW by 2050. As per the Govt. of India, the MNRE report of the year 2016, there are only 7 running plants having a total capacity of 92.4 MW, 4 under process plants having a capacity of 40.6 MW, under construction 31 plants having a capacity of 241.8 MW, and under proposing 21 plants having the capacity 163.5 MW. Table 10 depicts the list of working and non-working waste handling plants in India with their power generation capacity, waste intake, and technology used. As per the MNRE, at the household, community, and organization level, 4.3 million biogas plants have been built.
High capacity plants’ result has not been so fruitful but small plants having a capacity of 0.5–50 Mt per day are successfully working, in many states (Ministry of new and renewable energy 2016; Saha et al. 2010). During the last few years because of the Swachh Bharat Mission, the waste in the energy field is an attractive area for researchers, whereas the government’s main attention is solar energy, which motivated the expansion of biogas energy fields (Kreith and Tchobanoglous 2002). In the context of waste to energy, the ministry stated that “Energy recovery in the form of electricity, heat, and petroleum from the leftover is possible through various methods. These processes are often grouped under Waste to Energy technologies” (CPHEEO (Central Public Health and Environmental Engineering Organization) n.d.; Power generation from municipal solid waste n.d.). The following technologies of WtE are used in India:
-
a)
Incineration
It is a controlled process for burning the garbage and residue having flammable material. It is cost-effective, operated in any climate, and required minimum land; therefore, it is very useful in those places where there is scarcity of land. The end products of this process are carbon dioxide, ash, and water vapor which generates intermediate product heat which is used for the production of steam, heating water, and electricity generation.
-
b)
Pelletization
It is a compressing process that converts the material into the shape of pellets. Refuse-derived fuel (RDF) is referred to as fuel pellets; they are small chops/cylinder-shaped chunks formed out of garbage having a calorific value of 4000 kcal/kg and are quite close to the coal; therefore, it can be a good substitute for coal, wood, etc.
-
c)
Bio-methanation
The bio-methanation technique is used for wet biodegradable waste to recuperate both energy and nutrients contained in recyclable leftovers. There are two ways to use biogas such as thermal energy and electricity generation through turbines and gas engines.
-
d)
Pyrolysis
It is used where carbon-based solid is heated in the absence of a reacting agent and generates three products: (a) gasses (carbon monoxide, hydrogen, methane, hydrocarbons), (b) liquid (tar/oil), and (c) solid residue (char). Two techniques fast and slow pyrolysis is used when to generate bio-oil and charcoals, respectively.
Even though India has a large amount of waste, certain WtE plants have had difficulty obtaining a continuous supply of MSW. Only 70% of MSW gets collected; hence, there is a need for reform so that WtE can function properly (Nixon et al. 2017). The absence of source separation and public participation in waste-to-energy in India is a major barrier. Improved education and public awareness have the potential to promote citizen participation in MSW for proper segregation. The SWM Rule 2016 must be strictly enforced to reduce waste contamination with soil, road sweepings, and industrial waste. The government should provide more funding to ULBs, and supportive processes should be developed. Generating energy from trash is a paramount aspect of SWM since it reduces waste volume.
Dumping and disposal
One of the major MSW disposal methods is landfills. In some emerging countries, solid waste is thrown openly without any aforementioned action and hence results in environmental corrosion. In India, there are currently 3159 dumpsites, which are a major cause of groundwater degradation and air pollution. They also have concerns with flames, stability, and depreciating esthetics. Bio-mining, which is essentially a process for stabilizing waste to minimize its harmful environmental impact, of these dumpsites has just been launched in 11 states, due to the intervention of the Hon’ble NGT (Central Pollution Control Board 2019).
Contribution toward the circular economy
The circular economy (CE) is a modern effort to conceptualize a sustainable approach to integrating economic activity with environmental well-being (Yaduvanshi et al. 2016). It focuses on process redesign and material recycling, which help to create more sustainable business models. The widely panned linear economy paradigm produces goods from finite resources and dumps garbage in landfills as shown in Fig. 7. An “economy in loops” of resource conservation, trash prevention, and extension of the life of a product was envisioned and shown as an early approach to practical sustainability (Murray et al. 2017). Based on the examination of many decades of observation, the current approach to CE recommended a stronger recycling target (Pearce et al. 1990). Sampurna Earth is an example of a current CE practiced by a non-governmental organization in India. Raising awareness of successful waste management techniques in India goes a long way toward the acceptance of new sustainability policies. Segregated trash is handled differently in the system, with sludge repurposed in shorter cycles to assure re-absorption in the local environment and enrichment to transform it into methane, energy, and fertilizer. Dry trash is further separated into e-waste, paper, textiles, and other items at the proper collection center, where waste-collecting agencies recycle and reuse it. CE implementation is achievable in India. It is critical to replicate the zero-waste method, improve collection chains, raise citizen awareness, and receive government assistance. Although assessment instruments can be learned from industrialized economies, they cannot be used without sowing the seeds of CE training and education in waste management at different levels. The transition to CE practices and strategies as a whole may seem slow but must begin now. Educating and raising knowledge of effective waste management strategies among Indians go a long way toward the adoption of innovative sustainability policies and procedures.

Circular economy (Saxena et al. 2010)
SWOT (strengths, weaknesses, opportunities, and threats) analysis
The SWOT of the proposed strategy has been explained in this subsection. The following variables are explored as community strengths:
-
1.
Segregation of waste has made progress in recent years.
-
2.
The emergence of a system of environmental fines and penalties that is distinct from the tax system.
-
3.
Several local groups, organizations, and non-governmental organizations (NGOs) engage in a variety of sociocultural and developmental activities using both formal and non-formal techniques.
-
4.
Youth are the community’s most energetic, passionate, and creative human resources for good MSWM through active community engagement.
-
5.
Encourage citizens to adapt their recycling habits by rolling out new incentive schemes.
In terms of weaknesses, the following factors were discovered:
-
1.
There is a lack of a standardized method for gathering and recording information on waste types, recovery and recycling processes, and other factors.
-
2.
Proper waste segregation at the source, i.e., residential segregation, is lacking.
-
3.
“Not in my backyard” and the "Who cares” syndrome are examples of public apathy and a society’s unwillingness to collaborate and engage.
-
4.
There is a lack of environmental knowledge, awareness, and mindsets in society.
-
5.
There is a scarcity of information, education, and communication (IEC) current resources for sanitary workers and community members’ capacity building such as knowledge and understanding, and orientation.
-
Opportunities:
-
1.
Increasing self-sufficiency and mutual aid among stakeholders.
-
2.
New regulations and acts will be enacted, as well as a new ordinance, to promote optimal MSWM.
-
3.
Encouragement of cost-sharing activities, so that local communities, as well as other stakeholders, can more effectively support and encourage the program.
-
4.
Unemployed youth can contribute to the creation of MSWM microenterprises and society initiative groups. MSWM microenterprises can provide youngsters participating in the program with an alternate source of income.
The following factors should be considered as threats to the MSWM program:
-
1.
The government does not provide local communities adequate power.
-
2.
There is a lack of collaboration between the public and commercial sectors.
-
3.
Government officials’ unwillingness to improve their performance and identify the best, collectively agreed on solutions for efficient MSWM in the city.
-
4.
The government and the citizenry have opposing viewpoints. Likewise, ideologies in general.
Government mission and policies for waste management
To assist states and cities in the effective implementation of SWM, the Ministry of Housing and Urban Development has published the revised MSWM Manual 2016, in line with the SWMR (Solid Waste Management Rules) 2016. It provides guidelines for the urban local bodies and also helps states and cities in taking effective decisions for the SWM system, to achieve the desired goals of the Swachh Bharat Mission.
Swachh Bharat mission
-
On 2nd October 2014 (on the special day of Mahatma Gandhi’s birth anniversary), this mission was begun by the National Democratic Alliance (NDA) government.
-
The objective of the mission is to clean the lanes and roads, build public toilets, make awareness of SWM, and develop the infrastructure of the country.
-
SWM is an important part of the Swachh Bharat mission. The central government gives financial aid to the urban areas for the SWM for 5 years.
-
More expectations from the state governments and ULBs to focus on setting a priority, efficiently execute the plan, and give the outcome which will help to define the scope and compliance of the mission.
e-waste management
The Government of India, Ministry of Environment, Forest, and Climate Change, is the central agency for the planning, coordination, and monitoring of India’s environmental policies and programs. One of the main goals of the MoEFCC is to prevent and control pollution. The Minister of State for the MoEFCC in response to question no.4553 regarding e-waste raised during the Parliament of India, Lok Sabha (House of the People), only six states have finished the e-waste generating inventories, including Jammu and Kashmir Goa, J&K, Himachal Pradesh, Madhya Pradesh, Chhattisgarh, and Punjab (Government of India Ministry of Environment, Forest And Climate Change 2019). In 2019, the United Nations University report, “The Global E-Waste Monitor 2017,” 20 lakh tons of e-waste was reported in India in 2016. In 2017–2018, the CPCB reported that 69,414 MT of e-waste was collected, deconstructed, and recycled.
Major responsibilities of state governments for better management of e-waste vide e-waste (management) rules, 2016 as under:
-
The state government authorized the industry department or any other government agency to the allocation of area for dismantling and recycling electronic waste in the industrial park (E-waste (management) rules 2016).
-
State labor department to do and ensure the following points:
-
The registration of workers who are involved in recycling and dismantling work.
-
Assist the making of such worker groups to establish dismantling facilities.
-
Undertake skill development activities for the safety and workers, who are associated with recycling/dismantling work.
-
Undertake yearly health monitoring for the sake of better health and safety of workers.
-
The state government makes a plan to implement all these provisions and an annual report is submitted to the MoEF & CC.
Plastic waste (management and handling) rules – 2016
-
Prohibit the use of carrying bags less than 50 μm in thickness.
-
State Pollution Control Board will not allow the new user to renew the registration regarding the plastic-related activity.
-
As per Indian Road Congress (IRC) guidelines, ULBs must encourage the use of non-recyclable plastic for road construction. The said rules also instruct waste generators, ULBs, any vendors, etc. to manage plastic waste.
-
The event organizer or waste generator is fully responsible for collecting and handling the waste.
Furthermore, due to the substantial cost to the environment of single-use plastic consumption, notably the negative impact on soil, bodies of water, and the ocean ecosystem, India’s Honorable Prime Minister has proclaimed that single-use plastic will be phased out by 2022. The prohibition on plastic shopping bags and the usage of single-use plastic have been notified by 23 states and 9 UTs (Plastic waste (management and handling) rules 2016; Single-use plastic 2020).
Bio-medical waste rule 2016
The bio-medical waste rule was notified by the Government of India which provides a regular framework for managing such waste generated in the country. A few major points are as below (Bio-medical waste management rule 2016):
-
Bio-medical waste (BMW) is controlled without any hostile effect on human beings and the environment.
-
It must be treated separately, not with the MSW.
-
At the source level, liquid chemical waste is segregated and ensures treatment and disposal of the same according to the Water Act, 1974.
-
Provide the training, and workshop, to all the persons involved in the process of bio-medical waste at least once a year.
Guidelines for waste of COVID-19
As we are aware that recently novel COVID-19 is spreading from human to human, and it is continuously spreading in so many untouched countries. India is also suffering from the COVID-19 pandemic disease; to cope with COVID-19, State and Center Government takes various steps. During the pandemic situations, workers of SWM services should be asked to wear personal protective equipment (PPE) during duty hours for hygiene and safe conditions. The orientation program should be arranged for the workers of SWM services on how to wear the PPE COVID-19 kit. Therefore, as per current Bio-medical Waste Management Rules, 2016, CPCB specifies certain protocols for the waste generated at the time of diagnosis and treatment of coronavirus patients (Revision 1 2020). Some important points are as under:
COVID-19 isolation wards
-
Use double-layered bags or multi bags with sufficient strength and has no leaks.
-
BMW collected from isolation wards can be stored temporarily in a separate room and also be picked up from the ward to common biomedical waste treatment facilities (CBWTF).
-
“COVID-19 Waste” mandatory labeling in the dustbins, used for BMW of COVID-19 wards.
-
The items used for storage of COVID-19 waste such as containers/trash bins/trolleys must be sanitized daily with chemicals such as sodium hypochlorite solution.
-
The waste generated through isolation wards of coronavirus is maintained separately.
Duties during treatment facility
-
Use particular garbage vehicles to collect the coronavirus patients and should be disinfected with a chemical solution after each hour.
-
Waste should be disposed of properly.
-
Sanitation workers shall be provided with sufficient PPE kit including mask nitrile, gloves, goggles, gun boots, and splash-proof gown.
-
As per provision under SWM rules, 2016 waste from isolation sites/isolation-home–based should be properly disposed of.
How does COVID-19 affect the strategies on waste?
COVID-19 is among the most serious global health hazards in living memory resulting in massive casualties and economic losses (Kothari and Sahab 2021). The high volume of COVID-19 trash is personal protective equipment kits, masks, and gloves, which have posed a significant disposal challenge for waste management authorities. The waste management sector has changed dramatically as a result of the lockdown; there is an increase in hazardous and biological waste and a drop in the percentage of MSW that reaches dumpsites. To protect human health, solid waste, as well as COVID-19 waste, must be managed to decrease waste and avoid transmission of infection. If wrong waste management procedures are not corrected, the world will confront a unique dilemma that could be dubbed a “waste disaster.” While the volume of SWM has decreased as a consequence of the closure of restaurants, supermarkets, shops, and other businesses, waste collection efficiency has been hampered as a result of a reduction in municipal staff. Many waste-pickers were unable to collect waste during the lockdown due to restrictions enforced by police or housing complexes, which impacted waste collection. The combined impact of the medical emergency and the economic recession has also damaged the well-being and income of workers in the informal sector.
Geographic/city-specific constraints during the implementation of MSWM
While rolling out the SWM system, there are some important issues for different geographic-specific cities situated in hilly terrain, plain areas, coastal areas, and islands. Issues of cities for the specific geographic areas are described herein under:
Hilly area
-
The interconnected roads are narrow, due to which installation of big capacity bins is not feasible.
-
The garbage collector vehicle movement during day to day in heavy traffic congestion is highly challenging.
-
During the tourist summer season, the hilly area is overloaded with tourist vehicles; hence, the movement of garbage collector vehicles for collections of garbage is much more difficult as compared to the winter season.
-
Fuel efficiency is poor if we use the different capacities of vehicles, i.e., small, medium, and large for garbage collection.
-
Garbage vehicle having a small turning radius is suitable for narrow roads and sharp curves.
-
Installation of open dustbins is not suitable since monkeys thronged bins from 5:00 to 6:00 AM and they do not feel the need to go to the forests.
-
Waste is generally disposed of in valleys; it is not only spoiling the esthetics and sanctity of the place but also polluting the biodiversity.
-
Due to the scarcity of land, setting up a big capacity garbage processing plant is difficult.
Seaside area
-
Disposal sites located nearby the seashore may lead to left-over garbage in the sea and hence may contaminate seawater.
-
Because of the high rainfall rate in coastal cities, more leachate is being generated.
-
Fire waste degradation is the main source of bad odor and air pollution.
-
Implementation of the MSWM system affects adversely due to the shortage of land.
Island area
-
Due to the scarcity of land, setting up a big capacity garbage processing plant is difficult.
-
The SWM activities are slow due to the distance from the mainland.
-
Recycling garbage is not segregated by rag pickers and hence storage and disposal issues arise because of a shortage of land.
-
Due to high humidity conditions in these regions, equipment easily corrodes which leads to a change of natural calamity.
-
Disposal issue of large amounts of tender coconuts being generated as waste.
Plain land area
-
Due to urbanization, thick populated cities truck all of their solid waste for disposal to far distances which resulted in a jump in the cost of waste disposal.
-
The centralized garbage disposal system is a problem; on the other hand, decentralized solutions cut costs of transport and make households and institutions part of the solution.
-
People living around the landfill site are resistant and not willing to vacate the area or relocate.
-
E-waste is more generated due to less freight cost of IT equipment and disposal of the same is costly.
-
Fire waste degradation causes bad odor and air pollution in thickly populated cities.
Suggestions for formulating way forward strategy for MSWM
In urban areas, the MSWM system has emerged as one of our country’s most pressing concerns, not just in the context of environmental and esthetic impact, but as a significant health threat, as a result of inadequate and non-scientific handling of waste (Suggestive or indicative 2015). The issue is further aggravated by the fast pace of urbanization that is taking place in our cities today. Furthermore, to attain distinct enhancements in the current management system for solid waste in all towns/cities, indicative efficient guidelines/strategies for formulating a way forward strategy for effective MSWM are as under.
Collection and transportation of garbage
The containers for the collection of garbage may be technology-based and better designed as per the geographic-specific cities and their pattern shall be suitable for the vehicle used for transportation. Furthermore, the active participation of people in the separation of wet and dry recyclable components will lead to an improved MSWM system. Additionally, city-specific appropriate selection of garbage vehicles, proper movement of garbage vehicles using the latest technology for route planning with traffic-free management, and adequate maintenance of garbage vehicles in the workshop will lead to higher productivity.
The dynamic spatial model demonstrates how the ArcGIS proposed methodology can be used to measure the appropriate optimum route in SWM and deal with upcoming dynamic changes (Syahiya et al. 2021).
Waste reduction/minimization
Waste reduction/minimization is a wider term that includes all waste management techniques like source reduction, recycling, and composting, which leads to reduced waste. Increasing recycling, by the householders themselves, needs to be more exercised which would minimize the waste quantity to be carried for disposal to the treatment plant or landfill. Thus, the practice will not only minimize the required landfill area but also be economically viable. Therefore, emphasizing waste reduction, reuse, and recycling practice will not only ensure the minimization of waste but also reduce the adverse impact of solid waste on human health and the environment (Alam and Ahmade 2013; SB Mission 2016).
Waste processing
The organic waste should be treated using composting and vermicomposting technologies, which will lead to minimizing the quantum of waste, therefore also downsizing the landfill. Total moisture, chlorine concentration, and calorific value are all factors to consider when deciding whether or not to proceed with treatment (Inglezakis et al. 2012). So, for best waste treatment process, quality input must be ensured. Apart from this, other technologies for waste processing like a waste to energy, pyrolysis, incineration, bio-methanation, and RDF may be used. But, aforesaid technologies may be adopted only after making certain of their appropriateness based on waste compositions and financial aspects.
Landfill site for waste
The landfills may be identified so that there should have facilities such as road, water, fire extinguishing, check post barrier for maintaining the records, treatment, biogas recovery, landfills around fencing, and plantation of tree provisions. The right landfill for waste should be city- and town-specific, to achieve an efficient municipal solid management system
Speedup plan
It is a vital component of the development plan, which makes it lucrative, minimum time consumable, and also better operative. Henceforth, the basic program leads to the failure of the system because of its slow speed and lack of a strategic plan. Any slow response by the government hampers work regarding achieving the planned target and the scope of work to be done annual or periodic basis.
Unsuccessful waste-to-energy projects
There are only eleven waste-to-energy projects in India, out of which seven are working and four are nonworking. There is a need to import viable and proven technology, since India is struggling in this field to achieve a success story. Apart from it, proper separated trash for waste-to-energy plants needs to be added as input subject to the requirement. Improved education and public awareness campaign are needed to increase citizen participation in MSW for the proper segregation.
Participation of organized sector and stakeholders
For better performance of the solid waste collection, segregation could be done at the source level by rag pickers, which can be affianced by organizing committees and stakeholders. Though, due to the absence of reuse or reprocessing firms and with the approval of people, the enormous perspective has been overlooked. Cities must establish accountability systems that redefine the geographies of duty for urban sustainability initiatives with systemic and trans-local repercussions (Sareen and Grandin 2020).
Suitable technology-based solution and public-private partnerships (PPP)
As there is a need to handle the exponential growth of MSW. For the same, suitable technology-based solution with the best practices available by subject specialist firms through PPP is required (Public-private partnerships in India 2009). Furthermore, in the field of the food packaging ecosystem, IoT is a good option from a business perspective (Beliatis et al. 2019). To develop the MSW infrastructure, the major challenge to ULBs is a lack of capability and inadequate financial assistance. For the success of PPP, good public governance needs to be established and further appropriate financial assistance and stringent contract execution are required.
To change mindset and adoption
To implement any possible solution for waste management, especially for householders, there may be public resistance. Hence, during any transition, the first and foremost point is all about mindset shift and adoption of new things. It is because public mindsets cannot alter overnight and it is a continuous practice to decrease the dare of the change method. It is, therefore, essential to gain public trust in the delivery of the best services. To change your mindset about garbage and fix it, envision whatever item/package/piece called waste we buy and generate, piling up right next to us—not in the seas and sky, but directly right next to us. The waste management issues will be solved not just through technological solutions and retrofits, but also through a shift in mindset and behaviors at all levels and all decision-makers. Reduction, reuse, and recycling (3R) can help shift the focus from trash generation to waste avoidance. There should be a big campaign at all levels to create awareness that waste is valuable and can be exchanged for money, with the exception that 3Rs for reduction of waste be given preference above all else. The above strategically driven approach at the household, municipal authority, and business levels will be a major shift toward sustainable waste management and the lowering of garbage pile-ups in landfills.
Critical discussion
This research will aid local governments and academia in formulating and implementing successful waste management rules, regulations, and policies to improve the lifestyle and reduce adverse health and environmental consequences. Cities must have a clean and healthy ecosystem to be sustainable and continue to expand economically. To improve SWM systems, recycling, proper coverage of the collection, social awareness mechanisms, and safe disposal practices are all required. To encourage citizens and influence their recycling habits, various, effective, and new incentive schemes can be implemented. Citizens’ active participation in trash management and recycling operations is critical for a smart and green world. Effective waste management methods and new recycling styles that change the way garbage is controlled may have an impact on society’s economic, social, and overall health functions. Moreover, there should be a great vision for waste management by creating a “New India” ensuring a clean and healthy life for citizens. In light of increasing future waste, India cannot afford the traditional and ineffective SWM system. The ULBs need more dedication to waste management. Further improvement in enforcement and clear regulation are needed for an efficient SWM system. The waste management domain needs to introduce more fascinating and profitable businesses having financial penalties on service level to be imposed by the ULBs as and when services of waste management are not functioning appropriately. The waste management project should be envisaged as long-term planning with sustainable systems. The best practices should be shared among multiple regions to put thinking caps on and come up with creative ideas to solve the waste management problem with modern technologies. SWM is one of the main components of smart city projects in India. The IoT has been extensible used in smart city projects for waste management processes. Thus, using IoT-enabled smart bins and route optimization of garbage collector vehicles will result in an efficient waste management system. Hence, introducing such technological solutions for waste management will not only ensure the quality of life and high happiness index of the citizen but also achieve the vision of “Clean India, Dream India.”
A comparative view: MSWM in advanced, developing, and lesser developed countries
In lesser developed and developing countries, waste management is not efficient and well-known. The major factor was due to lack of public awareness, integrative approaches, affordable strategies, infrastructure, and financial aid for sustainable waste management. Some other issues, lack of assessment of development programs, less public-private partnership, and slow speed to implement the programs, are also responsible for poor design and ineffective implementation in developing and low-developed countries. Table 11 illustrates the outcome from the comparative view in advanced, developing, and lesser developed countries depending on various parameters of waste management such as technology available, policies, suitable infrastructure, efficiency measures, financial resources, gross national income (GNI), and per capita waste generation. Earlier research suggested that the financial development of any country is positively correlated with the ratio of per capita garbage generation, consumption of things, better living standard, and development methods. Moreover, the recycling capacity of advanced countries is better than that of developing and lesser developed countries. Except for advanced countries, other countries’ successes in recycling methods are observed by various parameters, quality of materials recovered, financial expense, recycling rate, workers’ health, safety, etc. (Moloney and Doolan 2016). Countries having high-income such as the USA and the EU (European Union) developed vermin-composting, bio dry, and bio stabilization facilities to process organic waste. They are also focusing on waste-to-energy techniques. The middle- and low-income countries generate garbage with a higher part of organic material; vermin-composting is yet slow. That means the organic waste treatment methods and technologies for treating garbage are unproductive and absent (Jain et al. 2005; Liu et al. 2015; Miezah et al. 2015). Thermal conversion, recycling, and biological treatment are some innovative methods, adopted by developing countries like India.
Conclusion
It can be concluded after studying various articles, papers, and reports conducted by the government agencies, boards, and ministries that several limitations are present in the current method of managing solid waste. The generation of waste rate has increased vastly in India. The major factors responsible for rising waste are speedy growth of population, urbanization, lavish living standard, and environmental unawareness. Furthermore, the SWM system is not much more efficient due to some hindrances such as waste policy, lack of the latest technique for collection, financial assistance, lack of infrastructure, and well-trained people. To achieve sustainable SWM in India, waste to energy facilities, recycling, and minimization of waste generation have to be emphasized. To minimize the waste at the dumping site, garbage should be segregated at the collection point, and emphasize an increase in the reuse rate. Further combustible waste should be provided to energy generation plants for generating energy. An efficient SWM cannot be achieved in the absence of technology solutions. Hence, in the smart city mission, SWM has been implemented end to end through IoT-enabled solutions. The route selection of garbage collector vehicles, monitoring of the filling level of smart IoT-enabled bins, and management information system (MIS) are being taken care of by a system in smart cities. Still, there is a need for further research to improve various techniques for SWM in an optimization way, to achieve the best optimal route with minimum fuel cost. Apart from it, state and municipal authorities may together enact and administer solid waste rules efficiently in their jurisdiction, so that rules may be enforced effectively, to achieve a clean, healthy, and, happy ecosystem.
References
Alam P, Ahmade K (2013) Impact of solid waste on health and the environment. Int J Sustain Dev Green Econ(IJSDGE) 2(1):165–168
Alam T, Kulkarni K (2016) Municipal solid waste management and its energy potential in Roorkee city, Uttarakhand, India. J Inst Eng (India): Series A 97(1):9–17
Annepu, RK (2012) Sustainable solid waste management in India. Sponsored by the Waste-to-Energy Research and Technology Council (WTERT) Columbia University, New York, 2(01) Pages 1–190.https://www.nswai.org/docs/Sustainable%20Solid%20Waste%20Management%20in%20India_Final.pdf
Beliatis MJ, Lohacharoenvanich N, Aagaard AA, Acharya KS, & Presser MA (2019) Internet of things for a sustainable food packaging ecosystem insights from a business perspective. In 2019 Global IoT Summit (GIoTS) (pp. 1-6). IEEE. https://doi.org/10.1109/GIOTS.2019.8766378
Bio-medical waste management rule (2016) Notification, ministry of environment, forest and climate change. Government of India. Published in the Gazette of India, Extraordinary, Part II, Section 3, Sub-section (i) New Delhi, the 28th March, 2016. https://dhr.gov.in/sites/default/files/Bio-edical_Waste_Management_Rules_2016.pdf. Accessed 3 Dec 2021
Bundela PS, Gautam SP, Pandey AK, Awasthi MK, Sarsaiya S (2010) Municipal solid waste management in Indian cities–a review. Int J Environ Sci 1(4):591–606
Burnley SJ (2007) A review of municipal solid waste composition in the United Kingdom. Waste Manag 27(10):1274–1285
CPCB (Central Pollution Control Board) (2013) “Status report on municipal solid waste management.” http://www.indiaenvironmentportal.org.in/files/file/MSW_Report.pdf. Accessed 3 Dec 2021
CPCB (2015) Suggestive/Indicative: The National Action Plan for Municipal Solid Waste Management, In compliance with Hon’ble National Green Tribunal Order Dated 5th February 2015 in the Matter of OA No. 199 of 2014.https://rb.gy/72ha8q. Accessed 7 Jan 2022
CPCB (2020) Revision 1: Guidelines for handling, treatment and disposal of waste generated during treatment/Diagnosis/ Quarantine of COVID-19 Patients. 25th March, 2020 (In the suppression of earlier guidelines uploaded at CPCB website on 19/03/2020).https://www.mohfw.gov.in/pdf/63948609501585568987wastesguidelines.pdf. Accessed 28 Dec 2021
CPCB (Central Pollution Control Board) (2016)“Central pollution control board (CPCB) bulletin, Government of India.” http://cpcb.nic.in/openpdffile.php?id=TGF0ZXN0RmlsZS9MYXRlc3RfMTIzX1NVTU1BUllfQk9PS19GUy5wZGY . Accessed 3 Dec 2021
CPCB (Central Pollution Control Board) (2019) “Annual Report 2018-19 on implementation of solid waste management rules (As per provision 24(4) of SWM Rules, 16).”https://cpcb.nic.in/uploads/MSW/MSW_AnnualReport_2018-19.pdf. Accessed 4 Dec 2021
CPCB (2000b) CPCB (Central Pollution Control Board). Annual Report (2000-2001) Municipal Solid Wastes (Management And Handling) Rules, 2000. Accessed December 3, 2021. https://cpcb.nic.in/uploads/MSW/MSW_AnnualReport_2000-01.pdf
CPHEEO (Central Public Health and Environmental Engineering Organization) CPHEEO (2016) (Central Public Health and Environmental Engineering Organization). Municipal Solid Waste Management Manual Part II: The manual. Government of India. Ministry of Urban Development. Pages 1–604. http://cpheeo.gov.in/upload/uploadfiles/files/Part2.pdf. Accessed December 26, 2021
Chadar SN, Chadar K (2017) Solid waste pollution: a hazard to the environment. Recent Adv Petrochem Sci(RAPSCI) 2(3):2–4
CPHEEO (Central Public Health and Environmental Engineering Organization) (n.d.). Municipal solid waste management manual part ii: the manual. http://sac.ap.gov.in/sac/UserInterface/Downlaods/MSWMReports/Book2.pdf.
Dawit M, Hailu H,& Feyisa A (2019) Assessment of reuse, recycle, and recoverable potential of solid waste. In MATEC Web of Conferences (Vol. 276, p. 06007). EDP Sciences. https://doi.org/10.1051/matecconf/201927606007
Department of Economic Affairs (2009) Position paper on the Solid Waste Management Sector in India. November 2009. Ministry of Finance. Government of India. Pages 1-70. http://www.indiaenvironmentportal.org.in/files/ppp_position_paper_solid_waste_mgmt.pdf. Accessed 12 Dec 2021
Ewaste (Management) rules (2016) Ministry Of Environment, Forest, and Climate Change, Notification. Published In the Gazette of India, extraordinary part-II, [Section- 3, Sub-Section (I)] Government of India New Delhi, the 23rd March 2016. https://rb.gy/rmv7zl. Accessed 3 Dec 2021
E-waste (management) rules, (2016). https://rb.gy/rmv7zl. Accessed 3 Dec 2021
Ministry of Environment, Forest and Climate Change (2019) Annual Report 2018-19. Government of India. http://moef.gov.in/wp-content/uploads/2019/08/Annual-Report-2018-19-English.pdf. Accessed 8 Dec 2021
Ferronato N, Portillo MAG, Lizarazu EGG, Torretta V, Bezzi M, Ragazzi M (2018) The municipal solid waste management of La Paz (Bolivia): challenges and opportunities for sustainable development. Waste Manag Res 36(3):288–299
Forest Ministry of Environment and Climate Change (2019) Final environmental assessment. http://www.indiaenvironmentportal.org.in
Gidde MR, Todkar VV, & Kokate KK (2008) Municipal Solid Waste Management in Emerging Mega Cities: A case study of Pune City. Indo Italian Conference on Green and Clean Environment. March 20-21, MAEER's MIT College of Engineering. https://www.yumpu.com/en/document/view/8300522/municipal-solid-waste-management-in-emerging-mega-cities-a-
Government of India Ministry of Environment, Forest and Climate Change (2019) Generation of waste. Lok Sabha unstarred question no. 4553 to be answered on 19.07.2019. http://www.indiaenvironmentportal.org.in/files/file/Generation%20of%20Waste.pdf. Accessed 8 Dec 2021
Gupta B, Arora SK (2016) Municipal solid waste management in Delhi—the capital of India. Int J Innov Res Sci Eng Technol 5(4):5130–5138
Gupta N, Yadav KK, Kumar V (2015) A review on the current status of municipal solid waste management in India. J Environ Sci 37:206–217
Hazra T, Goel S (2009) Solid waste management in Kolkata, India: practices and challenges. Waste Manag 29(1):470–478
Inglezakis V, Dvorak S, Varga J, Venetis C, Zorpas A, Eliopoulos K, Ardeleanu N, Ilieva L, Moustakas K, Loizidou M et al (2012) Municipal solid waste experimental studies in Romania and Bulgaria. Int J Chem Environ Eng Syst (IJCEES) 3(3):64–73
Jain A, Kaur H, Khanna S (2005) Computer model for municipal solid waste treatment in developing countries. Environ Sci Technol 39(10):3732–3735
Jha MK, Sondhi OAK, Pansare M (2003) Solid waste management-a case study. Indian J Environ Prot 23:1153–1160
Joshi R, Ahmed S (2016) Status and challenges of municipal solid waste management in India: a review. Cogent Environ Sci 2(1):1139434
Kalyani KA, Pandey KK (2014) Waste to energy status in India: a short review. Renew Sust Energ Rev 31:113–120
Kansal A (2002) Solid waste management strategies for India. Indian J Environ Prot 22(4):444–448
Kaushal RK, Varghese GK, Chabukdhara M (2012) Municipal solid waste management in India-current state and future challenges: a review. Int J Eng Sci Technol 4(4):1473–1489
Khajuria A, Matsui T, Machimura T (2011) Gis application for estimating the current status of municipal solid waste management system: a case study of Chandigarh city, India. Our Nat 9(1):26–33
Kiriaki MK (2018) Eramitsoglou and Konstantinos P Tsagarakis. . Public participation in designing the recycling bins to encourage recycling. Sustainability 10(4):1240
Kodali RK, Gorantla VS (2017) Smart solid waste management. In: In 2017 3rd International Conference on Applied and Theoretical Computing and Communication Technology (iCATccT). IEEE, Tumkur, pp 200–204
Kothari R, Sahab S (2021) Har Mohan Singh, Rajeev Pratap Singh, Bhaskar Singh, Deepak Pathania, Anita Singh, Shweta Yadav, Tanu Allen, Sohini Singh, et al. COVID-19 and waste management in Indian scenario: challenges and possible solutions. Environ Sci Pollut Res 28(38):52702–52723
Kreith F, & Tchobanoglous G (2002) Handbook of solid waste management Second Edition. Mcgraw-Hill. ISBN: 9780071356237. https://doi.org/10.1036/0071356231. Accessed 19 Dec 2021
Kumar A, Samadder SR (2017) An empirical model for prediction of household solid waste generation rate– a case study of Dhanbad. India Waste Manag 68:3–15
Kumar S, Bhattacharyya JK, Vaidya AN, Chakrabarti T, Devotta S, Akolkar AB (2009) Assessment of the status of municipal solid waste management in metro cities, state capitals, class I cities, and class II towns in India: an insight. Waste Manag 29(2):883–895
Kumar A, Kumar K, Kaushik N, Sharma S, Mishra S (2010) Renewable energy in India: current status and future potentials. Renew Sust Energ Rev 14(8):2434–2442
Kumar S, Dhar H, Nair VV, Bhattacharyya JK, Vaidya AN, Akolkar AB (2016) Characterization of municipal solid waste in high-altitude sub-tropical regions. Environ Technol 37(20):2627–2637
Kurian J (2002) Perspectives of solid waste management in India. In: In an international symposium on the technology and management of the treatment and reuse of municipal solid waste. Citeseer, Shanghai, pp 15–20
Liu C, Xin-wu W (2011) Factors influencing municipal solid waste generation in china: a multiple statistical analysis study. Waste Manag Res 29(4):371–378
Liu A, Ren F, Lin WY, Wang J-Y (2015) A review of municipal solid waste environmental standards with a focus on incinerator residues. Int J Sustain Built Environ 4(2):165–188
Loizia P, Voukkali I, Zorpas AA, Pedreno JN, Chatziparaskeva G, Inglezakis VJ, Vardopoulos I, Doula M et al (2021) Sci Total Environ 753:141974
Malakahmad D, Amirhossein D, Nasir CM, Za’im Zaki M, Kutty SRM, Isa MH (2010) Solid waste characterization and recycling potential for university technology Petronas academic buildings. Am J Environ Sci 6(5):422–427
Malviya R, Chaudhary R, Buddhi D (2002) Study on solid waste assessment and management-Indore city, Indian. J Environ Prot 22(8):841–846
Mammides C (2019) The European union’s conservation efforts are taxonomically biased. Biodivers Conserv 28(5):1291–1296
Mandal K et al (2019) Review on the evolution of municipal solid waste management in India: practices, challenges and policy implications. J Mater Cycl Waste Manag 21(6):1263–1279
Mani S, Singh S (2016) Sustainable municipal solid waste management in India: a policy agenda. Proc Environ Sci 35:150–157
Marshall RE, Farahbakhsh K (2013) Systems approach integrated solid waste management in developing countries. Waste Manag 33(4):988–1003
Miezah K, Obiri-Danso K, Kádár Z, Fei-Baffoe B, Mensah MY (2015) Municipal solid waste characterization and quantification as a measure towards effective waste management in Ghana. Waste Manag 46:15–27
Minghua Z, Xiumin F, Rovetta A, Qichang H, Vicentini F, Bingkai L, Giusti A, Yi L (2009) Municipal solid waste management in Pudong new area, China. Waste Manag 29(3):1227–1233
Ministry of Finance Department of Economic Affairs. (2009) Public-private partnerships in India. http://www.indiaenvironmentportal.org.in/files/ppp_position_paper_solid_waste_mgmt.pdf. Accessed 12 Dec 2021
Ministry of new and renewable energy (2016). Twentieth report standing committee on energy. (16 Lok Sabha)
Ministry of Environment, Forest and Climate Change (2016) Notification [Published in the Gazette of India, Part-II, Section-3, Sub-section (i)] New Delhi, the 18th March 2016. http://www.mppcb.nic.in/proc/Plastic%20Waste%20Management%20Rules,%202016%20English.pdf. Accessed 25 Dec 2021
Ministry of New and Renewable Energy (2016) Power Generation from municipal solid waste. Twentieth report standing committee on energy (2015-2016) (sixteenth Lok Sabha) Presented to Lok Sabha on 05.08.2016 Laid in Rajya Sabha on 05.08.2016. http://164.100.47.193/lsscommittee/Energy/16_Energy_20.pdf. Accessed 15 Dec 2021
Ministry of Housing and Urban Affairs (2020) Waste Management in Urban Areas, Rajya Sabha unstarred question no. 1998 to be answered on March 11, 2020. http://www.indiaenvironmentportal.org.in/files/file/Rajya-Sabha-on-waste-management-in-urban-areas.pdf. Accessed 18 Dec 2021
Misra V, Pandey SD (2005) Hazardous waste, impact on health and environment for the development of better waste management strategies in future in India. Environ Int 31(3):417–431
Mission SB (2016) Municipal solid waste management manual part I: An Overview. Ministry of Urban Development central public health and environmental engineering organization (CPHEEO), Government of India. https://mohua.gov.in/upload/uploadfiles/files/Part2.pdf
Mohd Arshad Siddiqui (2018) Municipal solid waste management in India-status and challenges: an overview Int. J Biol Res 3:12–133
Moloney B, Doolan M (2016) A comparison of obstacles in emerging and developed nation dry waste recovery. Proc CIRP 40:347–352
Murray A, Skene K, Haynes K (2017) The circular economy: an interdisciplinary exploration of the concept and application in a global context. J Bus Ethics 140(3):369–380
MSWM Manual (2016) CPHEEO (Central Public Health and Environmental Engineering Organization). “Municipal Solid Waste Management Manual. Part II: TheManual”. Ministry of Urban Development, Government of India). Accessed November 28, 2021. http://cpheeo.gov.in/upload/uploadfiles/files/Part2.pdf
Nagari S (2017) Management of civic amenities system in Jammu, Jammu & Kashmir. In: In sustainable smart cities in India. Springer, Berlin, pp 767–778
Nandan A, Yadav BP, Baksi S, Bose D (2017) Recent scenario of solid waste management in India. World Sci News 66:56–74
Narayana T (2009) Municipal solid waste management in India: from waste disposal to the recovery of resources? Waste Manag 29(3):1163–1166
NEERI (1995) Annual Report. CSIR, CSIR-National Environmental Engineering Research Institute (A constituent laboratory of CSIR), Pages 1-190. https://www.neeri.res.in/file_abouts/19217315_annual_report_1995.pdf. Accessed 31 Nov 2021
Nema AK (2004) Collection and transport of municipal solid waste. Training program on solid waste management. Springer, Delhi
Nixon JD, Dey PK, Ghosh SK (2017) Energy recovery from waste in India: an evidence-based analysis. Sustain Energy Technol Assess 21:23–32
Pappas G, Papamichael I, Zorpas A, Siegel JE, Rutkowski J, Politopoulos K (2021) Modeling key performance indicators in a gamified waste management tool. Modeling 3(1):27–53
Pariatamby A, Cheah WY, Shrizal R, Thamlarson N, Lim BT, Barasarathi J (2015) Enhancement of landfill methane oxidation using different types of organic wastes. Environ Earth Sci 73(5):2489–2496
Pearce DW, Turner RK, Turner RK (1990) Economics of natural resources and the environment. Johns Hopkins University Press, Johns Hopkins
Plastic waste (management and handling) rules. (2016). https://rb.gy/osddtl. Accessed 25 Dec 2021
POMPI INDIA (2011) Census of India 2011 provisional population total. Office of the Registrar General and Census Commissioner, New Delhi
Power generation from municipal solid waste (n.d.). http://164.100.47.193/lsscommittee/Energy/16_Energy_20.pdf. Accessed 31 Dec 2021
Power generation from municipal solid waste Karajgi, S. B., Yaragatti, U. R., & Kamalapur, G. D. (2012). Modeling of power generation using municipal solid waste in India. International Journal of Electrical and Computer Engineering, 2(2), 197. https://doi.org/10.11591/ijece.v2i2.270. Accessed 31 Dec 2021
Priyadarshi H, Priya S, Jain A, & Khursheed S (2019) A Literature Review on Solid Waste Management: Characteristics, Techniques, Environmental Impacts and Health Effects in Aligarh City, Uttar Pradesh, India. In International Congress and Exhibition" Sustainable Civil Infrastructures” (pp. 79–90). Springer, Cham. https://doi.org/10.1007/978-3-030-34199-2_6
Public-private partnerships in India. (2009) https://rb.gy/1bin9z
Srijana Mitra Das (2021) Better food waste management will give India both nutritional and environmental security. TIMES EVOKE, News Article. Updated April 3, 2021, 08:03 IST. https://timesofindia.indiatimes.com/better-food-waste-management-will-give-india-both-nutritional-and-environmentalsecurity/articleshow/81876281.cms. Accessed 3 Jan 2022
RAJPUT R, Prasad G, & Chopra AK (2009) Scenario of solid waste management in the present Indian context. Caspian Journal of Environmental Sciences 2009, 7(1):45–53. https://www.nswai.org/docs/Scenario%20of%20solid%20waste%20management%20in%20present%20Indian%20context.pdf
Rathi S (2006) Alternative approaches for better municipal solid waste management in Mumbai. India Waste Manag 26(10):1192–1200
Ray MR, Roychoudhury S, Mukherjee G, Roy S, Lahiri T (2005) Respiratory and general health impairments of workers employed in municipal solid waste disposal at an open landfill site in Delhi. Int J Hyg Environ Health 208(4):255–262
Revision 1 (2020) Guidelines for handling, treatment, and disposal of waste generated during treatment/ diagnosis/ quarantine of covid-19 patients. http://www.uppcb.com/pdf/Guidelines_190320.pdf. Accessed 8 Dec 2021
Rodríguez-Entrena M, Barreiro-Hurlé J, Gómez-Limón JA, Espinosa-Goded M, Castro-Rodríguez J (2012) Evaluating the demand for carbon sequestration in olive grove soils as a strategy toward mitigating climate change. J Environ Manag 112:368–376
Saha JK, Panwar N, Singh MV (2010) An assessment of municipal solid waste compost quality produced in different cities of India in the perspective of developing quality control indices. Waste Manag 30(2):192–201
Sahu S, Nair SJ, Sharma PK (2014) Review on solid waste management practice in India: a state of the art. Int J Innov Res Dev 3(3):261–264
Sareen S, Grandin J (2020) European green capitals: branding, spatial dislocation, or catalysts for change? Geografiska Annaler: Series B, Human Geogr 102(1):101–117
Saxena S, Srivastava RK, Samaddar AB (2010) Sustainable waste management issues in India. IUP J Soi Water Sci 3(1):72–90
SB Mission. (2016) Municipal solid waste management manual part ii: the manual. Central Public Health and Environmental Engineering Organisation (CPHEEO) Ministry of Urban Development
Sharholy M, Ahmad K, Mahmood G, Trivedi RC. (2005) Analysis of municipal solid waste management systems in Delhi–a review. In Book of proceedings for the second International Congress of Chemistry and Environment, Indore 773–777
Sharholy M, Ahmad K, Mahmood G, Trivedi RC (2008) Municipal solid waste management in Indian cities–a review. Waste Manag 28(2):459–467
Sharma KD, Jain S (2019) Overview of municipal solid waste generation, composition, and management in India. J Environ Eng 145(3):04018143
Sharma VK, Mincarini M, Fortuna F, Cognini F, Cornacchia G (2000) Disposal of waste tires for energy recovery and a safe environment. Appl Energy 65(1-4):381–394
Sharholy M, Ahmad K, Mahmood G, & Trivedi RC (2005) Analysis of municipal solid waste management systems in Delhi–a review. In Book of proceedings for the second International Congress of Chemistry and Environment, Indore, India (pp. 773–777). https://www.researchgate.net/publication/303254724_Analysis_of_municipal_solid_waste_management_systems_in_Delhi_-_A_review
Siddiqui TZ, Siddiqui FZ, Khan E (2006) Sustainable development through integrated municipal solid waste management (MSWM) approach–a case study of Aligarh district. In: In Proceedings of the national conference of advanced in mechanical engineering (AIME-2006). Jamia Millia Islamia, New Delhi, pp 1168–1175
Single-use plastic (2020) Government notifies the Plastic Waste Management Amendment Rules (2021) prohibiting identified single-use plastic items by 2022. Ministry of Environment, Forest and Climate Change. Posted On: 13 AUG 2021 3:38 PM by PIB Delhi, Release ID: 1745433. https://pib.gov.in/PressReleaseIframePage.aspx?PRID=1745433. Accessed 28 Dec 2021
Solid Waste Management Rules (2016) CPCB, Ministry of Environment, Forest and Climate Change. Published 23rd March 1974. Pages 1–91. https://cpcb.nic.in/rules-2/
Srijana Mitra Das (2021) Better food waste management will give India both nutritional and environmental security. TIMES EVOKE, News Article. Updated April 3, 2021, 08:03 IST. https://timesofindia.indiatimes.com/better-food-waste-management-will-give-india-both-nutritional-and-environmentalsecurity/articleshow/81876281.cms. Accessed 3 Jan 2022
Suggestive or indicative (2015) An action plan for the management of municipal solid waste. https://rb.gy/72ha8q. Accessed 7 Jan 2022
Sujauddin M, Huda SM, Hoque AR (2008) Household solid waste characteristics and management in Chittagong, Bangladesh. Waste Manag 28(9):1688–1695
Syahiya M, & Megantara E N (2021) Dynamic spatial model of non- domestic waste transport in strategic areas. In E3S Web of Conferences (Vol. 249, p. 02007). EDP Sciences. https://doi.org/10.1051/e3sconf/202124902007. Accessed 1 Dec 2021
Talyan V, Dahiya RP, Sreekrishnan TR (2008) State of municipal solid waste management in Delhi, the capital of India. Waste Manag 28(7):1276–1287
Tennessee Valley Authority (2009) Final environmental assessment. Environmental assessment for the department of energy loan to Nissan North America,Inc., for advanced technology electric vehicle manufacturing project in Smyrna, Tennessee Valley Authority. http://www.nrc.gov/docs/ML1132/ML113210644.pdf. Accessed 5 Jan 2022
The Water (Prevention and Control of Pollution) Act (1974) ACT NO. 6 OF 1974.CPCB, Ministry of Environment, Forest and Climate Change. 23rd March 1974. Pages 1–30. https://cpcb.nic.in/upload/home/water-pollution/WaterAct-1974.pdf
United Nations Environment Division of Technology. (2017) Summary Report: Waste Management in ASEAN countries. Asian Institute of Technology, Regional Resource Centre for Asia and the Pacific. Page 1-76. https://wedocs.unep.org/bitstream/handle/20.500.11822/21134/waste_mgt_asean_summary.pdf. Accessed 30 Dec 2021
Upadhyay V, Jethoo AS, Poonia MP (2012) Solid waste collection and segregation: a case study of MNIT campus, Jaipur. Int J Eng Innov Technol 1(3):144–149
van Schaik MO, Sucu S, Cappon HJ, Wei-Shan Chen D, Martinson B, Ouelhadj D, Rijnaarts HHM (2021) Mathematically formulated key performance indicators for the design and evaluation of treatment trains for resource recovery from urban wastewater. J Environ Manag 282:111916
Vij D (2012) Urbanization and solid waste management in India: present practices and future challenges. Proc Soc Behav Sci 37:437–447
World Health Organization (2018). Health-care waste. 8 February 2018. Website link: https://www.who.int/news-room/fact-sheets/detail/health-care-waste. Accessed 23 Nov 2021
World health organization. (n.d.) https://www.who.int/
Yaduvanshi NR, Myana R, Krishnamurthy S (2016) Circular economy for sustainable development in India. Indian J Sci Technol 9(46):1–9
Zafar S (2016) “Wasteto- energy in India: An interview with Salman Zafar.” Power Today Magazine. https://www.bioenergyconsult.com/waste-to-energy-india/. Accessed 10 Jan 2022
Zorpas AA, Katia Lasaridi K, Abeliotis IV, Pantelitsa Loizia L, Fitiri CC, Bikaki N (2014) Waste prevention campaign regarding the waste framework directive. Fresenius Environ Bull 23(11a):2876–2883
Zorpas AA, Voukkali I, Loizia P (2017) A prevention strategy plan concerning the waste framework directive in Cyprus. Fresenius Environ Bull 26(2):1310–1317
Author information
Authors and Affiliations
Corresponding author
Ethics declarations
Conflict of interest
The authors declare no competing interests.
Additional information
Responsible Editor: Amjad Kallel
Rights and permissions
About this article

Cite this article
Pal, M.S., Bhatia, M. Current status, topographical constraints, and implementation strategy of municipal solid waste in India: a review. Arab J Geosci 15, 1176 (2022). https://doi.org/10.1007/s12517-022-10414-w
Received:
Accepted:
Published:
DOI: https://doi.org/10.1007/s12517-022-10414-w