
Sediment Characteristics—A Key Factor for Fish Farm Site Selection: Examples from Croatia

1
Department of Geology, Faculty of Science, University of Zagreb, Hovatovac 102a, 10000 Zagreb, Croatia
2
Department of Biology, Faculty of Science, University of Zagreb, Rooseveltov trg 6, 10000 Zagreb, Croatia
3
Ruđer Bošković Institute, Bijenička Cesta 54, 10000 Zagreb, Croatia
4
Faculty of Agriculture, University of Zagreb, Svetošimunska 25, 10000 Zagreb, Croatia
*
Author to whom correspondence should be addressed.
Minerals 2022, 12(6), 696; https://doi.org/10.3390/min12060696
Submission received: 3 May 2022
/
Revised: 25 May 2022
/
Accepted: 28 May 2022
/
Published: 30 May 2022
(This article belongs to the Special Issue Environmental Aspects of Particle Size Distribution and Mineralogical Composition of Soil and Sediment)
Abstract
:The rapid development and intensive production of aquaculture have brought to light various environmental problems. In particular, fish farming adversely affects the benthic environments through the accumulation of organic matter (OM), which leads to the degradation of aquatic sediments and associated biotic communities. To prevent environmental degradation, proper site selection for fish farming is a prerequisite for sustainable aquaculture practices. An important physical factor in selecting a site for fish farming is sediment structure. Coarser sediments are preferred, while their mineral composition is rarely discussed. To investigate relationships between sediment characteristics and the content of OM, sediments were collected from three different sites with different aquaculture practices under different climatic and environmental conditions and analyzed during the one-year monitoring period. Grain size distribution, mineral composition, carbonate content, and organic matter content were determined for three fish farm sites (Ilova, River, Krka River, and Pelješac) and their reference sites. Preliminary results from all studied sites showed that sediment texture in combination with natural mineral composition is one of the key factors for the accumulation of OM in the sediment. In particular, the mineral composition of the fine-grained sediment should be known when conducting an environmental impact assessment of fish farms.
Keywords:
Adriatic Sea; fish farm; fishpond; grain size; Ilova River; Krka River; mineral composition1. Introduction
Aquaculture is now the fastest growing food production sector in the world, with an annual growth rate of 6–8%, and currently provides about 50% of the world’s fish food [1]. In many Mediterranean countries, e.g., Spain, France, Italy, Portugal, and Greece, aquaculture (shellfish farming followed by marine fish farming) is leading [2]. This is also true in Croatia, where marine fish farming produced 17,000 t/year in 2019, compared to ~3000 t/year in freshwater aquaculture [3]. Marine fish farms are generally located in coastal waters, where a variety of activities take place. The rapid expansion of aquaculture around the world has led to growing concerns about environmental degradation and associated conflicts, especially with other users of freshwater and marine resources [4,5,6,7,8,9].
Regardless of the category of fish farming, aquaculture facilities can generate significant amounts of effluents and wastes that emit a wide range of particulates and solutes, mainly from fecal material and uneaten food, as well as various metabolites from excreta [10]. Excessive input of organic material (OM) leads to its accumulation on the sediment surface and reduces the oxygen supply to benthic organisms [11]. Organic sediment accumulation is considered the main cause of benthic habitat degradation [12], which can gradually transform the sediment surface into an anoxic environment [13,14]. Nutrient input from OM can lead to eutrophication, which causes further oxygen depletion or toxic blooms [11]. In addition, various chemicals (e.g., pharmaceuticals and antibiotics) used to enhance fish growth or treat/prevent fish diseases/infections may enter the marine system and affect non-target species [11,15,16,17,18,19,20]. Therefore, the intensive and sustained discharge of organic and inorganic materials from fish farms can cause chemical, physical, and biological changes in the receiving environment, both in the water column and in the sediment [21]. However, seafloor sediment acts as a preferential sink for a variety of organic and inorganic compounds [22]. Anoxic conditions can also lead to the formation of toxic gases (e.g., hydrogen sulfide, ammonia, and methane) and remobilization of trace metals (e.g., copper, zinc, cobalt, cadmium) [23,24]. An altered sediment environment could thus serve as a source of pollutants, further degrade water quality, and affect the food web [25].
The fate of any kind of waste that enters the water column is highly dependent on a variety of physical characteristics of aquaculture sites: wind and wave patterns, currents, tidal regime, bathymetry, and geomorphology [26,27,28,29,30]. To avoid environmental pollution, proper site selection is a prerequisite for sustainable aquaculture practices [6]. One of the most important physical factors in the selection of sites for fish farms is the sediment structure: coarse sediment is preferred, which indicates adequate lateral water transport [31]. According to the Official Gazette of the Republic of Croatia, the structure and composition of sediment is listed as one of the physical characteristics within the biophysical criteria for aquaculture site selection [32]. In the scientific literature, sediment structure, which is often described as coarseness, is considered an adequate sediment property [6], while sediment mineral composition is usually less discussed. The coarse-grained nature of sediments is a typical feature of high-energy environments through which waves or bottom currents flow. Such environments are less affected by waste accumulation due to the dispersion caused by the higher hydrodynamics [27].
The aims of this study are: (a) To investigate the relationship between sediment characteristics (texture and mineral composition) and OM at three different aquaculture sites (Ilova fishpond—IF, Krka fish farm—KF, Pelješac fish farm—PF) and their control sites (Ilova River—IR, Krka River—KR, Pelješac reference site—PR) over a period of one year. Differences between the studied sites include climate (continental and Mediterranean), environmental conditions (clay fishponds, fish farms in karst rivers, fish farms in the sea), management practices in terms of water flow, and size of farms (ponds, tanks, and cages in the open sea). (b) To determine sediment characteristics that could affect the concentration of OM, and (c) to initiate the environmental impact assessment of selected aquaculture sites.
2. Materials and Methods
2.1. Study Sites and Sampling
2.1.1. Ilova River Site
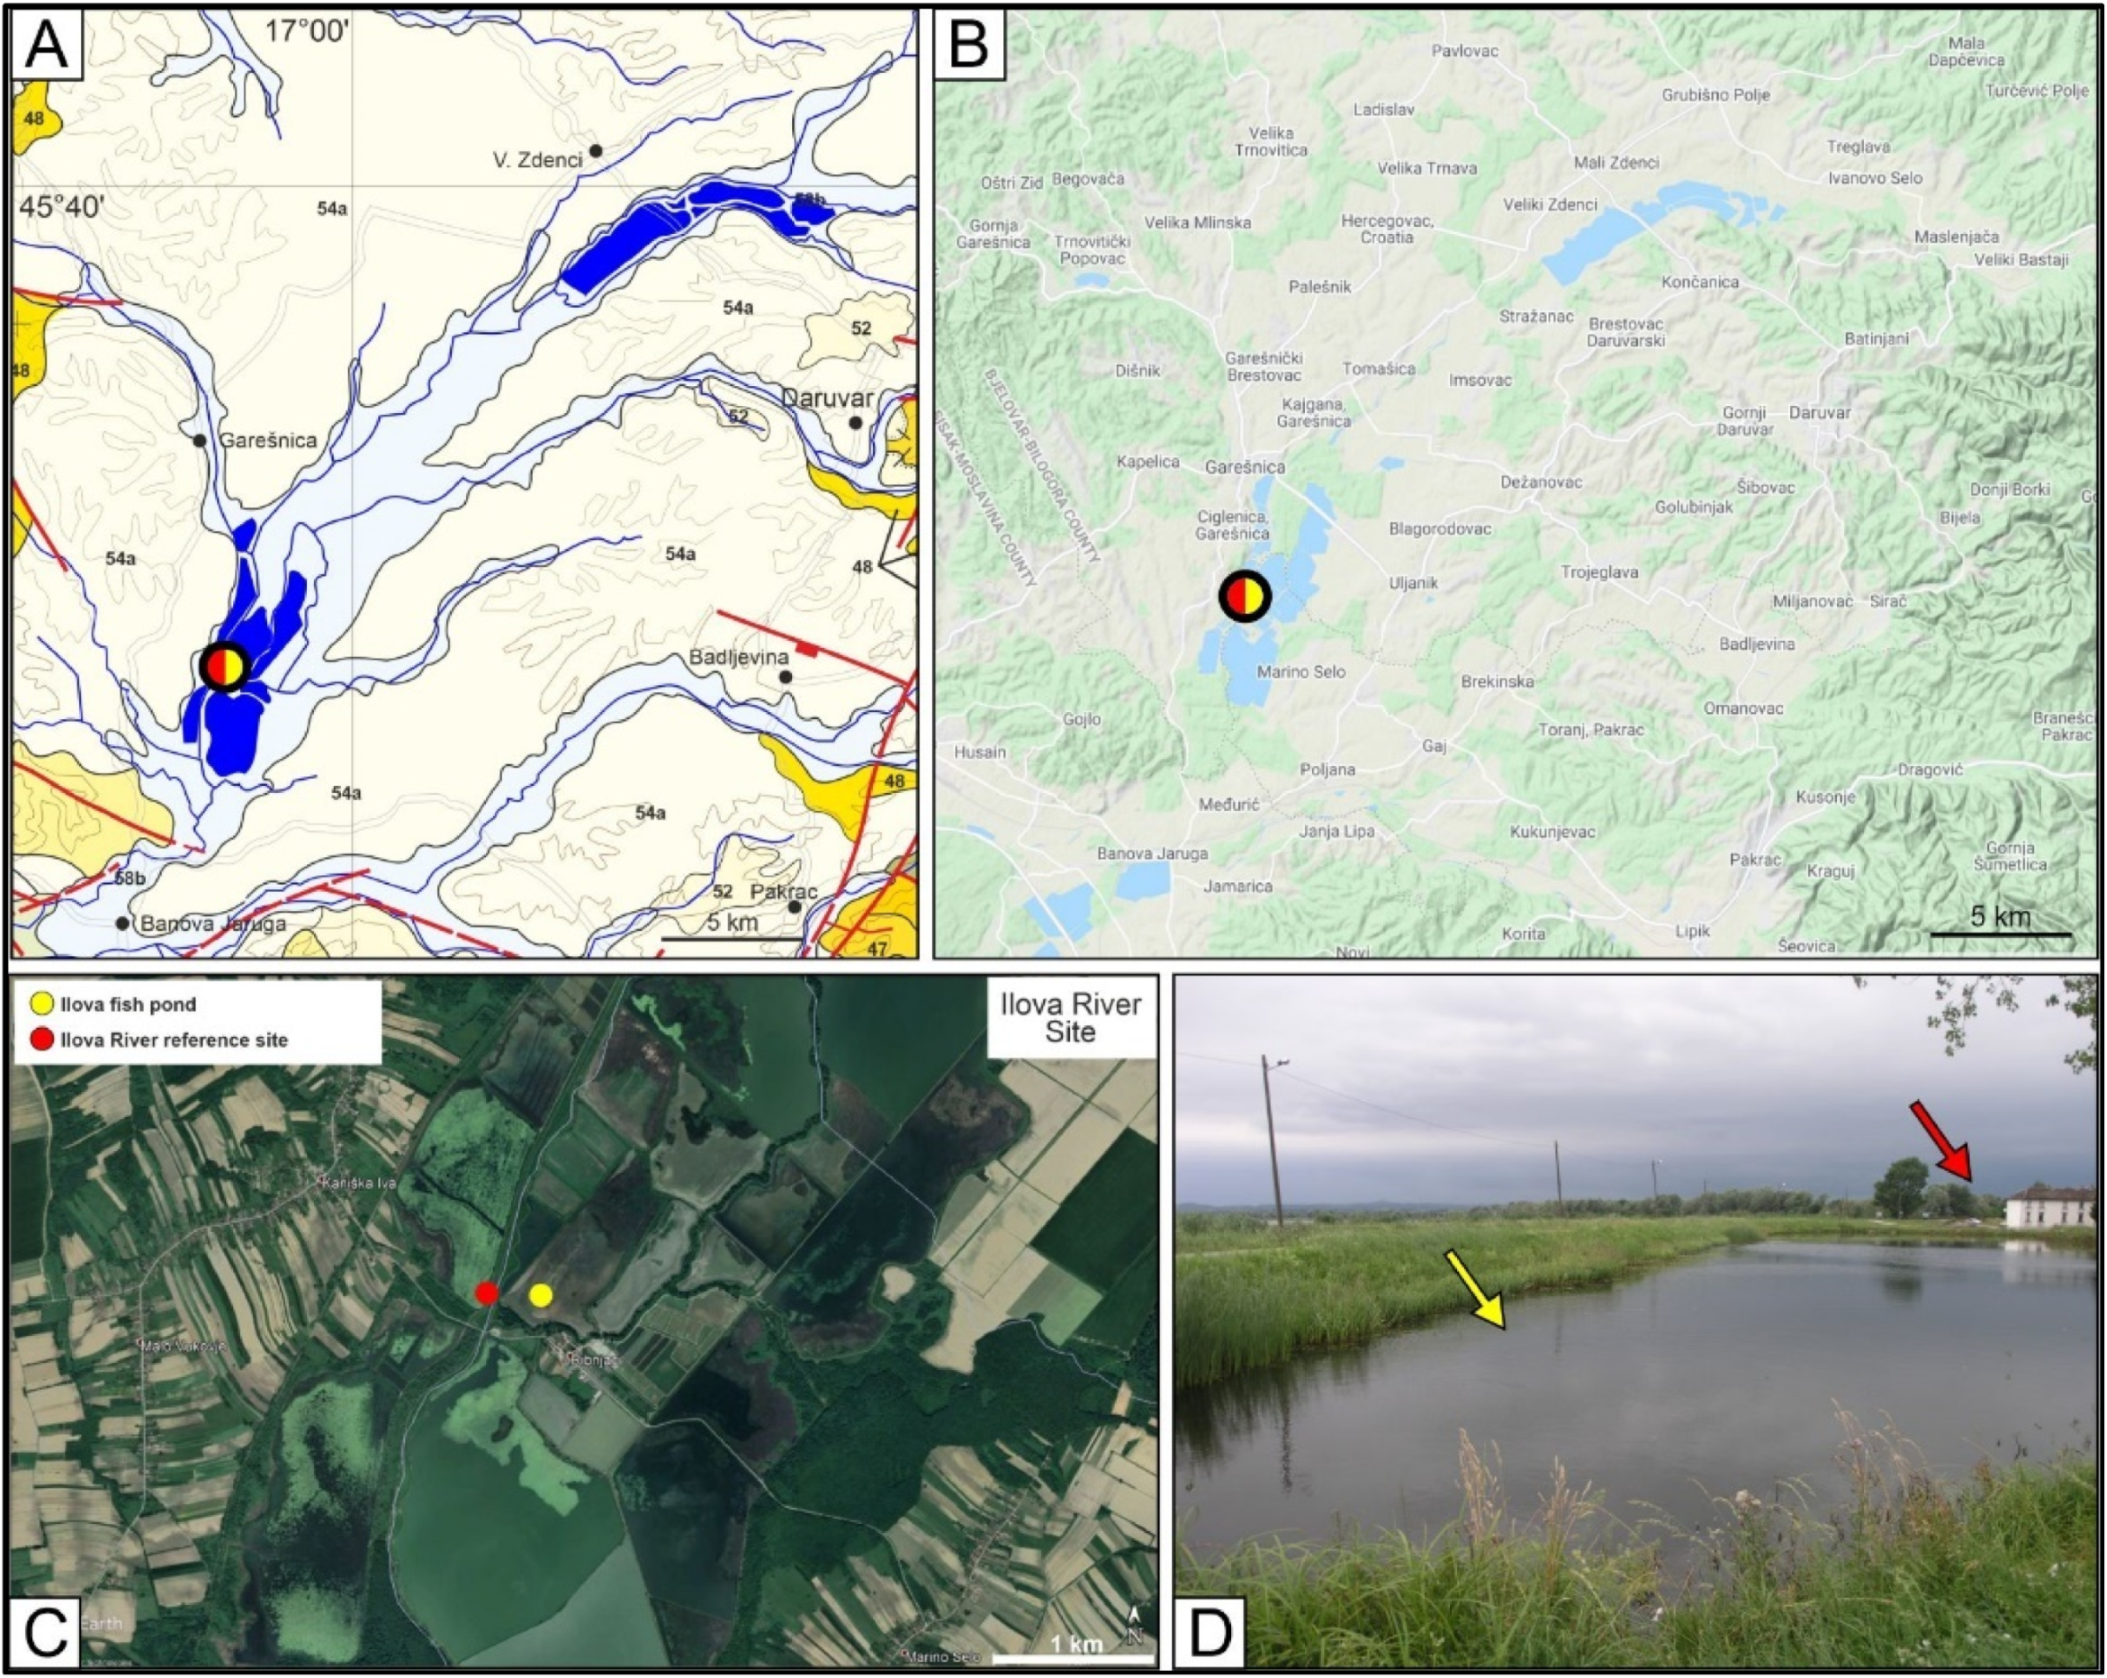
The Ilova River and its fishponds are located in the continental part of Croatia (Figure 1). The Ilova River is a small river of the Black Sea watershed. It is located in a region with a temperate rainy climate: the average annual air temperature is 10–11 °C and the annual precipitation ranges from 800 to 900 mm. The total duration of solar radiation is between 1700 and 1800 h [33]. As shown in Figure 2, the area around the Ilova River is a rural agricultural area [34]. Due to its broad flood line within the middle reaches, Ilova aquaculture ponds include several earthen fishponds on the left bank of the river (Figure 2), covering 1350 hectares. The ponds are roughly north–south elongated and follow the main direction of the natural river course, so they are filled by gravity. In addition, canals and river weirs have been constructed to control the water level in the ponds. The average depth of the ponds is 1.5 m. About 90% of the fish produced are carp (Cyprinus carpio), while the remaining 10% are other common freshwater species. The annual fish production is estimated to be 600–750 tons. Data on the amount of fish feed used in Ilova ponds are not available.
Most of the middle reaches of the Ilova River are surrounded by Holocene alluvial deposits of the Ilova River (gravels to clays) and Pleistocene loess deposits. Clastites of Miocene and Pleistocene age are more abundant in the hills (Figure 2) [35,36]. Sediment samples were collected seasonally three times (June, September, and November) in 2016 from a fishpond (samples IF) at a 2 m depth and from the reference station in the Ilova River (samples IR) at a 1 m depth (Figure 2). Due to the late start of the research project, sampling was not possible in February 2016.
Surface sediment was sampled at both sites in several replicates for all analyses using an extendable, hand-made plastic drill with a diameter of 5 cm. The extracted sediment was sealed with labeled rubber caps on both sides of the drill (first at the top, then at the bottom) to prevent sediment loss. The surface sediment layer of 4 cm was carefully separated and stored at −20 °C until analysis. Frozen storage was chosen to preserve OM in case of prolonged laboratory work.
2.1.2. Krka River Site
The Krka fish farm is located in the upper reaches of the Krka River (Figure 1), about 300 m downstream from the main source of the Krka River in connection with the Krčić tributary (Figure 3). This aquaculture facility is a fish farm created as a flow system separated from the Krka riverbed. It was built in the form of contiguous rectangular concrete basins, into which the diverted water of the Krka River continuously enters and exits via the outflow channel. The study areas of the Krka River are located in the Dalmatian hinterland with a moderately warm and humid climate: the average annual air temperature in this area is 12–13 °C and the annual precipitation ranges from 1100 to 1200 mm. The total duration of annual solar radiation is between 2200 and 2400 h [33]. The study area of the Krka River is considered an urban area [34]. The fish species produced here are rainbow trout (Oncorhynchus mykiss) and brown trout (Salmo trutta). The annual fish production is about 100 tons. As in the case of the study area on the Ilova River, there are no available data on the amount of fish feed used for the fish farm on the Krka River.
The geological environment of the upper reaches of the Krka River is tectonically quite complex. However, the whole area is characterized by various carbonates with a wide age range. Triassic dolomites, Jurassic limestones and dolomites, and Cretaceous limestones and dolomites are the most widespread (Figure 3). The fish farm is located in this karst carbonate, while downstream of the Krka River, proluvial and alluvial deposits of Holocene age have formed [35,36]. Sediment samples in the Krka fish farm (samples KF) were collected with a hand-made, extendable plastic drill with a diameter of 5 cm in several repetitions at the end of the basins (in the sedimentation basin, Figure 3D). Due to the relatively thin sediment cover within the artificial sedimentation basin, the entire amount of sediment collected was considered surface sediment.
The same sampling technique was applied at the reference site on the Krka River downstream (samples KR), at a river depth of 0.5 m. The surface sediment was carefully collected without losing fine-grained material. After sampling, the sediment was stored at −20 °C until laboratory analysis. The reference station on the Krka River was sampled three times seasonally in 2017 (June, September, and November). Sampling at the fish farm was not conducted in February because the settling ponds were unexpectedly cleaned, and the sediment was completely removed before fieldwork.
2.1.3. Pelješac Study Site
Pelješac fish farm is located south of Dubovac Island in the Malo More Bay (Figure 1, Figure 4), between Pelješac Peninsula and the mainland. This coastal study site is located in the south of the Croatian coast, which is characterized by a Mediterranean climate with mild and humid winters and dry, hot summers. The average annual air temperature in this coastal area is 15–16 °C, and the annual precipitation ranges from 1100 to 1200 mm. The total duration of annual solar radiation is between 2600 and 2700 h [33]. According to [34], the study area of Pelješac is a rural area with scattered settlements, mainly used during the tourist season. The farm is a stationary fish farm containing platforms and cages of different shapes. The main fish species produced here are European sea bass (Dicentrarchus labrax) and gilthead sea bream (Sparus aurata). The annual production of these fish is about 50 tons. Data on the fish feed used here are not available.
The Malo More Bay is an elongated, channel-like body of water between the Neretva River channel in the northwest and Mali Ston Bay. Most of the Malo More Bay is surrounded by Cretaceous and Eocene carbonates, with no sediments from the river directly entering the fish farm study area (Figure 4) [35,36]: the mouth of the Neretva River is in the northwestern direction (see Figure 1). Sediment samples were collected seasonally in February, June, September, and November 2017 with the grab (Hydrobios box sampler; Altenholz, Germany) at a 17–18 m depth near Pelješac fish farm (samples PF) and at the same depth near the Pelješac reference site (samples PR) on Pučenjak island (Figure 4). The first 4 cm of sediment were carefully separated by the box borer to prevent loss of fine fraction.
2.2. Sediment Analyses
2.2.1. Grain Size Analysis
A defrosted sediment subsample was taken for each analysis and dried at 50 °C for 24 h. A total of 100 g of each dried and previously homogenized sediment sample was separated and wet-sieved with a set of 7 ASTM (American Society for Testing and Materials) standard sieves (Retsch, Austria) at 1ϕ intervals to characterize the grain size of the gravel and sand fractions. The silt fraction (<0.063 mm) was collected in suspension and then analyzed on the Micromeritics Sedigraph 5100 using the standard sedigraph method [37]. The dried gravel sand fractions collected from the sieves were weighed and merged with the data obtained by sedigraph using the Gradistat statistical package [38]. The sediments were classified according to the scheme of Folk [39]. The statistics of the granulometric parameters were calculated using the formulas proposed in [40].
2.2.2. Carbonate Content
Five to six grams of each sediment sample were homogenized and pulverized using an agate mill. The carbonate content of all samples was determined by gas (CO2) volumetry using the Scheibler instrument (Standard: HRN ISO: 10693:2014) [41,42]. The method is based on the evolution of carbon dioxide after the reaction of carbonates with hydrochloric acid diluted with distilled water (1:1). A standard (pure CaCO3) was analyzed before the sediment analysis. The analysis of each sample was performed in duplicate. The differences between the subsamples of each sediment sample were within 2%, and the results presented are the averages of two measurements.
2.2.3. Mineral Composition
Qualitative mineral composition was performed on previously pulverized bulk samples by X-ray diffraction (XRD) (Malvern Panalytical Ltd, Malvern, UK) analysis using a Philips X-Pert PRO diffractometer. Analyses were performed at 40 kV, 40 mA, with Cu Kα radiation ranging from 4° to 63° 2θ. The semiquantitative abundance of each mineral was estimated from the relative intensity of the mineral peaks.
2.2.4. Organic Matter (OM) Content
Total OM was estimated as weight loss on ignition loss (LOI) on loose sediment samples using the slightly adapted method applied in [43]. Dried sediment samples were pulverized and subsamples of 0.8–0.9 g were separated and incinerated at 400 °C for 7 h. These sample amounts and method conditions were applied to ensure consistency, as variation in sample size and change in method conditions can affect LOI results [42]. Each sample was analyzed in duplicate, and the results presented are the average of two measurements.
2.2.5. Statistical Analysis
To investigate the relationship between sediment properties (grain size fractions, carbonate fraction, and OM), we performed principal component analysis (PCA) using the R platform. Prior to PCA, log-transformed data were standardized by subtracting the mean from each value and dividing by the standard deviation.
3. Results
3.1. Grain Size Analysis
3.1.1. Ilova River Site
The main visible difference between the Ilova fishpond and the Ilova River is the presence or absence of the gravel fraction. Unlike the Ilova River reference site, where no gravel was found during the monitoring period, Ilova fishpond had a significant amount of gravel particles (Table 1).
In general, sediments in Ilova fishpond were classified as muddy gravel (mG) or gravelly mud (gM). Sediment samples from the Ilova River were determined to be sandy silt (sM) or mud (M). Accordingly, the mean (Md) and median (Mz) particle sizes of the Ilova fishpond samples exhibited greater variation and were extremely poorly sorted. The median and mean particle sizes of the samples from the Ilova River had less variation and the sorting of the sediments was slightly better, but still very poorly sorted (Table 1).
3.1.2. Krka River Site
All sediment samples from the study area on the Krka River showed higher similarity compared to the study area on the Ilova River. Two of the three samples collected in the fish farm were classified as sandy gravel (sG), while one was determined to be gravelly muddy sand (gmS) (Table 2). A greater difference between Md and Mz was observed for sample KF collected in November 2017, which was attributed to the higher proportion of gravel particles and the distribution of grain size within the gravel fractions. In the case of the reference site on the Krka River, three out of four samples were classified as sandy gravel (sG), while only one sample was determined to be slightly gravelly sand ((g)S). The Md and Mz values were generally closer together in the Krka River than in the Krka fish farm. Accordingly, the sorting of sediments from the Krka River was better than that from the Krka fish farm (Table 2).
3.1.3. Pelješac Site
The marine sediments collected from both the Pelješac fish farm and the Pelješac reference site showed the dominance of two coarse fractions: sand and gravel (Table 3). In general, both sites yielded sediment samples where Md and Mz values are relatively close. Nevertheless, sediments from both sites are poorly sorted, with one exception: the sample PF collected in September 2017 contained a much higher proportion of a muddy fraction compared to the other samples in Table 2.
Due to the higher proportion of the mud fraction combined with the gravel fraction, the sorting of this sample was extremely poor compared to the other Pelješac samples. This is reflected in the mean and average grain size: the significantly lower Md and Mz values show that the mud fraction is abundantly represented (>50%).
3.2. Carbonate Content
Summary data of the carbonate content analysis for all sediment samples are presented in Table 4. The sediment samples from the Ilova River reference site contained a low percentage of carbonates or no carbonates at all (Table 4). Surprisingly, the sediment from the Ilova fishpond contained between 18% and 47% carbonate minerals. As expected, the sediments from both the Krka and Pelješac study areas were high in carbonates. The sediment from the Krka fish farm contained between 81% and 98% carbonates, while the reference site on the Krka River had a similar range of carbonate minerals (88–96%). The marine sediment at the Pelješac reference site was consistently high in carbonates, similar to the sediment below the Pelješac fish farm (between 90% and 96%). The only exception is the sample PF collected in September 2017, with only 56% carbonate minerals (Table 4).
3.3. Mineral Composition
The presence of mineral phases varied among the study sites, but the mineral composition of sediments from fish farms and reference sites at each study site was quite similar (Table 5). The predominant mineral at the Ilova River site was quartz. Minerals from the mica group, dolomite, and plagioclase were also present, while clay minerals and calcite were present to a lesser extent.
The mineral composition of the Krka River site was unique throughout: carbonate minerals were predominant, with calcite and dolomite as the main minerals. Small amounts of quartz were also detected (Table 5).
Carbonate minerals were the main mineral phases found at the Pelješac study site. The predominant minerals were calcite and magnesian calcite, with aragonite also found in some sediment samples.
The intensity peak of aluminum was found in all samples and reflected the sample holder. Examples of diffractograms can be found in the Supplementary Materials, Figures S1–S6.
3.4. Organic Matter
The reference site on the Ilova River had a consistently slightly higher OM content compared to the Ilova fishpond (Table 6). The highest OM content was in November (6.84%) and the lowest in June (5.72%). Conversely, the highest OM content under Ilova fishpond was in June (4.55%) and the lowest in November (3.87%). In general, season-specific changes were small at both Ilova sites.
Seasonal OM dynamics were also low at both sites in the Krka study. In contrast to the Ilova fish farm, the Krka fish farm had a consistently higher OM percentage (~4%) compared to the Krka reference site (just over 1%) (Table 6).
The highest seasonal dynamics of OM content was recorded at the study site Pelješac. The highest OM content at the Pelješac site was recorded under the fish farm in February (11.49%), while the lowest was in November (2.85%). The reference site Pelješac had lower values in the warm season, while the percentage was higher in winter (Table 6).
3.5. Statistical Analysis
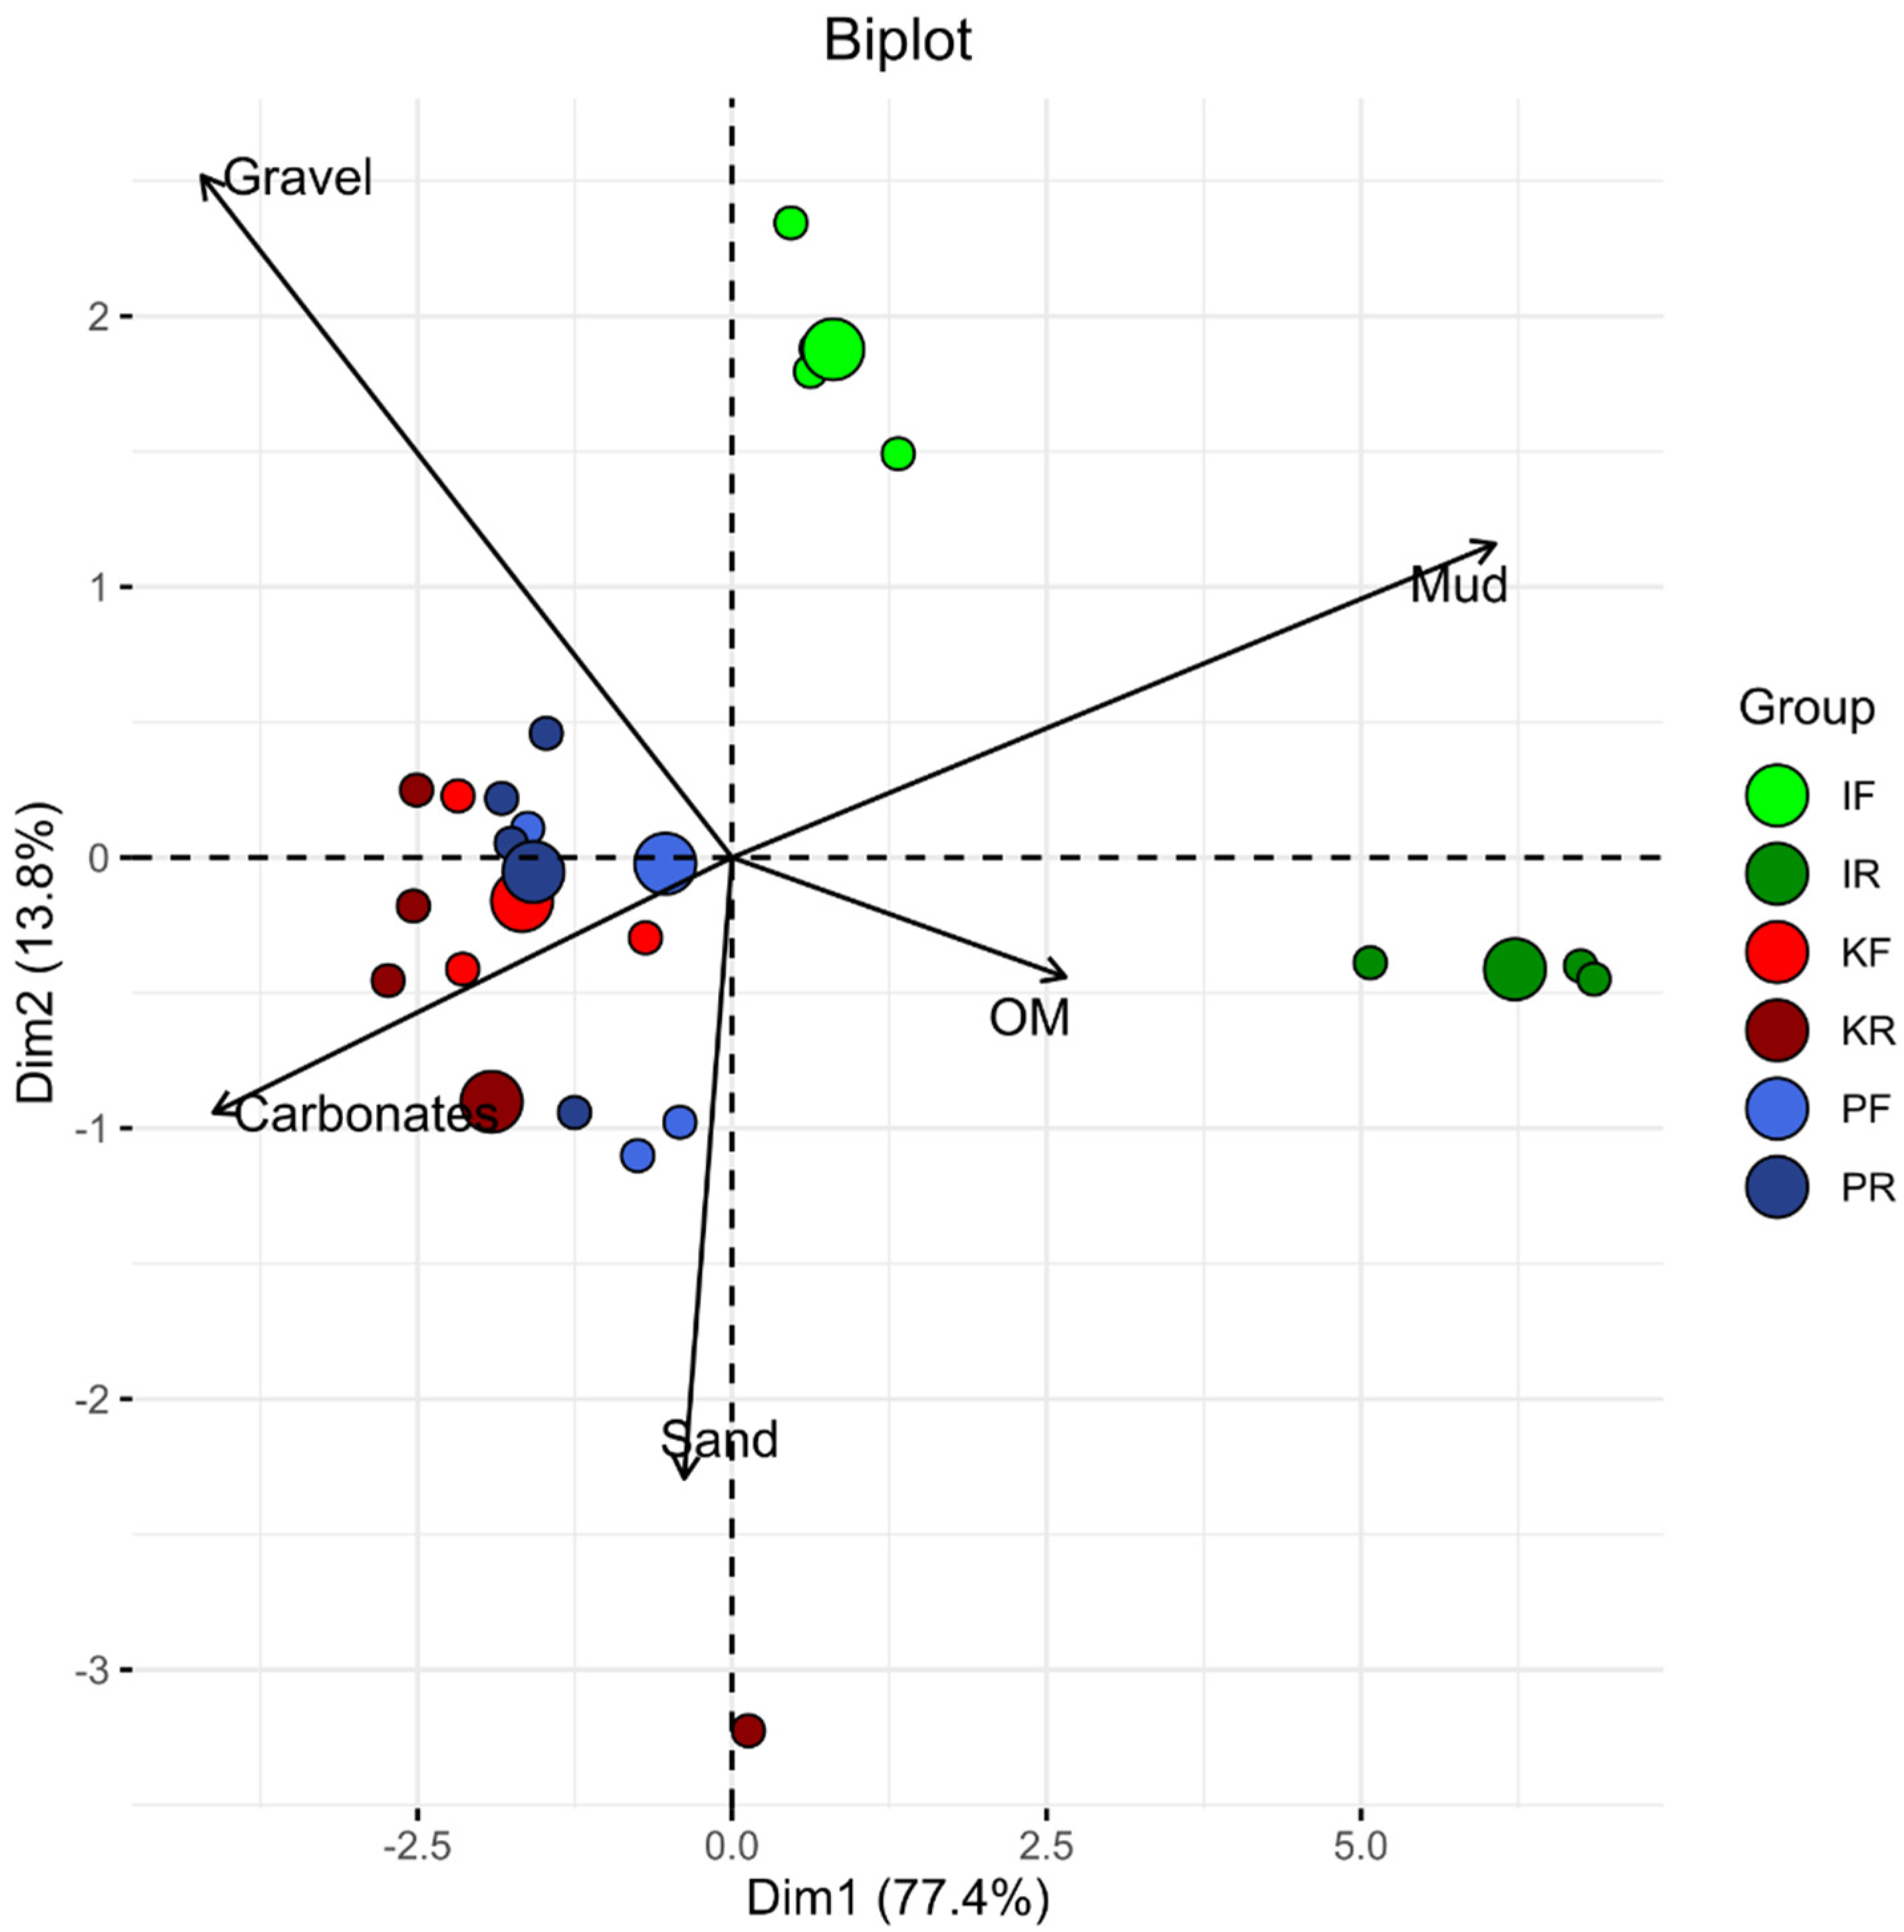
The results of the PCA are presented in the form of a biplot showing the variables and their relationship (Figure 5). The first two principal components, Dim1 and Dim 2, account for 77.7% and 13.8% of the variance in the plot data, respectively. In general, three main groups can be identified: The first includes the Krka River (red dots) and Pelješac sites (blue dots), both characterized by coarse sediments and high carbonate content. The second includes the Ilova fishpond (fluorescent green dots), which is somewhat distant from the third Ilova River assemblage (dark green dots) due to its gravel content. Based on the angles between the variable arrows, a positive correlation can be observed between mud and OM, while both are far from the other three variable arrows (gravel, sand, and carbonates).
4. Discussion
4.1. OM Content in Sediment
As reported in the Results Section, OM showed no seasonal dynamics in the sediment of the reference site on the Ilova River, nor in the Ilova fishpond. The Ilova River is a continental river with muddy sediments, much of which is transported as suspended load (Table 1; Figure 6a). It is known that OM is positively correlated with the distribution of fine-grained particles [44,45], and therefore a higher percentage of OM was expected in the bulk sediment. However, recently, it was shown that OM ranges from 0.5% to 10% in sediments of continental rivers in Croatia [46]. Moreover, the same authors showed that the Ilova River contained ~3% OM in sediment samples downstream from our site, which is half of the lower concentration determined in our study. However, it should be emphasized that the particle size distribution reported by the same authors was somewhat different, with a lower percentage of mud (~70%) compared to our study. Moreover, the same authors showed that the Ilova River contained a slightly higher percentage of OM in the fine-grained fraction than in the bulk sediment [46]. Therefore, it is obvious that particle size distribution plays a role in the percentage of OM, as expected: a higher OM is associated with a sediment containing more fine-grained particles. However, in the future, a different relationship should be considered: the distribution of silt and clay fractions in the mud and their mineral composition should be known to distinguish the effects of mineral composition on OM accumulation. It is known that the clay fraction usually contains a higher proportion of clay minerals than the silt fraction [46]. In both Ilova River and Ilova fishpond sediments, the clay fraction was less abundant compared to the silt fraction (detailed grain size data are available upon request). The OM content in the Ilova fishpond was slightly lower compared to the Ilova River reference station, which may be related to the generally coarser sediment, as mentioned above.
The results of OM content at the study site in the Krka River were as expected: the Krka fish farm showed slightly higher OM values compared to the reference site in the Krka River, while both sites showed low OM dynamics over one year (Table 6). The slightly higher OM content in the sediment of the Krka fish farm could be due to a generally lower water flow associated with the materials emitted from the fish farm, such as feces and uneaten food. Other upstream sources of OM are less likely, as the main source of water from the Krka River is a karst spring located about 300 m upstream from the Krka fish farm. However, the data presented in [46] show that further downstream, the values of OM reach 6.5% in the bulk sediment of the Krka River and >3% OM in fine sediment. Again, it should be noted that in the sediments analyzed by these authors, the mud represents >50% of the sample, with the fine-grained fraction containing less OM compared to the bulk sediment. This opposite trend compared to the Ilova River indicates a possible local input of organic material, probably in the form of flocculated sand-sized material partially removed during sand removal [46]. Even higher amounts (up to 10%) of OM in the sediment of the Krka River were also found in its downstream estuary, and the composition suggests that much of it may be of terrestrial origin [47]. An example of the proximity of terrestrial OM sources in the Krka River study area is shown in Figure 6b. However, further detailed OM characterization is needed to clarify the temporal and site-specific dynamics of OM.
Organic matter content ranged from 2.85% to 8.18% at both sites in the Pelješac study area (Table 6). These results are consistent with other studies in the central and southeastern Adriatic (0.55–8.72%) [48,49]. An exception is the result of the sample taken in February from PF with a content of 11.5% OM. In addition to the fish farm itself, there are other identified sources of OM near the study area. The first and probably the most influential is the vicinity of the mouth of the Neretva River (Figure 1) and its water plume in the area of the semi-closed channel [50]. The Neretva River is an allogenic coastal river, with the delta extending over the last 36 km of the river course. As a wetland, the delta itself is a natural source of organic material. In addition, the delta is an area of intensive agricultural use, combined with tourism and transportation activities. This anthropogenic load combined with natural features (high suspended sediment load from the upper reaches) affects the area of the Neretva Channel and the Malo More Bay [50], where our Pelješac study area is located (Figure 4). Due to its nivo-pluvial regime [33], its effects are expected in autumn and spring. The second cause is the proximity to other pollutant sources, such as domestic sewage outlets within the closed bay. A similar situation was observed in Spain [21]. As shown in Table 6, the seasonal dynamics of OM content in sediment samples from PF and PR is much higher compared to the two river study sites. Nevertheless, no discernible seasonal pattern could be identified during the monitoring period, and a longer monitoring period is recommended for future research.
4.2. OM in Relation to Carbonate Content, Grain Size, and Mineral Composition
4.2.1. Ilova River Site
The middle reaches of the Ilova River are surrounded by alluvial sediments deposited by the river itself, comprising a variety of sedimentary grains (gravels, sands, silts, and clays). The upstream part of the Ilova River basin is covered by loess deposits (Figure 2). The main mineral phase in this loess is quartz, sometimes in amounts of 70% [35,36]. The dominance of quartz is evident in both sampling sites, the Ilova River and the Ilova fishpond (Supplementary Materials, Figures S1 and S2), thus reflecting the mineral composition of the catchment. Part of the alluvial deposits of the Ilova basin drains the area of Plio-Quaternary clastic deposits, in which clay layers are found along with quartz. These clays are illite-kaolinite, montmorillonite-kaolinite-illite, and muscovite [35,36]. The clay minerals found in the Ilova River and Ilova fishpond sediment belong to the kaolin group, while muscovite represents the mica group (Table 5; Supplementary Materials, Figures S1 and S2), again showing that the mineral composition of the sediment from the two Ilova sampling sites reflects the lithology of the surrounding area.
The distinctive feature of the mineral composition found at the Ilova sampling sites is the group of carbonate minerals (Table 5; Supplementary Materials, Figures S1 and S2). Their occurrence in the Ilova River sediment was negligible or absent, while in the Ilova fishpond, about 20–45% of the sediment samples consisted of carbonates (Table 4). Although the Ilova River had ~6% of total carbonates in September, they were not identified in the diffractogram (Supplementary Materials, Figures S1 and S2), confirming their low proportion. On the other hand, dolomite and calcite were found in the Ilova fishpond, where dolomite was identified as one of the most abundant minerals (Table 5). Middle and Upper Triassic dolomitic deposits (dolomites and dolomitic limestones) occur at the Papuk Mountain, northeastern of the town of Daruvar (Figure 2) [51]. It is likely that these deposits are the source rocks of the detrital dolomite found in the Ilova fishpond. In particular, dolomitic limestones could form detrital dolomite as a result of selective dissolution of calcite and dolomite under subaerial weathering [52]. Several small tributaries of the Ilova River coming from the eastern slopes of the Papuk Mountain drain this dolomitic terrain and carry detrital dolomitic material directly to the Ilova fishpond area [51]. Such dolomite grains can have a variety of sizes and shapes [53]. As could be seen in the sediment samples collected during laboratory analyses at Ilova fishpond, the presence of the coarsest gravel particles can be directly associated with detrital dolomite. Earthen fishponds are aquatic environments where water flow is regulated by natural gravity and a weir system. In general, the flow energy of the water here is lower than in an open stream/river, which causes the fishpond to act as a sediment trap and prevent sediment runoff, especially the coarse-grained fraction. Therefore, the consistently higher carbonate content and increased gravel fraction in the Ilova fishpond could be the result of long-term accumulation of detrital dolomite. In contrast, the increased hydrodynamics in the Ilova River could ensure that such detrital grains are transported downstream, leaving behind predominantly muddy, carbonate-free sediment, especially at hydrodynamically protected sites where fine-grained sediment can settle (Figure 6a) and cohesively bind. The calcite in the traces identified at both Ilova sites could be derived from the surrounding loess (and other calcite-bearing deposits) or from autochthonous shell production within the pond, or a combination of both.
4.2.2. Krka River Site
Sediments sampled at both Krka River sites are strongly carbonaceous (81–96% carbonates) sedimentary materials dominated by calcite and dolomite (Table 5). This mineral composition is consistent with the environment: it is a karstic relief developed in Triassic dolomites, Lower Jurassic limestones and dolomites, and Middle Jurassic thick-bedded limestones and dolomites (Figure 3) [35,36]. Quartz was also found at both sampling sites, mostly as trace minerals (Table 5; Supplementary Materials, Figures S3 and S4). Its origin could be related to Holocene alluvial deposits or clastic deposits in the vicinity that contain quartz (Figure 3) [35,36]. Krka River sediments are coarse-grained sandy gravels and gravelly sands with mud content less than 10% (mostly less than 2%, Table 2). Based on these characteristics, it was expected that the content of OM would be low. This was true for the Krka River reference site, which consistently had low OM (1–1.5%) (Table 6). However, despite the same mineral composition and similar grain size characteristics, sediment collected at the Krka fish farm consistently contained OM levels slightly above 4% (Table 6), indicating an increased input of OM from the fish farm. Higher OM in sediment from the Krka fish farm could be due to insufficient water flow through the farm. As a karst river with the regime of the Dinaric pluvial-nival type, the discharge of the Krka River varies seasonally: the highest discharge occurs in spring and autumn, and the lowest in summer [54]. Despite the seasonal differences in discharge, there are no sea-specific dynamics of OM content at the two monitoring stations of the Krka River. Therefore, we suspect that the higher OM content at the Krka fish farm is not directly related to water flow, but to fish farm practices. The four times lower OM at the downstream reference site of the Krka River suggests only local effects on sediment quality within the fish farm. However, this hypothesis should be further investigated by introducing an additional upstream reference site.
4.2.3. Pelješac Site
Similar to the Krka River, sediment samples collected from both sites in the Pelješac study area were generally high in carbonates (~90–95%) and contained a mixture of calcite, magnesian calcite, and aragonite (Table 4 and Table 6). Such mineral composition indicates a considerable amount of biogenic skeletal remains (Figure 7), similar to other surface sediments along the Eastern Adriatic coast [41,55,56]. Detrital carbonates (litoclasts) and debris left after bioerosion of the carbonate rocks and bioconstruction are usually found in small amounts (Figure 7). Terrigenous minerals such as quartz and clay minerals were found only in trace amounts or not at all (Table 5; Supplementary Materials, Figures S5 and S6). The low input of terrigenous sediments is the result of the predominant carbonate lithology along the coast [55,56,57]. All sediment samples at the Pelješac site were classified as sands and gravels (Table 3). The high coarseness of the sediments is another typical feature of the Eastern Adriatic surface sediment cover, resulting from the original size of the shell and skeletal remains and the product of their fracturing [41,55,56].
The described textural sediment of the Pelješac study area is a typical coarse-grained biological carbonate surface sediment dominated by shell and skeletal remains found along most of the Eastern Adriatic coast [56]. As mentioned earlier (Section 4.1.), OM contents in the surface sediment of Pelješac are comparable to the contents at other sites along the Eastern Adriatic coast, both at fish farm sites and away from them [48,49]. Once biogenic inorganic remains were identified as dominant in the sediment, it was obvious that some (usually unquantified) amount of autochthonous organic remains of organisms remained in the inorganic skeletal remains. This was to be expected since the seafloor of the Eastern Adriatic is a marine environment with high species diversity. These organic remains were included in the calculation of OM during the loss on ignition analysis. Therefore, we assume that the variability of OM content without the obvious seasonal pattern is also due to the presence of living organisms in the biogenic sediment and should be considered in the future as an additional OM source besides the input from fish farms OM, the influence of the Neretva River, and the possible domestic sewage system. We believe that a longer monitoring period is needed to determine the pattern of OM seasonal variability, while more detailed chemical OM characterization (e.g., organic carbon and total nitrogen analyses, together with stable carbon and nitrogen isotope analyses, etc.) is recommended in the future as a tool to distinguish OM source and composition. A CHN elemental analysis is considered suitable for total OM and total N measurement [48,49]. Moreover, total N allows to determine the C/N ratio as a tool for distinguishing between marine and terrestrial organic matter. However, additional care has to be taken during measurements in carbonate-rich sediments [58].
Of all the sediment samples from the Pelješac study area, only one (PF, collected in September) differed from the other sediments in the group by a higher percentage of mud (>50%) and a lower carbonate content (~50%; Table 1 and Table 4). Considering the general positive correlation between mud content and OM content in various aquatic sediments [44,45], a higher OM content in this sample was expected. However, this sample contained only 4.37% of OM (Table 6). Similar results in terms of significant differences in the proportion of fine-grained particles and carbonate content have already been observed in other seafloor environments of the Eastern Adriatic Sea [56,59]. In places where shallower or deeper depressions are present on the seabed, the texture of the surface sediment can vary significantly. Even with short distances between the depressions and the rest of the seabed, depressions are places where fine-grained particles can settle [56]. This is confirmed by the fact that the calculated OM content in this finer sediment sample remained low, and clay minerals were hardly (if at all) present. The most important question to be answered is: which minerals occur and dominate in the mud fraction of the eastern Adriatic? According to [50,59], extremely muddy sediments collected in the Neretva Chanel (near our study area, Pelješac) had the following minerals, in decreasing order: quartz, calcite, dolomite, magnesian calcite, chlorite, muscovite, and plagioclase. The carbonate minerals are mainly of marine biogenic origin and derived from destructive diagenesis in situ [60]. Dolomite and a minor amount of calcite may be of detrital origin [56,57]. In addition, quartz and plagioclase are typical terrigenous minerals. All the listed minerals have a diluting effect on OM absorbers (e.g., clay minerals) in the mud fraction, and clay minerals are known to play the main role in the enrichment of OM sediments due to their physical and chemical properties [61,62,63]. Therefore, it can be concluded that the natural mineral composition of the mud fraction could play an important role in OM enrichment/reduction in a complex environment such as the Eastern Adriatic Sea. Hence, mud composition should be considered in environmental studies in the future.
4.2.4. Role of Mineral Composition and Grain Size at all Study Sites
All three studied sites are located in different climatic and environmental conditions and have different farming management practices in terms of water flow, water characteristics (marine or freshwater), and size of the management environment. Sediment from the Ilova River and Ilova fishpond contained the highest percentage of mud in the sediment. At both Ilova sampling sites, the OM content was classified as low (Table 6). However, a slightly lower OM content was found at the Ilova fishpond. It is likely that this result is due to the higher proportion of coarse carbonate particles, while the generally low OM percentage (compared to other study sites in this work and to literature data, e.g., [46]) in the case of the Ilova River may be due to the abundance of mineral phases other than clay minerals in the mud fraction (Supplementary Materials, Figures S4 and S5). At both Krka River sites, coarse-grained carbonate sediments (sand and gravel) and a very small amount of mud were found. In this case, grain size seems to be the main factor preventing accumulation of OM, and grain size is the result of the prevailing local carbonate lithology and the hydrodynamics of the river. Regardless of the coarseness of the sediment, the Krka fish farm OM had a comparable percentage to the two sites in the Ilova River and a higher percentage than the reference site in the Krka River, suggesting that the local impact of the fish farm may increase OM in the sediment. Future research should investigate the upper limit of OM content in the Krka fish farm during a longer monitoring period and under the same conditions. In the case of the Pelješac site, the natural coarseness and the predominant carbonate mineralogy of the sediment ensured a relatively low OM content, comparable to other fish farms along the eastern Adriatic and to the seabed, which was not affected by farming practices [48,49]. Nevertheless, the impact of other OM sources near the Pelješac site should be investigated in the future. In addition, for muddier sediments, the mineralogy of the sediments could play the main role in maintaining a relatively low OM load (Table 3 and Table 6). This is due to the presence of minerals (such as quartz, carbonates, feldspar, etc.) that have a diluting effect on clay minerals, which are naturally susceptible to OM adsorption.
Despite the short monitoring period and different environmental conditions at all study sites, PCA results indicated that, based on the group positions at an angle of 90° or more, coarse-grained carbonaceous sediments tended to collect less OM (Figure 5). The distant position between the groups of the two Ilova sites suggests that more than two processes/characteristics determine the distribution of OM in the sediments, or that one of them may play a leading role in the distribution of OM. The latter was recognized in the case of the Ilova fishpond, where a significantly higher gravel fraction was found compared to the Ilova River, while the bulk mineral composition was quite similar (Table 1, Figure 5; Supplementary Materials, Figures S1 and S2).
According to our preliminary results, both the coarseness of the sediment and the mineral composition can influence the OM content to a great extent. Depending on the lithology, water dynamics, or other environmental conditions, one property may be of greater importance.
In addition, the mineral composition of the mud fraction is an under-researched sediment property that should be considered in the future when selecting fish culture sites.
5. Conclusions
Sediment properties of three fish farms operating under different climatic and environmental conditions were studied to investigate the relationship between sediment properties and the content of OM. Sediment texture was found to be one of the major factors affecting the accumulation of OM in sediment. Coarse sediment accumulates lower amounts of OM, which directly reflects hydrodynamic conditions as well as natural suitability for conducting fish farm activities. For muddy sediments, mineral composition is another important sediment characteristic to consider when selecting the fish farm site. In particular, the mineral composition of the fine-grained fractions should be known before the site is selected for fish farming and when an environmental impact assessment is conducted for fish farms. According to the third objective of this study, the values of OM at the studied fish farm sites are comparable to the results of their reference sites, indicating an acceptable environmental health status. An exception to some extent is the Krka fish farm. It is located in a pristine headwater area of the karstic Krka River as a separate basin system, and the impacts of fish farming were largely confined to the farm itself during the monitoring period. However, further sediment studies at all sites (e.g., bacterial and infaunal community structure and functioning, detailed OM composition, etc.) are needed for a detailed assessment of impacts.
Supplementary Materials
The following are available online at https://www.mdpi.com/article/10.3390/min12060696/s1, Figure S1: Diffractogram (typical mineral composition) of IF sample collected in September: Ilt/Msc—illite/muscovite; Kln—kaolinite, Plg—plagioclase; Qtz—quartz; Cal—calcite; Dol—dolomite. Figure S2: Diffractogram (typical mineral composition) of IR sample collected in September: Ilt/Msc—illite/muscovite; Kln—kaolinite, Plg—plagioclase; Qtz—quartz. Figure S3: Diffractogram (typical mineral composition) of KF sample collected in September: Qtz—quartz: Cal—calcite, Dol—dolomite. Figure S4: Diffractogram (typical mineral composition) of KR sample collected in September: Qtz—quartz: Cal—calcite, Dol—dolomite; black dot—aluminum sample holder. Figure S5: Diffractogram (typical mineral composition) of PF sample collected in September: Cal—calcite; Mg-Cal—magnesian calcite; black dot—aluminum sample holder. Figure S6: Diffractogram (typical mineral composition) of PR sample collected in September: Cal—calcite; Arg—aragonite; Mg-Cal—magnesian calcite; black dot—aluminum sample holder.
Author Contributions
Conceptualization, K.P., D.K. and A.U.; writing—original draft preparation, K.P. and A.U.; investigation and fieldwork, D.K., A.K., A.G. and K.P.; sediment analyses, K.P., A.U. and D.K.; correlation analysis, K.P.; supervision, D.K.; project administration, D.K. All authors have read and agreed to the published version of the manuscript.
Funding
This research was supported by the project AQUAHEALTH (Aquatic microbial ecology as an indicator of the health status of the environment), funded by the Croatian Science Foundation (CSF IP-09-2014-3494).
Data Availability Statement
Not applicable.
Acknowledgments
The authors are grateful to Robert Košćal for the technical help during figures’ preparation, and Mavro Lučić, who helped us to clarify the PCA results. Anonymous reviewers are acknowledged for their useful comments that greatly improved the first version of our manuscript.
Conflicts of Interest
The authors declare no conflict of interest. The funders had no role in the design of the study; in the collection, analyses, or interpretation of data; in the writing of the manuscript, or in the decision to publish the results.
References
- FAO. Available online: http://www.fao.org/home/en/ (accessed on 11 November 2020).
- Bascuro, B. Mediterranean Aquaculture: Marine Fish Farming Development. Report. Available online: http://hdl.handle.net/1834/544 (accessed on 9 November 2020).
- Croatian Ministry of Agriculture. Available online: https://ribarstvo.mps.hr/default.aspx?id=14 (accessed on 11 November 2020).
- Kaiser, M.J.; Laing, I.; Utting, S.D.; Burnell, G.M. Environmental impacts of bivalve mariculture. J. Shellfish Res. 1998, 17, 59–66. [Google Scholar]
- Perez, O.M.; Telfer, T.C.; Ross, L.G. Geographical information systems-based models for offshore floating marine fish cage aquaculture site selection in Tenerife, Canary Islands. Aquac. Res. 2005, 36, 946–961. [Google Scholar] [CrossRef]
- Dapueto, G.; Massa, F.; Costa, S.; Cimoli, L.; Olivari, E.; Chiantore, M.; Federici, B.; Povero, P. A spatial multi-criteria evaluation for site selection of offshore marine fish farm in the Ligurian Sea, Italy. Ocean Coast. Manag. 2015, 116, 64–77. [Google Scholar] [CrossRef]
- Alvarado-Flores, C.; Encina-Montoya, F.; Tucca, F.; Vega-Aguayo, R.; Nimptsch, J.; Oberti, C.; Carmona, E.R.; Luders, C. Assessing the ecological risk of active principles used currently by freshwater fish farms. Sci. Total Environ. 2021, 775, 144716. [Google Scholar] [CrossRef]
- Hornick, K.M.; Buschmann, A.H. Insights into the diversity and metabolic function of bacterial communities in sediments from Chilean salmon aquaculture sites. Ann. Microbiol. 2018, 68, 63–77. [Google Scholar] [CrossRef]
- Quinones, R.A.; Fuentes, M.; Montes, R.M.; Soto, D.; Leon-Munoz, J. Environmental issues in Chilean salmon farming: A review. Rev. Aquac. 2019, 11, 375–402. [Google Scholar] [CrossRef]
- Kamjunke, N.; Nimptsch, J.; Harir, M.; Herzsprung, P.; Schmitt-Kopplin, P.; Neu, T.R.; Graeber, D.; Osorio, S.; Valenzuela, J.; Carlos Reyes, J.; et al. Land-based salmon aquacultures change the quality and bacterial degradation of riverine dissolved organic matter. Sci. Rep. 2017, 7, 43739. [Google Scholar] [CrossRef]
- Tett, P. Fish Farm Wastes in the Ecosystem. In Aquaculture in the Ecosystem; Holmer, M., Black, K., Duarte, C.M., Marbà, N., Karakassis, I., Eds.; Springer: New York, NY, USA, 2008; pp. 1–46. [Google Scholar]
- Giménez-Aguado, F.; Ruiz-Fernández, J.M. Influence of an experimental fish farm on the spatio-temporal dynamic of a Mediterranean maërl algae community. Mar. Environ. Res. 2012, 74, 47–55. [Google Scholar] [CrossRef]
- Brooks, K.M.; Mahnken, C.V.W. Interactions of Atlantic salmon in the Pacific northwest environment: II. Organic wastes. Fish. Res. 2003, 62, 255–293. [Google Scholar] [CrossRef]
- Karakassis, I.; Tsapakis, M.; Hatziyanni, E.; Papadopoulou, K.N.; Plaiti, W. Impact of cage farming of fish on the sea bed in three Mediterranean coastal areas. ICES J. Mar. Sci. 2000, 57, 1462–1471. [Google Scholar] [CrossRef] [Green Version]
- Serpa, D.; Duarte, P. Impacts of Aquaculture and Mitigation Measures. Dyn. Biochem. Process Biotechnol. Mol. Biol. 2008, 2, 1–20. [Google Scholar]
- Wu, R.S.S. The environmental impact of marine fish culture: Towards a sustainable future. Mar. Pollut. Bull. 1995, 31, 159–166. [Google Scholar] [CrossRef]
- Holmer, M.; Marbà, N.; Díaz-Almela, E.; Duarte, C.M.; Tsapakis, M.; Danovaro, R. Sedimentation of organic matter from fish farms in oligotrophic Mediterranean assessed through bulk and stable isotope (δδ13C and δ15N) analyses. Aquaculture 2007, 262, 268–280. [Google Scholar] [CrossRef] [Green Version]
- Dalsgaard, T.; Krause-Jensen, D. Monitoring nutrient release from fish farms with macroalgal and phytoplankton bioasays. Aquaculture 2006, 256, 302–310. [Google Scholar] [CrossRef]
- Tovar, T.; Moreno, C.; Mánuel-Vez, M.P.; Garcia-Vargas, M. Environmental implications of intensive marine aquaculture in earthen ponds. Mar. Pollut. Bull. 2000, 40, 981–988. [Google Scholar] [CrossRef]
- Tovar, A.; Moreno, C.; Manuel-Vez, M.; Garcia-Vargas, M. Environmental impacts of intensive aquaculture in marine waters. Water Res. 2000, 34, 334–342. [Google Scholar] [CrossRef]
- Giménez-Aguado, F.; García-García, B. Assessment of some chemical parameters in marine sediments exposed to offshore cage fish farming influence: A pilot study. Aquaculture 2004, 242, 283–296. [Google Scholar] [CrossRef]
- Sutherland, R.A. Loss-on-ignition estimates for organic matter and relationships to organic carbon in fluvial bed sediments. Hydrobiologia 1998, 389, 153–167. [Google Scholar] [CrossRef]
- Horowitz, A.J.A. Primer on Sediment-Trace Element Chemistry, 2nd ed.; Lewis Publishers: Chelsea, MI, USA, 1991; p. 136. [Google Scholar]
- Schorer, M. Pollutant and organic matter content in sediment particle size fractions. IAHS 1997, 243, 59–67. [Google Scholar]
- Evans, K.M.; Gill, R.A.; Robotham, P.W.J. The PAH and organic content of sediment particle size fractions. Water Air Soil Pollut. 1990, 51, 13–31. [Google Scholar] [CrossRef]
- Nordvarg, L.; Hakanson, L. Predicting the environmental response of fish farming in coastal areas of the Aland archipelago (Baltic Sea) using management models for coastal water planning. Aquaculture 2002, 206, 217–243. [Google Scholar] [CrossRef]
- Klaoudatos, S.D.; Klaoudatos, D.S.; Smith, J.; Bogdanos, K.; Papageorgiou, E. Assessment of site specific benthic impact of floating cage farming in the eastern Hios island, Eastern Aegean Sea, Greece. J. Exp. Mar. Biol. Ecol. 2006, 338, 96–111. [Google Scholar] [CrossRef]
- Burdige, D.J. Geochemistry of Marine Sediments; Princeton University Press: Princeton, NJ, USA, 2006; p. 609. [Google Scholar]
- Kalantzi, I.; Karakassis, I. Benthic impacts of fish farming: Meta-analysis of community and geochemical data. Mar. Pollut. Bull. 2006, 52, 484–493. [Google Scholar] [CrossRef] [PubMed]
- Rodríguez-Gallego, L.; Meerhoff, E.; Poersch, L.; Aubriot, L.; Fagetti, C.; Vitancurt, J.; Conde, D. Establishing limits to aquaculture in a protected coastal lagoon: Impact of Farfantepenaeus paulensis pens on water quality, sediment and benthic biota. Aquaculture 2008, 277, 30–38. [Google Scholar] [CrossRef]
- Apostolaki, E.T.; Tsagaraki, T.; Tsapakis, M.; Karakassis, I. Fish farming impact on sediments and macrofauna associated with seagrass meadows in the Mediterranean. Estuar. Coast Shelf Sci. 2007, 75, 408–416. [Google Scholar] [CrossRef]
- Official Gazette of the Republic of Croatia No 106/2018. Available online: https://narodne-novine.nn.hr/clanci/sluzbeni/2018_11_106_2070.html (accessed on 23 September 2020).
- Zaninović, K.; Gajić-Čapka, M.; Perčec Tadić, M.; Vučetić, M.; Milković, J.; Bajić, A.; Cindrić, K.; Cvitan, L.; Katušin, Z.; Kaučić, D.; et al. Climate Atlas of Croatia 1961–1990, 1971–2000; Croatian Meteorological and Hydrological Service: Zagreb, Croatia, 2008; p. 141. [Google Scholar]
- EUROSTAT. Available online: https://ec.europa.eu/eurostat/web/degree-of-urbanisation/background (accessed on 15 January 2022).
- CGS. Geological Map of Republic of Croatia, M 1:300000; Croatian Geological Institute: Zagreb, Croatia, 2009. [Google Scholar]
- Velić, I.; Vlahović, I. Geological Map Interpreter M 1:300000; Croatian Geological Institute: Zagreb, Croatia, 2009; p. 141. [Google Scholar]
- Micromeritics SediGraph 5100 Particle Size Analysis System Operator’ Manual; Micromeritics Instrument Corporation: Norcross, GA, USA, 2002; Available online: https://www.micromeritics.com/pdf/products/sedigraph_5100_brochure.pdf (accessed on 4 December 2020).
- Blott, S.J.; Pye, K. GRADISTAT: A grain size distribution and statistics package for the analysis of unconsolidated sediments. Earth Surf. Process. Landf. 2001, 26, 1237–1248. [Google Scholar] [CrossRef]
- Folk, R.L. The distinction between grain size and mineral composition in sedimentary rock nomenclature. J. Geol. 1954, 62, 344–359. [Google Scholar] [CrossRef]
- Folk, R.L.; Ward, W.C. Brazos river bar: A study in the significance of grain size parameters. J. Sediment. Petrol. 1957, 27, 3–26. [Google Scholar] [CrossRef]
- Puhr, K.; Pikelj, K. The effect of in situ shading on a Posidonia oceanica meadow situated within a fish farm induced moderately nutrient enriched environment. Mar. Pollut. Bull. 2012, 64, 1537–1548. [Google Scholar] [CrossRef]
- Puhr, K.; Pikelj, K.; Fiket, Ž. Can multiple fish farms be integrated within a semi-enclosed bay without causing acute ecosystem degradation? Oceanologia 2017, 59, 318–330. [Google Scholar] [CrossRef] [Green Version]
- Heiri, O.; Lotter, A.F.; Lemcke, G. Loss on ignition as a method for estimating organic and carbonate content in sediments: Reproducibility and comparability of results. J. Paleolimnol. 2001, 25, 101–110. [Google Scholar] [CrossRef]
- Rashid, M.A.; Reinson, G.E. Organic matter in surficial sediments of the Miramichi Estuary, New Brunswick, Canada. Estuar. Coast. Mar. Sci. 1979, 8, 23–36. [Google Scholar] [CrossRef]
- Hossain, M.B.; Marshall, D.J.; Venkatramanan, S. Sediment granulometry and organic matter content in the intertidal zone of the Sungai Brunei estuarine system, northwest coast of Borneo. Carpath. J. Earth Environ. Sci. 2014, 9, 231–239. [Google Scholar]
- Vdović, N.; Lučić, M.; Mikac, N.; Bačić, N. Partitioning of Metal Contaminants between Bulk and Fine-Grained Fraction in Freshwater Sediments: A Critical Appraisal. Minerals 2021, 11, 603. [Google Scholar] [CrossRef]
- Hadžija, O.; Juračić, M.; Luić, M.; Tonković, M.; Jeričević, B. The carbohydrates in relation to mineralogic and granulometric composition of surface sediments in the karst estuary (River Krka Estuary, Yugoslavia). Estuar. Coast. Shelf Sci. 1985, 21, 701–709. [Google Scholar] [CrossRef]
- Matijević, S.; Kušpilić, G.; Kljaković-Gašpić, Z.; Bogner, D. Impact of fish farming on the distribution of phosphorus in sediments in the middle Adriatic area. Mar. Pollut. Bull. 2008, 56, 535–548. [Google Scholar] [CrossRef]
- Matijević, S.; Bogner, D.; Morović, M.; Tičina, V.; Grbec, B. Characteristics of the Sediment Along the Eastern Adriatic Coast (Croatia). Fresenius Environ. Bull. 2008, 17, 1763–1772. [Google Scholar]
- Jurina, I.; Ivanić, M.; Vdović, N.; Troskot-Čorbić, T.; Lojen, S.; Mikac, N.; Sondi, I. Deposition of trace metals in sediments of the deltaic plain and adjacent coastal area (the Neretva River, Adriatic Sea). J. Geochem. Explor. 2015, 157, 120–131. [Google Scholar] [CrossRef]
- Jamičić, D. Geological Map of Republic of Croatia, M 1:100000 Daruvar Sheet L33-95; Geološki Zavod: Zagreb, Croatia; Savezni Geološki Institut: Belgrade, Serbia, 1989. [Google Scholar]
- Lyday, J.R. Atokan (Pennsylvanian) Berlin Field: Genesis of Recycled Detrital Dolomite Reservoir, Deep Anadarko Basin, Oklahoma. Am. Assoc. Pet. Geol. Bull. 1985, 69, 1931–1949. [Google Scholar]
- Radwan, O.; Bu Khamsin, A.; Al-Ramadan, K. Detrital dolomite: Characterization and characteristics. Geol. Q. 2018, 62, 81–89. [Google Scholar] [CrossRef] [Green Version]
- Krka River National Park. Available online: http://np-krka.hr (accessed on 27 January 2021).
- Pikelj, K.; Žigić, V.; Juračić, M. Origin and distribution of surface sediments in the Grgur Channel, Adriatic Sea, Croatia. Geol. Croat. 2009, 62, 95–105. [Google Scholar] [CrossRef]
- Pikelj, K. Composition and Origin of Seabed Sediments of the Eastern Part of the Adriatic Sea. Ph.D. Thesis, University of Zagreb, Zagreb, Croatia, 29 June 2010. (In Croatian). [Google Scholar]
- Pikelj, K.; Juračić, M. Eastern Adriatic Coast (EAC): Geomorphology and coastal vulnerability of a karstic coast. J. Coast. Res. 2013, 29, 944–957. [Google Scholar] [CrossRef]
- Phillips, S.C.; Johnson, J.E.; Miranda, E.; Disenhof, C. Improving CHN measurements in carbonate-rich marine sediments. Limnol. Oceanogr. Methods 2011, 9, 194–203. [Google Scholar] [CrossRef]
- Pikelj, K.; Jakšić, L.; Aščić, Š.; Juračić, M. Characterization of the fine-grained fraction in the surface sediment of the eastern Adriatic channel areas. Acta Adriat. 2016, 57, 195–208. [Google Scholar]
- Nelson, C.S.; James, N.P. Marine cements in mid-Tertiary cool-water shelf limestones of New Zealand and southern Australia. Sedimentology 2000, 47, 609–629. [Google Scholar] [CrossRef]
- Vdović, N.; Juračić, M. Sedimentological and surface characteristics of the Northern and Central Adriatic sediments. Geol. Croat. 1993, 46, 157–163. [Google Scholar]
- Aloupi, M.; Angelidis, M.O. Normalization to lithium for the assessment of metal contamination in coastal sediment cores from the Aegean Sea, Greece. Mar. Environ. Res. 2001, 52, 1–12. [Google Scholar] [CrossRef]
- Rubio, B.; Nombela, M.A.; Vilas, F. Geochemistry of major and trace elements in sediments of the Ria de Vigo (NW Spain): An assessment of metal pollution. Mar. Pollut. Bull. 2000, 44, 968–980. [Google Scholar] [CrossRef]
Figure 1.
Locations of aquaculture sites: (A) Ilova River site, (B) Krka River site, and (C) Pelješac site. (A–C) Squares are matching Figure 2a, Figure 3a and Figure 4a, respectively. Note that Neretva River is the only river near the Pelješac study site (C).
Figure 1.
Locations of aquaculture sites: (A) Ilova River site, (B) Krka River site, and (C) Pelješac site. (A–C) Squares are matching Figure 2a, Figure 3a and Figure 4a, respectively. Note that Neretva River is the only river near the Pelješac study site (C).

Figure 2.
(A) Geological map of the Ilova River study site: 47—Miocene limestone-clastic complex; 48—Miocene clastites; 52—Plio-Quaternary clastic deposits; 54a—Pleistocene loess; 58b—Holocene alluvial deposits; blue lines—streams and rivers; blue areas—fishponds; red lines—main faults; thin brown lines—isohipses (after [35,36]). Red/yellow dots represent sampling locations. (B) Topographic map of the Ilova study site wider area. Red/yellow dots represent sampling locations. The altitude of the Ilova site is 108 m above the sea. Maximal altitude here is 640 m, near Donji Borki. (C) Location of the Ilova River and the Ilova fishpond sampling sites (after Google Earth). Red and yellow dots represent sampling locations. (D) Ilova fishpond with exact sampling location (yellow arrow; red arrow indicates sampling point in the Ilova River).

Figure 3.
(A) Geological map of the Krka River study site: 13a—Permian evaporites and clastites; 14—Triassic clastites; 15—Triassic carbonates; 16—Triassic clastic and pyroclastic deposits; 20—Triassic dolomites; 21–24—Jurassic limestones and dolomites; 32—Cretaceous limestones and dolomites; 34—Cretaceous limestones; 39—Paleocene-Eocene limestones; 41—Eocene-Oligocene carbonate deposits; 57b—Holocene lake deposits; 58a—Holocene alluvial deposits; blue lines—streams and rivers; red lines—main faults; thin brown lines—isohipses (after [35,36]). Red-black dot represents sampling locations. (B) Topographic map of the Krka River study site wider area. Red-black dot represents sampling locations. The altitude of the Krka River site is 220 m above the sea. Maximal altitude here is 800 to the east. (C) Location of the Krka River and the Krka fish farm sampling sites (after Google Earth). Red and yellow dots represent sampling locations. (D) Krka fish farm with concrete basins. The right-most basin shown is a sedimentation tank.

Figure 4.
(A) Geological map of the Pelješac study site: 20—Triassic dolomites; 21–23—Jurassic limestones and dolomites; 32—Cretaceous limestones and dolomites; 34—Cretaceous limestones; 39—Paleocene-Eocene limestones; 40—Eocene-Oligocene carbonate deposits; blue lines—streams and rivers; blue areas—coastal lakes; red lines—main faults; dotted red line—border; thin brown lines—isohipses (after [35,36]). Red and yellow dots represent sampling locations. (B) Topographic map of the Pelješac study site wider area. Red and yellow dots represent sampling locations. (C) Location of the Pelješac fish farm and the Pelješac reference site (after Google Earth). Red and yellow dots represent sampling locations. (D) Pelješac sampling sites near carbonate islands. Yellow arrow points to fish farm cages; red arrow points to reference site.

Figure 5.
Principal component analysis (PCA) biplot of the first two PCs. The larger circles represent the geometric mean of the data within each group.
Figure 5.
Principal component analysis (PCA) biplot of the first two PCs. The larger circles represent the geometric mean of the data within each group.

Figure 6.
Sampling reference station at studied rivers: (a) high amount of suspended matter as one of the noticeable features of the Ilova River regardless of the season. (b) Clear karstic water of the Krka River in its upper course. Coarseness of the sediment was visible even from the position the photograph was taken from.

Figure 7.
Domination of skeletal debris followed by carbonate litoclasts in a randomly subsampled PR sample collected in September. Coin is 2.4 cm in diameter.
Figure 7.
Domination of skeletal debris followed by carbonate litoclasts in a randomly subsampled PR sample collected in September. Coin is 2.4 cm in diameter.


Table 1.
Summarized grain size data for Ilova fishpond (IF) and Ilova River reference site (IR).
| Sample | Date | Gravel (%) | Sand (%) | Mud (%) | Texture | Md (mm) | Mz (mm) | So (ϕ) |
|---|---|---|---|---|---|---|---|---|
| IF | Feb 2016 | NS | NS | NS | NS | NS | NS | NS |
| IF | Jun 2016 | 61.8 | 10.6 | 27.6 | mG | 4.39 | 0.63 | 4.33 |
| IF | Sep 2016 | 22.5 | 19 | 58.5 | gM | 0.03 | 0.06 | 4.85 |
| IF | Nov 2016 | 39.2 | 15.3 | 51.8 | mG | 0.24 | 0.17 | 4.61 |
| IR | Feb 2016 | NS | NS | NS | NS | NS | NS | NS |
| IR | Jun 2016 | 0 | 13.1 | 86.9 | sM | 0.006 | 0.007 | 2.71 |
| IR | Sep 2016 | 0 | 2.2 | 97.8 | M | 0.003 | 0.008 | 2.13 |
| IR | Nov 2016 | 0 | 12.4 | 87.6 | sM | 0.005 | 0.008 | 2.7 |
Md—median; Mz—mean size; So—sorting; NS—not sampled.
Table 2.
Summarized grain size data for Krka fish farm (KF) and Krka River reference site (KR).
| Sample | Date | Gravel (%) | Sand (%) | Mud (%) | Texture | Md (mm) | Mz (mm) | So (ϕ) |
|---|---|---|---|---|---|---|---|---|
| KF | Feb 2017 | NS | NS | NS | NS | NS | NS | NS |
| KF | Jun 2017 | 21.2 | 70.1 | 8.7 | gmS | 1.09 | 0.81 | 2,03 |
| KF | Sep 2017 | 35.8 | 62.8 | 1.4 | sG | 0.43 | 0.76 | 2.13 |
| KF | Nov 2017 | 56.7 | 41.6 | 1.7 | sG | 4.32 | 1.75 | 2.16 |
| KR | Feb 2017 | 0.5 | 96.4 | 3.1 | (g)S | 0.19 | 0.20 | 0.77 |
| KR | Jun 2017 | 32.8 | 66.2 | 1 | sG | 0.55 | 0.91 | 1.90 |
| KR | Sep 2017 | 54.1 | 44.2 | 1.7 | sG | 2.46 | 1.74 | 1.84 |
| KR | Nov 2017 | 40 | 58.5 | 1.4 | sG | 1.06 | 1.16 | 1.91 |
Md—median; Mz—mean size; So—sorting; NS—not sampled.
Table 3.
Summarized grain size data for Pelješac fish farm (PF) and Pelješac reference site (PR).
| Sample | Date | Gravel (%) | Sand (%) | Mud (%) | Texture | Md (mm) | Mz (mm) | So (ϕ) |
|---|---|---|---|---|---|---|---|---|
| PF | Feb 2017 | 12.6 | 81.6 | 5.8 | (g)S | 0.73 | 0.64 | 1.73 |
| PF | Jun 2017 | 9.7 | 85.6 | 4.8 | (g)S | 0.59 | 0.57 | 1.63 |
| PF | Sep 2017 | 35.9 | 10.9 | 53.1 | mG | 0.02 | 0.05 | 5.16 |
| PF | Nov 2017 | 41 | 55 | 4 | sG | 1.54 | 1.48 | 1.7 |
| PR | Feb 2017 | 56 | 39.7 | 4.3 | sG | 2.54 | 2.1 | 1.69 |
| PR | Jun 2017 | 50.2 | 46.8 | 3 | sG | 2.02 | 1.7 | 1.82 |
| PR | Sep 2017 | 14.2 | 82.6 | 3.2 | (g)S | 0.74 | 0.73 | 1.47 |
| PR | Nov 2017 | 50.3 | 47.4 | 2.3 | sG | 2.04 | 1.93 | 1.58 |
Md—median; Mz—mean size; So—sorting.
Table 4.
Summarized carbonate content in sediment samples from all studied locations and all sampled seasons.
Table 4.
Summarized carbonate content in sediment samples from all studied locations and all sampled seasons.
| Sample | Date | Carbonates (%) | Sample | Date | Carbonates (%) |
|---|---|---|---|---|---|
| IF | Feb 2016 | NS | IR | Feb 2016 | NS |
| IF | Jun 2016 | 18.53 | IR | Jun 2016 | 0 |
| IF | Sep 2016 | 23.03 | IR | Sep 2016 | 6.17 |
| IF | Nov 2016 | 46.57 | IR | Nov 2016 | 0 |
| KF | Feb 2017 | NS | KR | Feb 2017 | 95.32 |
| KF | Jun 2017 | 97.33 | KR | Jun 2017 | 88.68 |
| KF | Sep 2017 | 87.57 | KR | Sep 2017 | 90.98 |
| KF | Nov 2017 | 81.65 | KR | Nov 2017 | 91.7 |
| PF | Feb 2017 | 95.2 | PR | Feb 2017 | 92.17 |
| PF | Jun 2017 | 92.9 | PR | Jun 2017 | 95.47 |
| PF | Sep 2017 | 56.33 | PR | Sep 2017 | 95.33 |
| PF | Nov 2017 | 94.52 | PR | Nov 2017 | 90.2 |
NS—not sampled.
Table 5.
Summarized mineral composition for all study sites and both fish farms and reference sites. Selected diffractograms are presented in the Supplementary Materials, Figures S1–S6.
Table 5.
Summarized mineral composition for all study sites and both fish farms and reference sites. Selected diffractograms are presented in the Supplementary Materials, Figures S1–S6.
| Study Site | Quartz | Calcite | Mg-Calcite | Dolomite | Aragonite | Plagioclase | Mica | Clay Minerals |
|---|---|---|---|---|---|---|---|---|
| Ilova | +++ | (+) | - | + | - | ++ | ++ | + |
| Krka | (+) | +++ | - | +++ | - | - | - | - |
| Pelješac | (+) | +++ | +++ | (+) | ++ | - | - | - |
Semiquantitative analysis: +++ very abundant (>30%); ++ abundant (10–30%); + fairly abundant (5–10%); (+) detected (<2%); - not detected.
Table 6.
Summarized OM content in sediment samples from all studied locations and all sampled seasons.
Table 6.
Summarized OM content in sediment samples from all studied locations and all sampled seasons.
| Sample | Date | OM (%) | Sample | Date | OM (%) |
|---|---|---|---|---|---|
| IF | Feb 2016 | NS | IR | Feb 2016 | NS |
| IF | Jun 2016 | 4.55 | IR | Jun 2016 | 5.72 |
| IF | Sep 2016 | 4.32 | IR | Sep 2016 | 6.55 |
| IF | Nov 2016 | 3.87 | IR | Nov 2016 | 6.84 |
| KF | Feb 2017 | NS | KR | Feb 2017 | 1.8 |
| KF | Jun 2017 | 4.19 | KR | Jun 2017 | 1.08 |
| KF | Sep 2017 | 4.07 | KR | Sep 2017 | 1.49 |
| KF | Nov 2017 | 4.05 | KR | Nov 2017 | 1.39 |
| PF | Feb 2017 | 11.46 | PR | Feb 2017 | 5.96 |
| PF | Jun 2017 | 3.67 | PR | Jun 2017 | 3.77 |
| PF | Sep 2017 | 4.73 | PR | Sep 2017 | 3.28 |
| PF | Nov 2017 | 2.85 | PR | Nov 2017 | 8.18 |
NS—not sampled.
Publisher’s Note: MDPI stays neutral with regard to jurisdictional claims in published maps and institutional affiliations. |
© 2022 by the authors. Licensee MDPI, Basel, Switzerland. This article is an open access article distributed under the terms and conditions of the Creative Commons Attribution (CC BY) license (https://creativecommons.org/licenses/by/4.0/).
Share and Cite
MDPI and ACS Style
Pikelj, K.; Uroš, A.; Kolda, A.; Gavrilović, A.; Kapetanović, D. Sediment Characteristics—A Key Factor for Fish Farm Site Selection: Examples from Croatia. Minerals 2022, 12, 696. https://doi.org/10.3390/min12060696
AMA Style
Pikelj K, Uroš A, Kolda A, Gavrilović A, Kapetanović D. Sediment Characteristics—A Key Factor for Fish Farm Site Selection: Examples from Croatia. Minerals. 2022; 12(6):696. https://doi.org/10.3390/min12060696
Chicago/Turabian StylePikelj, Kristina, Anita Uroš, Anamarija Kolda, Ana Gavrilović, and Damir Kapetanović. 2022. "Sediment Characteristics—A Key Factor for Fish Farm Site Selection: Examples from Croatia" Minerals 12, no. 6: 696. https://doi.org/10.3390/min12060696
Note that from the first issue of 2016, this journal uses article numbers instead of page numbers. See further details here.