
Methodology for Consequence Analysis of Future Mobility Scenarios: The SPROUT Framework


1
Centre for Research and Technology Hellas, Hellenic Institute of Transport, 57001 Thessaloniki, Greece
2
Fundación Zaragoza Logistics Center (ZLC), 50018 Zaragoza, Spain
3
MOBI Mobility, Logistics and Automotive Technology Research Centre, Department BUTO, Vrije Universiteit Brussel, 1050 Brussels, Belgium
4
Dipartimento di Culture del Progetto, Università IUAV di Venezia, 30135 Venezia, Italy
*
Author to whom correspondence should be addressed.
Future Transp. 2022, 2(2), 453-466; https://doi.org/10.3390/futuretransp2020025
Submission received: 11 March 2022
/
Revised: 26 April 2022
/
Accepted: 10 May 2022
/
Published: 18 May 2022
(This article belongs to the Special Issue Future Mobility and Transport Applications)
Abstract
:The various social, political, environmental, and economical mega-trends together with the rapid rise of digitalization are shaping cities worldwide including the way that citizens and products move within the urban environment. New mobility services are popping up which are showing the path toward more on-demand and personalized mobility patterns. The transformation of the urban mobility environment though constitutes a great challenge for policy-makers, as little is known about the impact of these trends on the city’s current mobility environment while the assessment of the future state of a mobility system can be considered a quite complex process taken its multi-parametric and multi-dimensional nature. This paper aims to simplify this process by presenting a coherent multi-actor consequence analysis framework as a tool for assessing future mobility scenarios which was developed in the framework of the H2020 SPROUT. This paper presents in detail the main components of this framework together with the list of key performance indicators used for assessing the performance in terms of sustainability of future mobility scenarios as well as indicative results from its use by the city of Padua.
1. Introduction
The urban mobility environment is constantly changing. According to the United Nations, within the next 30 years almost 68% of the world population is expected to be concentrated in cities worldwide, while in Europe, almost one to three cities expect a 10% increase in their population by 2050 [1,2]. This escalating rate of worldwide urbanization and the concentration of more and more people to cities, project significant economic and social transformations to the urban environment which together with the rapid rise of digitalization are shaping cities worldwide including the way that citizens and products move within the urban environment [3,4]. New mobility services and business models are popping up which, together with the inclusion of new technologies, are showing the path toward more on-demand and personalized mobility patterns and are changing the landscape of urban transport services.
The transformation of the urban mobility environment though constitutes a great challenge for policy-makers, as little is known about how much cities will be affected by these trends and new-coming services, as well as what will be the expected impacts on the city’s current mobility environment. The SPROUT project, funded by the European Commission HORIZON 2020 programme, aims to fill in this gap by providing a new city-led, innovative, and data-driven policy response to address the impacts of emerging mobility patterns, digitally enabled operating and business models, and transport users’ needs. Starting from the understanding of the transition taking place in five European cities (Valencia, Padua, Kalisz, Budapest and Tel Aviv), future “do nothing” mobility scenarios have been created for 2030 and assessed based on the three main sustainability dimensions: Economy, Environment, and Society. To assess the sustainability impacts of each future mobility scenario, a coherent multi-actor consequence analysis framework has been developed as the ground basis of the impact assessment process. The SPROUT consequence analysis framework consists of three main hierarchical level. The first level refers to the three sustainability dimensions. Each sustainability dimension is further expressed in consequence areas (2nd hierarchical level). In total 11 consequence areas have been identified where 5 of these are aligned to the Economy, 6 of these to the Environment, and the other 3 to the sustainability dimension of Society. Indicative examples of these consequence areas are: The urban transport service structure; urban transport service volumes; urban space allocation; climate change; safety, accessibility etc. In the third and last hierarchical level, each of these consequence areas is further expressed in a number of performance metrics (consequence indicators). Following the building of the framework survey, questionnaires were developed and circulated to each SPROUT city’s local ecosystem (i.e., stakeholders) for assessing their future mobility scenarios.
This paper presents in detail the main components of this framework and the process followed for identifying the future mobility state of the five SPROUT cities while the last chapter presents the outcomes from the implementation of this framework to the case of Padua.
2. Methodology and Scope
The main scope of SPROUT project is to provide a new city-led innovative and data-driven policy response to address the impacts of the emerging mobility patterns, digitally-enabled operating and business models and transport user needs. The ground basis for formulating an appropriate city-led innovative policy response to navigate urban mobility in transition is to gain a clear understanding of the transition taking place in urban mobility and thus foreseeing and determining the impact of urban mobility drivers on urban policy. Toward this direction, city-specific “do-nothing” scenarios have been created describing the possible development of the urban mobility system in five European cities: Valencia, Padua, Kalisz, Budapest, and Tel Aviv by taking into consideration that no policies are introduced to harness transition. A mobility scenario can be defined as the presentation of a possible future state of an urban mobility environment [5] by highlighting the central elements of a possible future as well as the key drivers that affect the future developments [6], while the term driver refers to the main factors that are most likely to influence the transition from the current to the future state in a city. Taking this into consideration, within H2020 SPROUT project and prior to the scenarios building, a set of urban mobility transition drivers has been identified and reported which are concentrated in six main thematic areas: Political drivers i.e., liberalization, transparency, tax policy; Economic drivers i.e., tourism, new business models, economic growth and crisis; Social drivers i.e., migration, urban structure, safety concerns; Technological drivers i.e., electrification, automation, adoption of smart–city technology; Environmental drivers i.e., climate change and local environmental quality and Legal drivers i.e., labor and employment laws, data and privacy laws etc., [7]. Taken this set of drivers, each of the four examined European cities selected these that affect mostly their urban mobility environment and based on this selection three distinctive future “do nothing” mobility scenarios were generated for each city illustrating how the cities’ mobility state will look in the future in terms of how and at what level each of the selected urban mobility transition drivers will affect each city [8].
For gaining a clear understanding of the transition taking place in urban mobility and identifying the sustainability impact of this change to the urban environment, an in-depth analysis of the economic, environmental, and societal consequences of each future mobility scenario was crucial to be implemented. According to the [9] World of Council for Sustainability Mobility (2001), sustainability in urban mobility refers to the ability of the mobility system to “meet the needs of society to move freely, gain access, communicate, trade and establish relationships without sacrificing other essential human or ecological values today or in the future”. However, assessing the future or the current state of a mobility system can be considered a quite complex process taken the multi-parametric and multi-dimensional nature of its system [10]. This is why in any assessment process, indicators are used as main simplifiers, providing either quantitative or qualitative information on the scope of each study [3].
Taking this into consideration and for simplifying the sustainability impact assessment process by the cities, a consequence analysis framework has been developed. The consequence analysis is a qualitative process of examining the possible positive or negative effects of a planned activity or a potential incident, independent of frequency or probability. Simply stated, consequence analysis applied in future mobility scenarios refers to identifying the future problems of an urban mobility system by taking into consideration their consequences [11] (Licata, 1978). In order for this to be implemented, a four-step methodological process was followed (Figure 1):
- Identification of the urban mobility elements or else called “consequence areas” that could be affected following any change in any sustainability area of the current urban mobility environment, meaning the Economy, the Environment, and the Society. For the implementation of this step, extensive literature review through different types of publications has been implemented (i.e., journal and conference articles, research reports and official policy documents and EU communications).
- Definition of the possible measurable consequence indicators for assessing the different aspects within each consequence area identified. For the implementation of this step, extensive literature review through mainly scientific publications has been implemented.
- Implementation of expert’s focus groups and prioritization techniques for identifying the most crucial consequences for the five European cities.
- Development of the “Continuum of Performance” for each consequence indicator and finalizing a customized online questionnaire per each city and per each future mobility scenario. For the implementation of this step, extensive literature review through multiple sources was carried out: scientific publications, websites, research reports etc.
Following this process, dedicated surveys were circulated to each city’s local ecosystem. Due to the COVID-19 pandemic, the surveys were distributed either electronically to each stakeholder separately or the cities implemented a virtual workshop where a consensus among the stakeholders has been reached. Following this process, the data were collected and analyzed per each city and per each mobility scenario. The outcomes of this process will be a subject of another publication.
3. Results
3.1. Building the Conceptual Assessment Framework of SPROUT’s Future Mobility Scenarios
3.1.1. Identification of the Main Consequence Areas and Correspondent Consequence Indicators
The performance of a mobility system depends directly on the actions and the decisions taken by all the actors that are moving within the city area either for pleasure or for work (public authorities, private actors, citizens, tourists etc.,), taken for example the mean that each actor will use; the frequency of each movement; or the decisions taken by the public authorities in terms of infrastructure provision and new services etc. The complexity of this problem lies in the interrelation and interdependence of these decisions.
However, each action has a direct consequence to the urban mobility environment affecting a specific urban mobility element or else called a consequence area. Thus, in an attempt to identifying which are these consequence areas per each sustainability area as well as which are the correspondent consequence indicators (CIs) for measuring effectively each area, an extensive and thorough desktop research was implemented.
The following figure (Figure 2) illustrates the main outcomes of this process while the following Table (Table 1) briefly describes each consequence area.
The consequence indicators identified constitute the main assessment criteria of each future mobility scenario. Considering though the length of a survey, taking into consideration all these indicators and for facilitating the data collection process by the city’s local ecosystem, a prioritization process was needed to be implemented for narrowing the list of CIs down.
3.1.2. Prioritization Techniques for Identifying the Most Crucial Consequences for the Five European Cities
For defining which are the indicators with the highest priority that should be included in the city survey, a structured objective-driven approach was followed, using a prioritization matrix. A prioritization matrix is an easy to use, decision support tool which prioritizes a range of variables—in this case these are the consequence indicators—based on specific evaluation criteria [13].
The process that was followed for applying the prioritization matrix included two stages:
- Developing the prioritization matrix by determining the main assessment criteria and their rating scale;
- Circulating the matrix to the research experts involved, collecting their answers and developing the master list of prioritized Cis.
Five selection criteria were used for prioritizing the draft consequence indicators defined in the previous section. The rating scale for assessing these criteria also plays the role of corresponding criteria weights:
- Criterion 1: How difficult is estimating the indicator’s future state? This criterion strengthens the feasibility of the survey and reassures the accuracy of the outcomes by excluding these indicators for which it is not possible to estimate their future state.
| Criterion 1 | Rating Scale | ||||
| Estimating the indicator’s future state is | not possible | slightly difficult | moderately easy | easy | very easy |
| 0 | 1 | 2 | 3 | 4 | |
- Criterion 2: Is the indicator related to an issue that in the past has been researched? The second criterion highlights the areas where a knowledge gap is identified and where H2020 SPROUT could provide missing insight.
| Criterion 2 | Rating Scale | ||||
| The indicator is related to an issue that in the past has been researched | extensively | to a large extent | moderately | slightly | not at all |
| 0 | 1 | 2 | 3 | 4 | |
- Criterion 3: Is the indicator directly related to New Mobility Services? This priority criterion reflects one of the main objectives of the SPROUT Project, which is to address the impacts of emerging mobility services.
| Criterion 3 | Rating Scale | ||
| The indicator is directly related to New Mobility Services | No | Indirectly | Directly |
| 0 | 1 | 2 | |
- Criterion 4: Does the indicator address a potential consequence already identified? In the framework of the scenarios building process, the local stakeholders involved have already identified a list of potential consequences that they expect as a result of the urban mobility transitions. Thus, this prioritization criterion ensures that the pre-identification of these impacts is considered.
| Criterion 4 | Rating Scale | |
| The indicator addresses a potential consequence already identified | No | Yes |
| 0 | 1 | |
- Criterion 5: Is the indicator already included in the SPROUT Urban Mobility Transition Inventory? In the framework of the project, SPROUT developed an Urban Mobility Transition Inventory through which urban mobility data have been collected by the cities participating in the project in order to gain a clear view on the current mobility situation of each city. With this criterion, priority is given to the indicators that have been assessed which will provide additional opportunities for meaningful results. The local stakeholders will have a clearer picture of the current state of these indicators and a better understanding on what is really measured which will eventually result in more accurate outcomes in forecasting their level of change in the future.
| Criterion 5 | Rating Scale | |
| The indicator is included in the Urban Mobility Transition Inventory | No | Yes |
| 0 | 1 | |
Following the identification of the main prioritization criteria, a prioritization matrix has been developed and circulated among four mobility experts which were asked to assess consequently each consequence indicator based on these criteria. Based on the prioritized list of CIs, three main selection scenarios were formulated: (1) Keeping the CIs that scored over 50% of the max score; (2) keeping the CIs that scored over 55% of the max score; (3) keeping the CIs that scored over 60% of the max score.
The formula that has been used for prioritizing the CIs list and choosing the most preferable one was the following:
where:
n = the experts that participated in this prioritization process =in total 4 experts participated
i = the prioritization criteria
= the weight assigned to each criterion I by an expert n
= the upper scale of each criterion
Following a thorough discussion of the involved partners, the second scenario was chosen as the preferable one, taking into consideration the total no of CIs and the adequate coverage of the vast majority of the originally defined consequence areas.
The final list of the consequence areas and corresponding indicators is presented in Table 2.
3.1.3. Development of the “Continuum of Performance” for Each Consequence Indicator
For assessing the consequence indicators, it is first necessary to select the appropriate impact rating scale for each CI and develop its continuum of performance. An Impact scale can be expressed either verbally under terms such as: Minor impact, Moderate impact, Major impact etc., or numerically such as from −4 to + 4, or −3 + 3 where, each number represents a level of impact. The continuum of performance corresponds to the acceptable values or value ranges that will be aligned to each point of the rating scale.
In order to avoid having different interpretations by the local stakeholders on the meaning of words such as “Minor” “Moderate” etc., a numerical rating scale has been chosen as the most appropriate one for the survey. In terms of the scale’s length, although [14] Bendig (1954) supports that the length of the rating scale is irrelevant with the level of reliability of the study, as many studies reveal that there is a slight connection and it is preferable the number of scale points to exceed the two and three points of a Likert scale. Thus, for the needs of this survey, a 4 points Likert’s scale has been chosen [15].
Regarding the selection of the interval values in the continuum of performance, an extended literature review of previous research surveys on assessing the mobility state of a city as well as a desktop research on business related articles as the main source for collecting information about the latest mobility trends, was implemented. Where no references could be found, the experience of the SPROUT partners involved was employed. The main purpose of this research was to avoid receiving any misleading results from the assessment due to non-representative values indicated in the rating scale.

Table 2.
Prioritized CIs and their continuum of performance.
| ECONOMY | Expected Impact on (Increase or Decrease): | 1 | 2 | 3 | 4 | Source |
| Econ CA 1: The urban transport service structure/mix. | ||||||
| Share of public transport (%) | <5% | 5–10% | 10–15% | >15% | [16] | |
| Share of car transport (%) | <5% | 5–10% | 10–15% | >15% | [16] | |
| Share of micromobility (%) | <5% | 5–10% | 10–15% | >15% | [16] | |
| Share of active transport (%) | <5% | 5–10% | 10–15% | >15% | [16] | |
| Share of car sharing transport (%) | <5% | 5–10% | 10–15% | >15% | Consensus building among the SPROUT Partners | |
| Share of green deliveries (cargo bikes, electric tricycles, green autonomous/automated means) (% of daily deliveries) | <10% | 10–30% | 30–50% | >50% | [17] | |
| Share of next hour to same day goods delivery services (% of daily deliveries) | <10% | 10–15% | 15–20% | 20–25% | [18] | |
| Number of shared dockless bikes | <30% | 30–60% | 60–100% | >100% | [19,20] | |
| Number of shared e-scooters | <30% | 30–60% | 60–100% | >100% | [4,21] | |
| Econ CA 2: The urban space allocation | ||||||
| Share of urban space for public transport | <5% | 5–10% | 10–15% | >15% | Consensus building among the SPROUT Partners | |
| Share of urban space for private/shared cars | <5% | 5–10% | 10–15% | >15% | Consensus building among the SPROUT Partners | |
| Share of urban space for cycling/scooter lanes | <5% | 5–10% | 10–15% | >15% | Consensus building among the SPROUT Partners | |
| Share of urban space for pedestrian areas | <5% | 5–10% | 10–15% | >15% | [4] | |
| Number of autonomous/automated PT services on dedicated lanes | <5% | 5–10% | 10–15% | >15% | Consensus building among the SPROUT Partners | |
| Econ CA 3: The urban transport service volumes | ||||||
| Average number of daily urban freight trips | <5% | 5–10% | 10–15% | >15% | Consensus building among the SPROUT Partners | |
| Average number of vehicles entering the city on a daily basis | <5% | 5–10% | 10–15% | >15% | Consensus building among the SPROUT Partners | |
| Econ CA 4: The city’ s urban transport service level | ||||||
| Costs of alternative modes of urban passenger transport | <5% | 5–10% | 10–15% | >15% | Consensus building among the SPROUT Partners | |
| Share of passengers that use a smart method to pay for or validate a PT ticket (%) | <10% | 10–30% | 30–50% | >50% | [4] | |
| Share of PT vehicles that are equipped to provide real-time data that is released to passengers (%) | <10% | 10–30% | 30–50% | >50% | [4] | |
| Urban deliveries prices (€/package) | <5% | 5–10% | 10–15% | >15% | Consensus building among the SPROUT Partners | |
| Goods delivery frequency (average number of weekly deliveries to consumers) | <10% | 10–15% | 15–20% | 20–25% | [22] | |
| Econ CA 5: The urban transport operational costs and required investment costs? | ||||||
| Additional private investments required (% of existing annual investment cost) | <5% | 5–10% | 10–15% | >15% | Consensus building among the SPROUT Partners | |
| ENVIRONMENT | Env CA1: Climate change | |||||
| CO2 equivalent or GHG emissions | <25% | 25–50% | 50–75% | >75% | [23] | |
| Env CA2: Air quality index | ||||||
| Air quality index | <25% | 25–50% | 50–75% | >75% | [24] | |
| SOCIETY | Soc CA1: Employment and social security? | |||||
| Gig economy (external contractor) employment (% of total employees) | <10% | 10–30% | 30–50% | >50% | [25] | |
| Soc CA2: safety and security? | ||||||
| Share of urban mobility accidents involving micromobility means (%) | <5% | 5–10% | 10–15% | >15% | Consensus building among the SPROUT Partners | |
| Share of urban mobility accidents involving on-demand bike/scooter deliveries (%) | <5% | 5–10% | 10–15% | >15% | Consensus building among the SPROUT Partners | |
| Soc CA3: Access to mobility services? | ||||||
| Affordability of using mobility services (citizens’ average annual cost of trips/annual income) | <5% | 5–10% | 10–15% | >15% | Consensus building among the SPROUT Partners | |
| Access to mobility services (ease with which all categories of passengers can use public transport) | Minor | Moderate | High | Major | Consensus building among the SPROUT Partners | |
| Accessibility for vulnerable groups to mobility services (ease with which vulnerable passengers can use public transport) | Minor | Moderate | High | Major | [26] | |
3.1.4. Use of the Framework
For assessing each SPROUT scenario, three dedicated surveys were designed per city, one per each future mobility scenario, and the surveys were developed using the SurveyMonkey platform. The surveys were distributed either separately to each stakeholder or the cities implemented a virtual workshop for reaching consensus among their stakeholders. Following the city responses’ collection, a statistical analysis of the results was implemented. For the data analysis, two different approaches were followed depending on the response generation process the cities followed. More specifically, (1) for the cities that implemented virtual workshops and followed a consensus building approach for filling in one questionnaire for each scenario per city, a presentation of the data collected is made. (2) For the cities that followed the approach of collecting responses through individual contacts with stakeholders, either through emails or personal interviews, a statistical analysis following the 70% majority rule is implemented. In the cases where the stakeholder’s opinion is strongly divergent, a presentation of all different responses is included in the results.
3.2. The Case of Padua
For 2030, Padua developed three different future mobility scenarios, where each of the selected urban mobility transition drivers evolves differently over time, as presented in the following Table:
3.2.1. Paduas’ Future Mobility Scenarios
The scenarios for Padua were developed using a mixed-method approach combining cross-impact balance (CIB) analysis and creative scenario writing workshops [27]. CIB analysis is a method rooted in systems thinking that allows for the development of internally consistent scenarios, i.e., scenarios that consist of mutually supportive assumption bundles. For the development of the scenarios, Padua selected the drivers of urban mobility that are relevant for its specific context (see Table 3). The impact of these drivers on one another was then evaluated by mobility and logistics experts in an evaluation matrix. Using this matrix, internally consistent scenarios were generated that do not have contradictory elements. For Padua, seven consistent scenarios were found, of which two were selected based on how different they were from one another. This was done to obtain very different views on the future. The third scenario was selected based on stakeholder input.
To obtain narratives from the raw scenarios produced by the CIB analysis, two rounds of scenario writing workshops were organized. The first workshop was used to develop specific narrative descriptions of the impact of each driver on urban mobility in the city by 2030. During that workshop, input was also collected on the most likely scenario. The second round of workshops (one for each scenario) was used to creatively develop the narrative elements and the visuals of the scenarios, based on the results of the CIB analysis and the first workshop [8].
3.2.2. Impact Assessment Process Followed by the City
The city of Padua shared the surveys with the local stakeholders and provided clear instructions in written. The survey was completed and returned directly by the stakeholders. The types of stakeholders that were approached constitute some of the main decision makers in the mobility sector, comprising by both public authorities (i.e., local police, Municipality) and private operators (transport operators, new mobility service providers, research and academia) while the persons participated were familiar with the project’s main scope and outcomes and they were also involved in the scenario’s development process.
3.2.3. Indicative Results
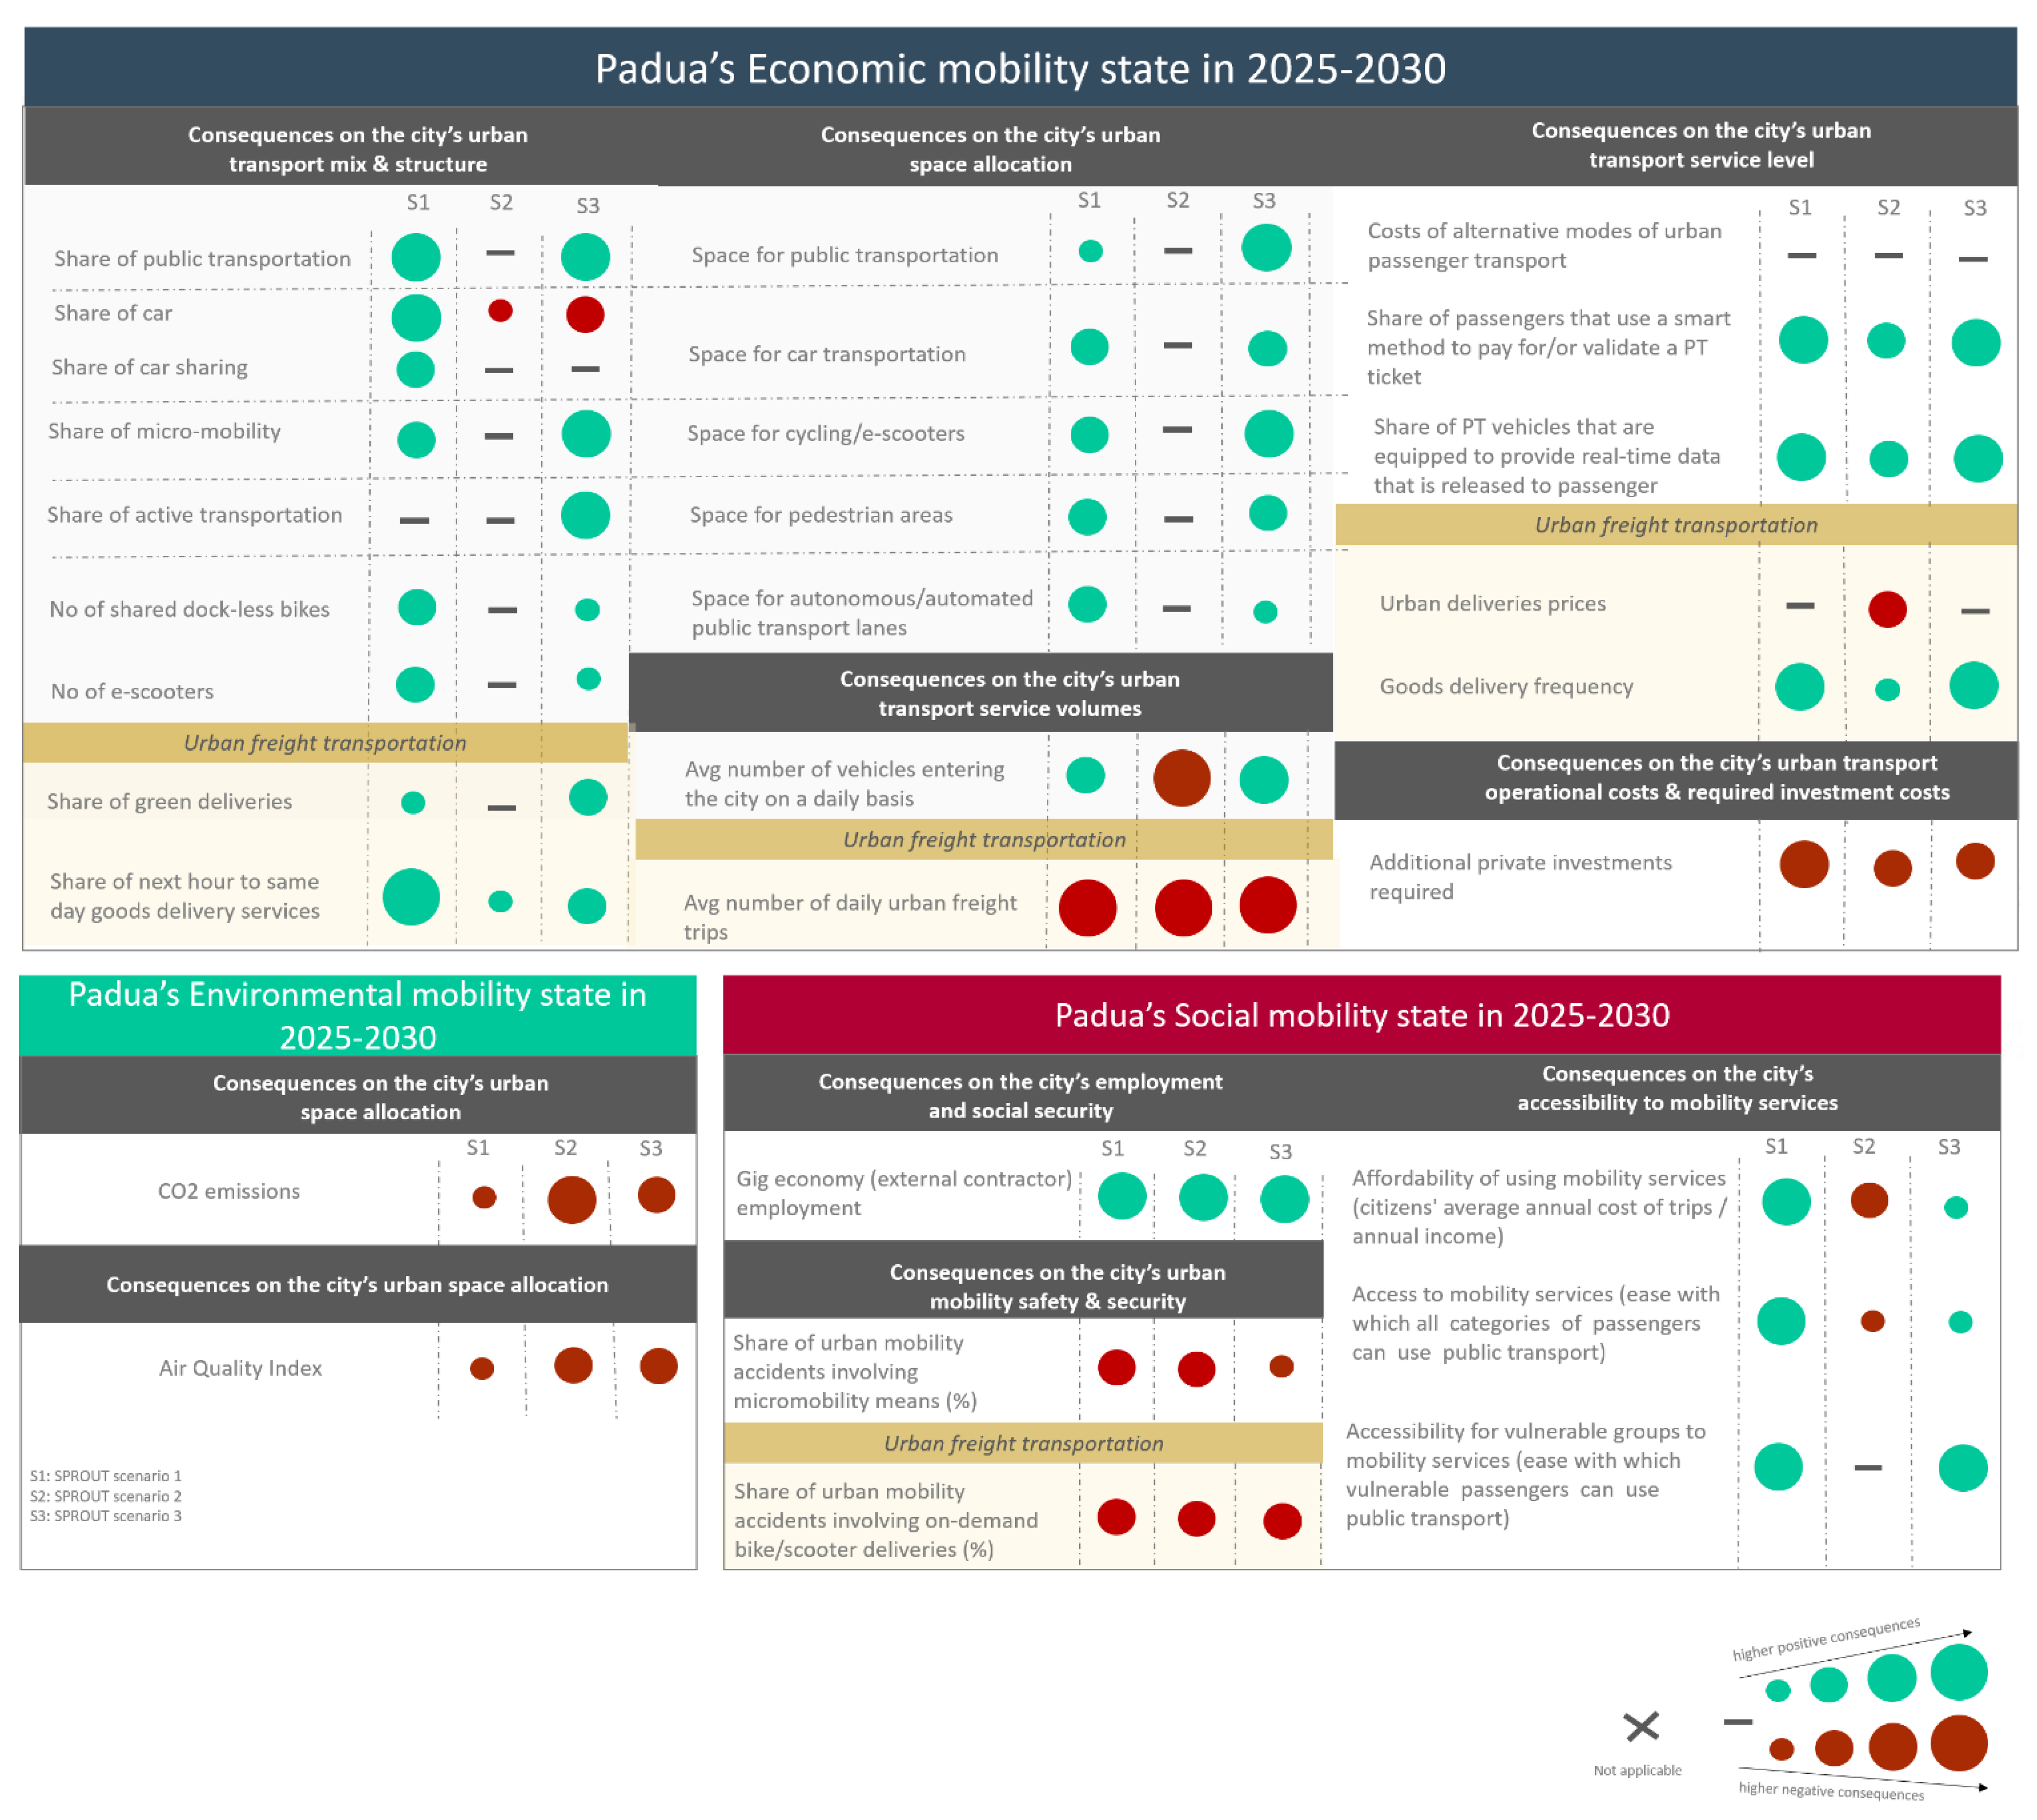
Regarding the economic mobility state of Padua city, the future shows a high possibility for the citizens to use more environmentally friendly modes of transport with two out of three scenarios to foresee the either moderate or high increase of the share of micro mobility and public transportation (Figure 3). Similar changes are expected also to the city’s current urban space allocation. Two out of three scenarios show more space for public transportation, more cycling and e-scooter lanes, less space for car transport, and more space for pedestrian areas, with two out of three scenarios to estimate it. Finally, in terms of automation in mobility, the city expects (justified by two out of three scenarios) the development and operation of dedicated autonomous/automated public transport lanes.
With respect to freight deliveries, a direction toward the provision of green deliveries is also foreseen by two out of three scenarios. On the other hand, though, a definite increase of the share of next hour and same day deliveries is expected by all three scenarios.
The worst case scenario—the second scenario in Padua’s case—presents a city with neither positive nor negative changes on the current transport mix and structure and the current urban space allocation besides the minor increase in the share of car transport and the share of next hour and next day deliveries.
Concerning the transport service level, a clear direction toward the use of new technologies and the smart transformation of the public transport is revealed (Figure 4). All three scenarios expect either a moderate or a high increase to the share of PT vehicles that will be equipped with smart technologies and the share of passengers that will use smart methods to pay. With respect to urban freight transportation, a positive impact–ranging among minor or high- to the goods delivery frequency is foreseen by all three scenarios.
In terms of costs for both passenger and freight transportation, no significant changes toward any positive direction are expected by 2025–2030, justified by all three scenarios (Figure 3). The worst case scenario even shows a moderate increase of the urban delivery prices.
One of the main negative consequences justified by all three scenarios is related to the city’s urban freight transport service volumes. The future shows more congested streets, with more daily urban freight trips to be implemented for covering the higher demand due to tourism and e-commerce growth. With respect to vehicles’ volumes though, two out of three scenarios expect a moderate or high decrease. In the worst case scenario, the streets will be more congested with both passenger and freight vehicles.
This figure of the streets can be considered the only possible explanation for the expected negative externalities to the city’s environment, ranging from minor to high increase of the CO2 emissions and the air quality index. This figure clearly shows that the expected level of increase in the use of environmentally friendly modes of transport is not enough for achieving a less pollutant city.
Finally, concerning the social dimension of the city’s mobility state, the results are controversial. On the one hand, positive figures can be noticed in the accessibility to mobility services. The city expects an increase, verified by two out of three mobility scenarios, in the affordability and of using mobility services based on the citizen’s average annual cost of trips and their annual income and a minor to high increase in the accessibility to mobility services by all categories of passengers including the vulnerable passengers. The worst case scenario presents a quite negative picture of the city’s accessibility to mobility services, foreseeing a moderate decrease in the affordability and a minor decrease in the accessibility by all types of passengers’ categories.
On the other hand, a safety issue is raised by all three scenarios since a significant increase in the share of urban mobility accidents involving micro-mobility means as well as in the share of urban mobility accidents involving on-demand bike/scooter deliveries is foreseen.
The following figures illustrate the level of positive and negative consequences foreseen for Padua’s’ mobility state in each mobility scenario and per each sustainability dimension
4. Discussion
In view of gaining a clear understanding on the mobility transition taken place in Europe, the present paper introduces the development and application of SPROUT conceptual framework for assessing future mobility scenarios. Following a consequence analysis methodology, through this framework the cities are able to identify which are the main urban mobility elements that best describe an urban mobility environment, and easily anticipate their future state considering the transition taken place in the city. More specifically, the SPROUT consequence analysis framework consists by: The three sustainability dimensions (Economy, Environment, and Society); 11 consequence (indicative examples: the urban transport service structure; urban transport service volumes; urban space allocation; climate change; safety, accessibility etc.,); 30 key performance indicators (consequence indicators).
This framework is being validated and used within SPROUT in five European cities. In this paper, the example of Padua’s case is presented showing the detailed outcomes from the application of the consequence analysis framework in one out of three future mobility scenarios developed by the city and presenting the consolidated outcomes from all the scenarios in Figure 4.
In general, Padua’s future state shows on the one hand a shift toward more environmentally friendly modes of transport; more space allocated to active transportation, public transportation and micro-mobility; smarter public transportation services; greener last mile deliveries and on the other hand higher demand for next hour deliveries, more congested streets, higher CO2 emissions and air pollution, and less safe mobility environment (Figure 5).
Author Contributions
Conceptualization, E.X. and, G.A.; methodology, E.X. and S.T.; validation, E.X., G.A., B.R., S.T. and M.M.; formal analysis, E.X.; investigation, E.X.; resources, B.R. and M.M.; data curation, E.X. and M.M.; writing—original draft preparation, E.X.; writing—review and editing, E.X., G.A., B.R. and S.T.; visualization, E.X.; supervision, G.A.; project administration, B.R.; All authors have read and agreed to the published version of the manuscript.
Funding
This research was funded by the “Sustainable Policy RespOnse to Urban mobility Transition—SPROUT” project in the framework of the HORIZON 2020 European Programme, Grant Agreement No. 814910.
Institutional Review Board Statement
Not applicable.
Informed Consent Statement
Informed consent was obtained from all subjects involved in the study.
Data Availability Statement
Not applicable.
Conflicts of Interest
The authors declare no conflict of interest.
References
- United Nations, Department of Economic and Social Affairs. World Urbanization Prospects; 2014 Revision. United Nations, 2019. ISBN 978-92-1-151517-6. Available online: http://www.un.org/en/development/desa/publications/2014-revision-world-urbanization-prospects.html (accessed on 10 March 2022).
- Alberti, V.; Alonso Raposo, M.; Attardo, C.; Auteri, D.; Barranco, R.; Batista e Silva, F.; Benczur, P.; Bertoldi, P.; Bono, F.; Bussolari, I.; et al. The Future of Cities—Opportunities, Challenges and the Way Forward; EUR 29752 EN; Vandecasteele, I., Baranzelli, C., Siragusa, A., Aurambout, J.P., Eds.; Publications Office: Luxembourg, 2019; ISBN 978-92-76-03847-4. [Google Scholar] [CrossRef]
- OECD. OECD Core Set of Indicators for Environmental Performance Reviews; OECD Environment Monographs: Paris, France, 1993. [Google Scholar]
- European Commission. Communication from the Commission to the European Parliament, the European Council, the Council, the European Economic and Social Committee and the Committee of the Regions. 640 Final, The European Green Deal. 2019. Available online: https://eur-lex.europa.eu/resource.html?uri=cellar:b828d165-1c22-11ea-8c1f-01aa75ed71a1.0002.02/DOC_1&format=PDF (accessed on 10 March 2022).
- Börjeson, L.; Höjer, M.; Dreborg, K.H.; Ekvall, T.; Finnveden, G. Scenario types and techniques: Towards a user’s guide. Futures 2006, 38, 723–739. [Google Scholar] [CrossRef]
- Kosow, H.; Gaßner, R. Methods of Future and Scenario Analysis: Overview, Assessment, and Selection Criteria; DEU: Bonn, Germany, 2008; Volume 39, p. 133. [Google Scholar]
- Te Boveldt, G.; Tori, S.; Keseru, I.; Macharis, C. Deliverable 2.3. Urban Mobility Transition Drivers, H2020 SPROUT Project, 2020 (accepted). Available online: https://sprout-civitas.eu/wp-content/uploads/2020/01/SPROUT-D2.3-Urban-Mobility-Transition-Drivers.pdf, (accessed on 10 March 2022).
- Tori, S.; Te Boveldt, G.; Keseru, I.; Macharis, C. Deliverable 3.1. City Specific Future Urban Mobility Scenarios, H2020 SPROUT Project, 2020 (accepted). Available online: https://civitas.eu/resources/city-specific-urban-mobility-scenarios-d31 (accessed on 10 March 2022).
- WBCSD. Mobility 2001—World Mobility at the End of the Twentieth Century and Its Sustainability. In Sustainable Mobility Working Group of the World Business Council for Sustainable Development; WBCSD: Geneva, Switzerland, 2001. [Google Scholar]
- Bell, S.; Morse, S. The Application of Grounded and Pragmatic Systemisim. In Sustainability Indicators: Measuring the Immeasurable? 2nd ed.; Earthscan: London, UK, 2008; pp. 101–191. [Google Scholar]
- Licata, J.W. Consequence Analysis: Theory and Practice in School Problem-Solving. Educ. Technol. 1978, 18, 22–28. [Google Scholar]
- Ricardo Energy & Environme. Services to Develop an EU Air Quality Index. Report for European Commission DG ENV. 2016. Available online: https://ec.europa.eu/environment/air/pdf/Air%20quality%20index_final%20report.pdf (accessed on 10 March 2022).
- Gosenheimer, C. Project Prioritization. A Structured Approach to Working on What Matters Most, Office of Quality Improvement of University of Wisconsisn-Madison, Version 1.1; 2012. Available online: https://www2.cortland.edu/offices/institutional-research-and-assessment/planning-and-assessment-support/file-uploads/Project_Prioritization_Guide_v_1.pdf (accessed on 10 March 2022).
- Bendig, A.W. Reliability and the number of rating scale categories. J. Appl. Psychol. 1954, 38, 38–40. [Google Scholar] [CrossRef]
- Krosnick, J.A.; Presser, S. Question and Questionnaire Design, Chapter 9. In Handbook of Survey Research 2015, 2nd ed.; Stanford University: Stanford, CA, USA, 2009; ISBN 978-1-84855-224-1. [Google Scholar]
- Goletz, M.; Heinrichs, D.; Feige, I. Mobility Trends in Cutting-Edge Cities; Final Report; Ifmo Institute of Mobility Research: Berlin, Germany, 2016. [Google Scholar]
- Joerss, M.; Schröder, J.; Neuhaus, F.; Klink, C.; Mann, F. Parcel Delivery, the Future of Last Mile; McKinsey & Company, Travel, 2016; pp. 1–32. Available online: https://bdkep.de/files/bdkep-dateien/pdf/2016_the_future_of_last_mile.pdf (accessed on 10 March 2022).
- Statista’s GmbH Online Statistics. Available online: https://www.statista.com (accessed on 10 April 2020).
- Chen, Z.; van Lierop, D.; Ettema, D. Dockless bike-sharing systems: What are the implications? Transp. Rev. 2020, 40, 333–353. [Google Scholar] [CrossRef]
- Richter, F. Bike-Sharing Is Taking Off around the World. Statista’s GmbH, 2015. Available online: https://www.statista.com/chart/3325/bike-sharing-systems-worldwide/ (accessed on 10 March 2022).
- Dickey, M.R. Shared Electric Scooter Rides Accounted for 45.8% of All Micromobility Trips in 2018. 2019. Available online: https://techcrunch.com/2019/04/17/shared-electric-scooter-rides-accounted-for-45-8-percent-of-all-micromobility-trips-in-2018/ (accessed on 3 March 2022).
- Capgemini Research Institute. The Last-Mile Delivery Challenge. Giving Retail and Consumer Product Customers a Superior Delivery Experience without Impacting Profitability. 2019. Available online: https://www.capgemini.com/research/the-last-mile-delivery-challenge/ (accessed on 3 March 2022).
- ALICE. Roadmap Towards Zero Emissions Logistics 2050, December 2019; Alliance for Logistics Innovation through Collaboration in Europe (ALICE-ETP): Brussels, Belgium, 2019. [Google Scholar]
- Air Quality in Europe Website. Available online: http://www.airqualitynow.eu/about_indices_definition.php (accessed on 3 March 2022).
- Abraham, K.G.; Haltiwanger, J.C.; Sandusky, K.; Spletzer, J.R. Measuring the Gig Economy: Current Knowledge and Open Issues; National Bureau of Economic Research: Cambridge, MA, USA, 2018. [Google Scholar]
- Bekiaris, E.; Loukea, M.; Spanidis, P.; Ewing, S.; Denninghaus, M.; Ambrose, I.; Papamichail, K.; Castiglioni, R.; Veitch, C. Research for TRAN Committee: Transport and Tourism for Persons with Disabilities and Persons with Reduced Mobility; European Parliament, Policy Department for Structural and Cohesion Policies: Brussels, Belgium, 2018. [Google Scholar]
- Wolfgang Weimer-Jehle. Cross-impact balances: A system-theoretical approach to cross-impact analysis. Technol. Forecast. Soc. Chang. 2006, 73, 334–361. [Google Scholar] [CrossRef]
Figure 1.
Methodological approach.

Figure 2.
Urban mobility consequence areas per sustainability area.

Figure 3.
Impact on the urban transport service structure and mix (scenario 2).

Figure 4.
Level of impact on urban passenger transport service level (scenario 1).

Figure 5.
Possible scenarios of Padua’s economic, environmental, and social mobility state in 2030.

Table 1.
Urban mobility consequence areas and consequence indicators.
| Sustainability Dimension: Economy | ||
| Consequence Area Econ CA1: Urban transport service structure and mix: | CA 1 includes all impacts related to the mix of transport modes, the type of vehicles used, and the type of mobility services that operate or will operate in the city’s’ mobility environment. CIs initially identified: Shares of: public transport; private cars; shared cars; cycling/scooters; walking (% of passenger-trips); Number of shared e-scooters; Number of shared dockless bikes; Share of next hour to same day goods delivery services (% of daily deliveries); Share of green deliveries (cargo bikes, electric tricycles, green autonomous/automated means) (% of daily deliveries); Share of electric vehicles (% of fleet driving in the city) | |
| Consequence Area Econ CA2: Urban space allocation: | CI2 concerns the allocation of public urban space among the different modes of transport. CIs initially identified: Shares of urban space: public transport; private/shared cars; cycling/scooter lanes; pedestrian areas (% of area); Number of autonomous/automated PT services on dedicated lanes; Number of urban micro-delivery facilities | |
| Consequence Area Econ CA3: Urban transport service volumes : | CI3 concerns the volumes of freight and passenger flows, the level of congestion on the streets, the number of movements that are taking place on the streets e.tc. CIs initially identified: Average number of private cars entering, driving through or within the city on a daily basis; Average number of daily urban freight trips; Urban traffic congestion (% of travel/trip time in excess of that normally incurred under light or free-flow traffic conditions) | |
| Consequence Area Econ CA4: Urban transport service level: | CA4 concerns the service level of the urban transport services provided. CIs initially identified: Costs of alternative modes of urban passenger transport; Share of passengers that use a smart method to pay for or validate a PT ticket (%); Share of PT vehicles that are equipped to provide real-time data that is released to passengers (%); Urban deliveries prices (€/package); Goods delivery frequency (average number of weekly deliveries to shops and consumers) | |
| Consequence Area Econ CA5: Urban transport operational and capital expenditure costs (OpEx & CapEx): | The final consequence area under the Economy dimension concerns the potential impact on the expenses required for developing and operating the current/future urban mobility system. CIs initially identified: Maintenance cost of existing infrastructure (% of existing annual cost); Additional public investments required (% of existing annual investment cost); Additional private investments required (% of existing annual investment cost) | |
| Sustainability dimension: Environment | ||
| Consequence Area Env CA 1: Climate change | Env CA1 concerns the changes related to climate change and is measured by the level of CO2 emissions or GHG emissions. CI identified: CO2 equivalent or GHG emissions from transport (% of GHG emissions from urban transport) | |
| Consequence Area Env CA2: Air quality index | Air quality index: Env CA2 concerns the amount of expected increase or decrease of the Air quality index of a city, as a result of urban mobility. The air quality index (AQI) is a number used to report the quality of the air on any given day. The Index is based on measurement of particulate matter (PM2.5 and PM10), ozone (O3), nitrogen dioxide (NO2), and sulfur dioxide (SO2emissions) [12]. CI identified: European Air Quality Index | |
| Consequence Area Env CA 3: Noise | Env CA3 refers to the amount of expected increase or decrease of the Noise emissions in a city, as a result of urban mobility. CI identified: Share of urban population affected by traffic noise, both day and night (% of urban population) | |
| Sustainability dimension: Society | ||
| Consequence Area Soc CA1: Employment & social security | Soc CA1 concerns mainly the potential changes to the structure, types of employment and social security levels and benefits. CIs identified: Full-time employment in urban transport, for both passenger and freight transport (number of employees); Gig economy (external contractor) employment (% of total employees) | |
| Consequence Area Soc CA2: Safety & security | Soc CA2 addresses the safety and security issues that may come up due to changes in the urban environment. CIs identified: Urban mobility accidents per 1,000 inhabitants; Share of urban mobility accidents involving micro-mobility means; Share of urban mobility accidents involving on-demand bike/scooter deliveries | |
| Consequence Area Soc CA3: Access to mobility services: | Soc CA3 addresses the potential changes to accessibility issues. CIs identified: Affordability of using mobility services (citizens’ average annual cost of trips/annual income); Access to mobility services (ease with which all categories of passengers can use public transport); Accessibility for vulnerable groups to mobility services (ease with which vulnerable passengers can use public transport) | |
Table 3.
Padua’s future state of urban mobility transition drivers.
| Urban Mobility Transition Driver | Level of Change | ||
|---|---|---|---|
| Scenario 1 | Scenario 2 | Scenario 3 | |
| Political agenda and transparency | increase | decrease | increase |
| New job opportunities, new business models, transformation of retail, environmental consciousness, next–h to same-day delivery | strong growth | weak growth | Strong growth |
| Urban structure | increasing densification | Increasing densification | Increasing sprawl |
| Population size and local environmental quality | decrease | decrease | decrease |
| Electrification, smart–city technology, automation | Strong growth | Weak growth | Weak growth |
| Data and privacy laws, health and safety laws | more regulation | Less regulation | Less regulation |
Publisher’s Note: MDPI stays neutral with regard to jurisdictional claims in published maps and institutional affiliations. |
© 2022 by the authors. Licensee MDPI, Basel, Switzerland. This article is an open access article distributed under the terms and conditions of the Creative Commons Attribution (CC BY) license (https://creativecommons.org/licenses/by/4.0/).
Share and Cite
MDPI and ACS Style
Xenou, E.; Ayfantopoulou, G.; Royo, B.; Tori, S.; Mazzarino, M. Methodology for Consequence Analysis of Future Mobility Scenarios: The SPROUT Framework. Future Transp. 2022, 2, 453-466. https://doi.org/10.3390/futuretransp2020025
AMA Style
Xenou E, Ayfantopoulou G, Royo B, Tori S, Mazzarino M. Methodology for Consequence Analysis of Future Mobility Scenarios: The SPROUT Framework. Future Transportation. 2022; 2(2):453-466. https://doi.org/10.3390/futuretransp2020025
Chicago/Turabian StyleXenou, Elpida, Georgia Ayfantopoulou, Beatriz Royo, Sara Tori, and Marco Mazzarino. 2022. "Methodology for Consequence Analysis of Future Mobility Scenarios: The SPROUT Framework" Future Transportation 2, no. 2: 453-466. https://doi.org/10.3390/futuretransp2020025