
YOLOv4-Based CNN Model versus Nested Contours Algorithm in the Suspicious Lesion Detection on the Mammography Image: A Direct Comparison in the Real Clinical Settings

 ,
,
Abstract
:1. Introduction
2. Materials and Methods
2.1. Methods
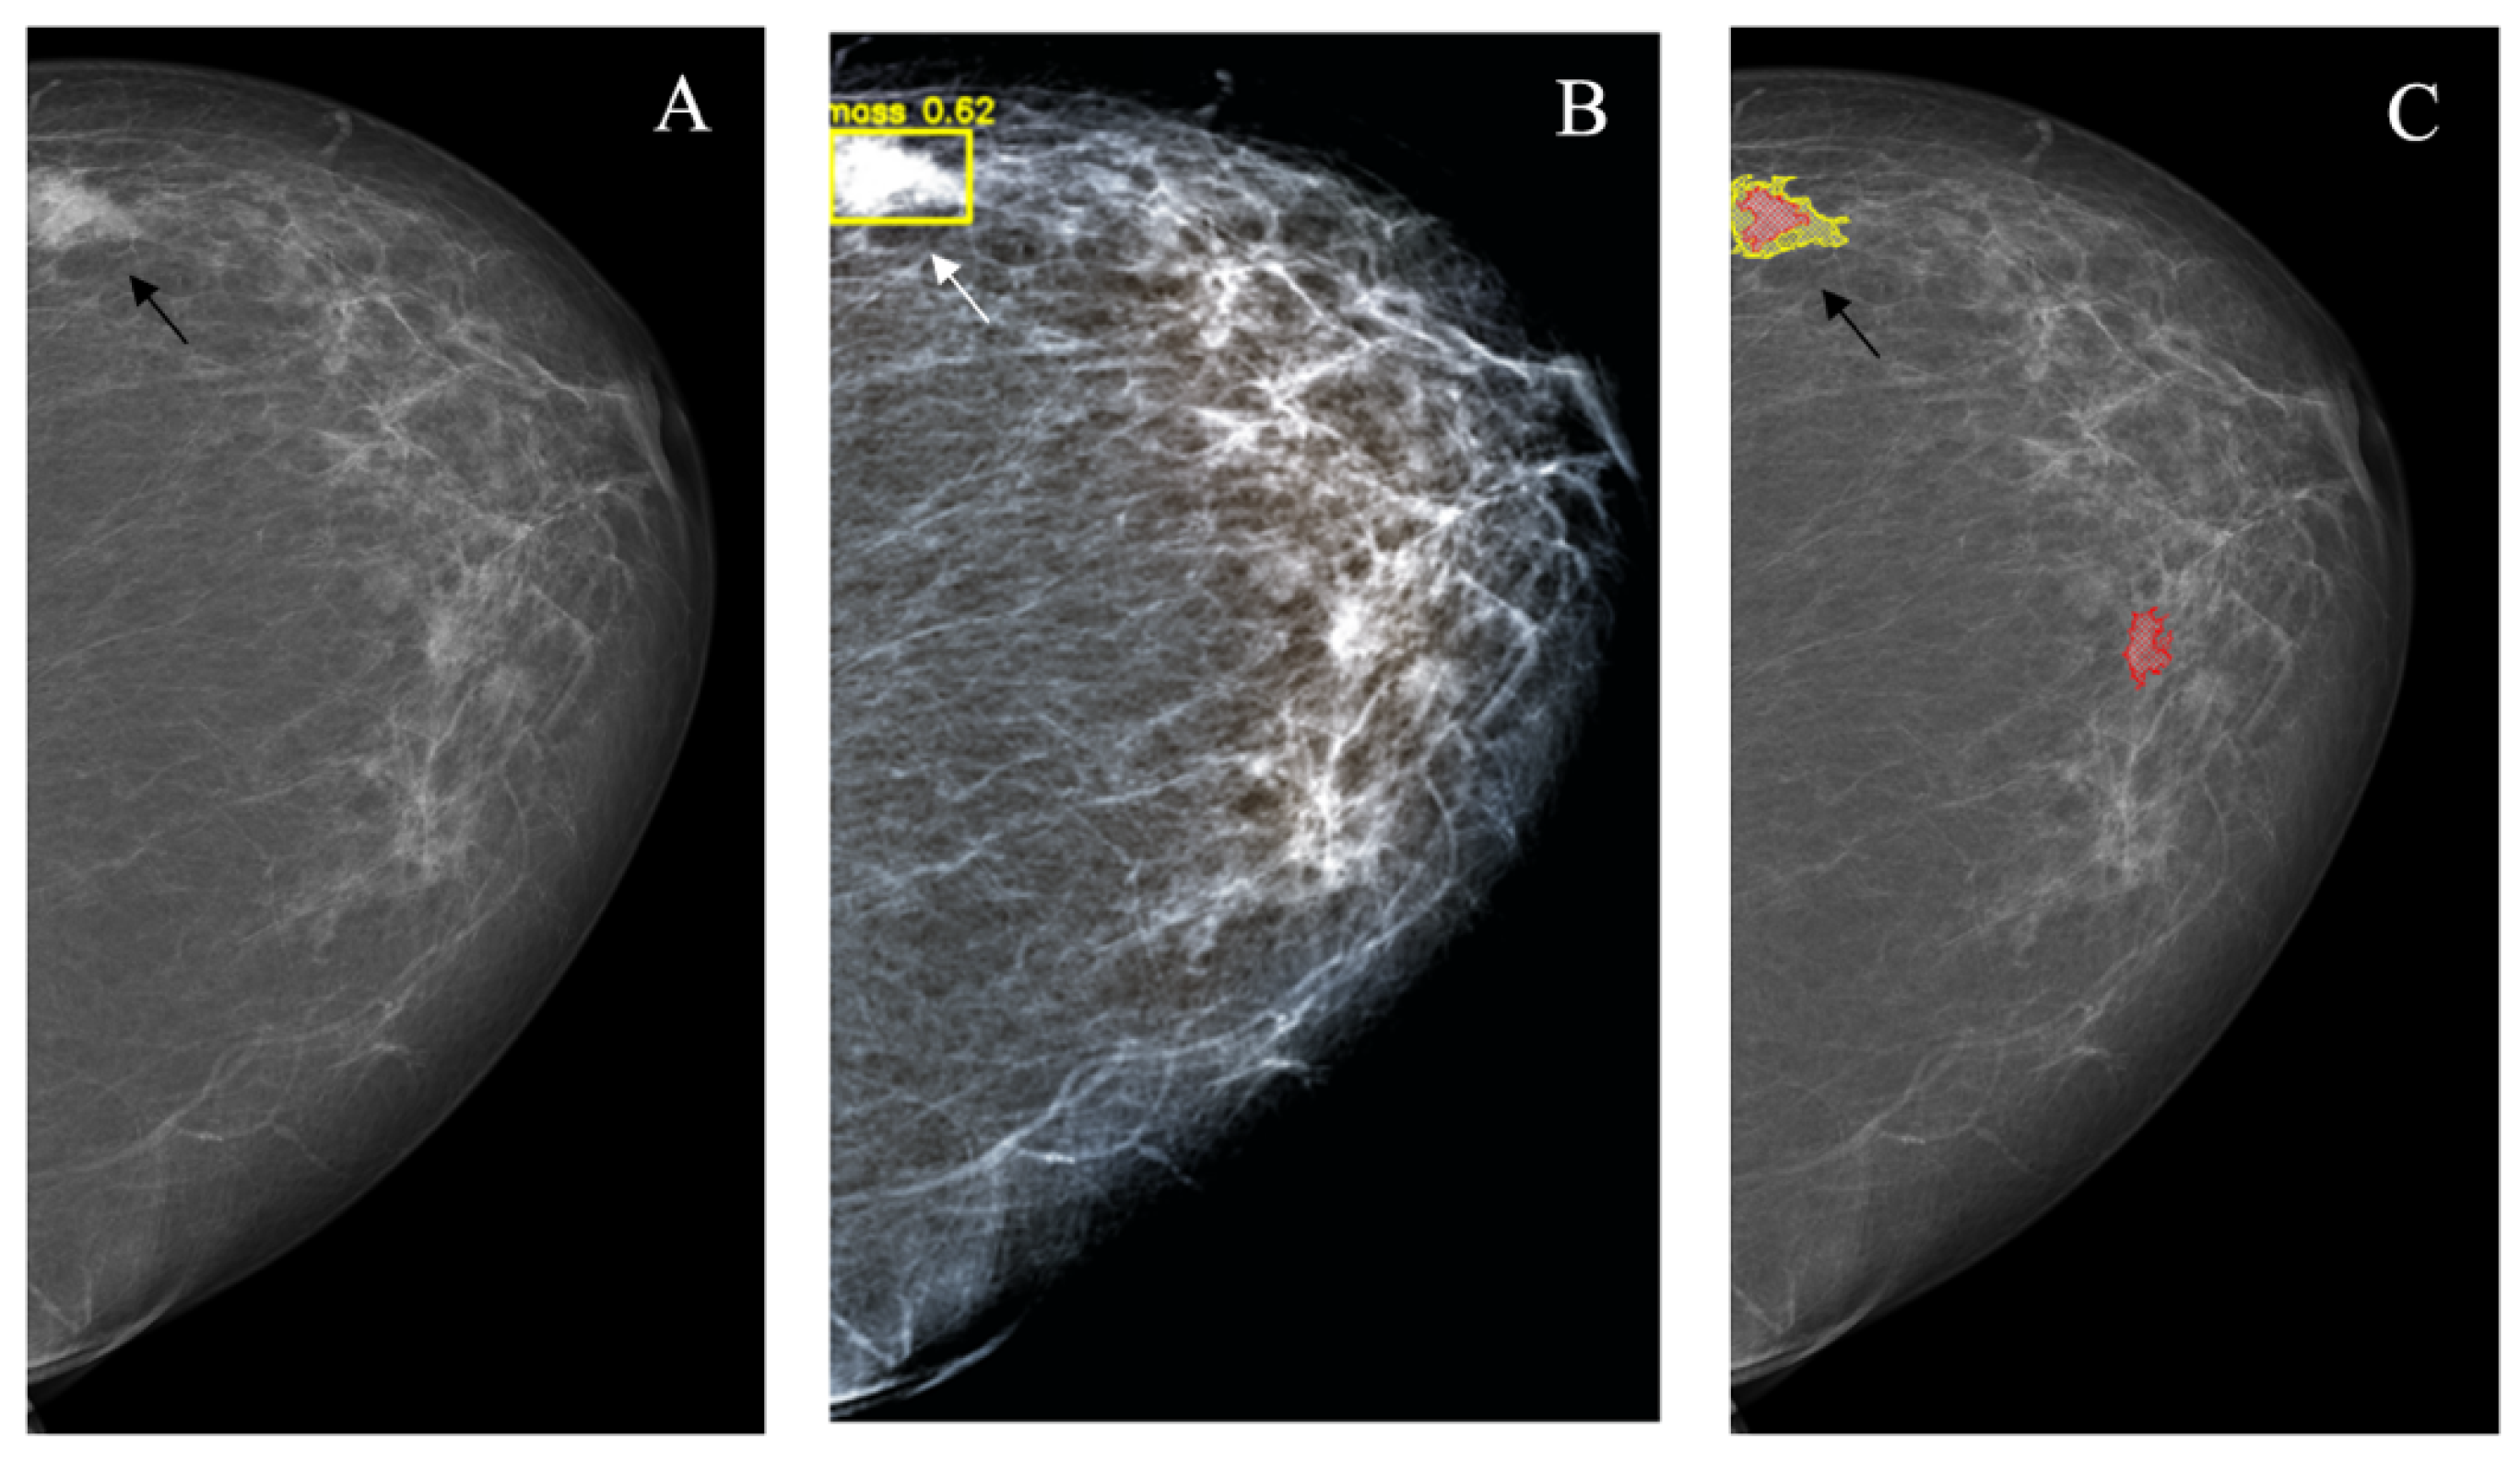
2.1.1. NCA
2.1.2. YOLOv4
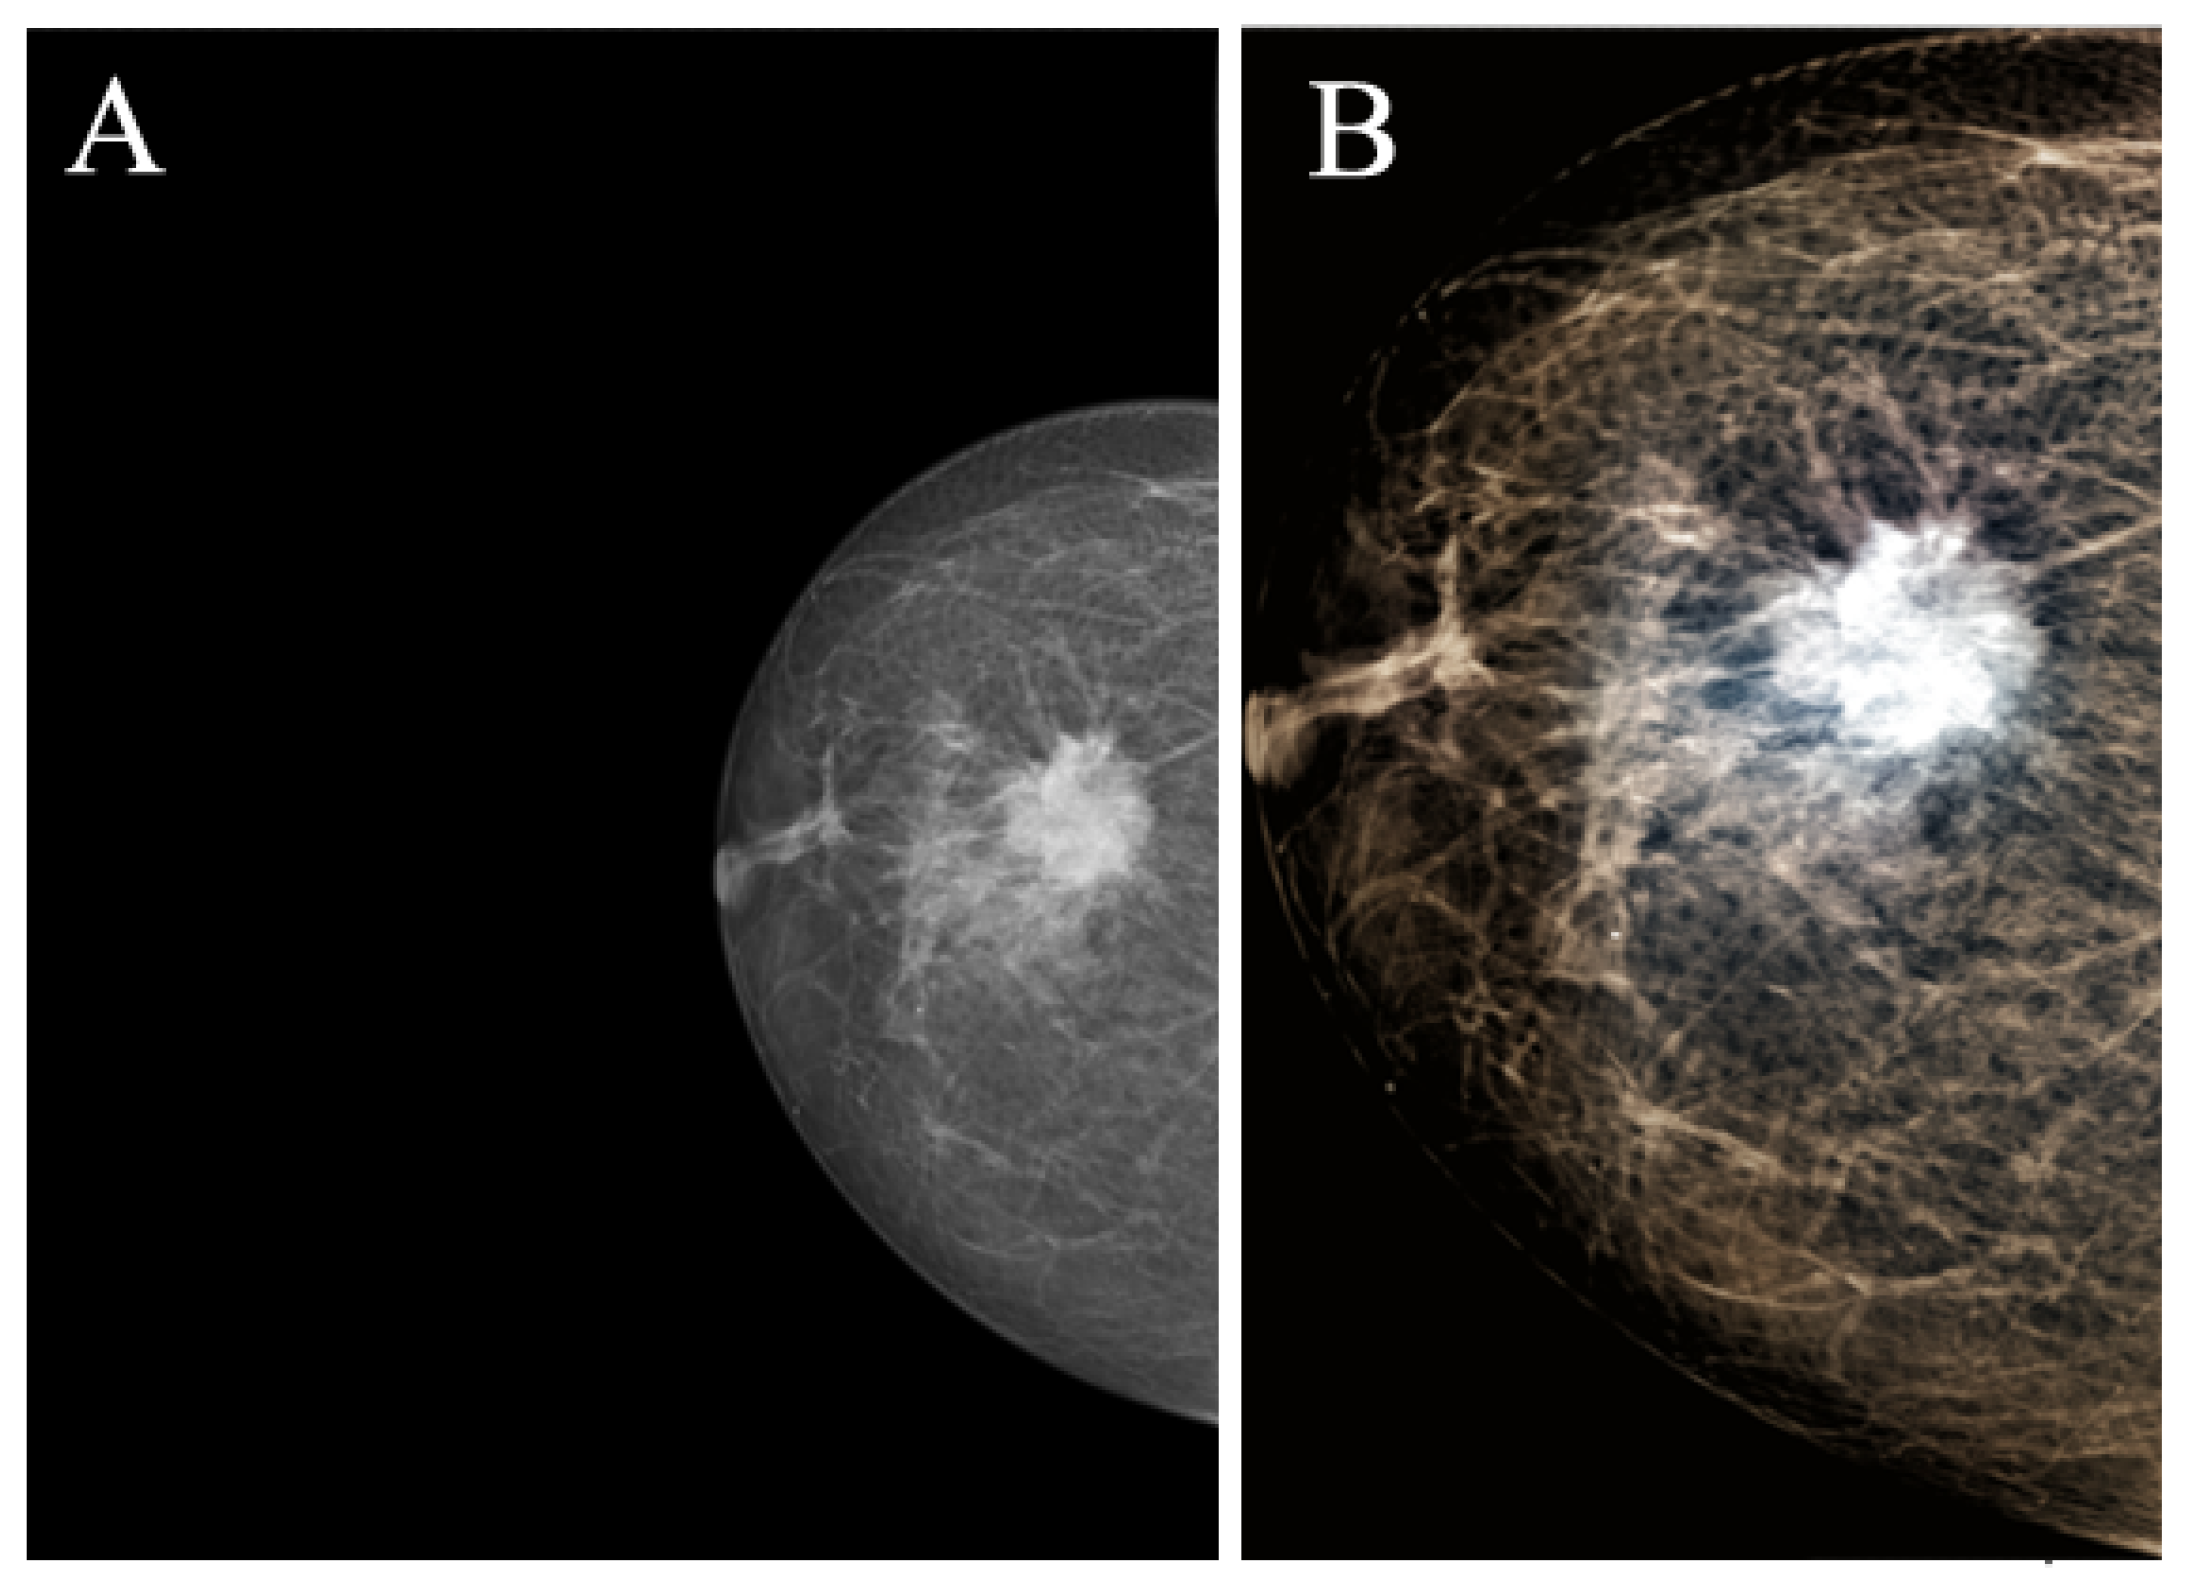
- Truncation normalization—according to the intensity histogram of the ROI image, a pair of the effective maximum intensity and minimum intensity is being selected, and then they are used to cut off the intensity of the image and finally to perform the normalize operating. This ensures that the breast region has a sufficient range of intensity distribution.
- Image enhancement—Contrast limited adaptive histogram equalization (CLAHE algorithm) [27];
- Image synthesizing—a 3-channel image is synthesized and composed of the truncated and normalized image, the contrast enhanced image with clip limit 1, and the contrast enhanced image with clip limit 2.
2.2. Materials
2.3. Statistical Methods
3. Results
4. Discussion
5. Conclusions
Author Contributions
Funding
Acknowledgments
Conflicts of Interest
References
- Bray, F.; Ferlay, J.; Soerjomataram, I.; Siegel, R.L.; Torre, L.A.; Jemal, A. Global Cancer Statistics 2018: GLOBOCAN Estimates of Incidence and Mortality Worldwide for 36 Cancers in 185 Countries. Cancer J. Clin. 2018, 68, 394–424. [Google Scholar] [CrossRef] [Green Version]
- Seely, J.M.; Alhassan, T. Screening for breast cancer in 2018—What should we be doing today? Curr. Oncol. 2018, 25, S115–S124. [Google Scholar] [CrossRef] [PubMed] [Green Version]
- Lauby-Secretan, B.; Scoccianti, C.; Loomis, D.; Benbrahim-Tallaa, L.; Bouvard, V.; Bianchini, F.; Straif, K. Breast-cancer screening —Viewpoint of the IARC Working Group. N. Engl. J. Med. 2015, 372, 2353–2358. [Google Scholar] [CrossRef] [PubMed] [Green Version]
- Thigpen, D.; Kappler, A.; Brem, R. The Role of Ultrasound in Screening Dense Breasts—A Review of the Literature and Practical Solutions for Implementation. Diagnostics 2018, 8, 20. [Google Scholar] [CrossRef] [Green Version]
- Weigel, S.; Heindel, W.; Heidrich, J.; Hense, H.W.; Heidinger, O. Digital mammography screening: Sensitivity of the programme dependent on breast density. Eur. Radiol. 2017, 27, 2744–2751. [Google Scholar] [CrossRef]
- Vacek, P.M.; Geller, B.M. A prospective study of breast cancer risk using routine mammographic breast density measurements. Cancer Epidemiol. Biomarkers Prev. 2004, 13, 715–722. [Google Scholar]
- Li, R.; Xiao, C.; Huang, Y.; Hassan, H.; Huang, B. Deep Learning Applications in Computed Tomography Images for Pulmonary Nodule Detection and Diagnosis: A Review. Diagnostics 2022, 12, 298. [Google Scholar] [CrossRef]
- Hassan, H.; Ren, Z.; Zhao, H.; Huang, S.; Li, D.; Xiang, S.; Kang, Y.; Chen, S.; Huang, B. Review and classification of AI-enabled COVID-19 CT imaging models based on computer vision tasks. Comp. Biol. Med. 2022, 141, 105123. [Google Scholar] [CrossRef]
- Li, D.; Chen, Z.; Hassan, H.; Huang, B. A Cascaded 3D Segmentation Model for Renal Enhanced CT Images. 2021. Available online: https://www.researchgate.net/publication/357327129_A_Cascaded_3D_Segmentation_Model_for_Renal_Enhanced_CT_Images (accessed on 10 March 2022).
- Xiao, C.; Hassan, H.; Huang, B. Contrast-Enhanced CT Renal Tumor Segmentation. 2021. Available online: https://www.researchgate.net/publication/357327049_Contrast-Enhanced_CT_Renal_Tumor_Segmentation (accessed on 10 March 2022).
- Yassin, N.I.; Omran, S.; El Houby, E.M.; Allam, H. Machine learning techniques for breast cancer computer aided diagnosis using different image modalities: A systematic review. Comp. Methods Progr. Biomed. 2018, 156, 25–45. [Google Scholar] [CrossRef]
- Oza, P.; Sharma, P.; Patel, S. Machine Learning Applications for Computer-Aided Medical Diagnostics. In Proceedings of the Second International Conference on Computing, Communications, and Cyber-Security, Ghaziabad, India, 3–4 October 2021; Springer: Singapore, 2021; pp. 377–392. [Google Scholar] [CrossRef]
- Naji, M.A.; Filali, S.E.; Aarika, K.; Benlahmar, E.H.; Abdelouhahid, R.A.; Debauche, O. Machine learning algorithms for breast cancer prediction and diagnosis. Proc. Comp. Sci. 2021, 191, 487–492. [Google Scholar] [CrossRef]
- Morra, L.; Sacchetto, D.; Durando, M.; Agliozzo, S.; Carbonaro, L.A.; Delsanto, S.; Pesce, B.; Persano, D.; Mariscotti, G.; Marra, V.; et al. Breast Cancer: Computer-Aided Detection with Digital Breast Tomosynthesis. Radiology 2015, 277, 56–63. [Google Scholar] [CrossRef] [PubMed] [Green Version]
- Zhu, C. Machine Reading Comprehension: Algorithms and Practice; Elsevier: Amsterdam, The Netherlands, 2021; 270p, ISBN 0323901182. [Google Scholar]
- Sechopoulos, I.; Teuwen, J.; Mann, R. Artificial intelligence for breast cancer detection in mammography and digital breast tomosynthesis: State of the art. Semin. Cancer Biol. 2021, 72, 214–225. [Google Scholar] [CrossRef] [PubMed]
- Al-Antari, M.A.; Al-Masni, M.A.; Choi, M.T.; Han, S.M.; Kim, T.S. A fully integrated computer aided diagnosis system for digital X-ray mammograms via deep learning detection, segmentation, and classification. Int. J. Med. Inf. 2018, 117, 44–54. [Google Scholar] [CrossRef]
- Chougrad, H.; Zouaki, H.; Alheyane, O. Deep Convolutional Neural Networks for breast cancer screening. Comp. Methods Prog. Biomed. 2018, 157, 19–30. [Google Scholar] [CrossRef]
- Cao, H.; Pu, S.; Tan, W.; Tong, J. Breast mass detection in digital mammography based on anchor-free architecture. Comp. Methods Prog. Biomed. 2021, 205, 1–12. [Google Scholar] [CrossRef]
- Hamed, G.; Marey, M.; El-Sayed, S.A.; Tolba, M.F. YOLO Based Breast Masses Detection and Classification in Full-Field Digital Mammograms. Comp. Methods Prog. Biomed. 2021, 200, 105823. [Google Scholar]
- Djebbar, K.; Mimi Berradja, K.; Taleb-Ahmed, A. Deep convolutional neural networks for detection and classification of tumors in mammograms. In Proceedings of the 2019 6th International Conference on Image and Signal. Processing and their Applications (ISPA), Mostaganem, Algeria, 24–25 November 2019; pp. 1–7. [Google Scholar] [CrossRef]
- Al-masni, M.; Al-antari, M.A.; Park, J.; Gi, G.; Kim, T.Y.; Rivera, P.; Valarezo Anazco, E.; Choi, M.-T.; Han, S.-M.; Kim, T.-S. Simultaneous Detection and Classification of Breast Masses in Digital Mammograms via a Deep Learning YOLO-Based CAD System. Comp. Methods Prog. Biomed. 2018, 157, 85–94. [Google Scholar] [CrossRef]
- Baccouche, A.; Zapirain, B.; Elmaghraby, A.; Castillo, C. Breast Lesions Detection and Classification via YOLO-Based Fusion Models. Comp. Mater. Continua Tech. Sci. Press 2021, 69, 1407–1425. [Google Scholar] [CrossRef]
- Egoshin, I.; Pasynkov, D.; Kolchev, A.; Kliouchkin, I.; Pasynkova, O. A segmentation approach for mammographic images and its clinical value. In Proceedings of the 2017 IEEE International Conference on Microwaves, Antennas, Communications and Electronic Systems (COMCAS), Tel-Aviv, Israel, 13–15 November 2017; pp. 1–6. Available online: https://ieeexplore.ieee.org/document/8244764 (accessed on 10 March 2022). [CrossRef]
- Bochkovskiy, A.; Wang, C.-Y.; Liao, H.-Y. YOLOv4: Optimal Speed and Accuracy of Object Detection. arXiv 2020, arXiv:abs/2004.10934. [Google Scholar]
- Moreira, I.C.; Amaral, I.; Domingues, I.; Cardoso, A.; Cardoso, M.J.; Cardoso, J.S. INbreast: Toward a full-field digital mammographic database. Acad. Radiol. 2012, 19, 236–248. [Google Scholar] [CrossRef] [Green Version]
- Karel, Z. Contrast Limited Adaptive Histogram Equalization; Graphics Gems IV; Academic Press: Cambridge, MA, USA, 1994; pp. 474–485. [Google Scholar]
- Darknet. Available online: https://github.com/AlexeyAB/darknet (accessed on 21 February 2022).
- Lin, T.-Y.; Maire, M.; Belongie, S.; Hays, J.; Perona, P.; Ramanan, D.; Dollar, P.; Zitnick, C.L. Microsoft COCO: Common objects in context. In Proceedings of the European Conference on Computer Vision (ECCV), Zurich, Switzerland, 6–12 September 2014; Volume 8693, pp. 740–755. [Google Scholar] [CrossRef] [Green Version]
- Jiang, F.; Liu, H.; Yu, S.; Xie, Y. Breast mass lesion classification in mammograms by transfer learning. In Proceedings of the 5th International Conference on Bioinformatics and Computational Biology (ICBCB), Hong Kong, China, 6–8 January 2017; pp. 59–62. [Google Scholar] [CrossRef]
- Oza, P.; Sharma, P.; Patel, S.; Bruno, A. A Bottom-Up Review of Image Analysis Methods for Suspicious Region Detection in Mammograms. J. Imaging. 2021, 7, 190. [Google Scholar] [CrossRef]
- Salama, W.M.; Aly, M.H. Deep learning in mammography images segmentation and classification: Automated CNN approach. Alex. Eng. J. 2021, 60, 4701–4709, ISSN 1110-0168. [Google Scholar]
- Xiaobo, L.; Weiji, Y.; Ruipeng, L. DBT Masses Automatic Segmentation Using U-Net Neural Networks. Comp. Math. Methods Med. 2020, 2020, 1–10. [Google Scholar] [CrossRef]
- Agnes, S.A.; Anitha, J.; Pandian, S.I.A.; Peter, J.D. Classification of Mammogram Images Using Multiscale all Convolutional Neural Network (MA-CNN). J. Med. Syst. 2020, 44, 1–30. [Google Scholar] [CrossRef]
- Shen, L.; Margolies, L.R.; Rothstein, J.H.; Fluder, E.; McBride, R.; Sieh, W. Deep Learning to Improve Breast Cancer Detection on Screening Mammography. Sci Rep. 2019, 9, 1–12. [Google Scholar] [CrossRef]
- Girshick, B. Fast R-CNN. In Proceedings of the IEEE International Conference on Computer Vision (ICCV), Santiago, Chile, 7–13 December 2015; pp. 1440–1448. [Google Scholar] [CrossRef]
- Redmon, J.; Divvala, S.; Girshick, R.; Farhadi, A. You Only Look Once: Unified, Real-Time Object Detection. In Proceedings of the IEEE Conference on Computer Vision and Pattern Recognition (CVPR), Las Vegas, NV, USA, 27–30 June 2016; pp. 779–788. [Google Scholar] [CrossRef] [Green Version]


| Mammographic Type | N |
|---|---|
| Star-like lesion | 16 |
| Mass with unclear border | 30 |
| Round- or oval-shaped mass with clear border | 8 |
| Asymmetric density | 28 |
| Changes invisible on the dense parenchyma background | 16 |
| Partly visualized mass | 2 |
| Total | 100 |
| ACR Density Category | N |
|---|---|
| ACR * A | 27 |
| ACR B | 33 |
| ACR C | 31 |
| ACR D | 9 |
| Total | 100 |
| Lesion Type | True-Positive Markings | False-Positive Markings | ||
|---|---|---|---|---|
| YOLOv4 | NCA | YOLOv4 | NCA | |
| Star-like lesion | 15/16 | 16/16 | 0/16 | 9/16 |
| Mass with unclear border | 24/30 | 24/30 | 7/30 | 14/30 |
| Round- or oval-shaped mass with clear border | 8/8 | 8/8 | 3/8 | 4/8 |
| Asymmetric density | 6/28 | 27/28 | 0/28 | 18/28 |
| Changes invisible on the dense parenchyma background | 5/16 | 16/16 | 0/16 | 16/16 |
| Partly visualized mass | 2/2 | 2/2 | 0/2 | 2/2 |
| Total | 60/100 | 93/100 | 10/100 | 63/100 |
| Score | YOLOv4 | NCA |
|---|---|---|
| Precision | 0.85 | 0.59 |
| Recall | 0.60 | 0.93 |
| F1-Score | 0.70 | 0.72 |
| β | YOLOv4 | NCA |
|---|---|---|
| 10 | 5.66 | 8.11 |
| 50 | 29.59 | 45.09 |
| 100 | 59.58 | 91.56 |
Publisher’s Note: MDPI stays neutral with regard to jurisdictional claims in published maps and institutional affiliations. |
© 2022 by the authors. Licensee MDPI, Basel, Switzerland. This article is an open access article distributed under the terms and conditions of the Creative Commons Attribution (CC BY) license (https://creativecommons.org/licenses/by/4.0/).
Share and Cite
Kolchev, A.; Pasynkov, D.; Egoshin, I.; Kliouchkin, I.; Pasynkova, O.; Tumakov, D. YOLOv4-Based CNN Model versus Nested Contours Algorithm in the Suspicious Lesion Detection on the Mammography Image: A Direct Comparison in the Real Clinical Settings. J. Imaging 2022, 8, 88. https://doi.org/10.3390/jimaging8040088
Kolchev A, Pasynkov D, Egoshin I, Kliouchkin I, Pasynkova O, Tumakov D. YOLOv4-Based CNN Model versus Nested Contours Algorithm in the Suspicious Lesion Detection on the Mammography Image: A Direct Comparison in the Real Clinical Settings. Journal of Imaging. 2022; 8(4):88. https://doi.org/10.3390/jimaging8040088
Chicago/Turabian StyleKolchev, Alexey, Dmitry Pasynkov, Ivan Egoshin, Ivan Kliouchkin, Olga Pasynkova, and Dmitrii Tumakov. 2022. "YOLOv4-Based CNN Model versus Nested Contours Algorithm in the Suspicious Lesion Detection on the Mammography Image: A Direct Comparison in the Real Clinical Settings" Journal of Imaging 8, no. 4: 88. https://doi.org/10.3390/jimaging8040088