
A Calculation and Decomposition Method Embedding Sectoral Energy Structure for Embodied Carbon: A Case Study of China’s 28 Sectors


1
Tsinghua-BP Clean Energy Research and Education Centre, State Key Laboratory of Power Systems, Department of Energy and Power Engineering, Tsinghua University, Beijing 100084, China
2
Tsinghua-Rio Tinto Joint Research Centre for Resources, Energy and Sustainable Development, Laboratory for Low Carbon Energy, Tsinghua University, Beijing 100084, China
*
Author to whom correspondence should be addressed.
Sustainability 2022, 14(5), 2593; https://doi.org/10.3390/su14052593
Submission received: 4 January 2022
/
Revised: 15 February 2022
/
Accepted: 17 February 2022
/
Published: 23 February 2022
(This article belongs to the Special Issue Challenges and Innovations in Low-Carbon Energy)
Abstract
:The measurement and allocation of carbon emission responsibilities is a fundamental issue in China’s low-carbon development. However, existing studies of embodied carbon do not sufficiently consider the sectoral energy structure. In this work, we developed a high-resolution calculation method for embodied carbon that embeds the sectoral energy structure into traditional input–output methods, thus expanding the driving factors of SDA decomposition. Based on this method, we calculated the quantity, final consumption structure, and energy structure of embodied carbon in China’s 28 sectors from 2002 to 2018, drew a carbon emissions allocation Sankey diagram of China in 2018, and calculated the SDA decomposition results for 2002–2010 and 2010–2018. The results indicate that fixed capital formation was still the top contributor of embodied carbon, and it caused more coal consumption. “Construction for fixed capital formation” and “other services for domestic consumption” were the two most important drivers of carbon emissions. The final consumption quantity and energy intensity were the main factors that promoted and inhibited the growth of embodied carbon, respectively, while the effects of the input–output structure, sectoral energy structure, and carbon emission coefficient on reducing carbon emissions were obvious after 2010. This also revealed that policymakers should formulate differentiated emission reduction strategies according to the carbon emission characteristics of key sectors.
1. Introduction
Facing the increasingly severe challenges of climate change, global low-carbon development is imperative. The United Nations Intergovernmental Panel on Climate Change (IPCC) pointed out that if the global warming caused by the continuous increase in carbon emissions is not curbed, it will lead to irreversible changes in the global ecosystem and cause widespread negative impacts. For this reason, it is necessary to keep the global temperature rise in this century below 2 °C higher than the pre-industrial level and strive to further limit the temperature rise to 1.5 °C [1]. This means that people must fundamentally transform traditional production methods, lifestyles, and consumption methods, promote transition and innovation, and follow a green, low-carbon, and circular development path. For this reason, it is necessary to treat the economy, energy, and the environment in the process of climate change as a large system, especially to realize the coordinated development of energy and economy and to build a green, low-carbon, circular, and developmental economic system [2].
China is a typical case for the study of the coordinated development of energy and economy. As the world’s largest energy consumer, the largest carbon-emitting country, and the second largest economy, the contradiction between China’s energy and economic coordinated development is very obvious. On the one hand, China’s target of building a modern and powerful country by the middle of this century puts forward long-term requirements for its rapid and sustainable economic development [3]. On the other hand, China’s government attaches importance to addressing climate change and regards it as an important strategic measure for sustainable development. Starting from the 12th Five-Year Plan period (2011–2015), carbon emissions per unit of GDP have been a binding target for national development [4]. In 2015, China proposed nationally determined contribution targets, such as peaking carbon emissions around 2030 and reaching this peak as soon as possible [5]. Policy measures such as optimizing the energy structure and improving the efficiency of energy resource utilization were proposed to accelerate the green and low-carbon development of the whole society. In 2020, China further pledged to “reach the peak before 2030 and strive to achieve carbon neutrality by 2060” [6]. The policy requirements for carbon emission intensity, the proportion of non-fossil energy, and forest carbon sinks were also strengthened [7]. In 2021, China further positioned the construction of a green, low-carbon, circular, and developmental economic system as an important part of carbon peaking and carbon neutrality [8]. China needs to achieve rapid economic development and low-carbon energy transition at the same time and balance the contradiction between the two, which is “the coordinated development of energy and economy”. Therefore, it is necessary to conduct in-depth research on the coordinated development of energy and economy in China.
In research on the coordinated development of energy and economy, the measurement and allocation of carbon emission responsibilities is one of the key fundamental issues. The energy system and the economic system are complex in composition, and there is a network coupling relationship between them. At present, the research methods in the energy and economic fields do not completely match (see Section 2.1). Studies in the energy field are usually based on energy statistics. From the perspective of producers, carbon emission responsibilities are measured and distributed according to the direct energy consumption and carbon emissions of each sector. Based on economic input–output tables, researchers in the economic field allocate responsibilities according to the embodied energy and embodied carbon in the final consumption of different sectors. Under the guidance of the coordinated development of energy and economy, these two fields have shown a trend of extending in their respective directions. For example, Chong et al. [9] tried to put forward an energy distribution analysis method that integrates commodity production and consumption from the perspective of producers, in order to analyze the relationship between commodity production and energy consumption in China. Zhang et al. [10] studied the energy embodied in construction services in China’s economic development from the perspective of consumers. However, the former did not involve carbon emissions, while the latter did not consider factors on the production side; the energy structure of various sectors has not been further considered. Therefore, it is necessary to develop a method of measuring and distributing embodied carbon that can not only consider the distribution of energy structure in economic sectors but also consider economical input–output relationships to solve this problem.
On the basis of measurement and allocation, another important issue is to clarify the impact of relevant driving factors on embedded carbon to better understand trends and formulate policies. In this regard, the structural decomposition analysis method (SDA) based on the input–output method is a common research method. Compared with the general index decomposition analysis method (IDA), SDA has higher data requirements and must rely on complete input–output data. The advantage of SDA is that it can use input–output models to comprehensively analyze various direct or indirect driving factors, such as the input–output relationship between sectors, the energy consumption of each sector, and the quantity and structure of final consumption. Many scholars also use this method to study carbon emissions in China and other countries and regions (see Section 2.2). However, we found that current research does not consider sectoral energy structure as an independent driving factor in the SDA research related to carbon emissions. The reason is that the existing embodied carbon calculation methods either ignored the energy structure at the sector level or calculated the input–output calculations after calculating the direct carbon emissions of each sector. In other words, there is still a lack of appropriate methods in SDA to embed the sectoral energy structure into the research framework of embodied carbon calculation and driving factor analysis.
The purpose of this paper is to embed the sectoral energy structure into the traditional calculation methods of embodied carbon to realize the traceability from embodied carbon in final consumption to various energy varieties directly consumed by various sectors. On this basis, the driving factors of the existing SDA method are expanded. We use China as a case study to verify the feasibility and significance of the method. We calculated the embodied energy and embodied carbon in the final consumption of 28 sectors in eight specific years from 2002 to 2018 in China to observe historical trends and the status quo. To show the status quo of carbon emission of China’s energy economy system, we drew a carbon emission allocation Sankey diagram of China in 2018 for 28 sectors and four energy varieties and described the key sectors. We also conducted SDA decomposition analysis on the embodied carbon in the two periods of 2002–2010 and 2010–2018 to analyze the impact of various driving factors, including energy structure.
The main contributions of this paper are as follows:
- (1)
- We developed a set of embodied energy and embodied carbon measurement and distribution methods considering the sectoral energy structure and calculated the embodied energy and embodied carbon of 28 sectors in eight specific years in China from 2002 to 2018.
- (2)
- We further expanded the driving factors of SDA, and we analyzed the embodied carbon growth in China during the two periods of 2002–2010 and 2010–2018.
The contents of this paper are as follows. A literature review is introduced in Section 2, including a carbon emission responsibilities study based on different perspectives in Section 2.1, and a research review on carbon emission SDA in Section 2.2. The methodology and data sources are provided in Section 3. The results and discussion are shared in Section 4. The policy recommendations are given in Section 5, and conclusions and recommendations are presented in Section 6.
2. Literature Review
2.1. The Measurement and Distribution Method of Embodied Carbon
In recent years, scholars have proposed a series of energy consumption and carbon emission responsibility allocation methods. According to Zhang [11] and Zhang et al. [12], the current mainstream methods are mainly divided into two categories: methods based on producer responsibility and methods based on consumer responsibility.
The method of producer responsibility specifies that “who produces is responsible”. The responsibility for energy consumption and carbon emissions is directly assigned to the sector or region where the emissions occur [11]. As the logic is concise and clear, the division of responsibilities is clear, and the difficulty of data statistics is relatively low, this method is currently the most widely used method of distribution of responsibilities. For example, most of the existing research on direct energy consumption or carbon emissions [13,14,15,16,17,18,19], the official statistics of various countries [20,21,22], and the energy consumption and carbon emissions data released by institutions such as the IEA [23] and the World Bank [24] are all based on the method of producer responsibility. China’s “3060” dual-carbon target, as well as key indicators such as energy consumption and carbon emission control targets in the national energy plan [25], are also proposed based on this method. The method based on producer responsibility is often used in research in the energy field for the analysis of the impact of various production factors such as industrial structure and energy intensity on energy consumption and carbon emissions from the perspective of commodity production. However, this method ignores the significant roles played by final consumption sectors in the process of energy consumption and carbon emissions [9]. Under this responsibility distribution model, all the responsibilities are borne by the production sector, while the final consumption sector bears hardly any responsibility for energy consumption and carbon emissions. In order to solve this problem, scholars have begun to pay attention to the perspective of consumer responsibility.
The method of consumer responsibility specifies that the final consumption region and sector should be responsible for the energy consumption and carbon emissions generated during the production of energy, goods, and services [26]. In the economic system, various regions and sectors are interdependent and integrated. For the products of some regions and sectors, while satisfying the demand for their own final consumption, more products are used to meet the needs of other regions and downstream sectors for intermediate-use commodities [10]. In this process, the energy consumption and carbon emissions generated by the production sector will flow into the intermediate use and final consumption of other regions and sectors in the form of embodied energy and embodied carbon. From this perspective, the final consumption regions and sectors should shoulder the responsibility for this part of energy consumption and carbon emissions. Since it is closely integrated with the economic input–output table, the method based on consumer responsibility can be used to better analyze the impact of economic factors such as final consumption quantity and the input–output structure on energy consumption and carbon emissions, which is conducive to reducing excessive high-carbon products. However, Chong et al. [9] pointed out that among the two commonly embodied carbon calculation methods, the mixed input–output method would lose the economic information of energy-related sectors, resulting in economic non-conservation. The energy intensity method would lose the information of production factors such as the sectoral energy structure in calculation process, which is not conducive to obtaining policy enlightenment on the energy side.
Under the guidance of the issue of the coordinated development of energy and economy, these two fields have shown a trend of extending each other. For example, Chong et al. [9] tried to propose an energy distribution analysis method that integrates commodity production and consumption from the perspective of producers in order to analyze the relationship between commodity production and energy consumption in China. However, the study did not involve the issue of carbon emissions. From the perspective of consumers, Zhang et al. [10] studied the energy embodied in construction services in the process of China’s economic development. However, this study did not further consider the energy structure of various sectors. Therefore, it is necessary to develop a new method to preserve and present the energy information in the embodied carbon calculation process while ensuring the conservation of energy and economy. This new method can improve measurement accuracy and strengthen the connection between production-side factors and consumption-side factors in related research. It is also more conducive to attain the policy improvement of considering both the energy side and the economic side.
2.2. The SDA Study of Embodied Carbon
Facing the continuous increase in carbon emissions, scholars have carried out numerous studies to observe the main driving forces of China’s carbon emissions growth. As shown in Table 1, the SDA method is widely used to study the historical trend of carbon emissions and reveal the impact of key driving factors. In these studies, population, per capita final consumption, the input–output structure (Leontief inverse matrix), and carbon emission intensity are generally considered to be the key driving factors affecting embodied carbon [27]. In addition to these key driving factors, many scholars further expanded the factors on the economic side, including production structure [28,29,30], technological change [31,32,33], urbanization rate [34], consumption mode [28,34,35], and per capita income [36]. However, for the driving factors of the energy side, the resolution of the existing research is insufficient. A considerable number of studies include only one energy side driving factor of carbon emission intensity. In fact, the carbon emission intensity of a region or sector is determined by the three elements of carbon emission coefficient, energy structure, and energy intensity. However, the existing research has not completely disassembled these three elements. Ninpanit et al. [32] divided carbon emission intensity into energy intensity and carbon emission coefficient but did not further divide energy structure from the carbon emission coefficient. Yang et al. [37] and Ma et al. [38] divided carbon emission intensity into energy intensity and energy structure but did not further divide the carbon emission coefficient from energy structure. Feng et al. discussed the carbon emissions of the direct consumption of different energy varieties in the economic sector but did not include the energy structure as an independent driver in the SDA study [39]. Only Dong et al. [40] regarded the energy structure as a separate driving factor when studying China’s carbon emission intensity. Therefore, further disassembling carbon emission intensity into three driving factors—the sectoral energy structure, sectoral energy intensity, and carbon emission coefficient—is of significance for improving the resolution of related research and better distinguishing the impact of production-side and consumption-side driving factors on embodied carbon.
3. Methodology and Data
Based on the traditional energy intensity method, in this paper, we introduce the sectoral energy structure, so as to preserve the energy information on the production side while maintaining the conservation of energy and economy. The specific method is introduced in the following subsections.
3.1. Calculation of Embodied Energy and Embodied Carbon
3.1.1. Construction of General Input–Output Table
The calculation of embodied energy and embodied carbon is based on the mixed input–output method. The structure of a general economic input–output table is shown in Table 2 [10]. In the table, all symbols represent economic quantities. Among them, x represents the economic quantity of products of each sector used for intermediate use. F represents the economic quantity of products of each sector used for final consumption. T represents the total output and total input of each sector. The subscript i represents the sector that provides intermediate use in the process of intermediate input–output, and the subscript j represents the sector that obtains the intermediate use. Due to the principle of general equilibrium, the total input of each sector is equal to the total output.
Next, we define the direct consumption coefficient:
The direct consumption coefficient is the quantity of the product of sector i that must be input in order to produce 1 unit of the product of sector j.
In the input–output table, each row has “intermediate use + final consumption = total output”. A great portion of imports are consumed as intermediate goods in the process of commodity input and output. The embodied carbon in imports also flows into final consumption in this process. Therefore, the embodied carbon in imports is also one of the sources of embodied carbon for final consumption [51].
If each element in the formula is expressed in matrix form, then Formula (4) can be expressed as Formula (9).
The mathematical relationship between final consumption F and total output T can be established by Formula (9). The matrix L is also called the Leontief inverse matrix.
The element is the quantity of all products i that need to be directly and indirectly inputted in order to obtain a unit of final consumption product j, which also refers to the total social output of products i. When the final consumption quantity of sector j is , the total output quantity of the whole society that needs to be input is .
3.1.2. Introduction of Sectoral Energy Structure
We use to express the direct energy consumption of sector i. For intermediate input sector i, in the entire production process, the actual number of products produced is the total output , and the amount of energy intensity is .
The energy consumption of sector i is expressed as follows:
where the subscript p represents different energy varieties. Correspondingly, the carbon emission coefficient of each energy variety is expressed as .
For final consumption sector j, when the final consumption quantity is , the total output quantity of the whole society is . For the embodied energy in the final consumption of sector j, the quantity is equal to all the energy consumed in the production process of the corresponding total output of the whole society.
We use EE and EC to denote the amount of embodied energy in the final consumption of each sector. For sector j, the quantities of embodied energy and embodied carbon in final consumption are calculated by Formulas (12) and (13), respectively:
For imports, we assume that the quantities of embodied carbon in a unit of imports are the same as those of domestic products in the same sector.
3.2. SDA Decomposition Calculation
After the sectoral energy structure is introduced in the measurement and distribution of embodied carbon, the SDA decomposition formulas for embodied carbon can be further developed, as shown in Formulas (15), where the subscript q represents the final consumption structure.
Formula (15) can be sorted into the form of Formula (16), where represents the final consumption quantity of each sector. represents the structure of final consumption in various sectors. represents the input–output structure. represents the unit energy consumption in the actual production process of each sector. represents the energy structure of each sector. represents the carbon emission coefficient of each energy type. shows that the embodied carbon comes from the energy p consumed by sector i and finally flows into the final consumption of q in sector j.
The SDA decomposition of embodied carbon can also be developed around Formula (16). In this way, the impact of the six driving factors can be analyzed: final consumption quantity, final consumption structure, input–output structure, sectoral energy intensity, sectoral energy structure, and carbon emission coefficient. The specific SDA calculation formula is shown in Table 3.
3.3. Data Source
Due to the availability of input–output tables, we selected as the research objects China’s energy consumption and carbon emissions in eight specific years from 2002 to 2018: namely, 2002, 2005, 2007, 2010, 2012, 2015, 2017, and 2018 [20]. All economic data came from eight input–output tables, and the energy consumption data of each sector came from the energy balance table and the final energy consumption table by sector in the China Energy Statistical Yearbook [52]. The carbon emission coefficient of fossil energy comes from the IPCC [1]. The carbon emission coefficient of electricity is calculated according to the power generation structure of each year. It should be noted that energy consumption here refers to the end-use energy consumption of various sectors. The conversion of fossil energy into electricity and heat belongs to the intermediate conversion of the energy system, so there is no double calculation of carbon emissions from electricity. To ensure the consistency between the input–output table and the energy statistical yearbook for each sector, we merged the input–output tables of the 8 years into the input–output tables of 28 sectors. The codes and names of the 28 industries are shown in Table 4. The value range and meaning of each subscript are shown in Table 5. In order to make the results more continuous, we use the linear interpolation method to estimate the embodied energy and embodied carbon data in other years.
4. Results and Discussion
Based on the above method, we calculated the embodied energy and embodied carbon of 28 sectors in 8 years in China from 2002 to 2018 and drew the carbon emissions allocation Sankey diagram of China in 2018. The SDA decomposition of embodied carbon in China’s final consumption in the two time periods of 2002–2010 and 2010–2018 was also carried out.
4.1. Embodied Energy and Embodied Carbon in 2002–2018
Due to the large number of 28 sectors, which is not conducive to the observation of readers, we merged sectors 2–24 into the industry sector. Please refer to Appendix A for detailed data on the embodied energy and embodied carbon of the 28 sectors.
4.1.1. Embodied Energy and Embodied Carbon in Final Consumption
From 2002 to 2018, the embodied energy in China’s final consumption continued to grow, but the growth rate gradually slowed down, as shown in Figure 1. The industry sector was still the sector with the most embodied energy. After 2012, the quantity of embodied energy in the industrial sector stopped growing and began to show a downward trend. The construction sector and the other services sector had the second and third-highest proportions of embodied energy, respectively, and their growth rates were significantly higher than those of other sectors. The agriculture sector; the wholesale, retail trade, and hotels, restaurants sector; and the transport, storage, and post sector accounted for a small proportion of the embodied energy in final consumption.
The development trend of embodied carbon was similar to that of embedded energy, but the total quantity of embodied carbon stabilized after 2012, as shown in Figure 2. The total quantity of the industry sector began to decline significantly after 2012. Compared with embedded energy, part of the difference in the development of embodied carbon was mainly due to China’s efforts to adjust its energy structure and promote renewable energy. The proportion of coal consumption in China dropped from 68.5% in 2002 to 59.0% in 2018. The proportion of coal power in electricity production also dropped from 80.9% to 71.1%. This also enabled China to maintain the stability of the total quantity of embodied carbon while the embodied energy continued to grow.
4.1.2. The Energy Structure of Embodied Carbon
Figure 3 shows the percentage of carbon emissions from different end-use energies in the final consumption of embodied carbon in 2002–2018. Coal and electricity were the two main sources of embodied carbon, and the proportion of embodied carbon derived from electricity surpassed that of coal in 2015. In 2018, the proportions of embodied carbon derived from electricity and coal were 45.7% and 33.7%, respectively. The embodied carbon derived from petroleum has been maintained at about 15% for a long time. The quantity of embodied carbon derived from natural gas was small but showed a continuous growth trend.
Specific to the sector level, there were obvious differences in the energy structure of different sectors’ embodied carbon, as shown in Figure 4. For example, the sectors with a high proportion of coal in embodied carbon were mainly concentrated in industry (sectors 12–20) and construction (sector 25), while the industries with the highest proportion of electricity were industry 22 (electric heating production) and industry 24 (water production). Sectors with a relatively high proportion of oil mainly included industry 11 and industry 27 (oil-related industries and transportation), while sectors with relatively high proportions of natural gas included industry 3 and industry 23 (both natural gas-related industries).
4.2. The Carbon Emissions Allocation Sankey Diagram of China in 2018
To demonstrate the measurement and distribution methods of embodied carbon after the introduction of the sectoral energy structure, we describe the flow of embodied carbon in 2018 in the form of a carbon emissions allocation Sankey diagram in Section 4.2.1. The carbon allocation Sankey diagram shows in detail the entire process from the direct consumption of the four energy types in various sectors to produce carbon emissions to the inflow of embodied carbon into the final consumption of various sectors.
4.2.1. The Carbon Emissions Allocation Sankey Diagram in 2018
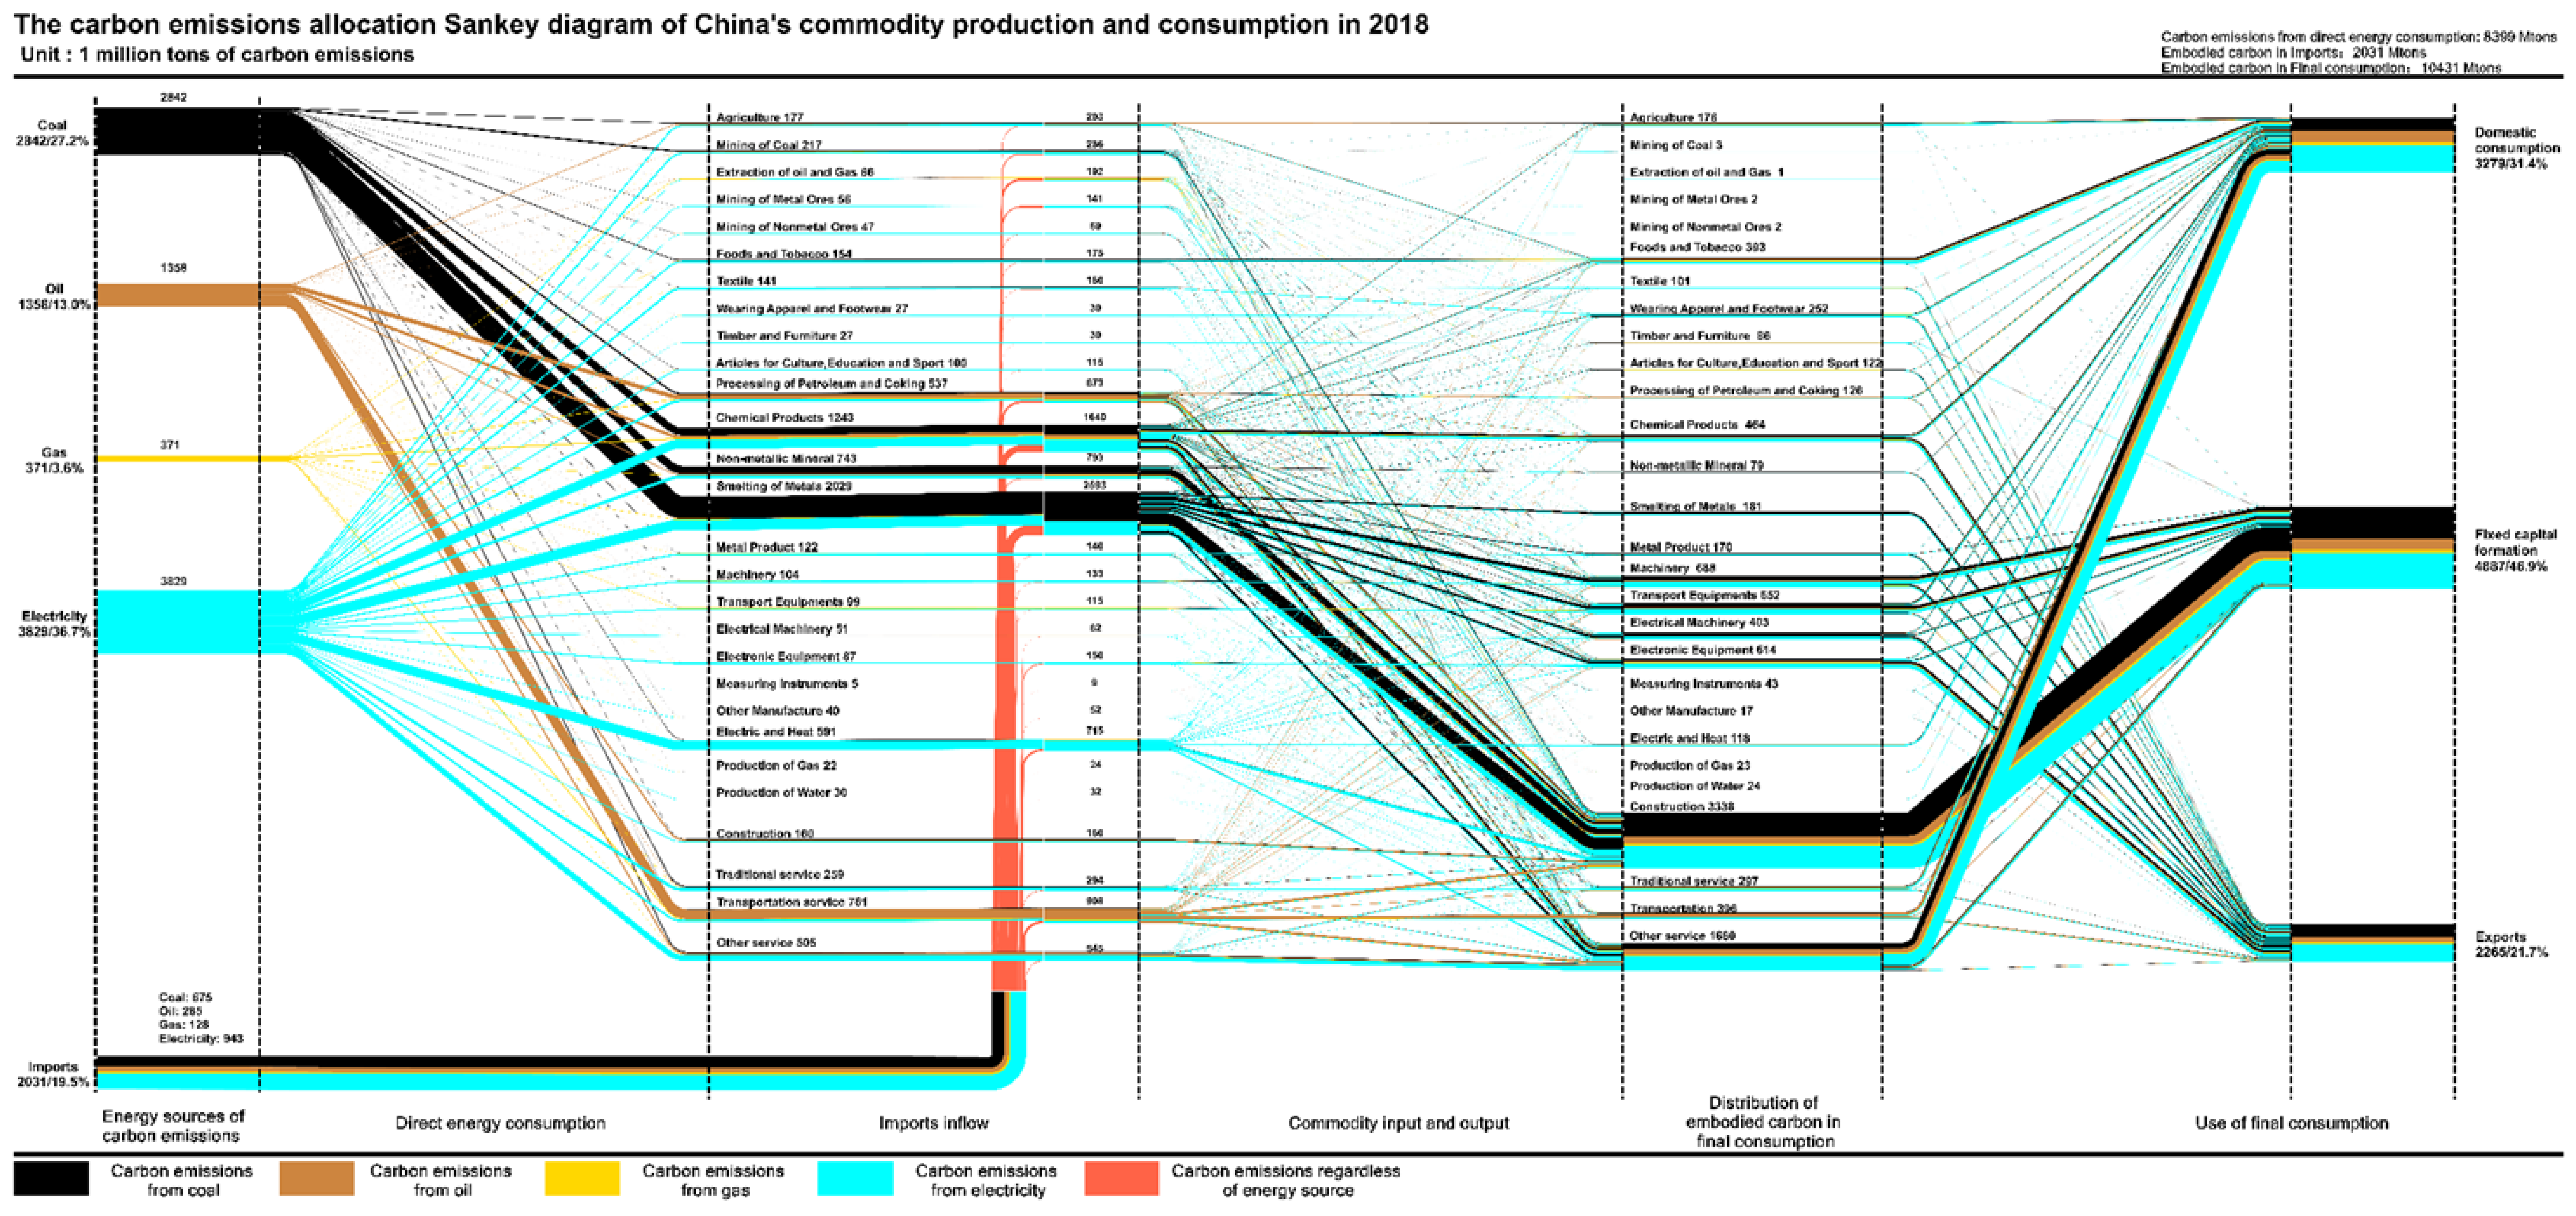
Figure 5 shows the carbon emissions allocation Sankey diagram of China in 2018. In the figure, all flows represent carbon emissions. The color of the flow indicates the energy type of the carbon emission source, and the width of the flow indicates the quantity of carbon emissions. From left to right, there are the energy sources of carbon emissions, the direct carbon emissions generated by energy consumption of each sectors, and the embodied carbon in the intermediate use of commodities flowing into the final consumption commodities of various sectors.
In 2018, the total quantity of embodied carbon in China’s final consumption was 10.43 billion tons. The direct carbon emissions of economic sectors were 8.40 billion tons, and the quantity of embodied carbon in imports was 2.03 billion tons. From the perspective of energy sources of carbon emissions, electricity was the largest source of carbon emissions, followed by coal and oil. Sector 14 had the most direct carbon emissions, generating 2.03 billion tons of carbon emissions, accounting for 24.2% of the direct carbon emissions of all economic sectors. Sector 14 also had the largest coal consumption, accounting for 44.7% of direct coal consumption. In addition, sectors with more direct carbon emissions also included sector 12, sector 27, sector 13, and sector 22. From the perspective of embodied carbon in final consumption, sector 25 had the highest quantity of embodied carbon, reaching 3.34 billion tons and accounting for about 32% of the total amount of embodied carbon in China. The quantity of carbon embedded from coal was 1.390 billion tons, accounting for 39.5% of all carbon embedded from coal. Sector 28 had the second-highest quantity of embodied carbon, with 1.66 billion tons. In the use of final consumption, fixed capital formation accounted for the most (46.9%), and the proportion of embodied carbon from coal was significantly higher than the other two. The proportions of embodied carbon in domestic consumption and exports were 31.4% and 21.7% respectively.
Tracing the data back from final consumption, we can see that the carbon emissions o’ China’s economic sectors were mainly driven by two industrial chains. In the first chain, fixed capital formation required a large quantity of sector 25′s final consumption, which drove the direct carbon emissions of multiple industrial sectors, especially sector 14. This industrial chain has also driven a high amount of coal consumption. In the second chain, domestic consumption required a large quantity of sector 28′s final consumption, which drove the direct carbon emissions of multiple industrial and service sectors. In this chain, the main energy source of embodied carbon was electricity. Considering the rapid development of renewable power, the second chain undoubtedly has greater emission reduction potential. This also shows that China should reasonably control the growth of fixed capital formation while continuously expanding domestic consumption.
4.2.2. Key Sectors of Carbon Emissions
Among the 28 sectors, sector 14 (smelting and pressing of metals sector) and sector 25 (construction sector) had the most direct and embodied carbon emissions, respectively, and they could also be considered as the top sectors of carbon emissions. The two departments also showed two different carbon emission responsibility allocation modes. Figure 6 and Figure 7 show Sankey diagrams of the carbon emissions related to these two sectors.
Sector 14 was the most important sector in terms of producer responsibility. The direct carbon emission of sector 14 was 2.03 billion tons, accounting for 24.2% of the direct carbon emission of China’s economic sector. The carbon emission from coal consumption was 1.36 billion tons, accounting for 46.9% of coal-related carbon emissions. The embodied carbon in imports of sector 14 was 554 million tons. However, most of the direct carbon emissions of sector 14 were used to meet the final consumption needs of other sectors. Only 137 million tons of sector 14’s direct carbon emissions (about 5.3%) flowed into the final consumption of sector 14. The quantity of embodied carbon flowing into sector 25 reached 1.06 billion tons, accounting for 40.8%. In addition, the quantities of embodied carbon flowing into sector 16, sector 17, sector 28, and sector 18 were also greater than the quantity of embodied carbon flowing into the final consumption of sector 14. Meanwhile, the quantity of embodied carbon flowing into sector 14 from other sectors was only 43 million tons. Therefore, although sector 14 had the most direct carbon emissions, its carbon emissions actually served the final consumption of other sectors.
Sector 25 was the most important sector in terms of consumer responsibility. Its direct carbon emissions were only 158 million tons, while the embodied carbon in final consumption reached 3.34 billion tons. In other words, 95.3% of the embodied carbon in sector 25’s final consumption came from the direct carbon emissions of other sectors, especially sector 14, sector 13, sector 12, sector 22, sector 11, and sector 17. Almost all the embodied carbon of sector 14 was used for fixed capital formation. Only 2 million tons of sector 25’s direct carbon emissions flowed into the final consumption of sector 28. Therefore, although the direct carbon emissions of sector 25 were limited, they drove other upstream sectors to produce a large amount of direct carbon emissions.
4.3. The SDA Decomposition of Embodied Carbon in Final Consumption
Based on the extended SDA method, we divided 2002–2018 into two periods—2002–2010 and 2010–2018—and the SDA decomposition results are shown in Figure 8.
From 2002 to 2010, the embodied carbon in final consumption increased by 5.15 billion tons. The final consumption quantity was the ultimate factor in promoting the growth of carbon emissions, contributing 8.36 billion tons of embodied carbon growth. The input–output structure, final consumption structure, and sectoral energy structure contributed 1.81 billion tons, 17 million tons, and 1 million tons of embodied carbon growth, respectively. The main restraining factor was energy intensity, which reduced 4.98 billion tons of embodied carbon. The carbon emission coefficient also brought about a reduction of 54 million tons.
From 2010 to 2018, the embodied carbon in final consumption increased by 856 million. The final consumption quantity was still the most important growth driving factor, bringing about 7.07 billion tons of embodied carbon growth. The second most important factor was the final consumption structure, which contributed 28 million tons of growth. The main restraining driving factors were the input–output structure and sectoral energy intensity, which reduced 2.77 billion tons and 2.72 billion tons of embodied carbon, respectively. In addition, the sectoral energy structure and the carbon emission coefficient also reduced 305 million tons and 447 million tons of embodied carbon, respectively.
4.3.1. Final Consumption Quantity
In 2002–2010 and 2010–2018, the increase in final consumption contributed 8.35 billion tons and 7.07 billion tons of embodied carbon growth, respectively, as is shown in Figure 9. In all sectors, the quantity of final consumption in most sectors increased, which led to the increase in embodied carbon. Among them, sector 25 (construction sector) had the largest increase, contributing 2.22 billion tons and 2.75 billion tons of embodied carbon in the two periods, respectively. This was followed by sector 28 (other services sector), which contributed 990 million tons and 1.46 billion tons of embodied carbon in the two periods, respectively. In the two periods, only a few sectors’ final consumptions did not increase, such as sector 2 and sector 3. Meanwhile, it should also be noted that the increase in most industrial sectors in 2010–2018 was less than the increase in 2002–2010, while the increase in the service sector in 2010–2018 was greater than the former. To a certain extent, this reflects the country’s industrial adjustment trend from manufacturing to service industries.
4.3.2. Final Consumption Structure
Since the final consumption structure only affected the distribution of final consumption and did not involve changes in quantity or efficiency, its impact on the total quantity of embodied carbon was close to zero, as is shown in Figure 10. However, in terms of structural changes, the two periods showed completely different results. From 2002 to 2010, as China joined the WTO and gradually became the “world’s factory”, the proportion of exports in final consumption increased significantly, especially the export volume of industrial products. At the same time, to meet the increasing demand for industrial production, related sectors carried out a large number of capacity expansions. As a result of these changes, exports and fixed capital formation brought more embodied carbon to final consumption, while the embodied carbon in domestic consumption decreased. From 2010 to 2018, with the advent of the international financial crisis and the end of China’s infrastructure construction wave, China began to shift to a development strategy focusing on the domestic market. Domestic consumption started to bring more embodied carbon growth, and the quantity of embodied carbon caused by exports and fixed capital formation began to decrease.
4.3.3. Input–Output Structure
In 2002–2010, changes in the input–output structure increased the embodied carbon by 1.81 billion, and between 2010 and 2018, it reduced 2.77 billion tons of embodied carbon, as is shown in Figure 11. Specific to the sector level, from 2002 to 2010, only the input–output structure of sector 26 (wholesale, retail trade, and hotels, restaurants) inhibited the growth of embodied carbon. In 2010–2018, changes in the input–output structure of all sectors inhibited the growth of embodied carbon.
In the two periods, the impact of the input–output structure showed significant differences. From 2002 to 2010, the change in embodied carbon brought by the input–output structure was positive, which meant that to produce a unit of final consumption product, more intermediate goods needed to be consumed, which brought more carbon emissions. In 2010–2018, the impact of the input–output structure was the opposite. Based on our analysis, we believe that this phenomenon corresponded to different stages of China’s industrial upgrading: from 2002 to 2010, China was in the early stage of industrial upgrading, and various sectors were expanding rapidly and relatively extensively. In this process, some relatively backward production capacity construction would inevitably appear. At the same time, as the links between different sectors in China became increasingly close, some sectors began to shift to the production of higher-precision products, which also increased the intermediate use input required to produce a unit of final product. In 2010–2018, on the one hand, industrial upgrading began to reap results, and the added value of output products increased significantly. Correspondingly, the intermediate use of unit economic output decreased. On the other hand, China also banned some backward production capacity, and the overall efficiency of intermediate use was improved.
The change in the impact of the input–output structure on embodied carbon showed that China’s industrial upgrading and structural adjustment not only contributed to sustained economic growth, but also were effective in reducing carbon emissions. With the overall advancement of “China Smart Manufacturing 2025”, quality first, structural optimization, and green development would be the basic policies for economic development. It is foreseeable that this development direction will continue to play a role in reducing carbon emissions in the future.
4.3.4. Sectoral Energy Intensity
It should be emphasized that the energy intensity mentioned here does not mean “energy consumption/sector added value” in the usual sense but refers to “energy consumption/sector total output”. Taking the total output of the industry as the denominator can better reflect the energy utilization efficiency of each sector during production and achieve an energy balance in the entire calculation.
In the two periods, the decrease in energy intensity reduced 4.98 billion tons and 2.72 billion tons of embodied carbon, respectively, as is shown in Figure 12. Specific to the sector level, except for industry 11 (processing of petroleum, coking, and processing of nuclear fuel) and industry 21 (other manufacturing, utilization of waste resources, and repair service equipment), whose energy intensity increased in 2010–2018, all industries maintained their energy intensity reduction during the two periods. Among them, the impact of reduced energy intensity was particularly prominent in industry 12 (manufacture of chemical products), industry 13 (manufacture of non-metallic mineral products), and industry 14 (smelting and pressing of metals). In addition, industry 22 (production and supply of electric power and heat power) experienced a significant reduction in energy intensity between 2002 and 2010.
4.3.5. Sectoral Energy Structure
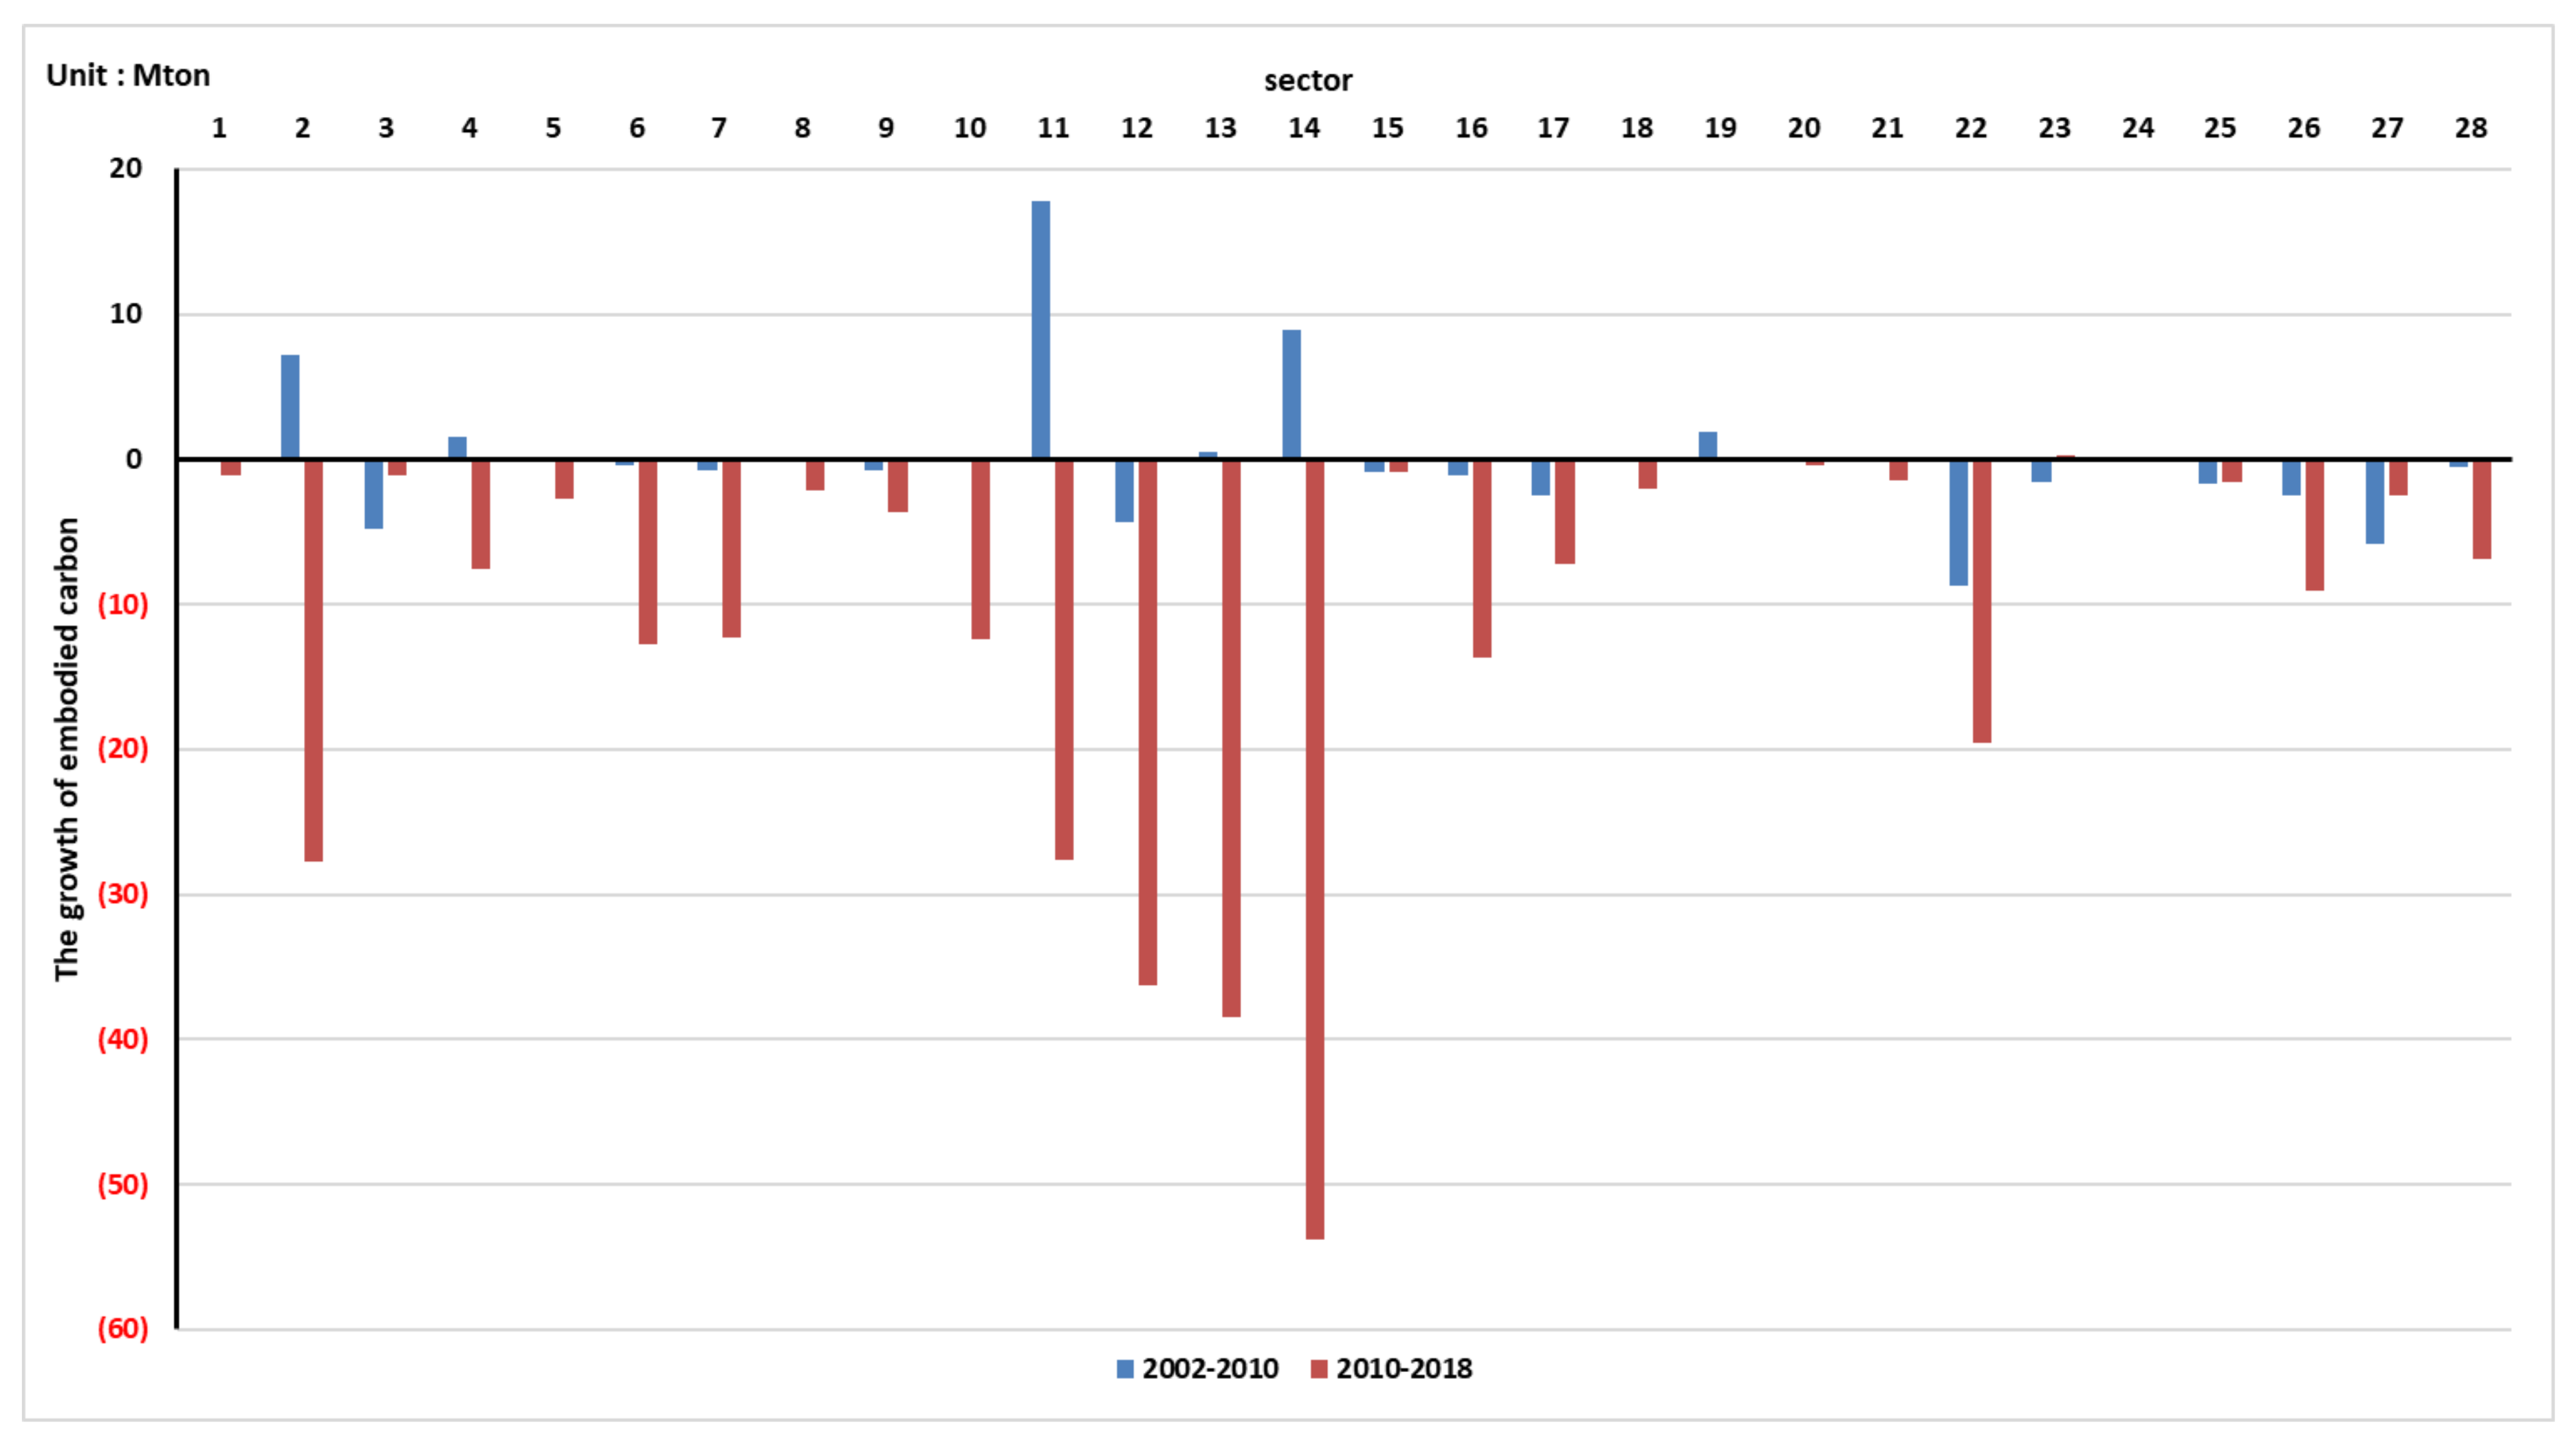
In 2002–2010, the adjustment of the sectoral energy structure brought 1 million tons of embodied carbon growth, while in 2010–2018, the total amount decreased by 305 million tons of embodied carbon, as is shown in Figure 13. On the whole, the adjustment of the energy structure was mainly reflected in a substantial reduction in the use of coal and an increase in the proportion of electricity and natural gas. In 2002–2010, the adjustment of the sectoral energy structure was relatively slow, so the impact on embodied carbon was limited. In 2010–2018, due to the country’s vigorous promotion of coal-to-gas and coal-to-electricity measures, the effect of reducing embodied carbon was obvious.
Specific to the sector level, the adjustment of the energy structure in several sectors was relatively more obvious, as is shown in Figure 14. In 2002–2010, sector 2, sector 11, and sector 14 increased the use of coal, thereby increasing carbon emissions. Sector 3 and sector 27 used more natural gas, and sector 22 used electricity instead of coal consumption. Both adjustments reduced carbon emissions. In 2010–2018, almost all sectors reduced the use of coal and oil and switched to more natural gas and electricity, thus reducing carbon emissions, especially sector 2, sectors 11–14, and sector 22. Only sector 23 replaced oil consumption with natural gas, coal, and electricity, resulting in an increase in total carbon emissions.
Comparing the two periods, it is obvious that the national policy of adjusting the energy structure and reducing coal use played a significant role in reducing emissions in the second period. Considering China’s dual-carbon target requirements, the adjustment of the energy structure will continue. Meanwhile, due to the rapid development of renewable electricity, the carbon emissions per unit of electricity will continue to decrease, and the adjustment of the energy structure has more room for emission reduction. This result also confirms the necessity of incorporating the sectoral energy structure into the SDA method of embodied carbon.
4.3.6. Carbon Emission Coefficient
Since the carbon emission coefficient of fossil energy is considered to be constant, only the change in electricity’s carbon emission coefficient affected the quantity of carbon emission. Due to the change in the power generation structure, especially the development of renewable power, the carbon emission coefficient of power decreased from 2.15 in 2002 to 2.11 in 2010, and further reduced to 1.89 in 2018 (unit: ton/ton tce). In the two time periods, the reduction in electricity’s carbon emission coefficient contributed 54 and 447 million tons of carbon emission reduction, respectively. With the proposal of China’s “3060” targets, the rapid development of renewable power is obvious. Therefore, the carbon emission coefficient of electricity will further contribute to reducing carbon emissions in the future.
5. Policy Implications
5.1. Formulate Long-Term Plans for Infrastructure Construction to Avoid Capacity Waste
Although the proportion of domestic consumption was rising year by year in the two periods studied, fixed capital formation still accounted for the largest proportion of final consumption. Whether it was the large-scale export of industrial products from 2002 to 2010 or the efforts to form a new pattern of domestic large-scale circulation in recent years, the proportion of fixed capital formation in embodied energy and embodied carbon has not shown a downward trend. With the beginning of a new round of infrastructure construction in 2020, it can be foreseen that for a period in the future, the fixed capital formation will still occupy a larger share of final consumption in China. Section 4.2 also indicated that compared with domestic consumption and exports, fixed capital formation would lead to more coal consumption, indicating the possibility of more carbon emissions. Therefore, formulating a long-term plan for infrastructure construction, avoiding repeating the problem of capacity fluctuations in history [51], and realizing the efficient use of embodied energy and embodied carbon should be the focus of future work.
5.2. Continue to Advance the Adjustment of Energy Structure and Develop Non-Fossil Electricity
The adjustment of the energy structure is of significance to China’s long-term low-carbon strategy. With the national “3060” goal proposed, it is inevitable that renewable electricity will become the main energy source in the future. This means that the proportion of electricity in energy consumption will continue to increase, while the proportion of non-fossil electricity in electricity will continue to increase. Taking 2018 as an example, if the electricity consumption of various sectors is increased by 1% in the form of “coal-to-electricity”, the total embodied carbon in the society can be reduced by about 0.4%. If the proportion of non-fossil electricity in electricity production increases by 1%, the total embodied carbon in the whole society will decrease by 0.6%. Therefore, the adjustment of the energy structure, including the development of low-carbon electricity, has a substantial potential for emission reduction in the future.
5.3. Formulate Differentiated Emission Reduction Strategies for Different Sectors
Due to the division of labor in the whole energy economy system, there are obvious differences in the quantity and distribution modes of carbon emissions in various economic sectors. Therefore, it is necessary to formulate differentiated emission reduction measures and low-carbon development paths according to the carbon emission characteristics of different sectors. For key emission sectors on the production side, such as sector 14, emphasis should be placed on improving production efficiency and promoting the cleanness of the energy structure, rather than simply controlling the total amount. The economic production of these sectors actually serves the downstream sectors. Even if the total production of these sectors is controlled, due to the demand of downstream sectors, the country still needs to obtain the same total amount of products through other channels, such as imports. For key emission sectors on the consumption side, such as sector 25 and sector 28, attention should be paid to improving the quality of products and services to improve economic benefits. Meanwhile, the total amounts of some sectors causing more embedded carbon, such as sector 25, must also be properly controlled.
6. Conclusions and Recommendations
In this paper, we developed an embodied carbon calculation method that embedded the sectoral energy structure and used this method to expand the driving factors of embodied carbon SDA decomposition analysis. Based on the method, we calculated the quantity of embodied carbon in 28 sectors in China from 2002 to 2018. By drawing China’s 2018 carbon emissions allocation Sankey diagram, we identified the key industrial chains and sectors of China’s carbon emissions. We also separately decomposed the growth of embodied carbon in the two periods of 2002–2010 and 2010–2018 by SDA decomposition analysis.
The main findings of our work are as follows:
- (1)
- Due to the efforts of energy structure adjustment and non-fossil electricity, while embodied energy continued to grow, the quantity of embodied carbon in China’s final consumption stabilized after 2012. The quantity of embodied carbon in the industrial sectors, which had the highest proportion, began to decrease, while the embodied carbon in the construction sector and the other services sector continued to grow.
- (2)
- The final consumption of the construction sector driven by fixed capital formation and the final consumption of the other services sector driven by domestic consumption were the two most important drivers of carbon emissions, and the former led to more coal consumption. The smelting and pressing of metal sector (sector 14) and construction sector (sector 25) are the largest carbon emission sectors on the production side and consumption side, respectively, and represented two different carbon emission distribution modes.
- (3)
- The most important driving factor for embodied carbon growth was final consumption quantity, while the major inhibitory driving factor was energy intensity. Compared with 2002–2010, the effect of the input–output structure, sectoral energy structure, and carbon emission coefficient on reducing carbon emissions was more obvious after 2010. This also reflects that China’s industrial structure upgrades and energy structure adjustment policies have achieved significant results.
The core value of our work is the embedding of the sectoral energy structure into the existing embodied carbon calculation method, thus expanding the driving factors of the SDA decomposition of embodied carbon. We also drew a high-resolution carbon emissions allocation Sankey diagram of China in 2018 to show the overall picture of China’s energy economy system. After adopting policies such as “coal to electricity” and “coal to gas” and accelerating the adjustment of the energy structure, the energy structure played a significant role in restraining the growth of embodied carbon in 2010–2018. With the continuous development of energy structure adjustment, especially the rapid development of renewable electricity, the energy structure will play a more prominent role in reducing embodied carbon in the future. This confirms the necessity of considering sectors’ energy structure in the calculation and analysis of embodied carbon. Meanwhile, we also put forward the following policy recommendations:
- (1)
- Strengthen long-term planning and implementation of infrastructure construction;
- (2)
- Continue to promote industrial adjustment and upgrading, energy structure optimization, and non-fossil electricity development;
- (3)
- Strengthen the focus on energy conservation and emission reduction in key sectors on the consumer side.
Author Contributions
Conceptualization, Y.Z. and L.M.; Data curation, Y.Z.; Formal analysis, Y.Z.; Investigation, Y.Z.; Methodology, Y.Z.; Resources, L.M.; Software, Y.Z.; Supervision, Z.L. and W.N.; Validation, L.M.; Visualization, Y.Z.; Writing—original draft, Y.Z.; Writing—review & editing, L.M. All authors have read and agreed to the published version of the manuscript.
Funding
This research was supported by the State Key Laboratory of Power Systems in Tsinghua University (Project No. SKLD21M14).
Institutional Review Board Statement
Not applicable.
Informed Consent Statement
Not applicable.
Data Availability Statement
Data is contained within the article.
Acknowledgments
The authors gratefully acknowledge support from BP in the form of the Phase III & Phase IV Collaboration between BP and Tsinghua University and the support from Tsinghua-Rio Tinto Joint Research Centre for Resources, Energy, and Sustainable Development.
Conflicts of Interest
The authors declare no conflict of interest.
Appendix A

Table A1.
The energy consumption of 28 sectors based on producer responsibility from 2002 to 2018 (unit: million tce).
Table A1.
The energy consumption of 28 sectors based on producer responsibility from 2002 to 2018 (unit: million tce).
| Sector | 2002 | 2005 | 2007 | 2010 | 2012 | 2015 | 2017 | 2018 |
|---|---|---|---|---|---|---|---|---|
| 1 | 49.3 | 68.6 | 70.7 | 72.7 | 78.0 | 82.7 | 89.5 | 87.8 |
| 2 | 51.7 | 56.3 | 57.3 | 124.4 | 150.8 | 104.0 | 96.5 | 99.8 |
| 3 | 47.1 | 37.4 | 37.3 | 39.9 | 39.0 | 42.7 | 39.6 | 38.2 |
| 4 | 9.4 | 19.5 | 24.6 | 30.9 | 33.0 | 28.4 | 26.4 | 28.2 |
| 5 | 10.0 | 11.1 | 13.4 | 14.4 | 22.6 | 19.8 | 18.5 | 23.6 |
| 6 | 44.1 | 65.1 | 76.6 | 72.1 | 73.8 | 78.4 | 77.1 | 75.1 |
| 7 | 36.2 | 61.5 | 72.3 | 69.9 | 72.9 | 71.6 | 75.2 | 73.7 |
| 8 | 6.7 | 10.4 | 13.4 | 13.2 | 16.6 | 15.5 | 14.5 | 14.1 |
| 9 | 5.3 | 10.7 | 13.9 | 16.4 | 18.2 | 16.8 | 14.4 | 14.3 |
| 10 | 31.7 | 45.9 | 48.7 | 51.3 | 50.5 | 49.2 | 52.3 | 50.8 |
| 11 | 83.4 | 124.8 | 153.2 | 178.7 | 188.3 | 241.8 | 264.6 | 286.9 |
| 12 | 215.4 | 348.3 | 408.1 | 440.6 | 506.9 | 581.4 | 585.8 | 605.8 |
| 13 | 136.6 | 262.2 | 289.9 | 325.1 | 378.0 | 355.9 | 333.4 | 328.0 |
| 14 | 289.7 | 526.9 | 696.0 | 805.0 | 830.0 | 851.8 | 861.6 | 869.1 |
| 15 | 16.4 | 23.8 | 31.3 | 38.0 | 41.6 | 46.5 | 63.7 | 62.8 |
| 16 | 24.4 | 37.9 | 47.0 | 56.8 | 54.7 | 53.8 | 53.3 | 54.0 |
| 17 | 18.7 | 20.6 | 25.5 | 37.8 | 39.2 | 40.4 | 43.6 | 54.7 |
| 18 | 8.3 | 14.1 | 18.3 | 23.5 | 25.1 | 25.9 | 25.8 | 27.0 |
| 19 | 8.6 | 15.2 | 21.0 | 25.5 | 26.9 | 31.5 | 36.6 | 46.3 |
| 20 | 1.9 | 2.2 | 2.9 | 3.6 | 3.3 | 3.2 | 3.1 | 2.8 |
| 21 | 14.4 | 12.8 | 13.3 | 15.9 | 19.5 | 19.1 | 19.7 | 20.8 |
| 22 | 127.7 | 158.5 | 179.6 | 214.9 | 238.4 | 261.9 | 292.6 | 308.3 |
| 23 | 6.1 | 6.9 | 6.9 | 6.3 | 6.9 | 7.2 | 9.9 | 11.5 |
| 24 | 5.8 | 7.1 | 7.9 | 9.9 | 11.1 | 12.9 | 15.0 | 15.9 |
| 25 | 24.6 | 34.9 | 42.0 | 55.3 | 63.4 | 75.5 | 82.4 | 86.9 |
| 26 | 39.2 | 59.2 | 67.3 | 78.5 | 100.1 | 114.5 | 124.6 | 129.9 |
| 27 | 128.5 | 191.4 | 224.2 | 271.0 | 325.6 | 385.1 | 421.4 | 436.2 |
| 28 | 68.6 | 104.8 | 122.9 | 150.5 | 184.1 | 219.3 | 242.8 | 262.6 |
| Total | 1509.4 | 2338.0 | 2785.5 | 3241.8 | 3598.3 | 3836.5 | 3983.7 | 4114.9 |
Table A2.
The carbon emissions of 28 sectors based on producer responsibility from 2002 to 2018 (unit: million tons).
Table A2.
The carbon emissions of 28 sectors based on producer responsibility from 2002 to 2018 (unit: million tons).
| Sector | 2002 | 2005 | 2007 | 2010 | 2012 | 2015 | 2017 | 2018 |
|---|---|---|---|---|---|---|---|---|
| 1 | 105.9 | 147.6 | 153.5 | 154.8 | 165.4 | 170.4 | 182.8 | 176.7 |
| 2 | 123.4 | 135.9 | 140.6 | 302.1 | 363.4 | 237.2 | 216.5 | 217.0 |
| 3 | 89.3 | 72.7 | 70.3 | 72.7 | 71.1 | 75.5 | 69.4 | 66.3 |
| 4 | 21.0 | 44.8 | 56.6 | 69.6 | 71.4 | 59.2 | 53.2 | 56.0 |
| 5 | 22.9 | 25.7 | 31.7 | 32.4 | 49.0 | 41.2 | 37.2 | 47.1 |
| 6 | 104.5 | 159.4 | 187.0 | 168.7 | 169.4 | 172.8 | 164.5 | 154.3 |
| 7 | 83.0 | 144.2 | 168.7 | 156.9 | 161.2 | 147.5 | 147.8 | 141.1 |
| 8 | 14.9 | 23.9 | 31.0 | 29.4 | 36.4 | 32.1 | 28.4 | 26.8 |
| 9 | 12.6 | 25.5 | 32.8 | 36.9 | 40.6 | 35.3 | 28.4 | 27.1 |
| 10 | 74.2 | 109.2 | 116.2 | 118.6 | 114.6 | 104.0 | 106.9 | 100.0 |
| 11 | 163.3 | 248.2 | 311.8 | 361.3 | 376.9 | 473.8 | 500.3 | 537.1 |
| 12 | 480.3 | 804.6 | 938.7 | 969.5 | 1112.8 | 1249.3 | 1219.7 | 1243.1 |
| 13 | 333.8 | 655.8 | 723.5 | 790.5 | 919.1 | 842.7 | 768.0 | 742.6 |
| 14 | 714.3 | 1316.8 | 1739.8 | 1981.4 | 2035.2 | 2033.1 | 2029.0 | 2028.8 |
| 15 | 36.4 | 52.9 | 70.6 | 81.7 | 89.4 | 93.0 | 122.3 | 122.4 |
| 16 | 56.1 | 88.4 | 110.3 | 127.8 | 121.0 | 112.0 | 106.1 | 103.9 |
| 17 | 42.5 | 46.3 | 57.6 | 80.9 | 82.3 | 79.9 | 82.8 | 99.0 |
| 18 | 18.0 | 31.4 | 40.7 | 50.1 | 53.1 | 51.6 | 49.4 | 50.6 |
| 19 | 17.9 | 32.5 | 45.4 | 53.2 | 55.7 | 61.6 | 69.8 | 86.6 |
| 20 | 4.1 | 4.9 | 6.5 | 7.6 | 6.9 | 6.2 | 5.9 | 5.2 |
| 21 | 31.5 | 28.3 | 29.8 | 34.1 | 41.2 | 38.3 | 37.8 | 39.6 |
| 22 | 289.8 | 355.7 | 406.0 | 468.0 | 507.3 | 520.7 | 569.5 | 591.4 |
| 23 | 14.1 | 14.2 | 14.1 | 12.8 | 14.2 | 13.5 | 19.3 | 21.9 |
| 24 | 12.5 | 15.6 | 17.5 | 20.8 | 23.2 | 25.3 | 28.7 | 30.1 |
| 25 | 49.0 | 69.2 | 82.8 | 106.8 | 122.3 | 141.9 | 152.8 | 159.8 |
| 26 | 89.5 | 136.7 | 155.0 | 174.0 | 220.9 | 240.8 | 255.4 | 258.9 |
| 27 | 234.6 | 345.7 | 403.5 | 482.9 | 578.4 | 675.5 | 736.2 | 761.1 |
| 28 | 144.6 | 225.9 | 265.5 | 315.2 | 383.3 | 437.1 | 474.0 | 504.7 |
| Total | 3384.1 | 5362.0 | 6407.3 | 7260.7 | 7985.7 | 8171.3 | 8262.0 | 8399.1 |
Table A3.
The energy consumption of 28 sectors based on consumer responsibility from 2002 to 2018 (unit: million tce).
Table A3.
The energy consumption of 28 sectors based on consumer responsibility from 2002 to 2018 (unit: million tce).
| Sector | 2002 | 2005 | 2007 | 2010 | 2012 | 2015 | 2017 | 2018 |
|---|---|---|---|---|---|---|---|---|
| 1 | 84.3 | 88.0 | 69.8 | 68.8 | 87.8 | 71.5 | 86.7 | 85.1 |
| 2 | 4.7 | 3.6 | 2.0 | 1.8 | 2.0 | 2.8 | 1.1 | 1.0 |
| 3 | 0.9 | 0.3 | 0.0 | 0.0 | 0.0 | 0.0 | 0.0 | 0.0 |
| 4 | 0.0 | 0.0 | 0.0 | 0.0 | 0.0 | 0.0 | 0.0 | 0.0 |
| 5 | 0.4 | 0.4 | 0.0 | 0.0 | 0.0 | 0.0 | 0.0 | 0.0 |
| 6 | 75.2 | 101.7 | 129.7 | 161.8 | 169.1 | 161.7 | 215.9 | 183.8 |
| 7 | 13.4 | 13.9 | 5.6 | 4.8 | 6.9 | 9.6 | 8.4 | 7.0 |
| 8 | 28.0 | 44.4 | 54.8 | 62.9 | 65.4 | 69.9 | 73.4 | 63.9 |
| 9 | 6.5 | 9.6 | 17.4 | 17.4 | 18.4 | 22.3 | 22.7 | 24.1 |
| 10 | 6.7 | 8.5 | 5.7 | 8.5 | 19.2 | 45.1 | 23.8 | 22.3 |
| 11 | 4.1 | 5.2 | 12.4 | 18.7 | 26.4 | 42.0 | 35.0 | 41.3 |
| 12 | 37.7 | 48.2 | 45.9 | 49.8 | 77.0 | 99.0 | 91.9 | 91.4 |
| 13 | 21.3 | 29.0 | 7.0 | 5.8 | 8.7 | 9.8 | 5.8 | 4.9 |
| 14 | 0.9 | 0.9 | 0.0 | 0.0 | 0.0 | 0.0 | 0.0 | 0.0 |
| 15 | 16.9 | 30.7 | 24.1 | 13.9 | 41.2 | 36.9 | 31.2 | 27.3 |
| 16 | 118.5 | 258.1 | 233.0 | 307.8 | 327.0 | 266.6 | 213.1 | 236.8 |
| 17 | 60.2 | 96.5 | 157.7 | 281.4 | 297.8 | 285.3 | 278.8 | 278.7 |
| 18 | 31.2 | 80.5 | 105.7 | 163.9 | 129.9 | 132.2 | 89.2 | 80.2 |
| 19 | 53.0 | 105.6 | 67.4 | 82.6 | 66.9 | 62.0 | 81.1 | 90.1 |
| 20 | 3.8 | 24.8 | 15.0 | 17.8 | 10.5 | 13.9 | 7.3 | 8.9 |
| 21 | 10.4 | 15.0 | 18.2 | 29.1 | 1.8 | 4.1 | 1.9 | 2.4 |
| 22 | 29.1 | 33.2 | 37.7 | 39.3 | 37.7 | 43.8 | 37.0 | 59.0 |
| 23 | 5.2 | 7.1 | 4.9 | 9.9 | 11.5 | 18.0 | 11.5 | 12.4 |
| 24 | 3.0 | 3.2 | 4.5 | 10.8 | 8.5 | 10.8 | 9.8 | 12.3 |
| 25 | 493.8 | 678.6 | 924.1 | 1134.2 | 1285.8 | 1536.2 | 1520.9 | 1584.3 |
| 26 | 57.7 | 79.1 | 91.4 | 78.5 | 87.2 | 92.4 | 106.0 | 113.4 |
| 27 | 42.7 | 69.8 | 59.8 | 56.0 | 109.5 | 110.9 | 161.5 | 154.6 |
| 28 | 271.5 | 463.3 | 413.3 | 512.0 | 576.7 | 688.6 | 756.7 | 820.7 |
| Total | 1481.2 | 2298.9 | 2507.0 | 3137.5 | 3472.8 | 3835.2 | 3870.7 | 4006.0 |
Table A4.
The carbon emissions of 28 sectors based on consumer responsibility from 2002 to 2018 (unit: million tons).
Table A4.
The carbon emissions of 28 sectors based on consumer responsibility from 2002 to 2018 (unit: million tons).
| Sector | 2002 | 2005 | 2007 | 2010 | 2012 | 2015 | 2017 | 2018 |
|---|---|---|---|---|---|---|---|---|
| 1 | 184.3 | 196.2 | 155.7 | 149.1 | 188.3 | 148.3 | 176.0 | 170.0 |
| 2 | 10.9 | 8.4 | 4.8 | 4.1 | 4.6 | 6.1 | 2.3 | 2.1 |
| 3 | 1.8 | 0.6 | 0.0 | 0.0 | 0.0 | 0.0 | 0.0 | 0.0 |
| 4 | 0.0 | 0.0 | 0.0 | 0.0 | 0.0 | 0.0 | 0.0 | 0.0 |
| 5 | 0.9 | 0.9 | 0.0 | 0.0 | 0.0 | 0.0 | 0.0 | 0.0 |
| 6 | 169.8 | 234.7 | 297.8 | 357.9 | 367.9 | 339.4 | 441.0 | 368.0 |
| 7 | 30.1 | 31.8 | 12.8 | 10.5 | 15.1 | 19.9 | 16.8 | 13.8 |
| 8 | 62.3 | 101.2 | 124.5 | 138.2 | 142.0 | 144.8 | 146.6 | 125.2 |
| 9 | 14.6 | 22.1 | 39.9 | 38.7 | 40.3 | 46.7 | 46.2 | 47.9 |
| 10 | 15.2 | 19.7 | 13.2 | 19.1 | 42.8 | 95.7 | 49.3 | 45.1 |
| 11 | 8.3 | 10.7 | 26.3 | 39.0 | 54.3 | 82.9 | 66.8 | 77.8 |
| 12 | 83.4 | 110.0 | 104.4 | 109.2 | 167.6 | 208.4 | 188.6 | 184.8 |
| 13 | 50.6 | 68.7 | 16.8 | 13.5 | 20.3 | 21.8 | 12.6 | 10.6 |
| 14 | 2.2 | 2.1 | 0.0 | 0.0 | 0.0 | 0.0 | 0.0 | 0.0 |
| 15 | 39.1 | 72.1 | 56.8 | 31.8 | 93.9 | 80.4 | 66.7 | 58.0 |
| 16 | 273.1 | 607.0 | 548.7 | 707.0 | 741.2 | 578.9 | 452.7 | 496.2 |
| 17 | 138.1 | 225.6 | 368.4 | 638.8 | 668.1 | 613.7 | 586.9 | 573.5 |
| 18 | 71.7 | 189.2 | 248.9 | 376.3 | 295.5 | 289.7 | 191.9 | 170.1 |
| 19 | 119.3 | 244.1 | 155.0 | 184.5 | 147.9 | 131.4 | 169.0 | 184.3 |
| 20 | 8.7 | 57.5 | 34.5 | 39.8 | 23.4 | 29.8 | 15.3 | 18.4 |
| 21 | 23.4 | 34.3 | 41.9 | 65.1 | 4.0 | 8.6 | 3.9 | 4.8 |
| 22 | 65.6 | 75.2 | 85.8 | 87.5 | 82.5 | 89.6 | 73.9 | 116.1 |
| 23 | 11.7 | 15.3 | 10.4 | 20.9 | 24.1 | 35.5 | 22.2 | 23.5 |
| 24 | 6.6 | 7.1 | 10.0 | 23.3 | 18.1 | 21.8 | 19.3 | 23.8 |
| 25 | 1124.8 | 1570.8 | 2155.1 | 2568.6 | 2920.7 | 3336.8 | 3240.4 | 3326.0 |
| 26 | 128.4 | 179.6 | 204.7 | 170.7 | 188.1 | 190.8 | 212.3 | 222.6 |
| 27 | 84.4 | 139.5 | 119.0 | 110.3 | 211.4 | 208.2 | 297.4 | 282.5 |
| 28 | 598.5 | 1046.4 | 927.7 | 1112.9 | 1239.5 | 1419.0 | 1519.7 | 1620.8 |
| Total | 3327.8 | 5270.6 | 5763.0 | 7016.9 | 7701.3 | 8148.2 | 8017.8 | 8165.8 |
References
- IPCC SPECIAL REPORT: GLOBAL WARMING of 1.5 ºC. Available online: https://www.ipcc.ch/sr15/chapter/spm/ (accessed on 28 January 2022).
- Institute of Climate Change and Sustainable Development. Tsinghua University Comprehensive report on «China’s long-term low-carbon development strategy and transition path». China Popul. Resour. Environ. 2020, 30, 1–25. [Google Scholar]
- people.cn Jintao Hu’s report at the 18th National Congress of the Communist Party of China. Available online: http://cpc.people.com.cn/n/2012/1118/c64094-19612151-2.html (accessed on 4 December 2021).
- State Council of China Outline of the 12th Five-Year-Plan for National Economic and Social Development. Available online: http://www.gov.cn/2011lh/content_1825838.htm (accessed on 4 December 2021).
- Xinhua News Agency Strengthening Action against Climate Change—China’s National Independent Contribution. Available online: http://www.gov.cn/xinwen/2015-06/30/content_2887330.htm (accessed on 4 December 2021).
- Jinping, X. Speech at the General Debate of the Seventy-fifth United Nations General Assembly. Available online: http://www.xinhuanet.com/politics/leaders/2020-09/22/c_1126527690_2.htm (accessed on 4 December 2021).
- Jinping, X. Carrying on the Past and Opening Up a New Journey of Global Response to Climate Change-Speech at the Climate Ambition Summit. Available online: https://www.ccps.gov.cn/xxsxk/zyls/202012/t20201213_145612.shtml (accessed on 4 December 2021).
- Xinhua News Agency Opinions of the Central Committee of the Communist Party of China and the State Council on the Complete, Accurate and Comprehensive Implementation of the New Development Concept to Do a Good Job in Carbon Peak and Carbon Neutrality. Available online: http://www.gov.cn/xinwen/2021-10/24/content_5644613.htm (accessed on 4 December 2021).
- Chong, C.H. Energy Allocation Anaysis and LMDI Method by Integrating the Production and Consumption of Commodities. Doctoral Dissertation, Tsinghua University, Beijing, China, 2020. [Google Scholar]
- Zhang, X. Measurement and Forecast Method of Construction Services-related Energy Consumption in Economic and Industrial Development. Doctoral Dissertation, Tsinghua University, Beijing, China, 2019. [Google Scholar]
- Zhang, Y. The responsibility for carbon emissions and carbon efficiency at the sectoral level: Evidence from China. Energ. Econ. 2013, 40, 967–975. [Google Scholar] [CrossRef]
- Zhang, Y.; Jiang, Y.; Hu, S.; Yan, D. New approach for carbon emission responsibility allocation with product benchmark. China Popul. Resour. Environ. 2020, 30, 43–53. [Google Scholar]
- Zhao, Y.; Kong, G.; Chong, C.; Ma, L.; Li, Z.; Ni, W. How to Effectively Control Energy Consumption Growth in China’s 29 Provinces: A Paradigm of Multi-Regional Analysis Based on EAALMDI Method. Sustainability 2021, 13, 1093. [Google Scholar] [CrossRef]
- Chong, C.; Liu, P.; Ma, L.; Li, Z.; Ni, W.; Li, X.; Song, S. LMDI decomposition of energy consumption in Guangdong Province, China, based on an energy allocation diagram. Energy 2017, 133, 525–544. [Google Scholar] [CrossRef]
- Li, X.; Chong, C.; Ma, L.; Liu, P.; Shen, X.; Jia, Z.; Wang, C.; Li, Z.; Ni, W. Coordinating the Dynamic Development of Energy and Industry in Composite Regions: An I-SDOP Analysis of the BTH Region. Sustainability 2018, 10, 2093. [Google Scholar] [CrossRef] [Green Version]
- Liu, H.; Wang, C.; Tian, M.; Wen, F. Analysis of regional difference decomposition of changes in energy consumption in China during 1995–2015. Energy 2019, 171, 1139–1149. [Google Scholar] [CrossRef]
- Chen, J.; Wu, Y.; Wen, J.; Cheng, S.; Wang, J. Regional differences in China’s fossil energy consumption: An analysis for the period 1997–2013. J. Clean. Prod. 2017, 142, 578–588. [Google Scholar] [CrossRef]
- Zou, G.L. The long-term relationships among China’s energy consumption sources and adjustments to its renewable energy policy. Energy Policy 2012, 47, 456–467. [Google Scholar] [CrossRef]
- Yang, H.; Ma, L.; Li, Z. A Method for Analyzing Energy-Related Carbon Emissions and the Structural Changes: A Case Study of China from 2005 to 2015. Energies 2020, 13, 2076. [Google Scholar] [CrossRef]
- China National Bureau of Statistics National Data. Available online: https://data.stats.gov.cn/ (accessed on 6 December 2021).
- U.S. Energy Information Administration Open Data. Available online: https://www.eia.gov/opendata/ (accessed on 6 December 2021).
- GOV.UK Research and Statistics. Available online: https://www.gov.uk/search/research-and-statistics (accessed on 6 December 2021).
- IEA Data and Statistics. Available online: https://www.iea.org/data-and-statistics (accessed on 6 December 2021).
- The World Bank World Bank Open Data. Available online: https://data.worldbank.org/ (accessed on 6 December 2021).
- State Council of China the 14th Five-Year-Plan for the National Economic and Social Development of the People’s Republic of China and the Outline of the Long-Term Targets for 2035. Available online: http://www.gov.cn/xinwen/2021-03/13/content_5592681.htm (accessed on 6 December 2021).
- Munksgaard, J.; Pedersen, K.A. CO2 accounts for open economies: Producer or consumer responsibility? Energy Policy 2001, 29, 327–334. [Google Scholar] [CrossRef]
- Su, B.; Ang, B.W. Multi-region comparisons of emission performance: The structural decomposition analysis approach. Ecol. Indic. 2016, 67, 78–87. [Google Scholar] [CrossRef]
- Román-Collado, R.; Ordoñez, M.; Mundaca, L. Has electricity turned green or black in Chile? A structural decomposition analysis of energy consumption. Energy 2018, 162, 282–298. [Google Scholar] [CrossRef]
- Zhou, X.; Zhou, D.; Wang, Q. How does information and communication technology affect China’s energy intensity? A three-tier structural decomposition analysis. Energy 2018, 151, 748–759. [Google Scholar] [CrossRef]
- Zhang, H.; Lahr, M.L. China’s energy consumption change from 1987 to 2007: A multi-regional structural decomposition analysis. Energy Policy 2014, 67, 682–693. [Google Scholar] [CrossRef]
- Yu, Y.; Liang, S.; Zhou, W.; Ren, H.; Kharrazi, A.; Zhu, B. A two-tiered attribution structural decomposition analysis to reveal drivers at both sub-regional and sectoral levels: A case study of energy consumption in the Jing-Jin-Ji region. J. Clean. Prod. 2019, 213, 165–175. [Google Scholar] [CrossRef]
- Llop, M. Changes in energy output in a regional economy: A structural decomposition analysis. Energy 2017, 128, 145–151. [Google Scholar] [CrossRef] [Green Version]
- Zhang, X.; Li, Z.; Ma, L.; Chong, C.; Ni, W. Analyzing Carbon Emissions Embodied in Construction Services: A Dynamic Hybrid Input–Output Model with Structural Decomposition Analysis. Energies 2019, 12, 1456. [Google Scholar] [CrossRef] [Green Version]
- Deng, Z.; Kang, P.; Wang, Z.; Zhang, X.; Li, W.; Ou, Y.; Lei, Y.; Dang, Y.; Deng, Z. The impact of urbanization and consumption patterns on China’s black carbon emissions based on input–output analysis and structural decomposition analysis. Environ. Sci. Pollut. Res. 2021, 28, 2914–2922. [Google Scholar] [CrossRef]
- Liu, X.; Zhang, L.; Hao, Y.; Yin, X.; Shi, Z. Increasing disparities in the embedded carbon emissions of provincial urban households in China. J. Environ. Manag. 2022, 302, 113974. [Google Scholar] [CrossRef]
- Li, J.; Huang, X.; Yang, H.; Chuai, X.; Li, Y.; Qu, J.; Zhang, Z. Situation and determinants of household carbon emissions in Northwest China. Habitat. Int. 2016, 51, 178–187. [Google Scholar] [CrossRef]
- Yang, J.; Dong, H.; Jiang, T. Structural emission reduction in China’s industrial systems and energy systems: An input-output analysis. Environ. Sci. Pollut. Res. 2022, 29, 6010–6025. [Google Scholar] [CrossRef]
- Ma, Y.; Song, Z.; Li, S.; Jiang, T. Dynamic evolution analysis of the factors driving the growth of energy-related CO2 emissions in China: An input-output analysis. PLoS ONE 2020, 15, e243557. [Google Scholar] [CrossRef] [PubMed]
- Feng, T.; Yang, Y.; Xie, S.; Dong, J.; Ding, L. Economic drivers of greenhouse gas emissions in China. Renew. Sustain. Energy Rev. 2017, 78, 996–1006. [Google Scholar] [CrossRef]
- Dong, F.; Yu, B.; Hadachin, T.; Dai, Y.; Wang, Y.; Zhang, S.; Long, R. Drivers of carbon emission intensity change in China. Resour. Conserv. Recycl. 2018, 129, 187–201. [Google Scholar] [CrossRef]
- Wang, C.; Wang, F.; Zhang, X.; Deng, H. Analysis of influence mechanism of energy-related carbon emissions in Guangdong: Evidence from regional China based on the input-output and structural decomposition analysis. Environ. Sci. Pollut. Res. 2017, 24, 25190–25203. [Google Scholar] [CrossRef]
- Deng, G.; Xu, Y. Accounting and structure decomposition analysis of embodied carbon trade: A global perspective. Energy 2017, 137, 140–151. [Google Scholar] [CrossRef]
- Pan, W.; Pan, W.; Shi, Y.; Liu, S.; He, B.; Hu, C.; Tu, H.; Xiong, J.; Yu, D. China’s inter-regional carbon emissions: An input-output analysis under considering national economic strategy. J. Clean. Prod. 2018, 197, 794–803. [Google Scholar] [CrossRef]
- Ninpanit, P.; Malik, A.; Wakiyama, T.; Geschke, A.; Lenzen, M. Thailand’s energy-related carbon dioxide emissions from production-based and consumption-based perspectives. Energy Policy 2019, 133, 110877. [Google Scholar] [CrossRef]
- Li, L.; Tang, L.; Zhang, J. Coupling Structural Decomposition Analysis and Sensitivity Analysis to Investigate CO2 Emission Intensity in China. Energies 2019, 12, 2396. [Google Scholar] [CrossRef] [Green Version]
- Ali, Y.; Pretaroli, R.; Sabir, M.; Socci, C.; Severini, F. Structural changes in carbon dioxide (CO2) emissions in the United Kingdom (UK): An emission multiplier product matrix (EMPM) approach. Mitig. Adapt. Strateg. Glob. Change 2020, 25, 1545–1564. [Google Scholar] [CrossRef]
- Wu, F.; Huang, N.; Zhang, Q.; Qiao, Z.; Zhan, N. Multi-province comparison and typology of China’s CO2 emission: A spatial–temporal decomposition approach. Energy 2020, 190, 116312. [Google Scholar] [CrossRef]
- Cai, H.; Qu, S.; Wang, M. Changes in China’s carbon footprint and driving factors based on newly constructed time series input–output tables from 2009 to 2016. Sci. Total Environ. 2020, 711, 134555. [Google Scholar] [CrossRef] [PubMed]
- Xu, W.; Xie, Y.; Xia, D.; Ji, L.; Huang, G. A multi-sectoral decomposition and decoupling analysis of carbon emissions in Guangdong province, China. J. Environ. Manag. 2021, 298, 113485. [Google Scholar] [CrossRef] [PubMed]
- Wang, Z.; Cui, C.; Peng, S. How do urbanization and consumption patterns affect carbon emissions in China? A decomposition analysis. J. Clean. Prod. 2019, 211, 1201–1208. [Google Scholar] [CrossRef]
- Shao, L.; Guan, D.; Zhang, N.; Shan, Y.; Chen, G.Q. Carbon emissions from fossil fuel consumption of Beijing in 2012. Environ. Res. Lett. 2016, 11, 114028. [Google Scholar] [CrossRef] [Green Version]
- Department of Energy Statistics, National Bureau of Statistics. China Energy Statistical Yearbook 2020, 1st ed.; China Statistics Press: Beijing, China, 2020.
Figure 1.
The embodied energy in the final consumption of each sector in China from 2002 to 2018.

Figure 2.
The embodied carbon in the final consumption of each sector in China from 2002 to 2018.

Figure 3.
The energy structure of embodied carbon in final consumption from 2002 to 2018.

Figure 4.
The energy structure of 28 sectors’ embodied carbon in 2018.

Figure 5.
The carbon emissions allocation Sankey diagram of China in 2018 (only carbon flows of more than 1 million tons are shown).
Figure 5.
The carbon emissions allocation Sankey diagram of China in 2018 (only carbon flows of more than 1 million tons are shown).

Figure 6.
The carbon emissions allocation Sankey diagram of China’s smelting and pressing of metals sector in 2018 (the figures in brackets in the final consumption section represent the final consumption quantity of sector 14).
Figure 6.
The carbon emissions allocation Sankey diagram of China’s smelting and pressing of metals sector in 2018 (the figures in brackets in the final consumption section represent the final consumption quantity of sector 14).

Figure 7.
The carbon emissions allocation Sankey diagram of China’s construction sector in 2018 (the figures in brackets in the final consumption section represent the final consumption quantity of sector 25).
Figure 7.
The carbon emissions allocation Sankey diagram of China’s construction sector in 2018 (the figures in brackets in the final consumption section represent the final consumption quantity of sector 25).

Figure 8.
The SDA decomposition result of embodied carbon in 2002–2010 and 2010–2018.

Figure 9.
The impact of the final consumption quantity on embodied carbon in 2002–2010 and 2010–2018.
Figure 9.
The impact of the final consumption quantity on embodied carbon in 2002–2010 and 2010–2018.

Figure 10.
The impact of the final consumption structure on embodied carbon in 2002–2010 and 2010–2018.
Figure 10.
The impact of the final consumption structure on embodied carbon in 2002–2010 and 2010–2018.

Figure 11.
The impact of the input–output structure on embodied carbon in 2002–2010 and 2010–2018.

Figure 12.
The impact of the energy intensity on embodied carbon in 2002–2010 and 2010–2018.

Figure 13.
The impact of the energy structure on embodied carbon in 2002–2010 and 2010–2018 (by energy varieties).
Figure 13.
The impact of the energy structure on embodied carbon in 2002–2010 and 2010–2018 (by energy varieties).

Figure 14.
The impact of the energy structure on embodied carbon in 2002–2010 and 2010–2018 (by sectors).
Figure 14.
The impact of the energy structure on embodied carbon in 2002–2010 and 2010–2018 (by sectors).

Table 1.
Studies concerning embodied carbon growth based on SDA methods.
| No. | Author | Time Period and Research Object | Driving Factors |
|---|---|---|---|
| 1 | Su and Ang [27] | 2002, China | Final consumption quantity, final consumption structure, input–output structure, carbon emission intensity |
| 2 | Wang et al. [41] | 2002–2012, Guangdong province | Population, GDP per capita, industrial structure, final consumption structure, carbon emission intensity |
| 3 | Deng and Xu [42] | 1995–2009, China, the U.S., India, and Japan | Carbon emission intensity, input–output structure, export quantity |
| 4 | Pan et al. [43] | 2002–2010, China | Final consumption, input–output structure, carbon emission intensity |
| 5 | Ninpanit et al. [44] | 1990–2015, Thailand | Population, final consumption per capita, final consumption destination, final consumption structure, industrial structure, energy intensity, carbon emission coefficient |
| 6 | Li et al. [45] | 1997–2012, China | Final consumption quantity, final consumption structure, input–output structure, carbon emission intensity |
| 7 | Ali et al. [46] | 1995–2009, the U.K. | Final demand level, final demand structure, ecological technology level |
| 8 | Wu et al. [47] | 1997–2012, 30 provinces in China | Population, GDP per capita, industrial structure, final consumption structure, carbon emission intensity |
| 9 | Cai et al. [48] | 2009–2016, China | Population, GDP per capita, industrial structure, final consumption structure, primary input, carbon emission intensity |
| 10 | Xu et al. [49] | 2002–2017, Guangdong province | Population, per capita final consumption, final consumption structure, input–output structure, carbon emission intensity |
| 11 | Yang et al. [37] | 2007–2015, China | Final consumption quantity, input–output structure, energy intensity, energy structure |
| 12 | Ma et al. [38] | 2007–2015, China | Final consumption quantity, input–output structure, energy intensity, energy structure |
| 13 | Feng et al. [39] | 1995–2009, China | Input volume, the input structure, input–output structure, carbon emission intensity |
| 14 | Wang et al. [50] | 2002–2012, China | Carbon intensity, structural change, rural consumption, urban consumption, population, and urbanization |
Table 2.
General economic input–output table.
| Intermediate Use j | Final Consumption | Import | Total Output | ||||||||
|---|---|---|---|---|---|---|---|---|---|---|---|
| 1 | 2 | … | n | Domestic Consumption | Export | Fixed Capital Formation | Other | ||||
| Intermediate input i | 1 | ||||||||||
| 2 | |||||||||||
| … | |||||||||||
| n | |||||||||||
| Added value | |||||||||||
| Total input | |||||||||||
Table 3.
SDA decomposition formula of embodied carbon in final consumption.
| Change in Embodied Carbon | ||
|---|---|---|
| Final consumption quantity | ||
| Final consumption structure | ||
| Input–output structure | ||
| Sectoral energy intensity | ||
| Sectoral energy structure | ||
| Carbon emission coefficient | ||
Table 4.
Name and code of 28 sectors.
| Code | Sector | Code | Sector |
|---|---|---|---|
| 1 | Agriculture, Forestry, Animal Husbandry, and Fishery | 15 | Manufacture of Metal Products |
| 2 | Mining and Washing of Coal | 16 | Manufacture of Machinery |
| 3 | Extraction of Petroleum and Natural Gas | 17 | Manufacture of Transport Equipment |
| 4 | Mining and Processing of Metal Ores | 18 | Manufacture of Electrical Machinery and Apparatus |
| 5 | Mining and Processing of Nonmetal Ores and Other Mining | 19 | Manufacture of Computers, Communication, and Other Electronic Equipment |
| 6 | Manufacture of Foods and Tobacco | 20 | Manufacture of Measuring Instruments and Machinery |
| 7 | Manufacture of Textile | 21 | Other Manufacture, Utilization of Waste Resources, and Repair Service Equipment |
| 8 | Manufacture of Wearing Apparel and Footwear | 22 | Production and Supply of Electric Power and Heat Power |
| 9 | Manufacture of Timber and Furniture | 23 | Production and Supply of Gas |
| 10 | Manufacture of Paper, Paper Products, and Articles for Culture, Education, and Sport Activities | 24 | Production and Supply of Water |
| 11 | Processing of Petroleum, Coking, and Processing of Nuclear Fuel | 25 | Construction |
| 12 | Manufacture of Chemical Products | 26 | Wholesale, Retail Trade, and Hotels, Restaurants |
| 13 | Manufacture of Non-metallic Mineral Products | 27 | Transport, Storage, and Post |
| 14 | Smelting and Pressing of Metals | 28 | Other Services |
Table 5.
The ranges and physical meaning of the subscripts.
| Subscript | Ranges | Physical Meaning |
|---|---|---|
| i | 1–28 | Indicates that the embodied energy/embodied carbon comes from sector i. |
| j | 1–28 | Indicates that the embodied energy/embodied carbon eventually flows into the final consumption products of sector j. |
| p | 1–4 | Represents energy varieties: coal, oil, natural gas, and electricity and heat. |
| q | 1–3 | Represents the category of final consumption: consumption, fixed capital formation, and exports. |
Publisher’s Note: MDPI stays neutral with regard to jurisdictional claims in published maps and institutional affiliations. |
© 2022 by the authors. Licensee MDPI, Basel, Switzerland. This article is an open access article distributed under the terms and conditions of the Creative Commons Attribution (CC BY) license (https://creativecommons.org/licenses/by/4.0/).
Share and Cite
MDPI and ACS Style
Zhao, Y.; Ma, L.; Li, Z.; Ni, W. A Calculation and Decomposition Method Embedding Sectoral Energy Structure for Embodied Carbon: A Case Study of China’s 28 Sectors. Sustainability 2022, 14, 2593. https://doi.org/10.3390/su14052593
AMA Style
Zhao Y, Ma L, Li Z, Ni W. A Calculation and Decomposition Method Embedding Sectoral Energy Structure for Embodied Carbon: A Case Study of China’s 28 Sectors. Sustainability. 2022; 14(5):2593. https://doi.org/10.3390/su14052593
Chicago/Turabian StyleZhao, Yunlong, Linwei Ma, Zheng Li, and Weidou Ni. 2022. "A Calculation and Decomposition Method Embedding Sectoral Energy Structure for Embodied Carbon: A Case Study of China’s 28 Sectors" Sustainability 14, no. 5: 2593. https://doi.org/10.3390/su14052593
Note that from the first issue of 2016, this journal uses article numbers instead of page numbers. See further details here.