
Solar Energy in the Nordic Built Environment: Challenges, Opportunities and Barriers


1
Department of Architecture and Technology, Norwegian University of Science and Technology, 7491 Trondheim, Norway
2
Department of Civil and Environmental Engineering, Norwegian University of Science and Technology, 7491 Trondheim, Norway
3
Energy and Building Design, Lund University, 223 62 Lund, Sweden
*
Author to whom correspondence should be addressed.
Energies 2021, 14(24), 8410; https://doi.org/10.3390/en14248410
Submission received: 19 October 2021
/
Revised: 3 December 2021
/
Accepted: 6 December 2021
/
Published: 13 December 2021
(This article belongs to the Special Issue Emerging Photovoltaic Technology in Northern Europe)
Abstract
:Within the framework Solar Heating and Cooling Programme of the International Energy Agency Task 51 “Solar Energy in Urban Planning”, case studies from Norway, Sweden, and Denmark were collected and analyzed through a comparative approach. The cases were first classified based on their urban characterization (existing and new urban areas) and then compared within the same country or in a cross-country perspective according to three areas of interest (i.e., Scale and planning process, Legislation and planning process, Targets and goals). The comparisons follow a common template of five sections describing the role of the involved stakeholders and highlighting challenges, barriers, and opportunities for the deployment of active solar systems and passive solar strategies. Both technical and non-technical aspects are considered. Among the technical aspects, the focus is on the adoption of solar energy strategies (e.g., solar accessibility, daylighting), the estimation of solar potential and energy generation. Regarding the non-technical aspects, the focus is on identifying barriers and challenges for the adoption of solar systems in relation to national and local legislation. The findings show that municipalities can have a crucial role in facilitating the adoption of solar energy solutions in cities by embracing ambitious visions and storytelling, as well as being directly financially involved as owners or subsidizing bodies. The findings also demonstrate the value of the use of indicators to evaluate the performance of masterplans, the combination of analogue and digital tools in the design process, and the performance of solar simulations from early stages to foster awareness among the involved stakeholders. Despite these positives, the Scandinavian legislation on solar energy utilization in the urban context still displays fragilities, making the creation of guidelines a pressing need.
1. Introduction
Solar photovoltaic (PV) is the renewable energy source that is experiencing the highest growth rate, with an average annual increase of 36% in the past 30 years [1]. Furthermore, it has been estimated that electricity generated by PV could cover up to 33% of the total global needs by 2050 [2]. The recent trend characterizing solar energy exploitation is connected to a series of positive developments in this technology: a steady increase in efficiency regarding energy conversion and production processes, coupled with a drop in system costs; a higher degree of awareness for its potential to reduce CO2 emissions; a rising electricity demand and favorable political framework characterized by governmental incentives and plans [3,4]. These factors have resulted in an increment of the deployment rate of utility-scale solar plant installation and smaller-scale distributed PV systems within cities’ boundaries [5,6]. In this context, cities being the places where the highest share of energy is consumed, the integration of solar technologies in the urban environment is an important aspect [7]. Several advantages can arise from solar system integration into the built environment: (i) the exploitation of otherwise unused urban surfaces (i.e., roofs, facades, and ground) [8], (ii) the limitation of losses and charges associated with long distance transmission and distribution of electricity [9], and (iii) the benefits of increased resilience to extreme weather conditions (i.e., energy flexibility) [6]. Conversely, cities are complex environments where a great variety of aspects need to be considered for a successful integration of solar systems, as well as an adequate level of visual and thermal outdoor and indoor comfort. In fact, the densification process triggers issues for solar accessibility and availability such as the overshadowing effect from the surrounding or solar inter-building reflections [10]. Aspects such as the right of light should be considered carefully from early in the design process and urban and design recommendations should be adopted within the national legislative framework to avoid pitfalls and planning failures [11]. To this end, many tools are available to estimate the solar potential at urban scale and detect the most suitable surfaces both on facades and roofs [12]. The most advanced use LiDAR, 2D and 3D cadaster data to create Digital Surface Models (DSM) and Digital Terrain Models (DTM) to derive information about solar irradiation at a large scale, such as the solar cadaster of Geneva [13]. Moreover, careful evaluation of the visual impact of integrated photovoltaic systems is another crucial aspect that contributes to the further deployment of solar energy technologies in the built environment, including the consideration of sensitive and protected areas and their social acceptance [14,15].
2. Background
The Nordic countries rank among the countries with the highest electricity power consumption per capita in the world, with four of them (Iceland, Norway, Finland, and Sweden) in the top 10 [16]. Despite this, almost 80% of their electricity comes from renewable sources, in particular hydro and wind, making the Scandinavian region a global leading actor in the decarbonization of the energy sector [17]. Solar energy still represents a small fraction (0.43%) of the total consumed electricity. However, the use of solar energy has recently grown more than any other energy sources in the Nordics, with an average pace of 84% each year in the period 2010–2019 [17]. The low use of solar technology is partially the result of a misconception that the level of irradiation is much lower in the Nordics than in central European countries. The reason why nations such as Belgium or Germany are commonly seen as better places for solar technologies is mainly due to the feed-in tariff system adopted there rather than the actual irradiation difference [18]. The lower temperatures in Nordic countries have also proven to be beneficial in maintaining high efficiency of solar systems [19], making the energy production gap even smaller. Moreover, the low angle of solar rays at high latitudes can be effective for harvesting solar energy from vertical surfaces. Vertically mounted PVs have different production profiles throughout the day compared to the roof-mounted PV, allowing for the adoption of peak-shave strategies and a higher share of self-energy consumption [20]. This represents an opportunity for the integration of solar systems in urban environments, where the availability of vertical surfaces is often larger than horizontal ones [21]. The snow coverage of PV is avoided in winter months when vertical systems are utilized, and its high albedo can be beneficial to increase energy production [22]. On the other hand, the low inclination of solar rays poses significant challenges due to the more complex overshadowing effect created by the surrounding buildings, together with the large yearly variation of solar radiation. Particular attention should be placed on the choice of colors and materials both for surfaces surrounding the solar system [22] and for the color of the system itself [23]. Indeed, light colors and highly reflective materials can significantly enhance the energy production of solar systems installed on neighboring buildings on the one hand. On the other hand, light colored PV are characterized by a lower efficiency compared to traditional PV. These elements make the adoption of solar energy in the urban environment a non-trivial task, including in the Nordics. Therefore, an advanced assessment of solar energy potential at multiple scales (i.e., component, building, district) is required.
Framework and Aim of the Work
This work is related to the outcomes of the Subtask C–Case Studies and Action Research, framed within the International Energy Agency (IEA) Solar Heating and Cooling Programme (SHC) Task 51 “Solar Energy in Urban Planning” [24,25,26]. The aim of Task 51 has been to promote the architectural integration of active and passive solar energy solutions in urban areas by supporting architects, urban planners, and authorities. Within the framework of the Subtask C of the IEA SHC Task 51, this study proposes a novel methodology to present and compare the case studies belonging to three Scandinavian countries (i.e., Norway, Sweden, and Denmark). This approach enables the highlighting of similarities and differences of case studies in the same country and in different countries. In addition, common lessons learned and recommendations to implement solar strategies in Nordic built environments are delineated. The aim of this study is to facilitate the replicability of successful practices and to avoid pitfalls encountered by others by providing a state-of-the-art and highlighting the importance of establishing a constructive and iterative dialogue between researchers and city authorities.
3. Materials and Methods
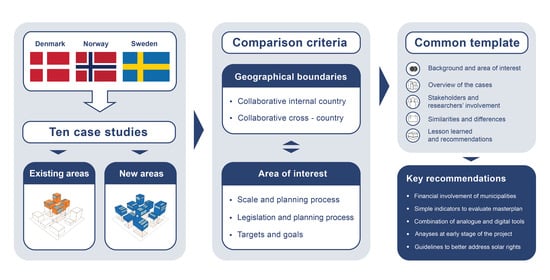
This section presents the methodology adopted to present and compare the cases located in Scandinavia: three cases in Norway, three cases in Sweden, and four cases in Denmark. The cases were analyzed to provide professionals (i.e., architects, urban planners, researchers, and stakeholders) involved in urban planning with a series of recommendations and lessons learned regarding solar energy through a comparative approach.
3.1. Case Studies and Classification of Environments
First, the case studies were divided into two types of built environments according to the classification presented in Table 1.
3.2. Definition of the Comparison Criteria: Geographical Boundaries and Areas of Interest
Second, a comparison between different case studies was conducted. This was done by first defining the geographical boundaries of the comparison:
- Collaborative internal country case studies comparison when the cases are located within the same country.
- Collaborative cross-country case studies comparison when the cases are in different countries.
This classification allows the emphasizing of substantial similarities and differences within national borders or among neighboring countries. To better classify the comparisons, three main areas of interest were determined:
- Scale and planning process: focusing on how the case studies are related to different spatial scales and stages of urban and landscape planning. Attention is also given to detailed development plans and architectural design stages, comprehensive/strategic planning and the impact solar energy has on the stages of the project and costs.
- Legislation and planning process: dealing with solar access rights in terms of new/existing neighborhoods and building design, as well as the impact of new policy and technology on solar energy in urban planning and the application of tools in the design and construction process.
- Targets and goals: focusing on timelines and qualitative/quantitative goals that are influenced by solar energy, for instance, the percentage of energy covered by solar systems, or the role of certification schemes such as LEED and BREEAM in the process. Additionally, also of importance is the specification of the type and use of tools to achieve the targets and ambitions and detect common metrics to classify the energy need in different countries.
Once the terms of comparison were defined, the comparison among the 10 selected case studies (Table 2) was carried out using a template structured in five sections, which allows consistent collection of information for each group of analyzed case studies. The template is divided as follows (Figure 1):
- Background and area of interest: containing an explanation about the aspects which have been analyzed in the comparison and the reason for it.
- Overview of the cases: highlighting important topics, issues, and challenges. The main objective is to describe the case and underline relevant aspects of energy characterization.
- Stakeholders and researchers’ involvement: describing the participation at different phases of the planning process of urban stakeholders and researchers and their positive/negative impacts. The effects of their interventions, both on private and public initiatives, are explained and framed into the planning process.
- Similarities and differences: focusing on the relevant technical and non-technical aspects that make each case study unique and position it in relation to the others.
- Lessons learned and recommendations: constituting a summary of the most relevant conclusions, lesson learned, recommendations, and implications based on the comparison of the case studies.
4. Results and Discussion
In this section, cases located in the same country are presented first, followed by the cross-country comparisons.
4.1. Ørestad and Carlsberg Scale and Planning Process
4.1.1. Background and Area of Interest
The area of interest for this comparison is “scale and planning process” with a specific focus on the role played by governance in urban planning. In Denmark, the lack of will of individual real estate developers and the absence of a specific legislative framework limit the possibilities for municipalities to promote solar energy [27]. This situation leaves urban planners with limited possibilities to encourage and assist developers in the adoption of integrated solar energy strategies. However, the application of theoretical notions such as “governance” and “meta-governance” has recently gained momentum in the attempt to describe a set of tools to help planners in the development of optimal conditions to influence and guide the process [28] (Figure 2).
4.1.2. Overview of the Cases
The two case studies are located in Copenhagen, in areas experiencing a large transformation in the recent and coming years. The development of Ørestad started in the 1990s in an area sparsely occupied by brownfields in the outskirts of the city, while the development of the Carlsberg area, still in its initial phase, is characterized by a dense urban fabric with several protected buildings and has a more central position in the city.
4.1.3. Stakeholders and Researchers’ Involvement
The involvement of the local municipality has played a significant role in both cases, even if with different outcomes. In Ørestad, a mix between private plots and others owned by the public allowed the municipality to develop a scheme of guiding principles to ensure the realization of environmentally friendly buildings. The utilization of solar energy potential was imposed in all the areas where the municipality was financially involved, while the use of storytelling, visions, and images promoted private developers to follow. This approach contributed to an overall integration of solar energy as an active part of its urban planning and development process. On the other hand, the Carlsberg case seems less successful in achieving similar results. Here, the municipality has a limited involvement as a plot developer, with privates acting as protagonists. Despite the performance of shadow studies and analyses regarding optimal ways to implement solar energy in the initial masterplan, the plans show limited integration of solar energy.
4.1.4. Similarities and Differences
The two cases share similarities regarding their large extension, the realization of new buildings with a mix of functions, and the vision to become state-of-the-art neighborhoods in Copenhagen. However, they greatly differ in several other aspects. Different urban fabrics characterize the two areas, with the Carlsberg project taking place in a denser and closer to the center area with a high historical value. The main difference is represented by the role played by the municipality in the two projects. In Ørestad, the financial presence of the municipality as owner or subsidizing body permitted setting up obligations for private developers regarding solar energy integration, while the marginal involvement of public bodies in Carlsberg did not provide sufficient leverage on solar energy systems’ deployment over the private investors.
4.1.5. Lesson Learned and Recommendations
The importance of the involvement of public authorities in the development of large areas is the main lesson learned for this comparison. When a public body is a key actor in the process, it can successfully pave the way and encourage the use of renewable energy sources and environmentally friendly solutions such as the integration of solar energy systems. In contrast, when the management is left completely in the hands of privates, the initial ambitions are more likely to be abandoned (Figure 3).
4.2. Øvre Rotvoll NTNU and Øvre Rotvoll BUW Scale and Planning Process
4.2.1. Background and Area of Interest
This comparison focuses on two methodologies to create a masterplan for the Øvre Rotvoll area in Trondheim, Norway. The methodologies are developed within educational programs in urban planning and applied to the same plot. The area of interest “scale and planning process” is investigated from an academic perspective with the creation of two design alternatives by the Norwegian University of Science and Technology (NTNU) and the University of Wuppertal (BUW) in Germany (Figure 4).
4.2.2. Overview of the Cases
The cases share the same plot, the Øvre Rotvoll area located in the east part of Trondheim between the city center and the Værnes Airport. The district has the ambition to become an exemplary district regarding energy targets and is planned to have a mix of functions within its boundaries. The exploitation of solar energy potential and the optimization of its use has been set as the main objective from an early stage of the planning by both the methodologies. The NTNU approach [22] is a single criteria method, with solar energy optimization as its objective, structured in two phases. In the first phase, solar urban planning recommendations were developed through a parametrical study to optimize orientation, aspect ratio (i.e., the ratio between the distance among buildings and height of the buildings), and contribution of mutual inter-building and ground solar reflections of two typical building typologies (i.e., row houses and high-rise building block) in Trondheim. In the second phase, the previously defined solar urban planning recommendations were applied to develop the entire masterplan of Øvre Rotvoll district. On the other hand, the multi-criteria approach developed by the BUW does not only focus on solar energy, but it also tries to encompass social, economic, environmental, and infrastructural dimensions of the project. It is achieved by a deep analysis of the existing urban structure and utilization of the area to understand strengths and weaknesses of the district. Next, various strategies were evaluated to produce different scenarios according to different urban functions, resulting in a final masterplan (Figure 5).
4.2.3. Stakeholders and Researchers’ Involvement
The cases are characterized by the involvement of higher education institutions in their development; more specifically, through the contribution of students, professors, and researchers. The NTNU masterplan is the result of a Master Thesis conducted in collaboration between NTNU and the University of Padua (UNIPD) in Italy, under the supervision of researchers of both universities, while the BUW masterplan is the result of the course of Urban Design and Planning for the project seminar “Experimental urban research studies”, that used the Øvre Rotvoll area as a testbed.
4.2.4. Similarities and Differences
Both examples share the main objective of optimizing the solar energy potential at the district level through a design process subdivided into multiple phases. This is done with an optimization process involving form, dimension, and building distance. However, the two methods differ in how they get to a final masterplan and the aspects considered along the process. The BUW has a more holistic approach, considering the infrastructures and the social impact of the proposed solution besides the energy sustainability of the district. On the other hand, the NTNU method is based on a single criterion, where the focus is on the maximization of solar irradiation on buildings’ envelopes through the investigations of parameters such as aspect ratio, orientation, and reflection. The way energy consumption is estimated differs in the two cases, with BUW using the tool District Energy Concept Adviser, while NTNU the standard values established by the Norwegian energy labeling system [29]. Additionally, BUW utilized analogue tools such as “density cards” and “irradiation disks for solar energy” to support the design, while NTNU utilized only digital tools, i.e., Rhinoceros 3D [30] Grasshopper and DIVA [31].
4.2.5. Lesson Learned and Recommendations
The comparison underlined the importance of considering different parameters in the design process. A multi-criteria approach should be preferred over a single objective approach to allow consideration of more aspects. Nevertheless, an overall recommendation is to incorporate solar energy from the very beginning of the design process to obtain valuable results and to formulate guidelines useful in the following phases of the project or in other projects. Finally, the integration of analogue and digital tools in the design process can be a support-planning instrument for both students and urban stakeholders.
4.3. Malmö Hyllie and Lund Brunnshög Targets and Goals
4.3.1. Background and Area of Interest
The two Swedish case studies of Malmö Hyllie and Lund Brunnshög are characterized by ambitious environmental goals, where solar energy is expected to have the leading role in providing renewable energy directly on-site. The area of interest is “Target and goals” with a focus on solar energy planning (Figure 6). Due to a change in national legislation on the 1 January 2015, local administrations and urban planning departments of Swedish cities are no longer allowed to put additional energy demands on new buildings on top of the national building code, depriving municipalities of any legal instruments for the implementation of solar energy in new construction. This demands a different approach for the application of solar energy, more focused on voluntary initiatives by private developers, such as the adoption of environmental certification (e.g., BREEAM, LEED) or the use of alternative instruments that fit the local legal framework.
4.3.2. Overview of the Cases
Both cases are mixed-use expansion projects in the outskirts of the respective cities. Lund Brunnshög is in the Northeast side of the city and, besides the main goal of producing a large share of electricity from solar energy, it will feature the presence of a new European research center (ESS) and an international laboratory (Max IV). These two facilities are planned to deliver excess heat to the local urban district heating network to supply domestic hot water and space heating. Malmö Hyllie also has solar energy production at the center of its vision. The project is in the South-West part of Malmö, and it aims to become the most climate-smart neighborhood in the region and a testbed for solar energy.
4.3.3. Stakeholders and Researchers’ Involvement
Researchers from Lund University were involved from the beginning of the two projects to investigate the solar potential of the neighborhoods and facilitate the dialogue between local planning departments and private real estate developers. Due to the absence of legal instruments supporting the solar energy systems integration, the availability of simple and quantifiable data for the developers assumes an even larger role.
4.3.4. Similarities and Differences
Most of the similarities between the two cases come from the legislative framework. The change in the national legislation has forced both cities to find alternative ways to promote the adoption of solar energy systems. Making private real estate developers aware of the possibilities for deploying active solar energy systems is a valid strategy from an early design stage. It can be noted that the two municipalities have structured the projects regarding solar energy differently. Brunnshög looked at the whole development at the same time, while Malmö prepared a specific set of buildings to become solar-ready first, before applying the concept to the entire development.
4.3.5. Lesson Learned and Recommendations
The main lesson learned from the comparison is the need to establish straightforward indicators to inform key players in the urban development of the advantages and importance of adopting solar energy strategies, especially in a scenario characterized by a weak legislative framework. In that regard, the solar factor (SAFAR) indicator [32] conceived by Lund University could be a tool for urban planners and municipalities, especially if made accessible and usable through an online tool and with the inclusion of the aspect of architectural integration of solar systems in buildings (Figure 7).
4.4. FredericiaC and Gehry City Harbour and Malmö Hyllie and Lund Brunnshög Scale and Planning Process
4.4.1. Background and Area of Interest
In recent years, many ambitious new areas have been planned in Denmark and Sweden, two neighboring countries with different legislations but dealing with similar challenges regarding minimizing energy demand, optimizing solar energy utilization and daylight accessibility at high latitudes, and guaranteeing pleasant outdoor conditions. The “Scale and planning process” is the area of interest for this cross-country comparison encompassing four cases, two in Denmark, FredericiaC and Gehry City Harbour and two in Sweden, Malmö Hyllie and Lund Brunnshög (Figure 8).
4.4.2. Overview of the Cases
An overview of the two Swedish cases can be found in the previous comparison, where the two cases are presented alongside each other. The presentation of the two Danish cases follows. FredericiaC is a new coastal development in the center of the municipality of Fredericia. The intention of the private developer and of the municipality that co-owns the area is to plan a CO2 neutral neighborhood regarding building operation, by optimizing solar energy utilization and daylight accessibility. Similar goals are shared by the other Danish case, the Gehry City Harbour in Sonderberg. The private landowner has a strong focus on the implementation of solar energy in the area and the ambition of reaching CO2 neutrality by 2029 through the redevelopment of the waterfront with a mix of houses, hotels, offices, retail, and cultural activities.
4.4.3. Stakeholders and Researchers’ Involvement
The ownership of the land is seen as a key factor to implement solar systems. In the Swedish context, despite the ownership of the land, the municipality has limited power in setting specific solar energy requirements for future real estate developers due to the absence of legal instruments. The involvement of the researchers from Lund University provided a solution to a difficult challenge to be solved at national scale. On the other hand, in the two Danish cases the land is owned by a semi-private owner and the role of the stakeholders is the main driving force for the high ambition to implement solar energy.
4.4.4. Similarities and Differences
The Swedish and Danish cases are alike in their spatial scale since they are all large developments in proximity to existing cities and have high energy ambitions. For all of them, a first zoning plan was developed, and, with the use of a 3D model, a solar potential calculation was conducted and used as a reference case for future studies that were run using Radiance-based tools. Nevertheless, differences are visible in the ownership of the land. In the Danish cases it belongs to semi-private owners, while in the Swedish cases it is owned by the municipality. The result is the creation of a different framework for solar energy implementation, as mentioned in the previous section. The Danish cases present clearer energy targets than the Swedish ones, which are instead characterized by a more non-binding declination. The Danish building regulation has set a 2% daylight factor as a reference for new buildings, while the Swedish code has 1% as a requirement. In addition, Danish cases stress the importance of developing the masterplans to ensure satisfactory daylight access on the facades of future buildings as well as carrying out analysis to optimize the outdoor microclimate conditions. These aspects are absent in the Swedish cases.
4.4.5. Lesson Learned and Recommendations
In general, common conclusions can be drawn for the Danish and Swedish cases. Setting quantitative and easily understandable goals would facilitate the involvement and the collaboration of the different actors in the integration of solar energy systems. Even though the focus in a first stage could be on the solar potential, it is important to ensure that the results are transferable to a second stage, where the focus should be on the practical installation of active systems (Figure 9). The awareness of the solar potential and limitations of solar energy deployment should be shared by the whole design team, and expertise and information should be available at all the stages of the project.
4.5. Zero-Emission Office Building and Uppsala Frodeparken Legislation and Planning Process
4.5.1. Background and Area of Interest
The integration of solar energy systems in the built environment, especially on facades at high latitudes where the overshadowing risks are relevant, is an important operation that has to be considered in the planning process from the early stages. This cross-country comparison focuses on the area of interest “Legislation and planning process” for two buildings: (i) the Uppsala Frodeparken in Sweden and (ii) the Zero-Emission Office Building in Trondheim, Norway (Figure 10). It treats the issue of solar rights, defined as a situation where solar technologies installed on existing buildings can be shaded from new constructions within the same area.
4.5.2. Overview of the Cases
The two cases present building integrated photovoltaic (BIPV) into the facade. Frodeparken is in the city of Uppsala, Sweden. It is constituted by 1800 panels integrated into the south-oriented facade. The approved neighboring plan in 2004 allowed the realization of a nearby building that started in 2015. The building is now completed: its presence reduces the solar access of Frodeparken and consequently the solar potential of the BIPV facade. A radiation study shows a reduction in annual electricity production of nearly 10%. A similar example is provided by the Zero-Emission Office Building in Trondheim, Norway. The building, completed in 2012, features 121 photovoltaic modules integrated into the south and west facades. To achieve the high energy goals set at the beginning of the design process, the installation of BIPV on the facades was realized. Six months later, a densification process started in the Lerkendal district where the Zero-Emission Office Building is located. This process implied the realization of a new student block in front of the BIPV facade and a new high-rise hotel that produced a large decrease in solar accessibility for the case study. An analysis conducted by NTNU researchers shows a reduction in global radiation of almost 30% for the south facade due to the overshadowing effect caused by the new buildings in the Lerkendal district [11].
4.5.3. Stakeholders and Researchers’ Involvement
In Sweden, solar energy is not mentioned specifically in the legislation and in the Planning and Building Act (PBL) that regulates planning process and land use, and no specific requirements on overshadowing are considered. However, in case of new realizations, the PBL gives the possibility to neighboring stakeholders and landowners to raise concerns about the plan and appeal it. While some cases of successful appeals can be found for shading issues regarding daylight, none concerning active solar systems have been submitted, making the Swedish legislation still unclear on how to behave with solar rights. In Norway, solar systems are classified as “technical installations” by the national PBL [33]. Their adoption for existing and new buildings should involve the municipality, which has to be notified and has to approve the installation. Some exceptions are in place in the case of solar cells that do not violate the municipality’s plans, meet all the requirements in terms of water/air tightness, structural integrity, and they comply with the fire regulation [34]. The use of solar energy is also implied in TEK17 [35], developed in collaboration with the building industry. The definition of prosumer (or plus-costumer) was also defined [36].
4.5.4. Similarities and Differences
The two cases are challenging the same issues: (i) the solar accessibility of the BIPV facade is affected by the surrounding buildings; (ii) the planning legislation has analogies, and the planning process works similarly: this reflects a lack of a broader perspective, and thus the focus is on single buildings. This aspect impacts the ambitious energy targets of the planning process. Conversely, the most significant difference is the stage of the project where the calculations for solar power output were run. For Frodeparken, they were performed when the neighboring building was still in its design phase, while in Trondheim it was done when the new adjacent buildings were already completed. The Swedish case has higher ambitions and includes a larger area of solar systems’ integration.
4.5.5. Lesson Learned and Recommendations
The cases illustrate the need to include solar accessibility rights of individual buildings to shift the focus to a group of buildings and their interaction (Figure 11).
Urban planners are shown to be insufficiently prepared to predict how their decisions impact the efficiency of existing solar installations. This is particularly evident in the Swedish example where, despite the problem being addressed in an early phase of the district planning, it did not prevent the construction or the modification of the approved new project. For this reason, more knowledge is needed on the importance of conducting solar potential analyses. The main recommendation for professionals, municipalities, and urban decision-makers is to integrate these preliminary analyses into common practice from the early planning phases.
5. Limitations of the Study
The study illustrates an overview of a limited number of cases and should not be seen as comprehensive and representative of all the local legislations and climates in the Scandinavian context. General recommendations and suggestions can be outlined, but critical thinking is required to adapt them according to local regulations and environments. The cases presented here were selected by international experts during the IEA SHC Task 51 “Solar Energy in Urban Planning” based on their knowledge and the available information. Therefore, other exemplary cases could be added to the study. Furthermore, as the Task terminated in 2017, some of the latest projects dealing with solar energy in urban environments are not included in the study. This gap will be addressed by the work of the new Task 63 “Solar Neighborhood Planning” [37,38]. Finally, latitudes above 60 degrees are underrepresented, with only three projects located in the city of Trondheim, Norway.
6. Conclusions
This study presents an overview of solar energy utilization in urban planning in the Scandinavian context. Ten case studies within the IEA-SHC Task 51 “Solar Energy in Urban Planning” located in Sweden, Denmark, and Norway were analyzed through a comparative approach. The comparison was conducted both by considering cases within the same country and with a cross country perspective under particular areas of interest (i.e., Scale and planning process, Legislation and planning process, Targets and goals). General considerations can be drawn from the analyzed examples and comparisons can be used as lessons learned and recommendations for public and private developers, policymakers, and municipalities. Overall, the legislation regarding solar energy utilization in the urban context can be seen as inadequate in Scandinavia, often leaving local municipalities without the tools and planning instruments to pursue effective policies for the integration of solar energy. In this context, the use of alternative instruments by the municipalities such as storytelling, the adoption of an ambitious vision, and the showcase of virtuous examples have proven to be successful strategies in steering private developers towards the integration of solar energy systems in their projects. The direct financial involvement of the municipalities as owners or subsidizing bodies also has positive impacts due to the possibility of setting up obligations for solar installations. Another important aspect to consider is the adoption of simple indicators that allow an evaluation of a masterplan, regarding the integration of solar energy systems. In this context the SAFAR indicator, for instance, developed by the researchers at Lund University in Sweden, relating the suitable space for active solar strategies integration and the total floor area, represents a positive example that can facilitate the transfer between initial solar potential studies and physical systems installation. The necessity of performing solar mapping simulations from the early phases of the planning process represents another fundamental practice when dealing with solar energy. Here, the use of analogue tools in combination with digital ones enhances the optimization process and it provides educational value.
An early approach allows the detection of critical areas for the integration of solar energy planning with other important design parameters (e.g., social, infrastructural, environmental, and economic aspects). In conclusion, more awareness should be present in regard to the study of solar energy in urban areas and its effects (e.g., overshadowing effects, solar mutual inter-buildings reflections) both from public bodies and private developers. It would be ideal to create national guidelines for a solid legislative framework. This would allow key actors involved in the planning process to better study and control related solar energy planning issues in urban contexts such as solar rights (i.e., solar accessibility, shadowing effect).
Author Contributions
Conceptualization, G.L. and M.F.; methodology, G.L. and M.F.; investigation, G.L., M.F. and J.K.; resources, G.L., M.F. and J.K.; writing—original draft preparation, G.L. and M.F.; writing—review and editing, G.L., M.F. and J.K; supervision, G.L. All authors have read and agreed to the published version of the manuscript.
Funding
This research was funded by Swedish Energy Agency; The Research Council of Norway (project no. 257660 FME ZEN and project no. 324243 HELIOS) and the Norwegian University of Science and Technology (NTNU).
Acknowledgments
The authors wish to thank all the experts within the research project IEA SHC Task 51 “Solar Energy in Urban Planning”, who contributed to the successful collection and analysis of the Scandinavian case studies within the subtask C “Case studies and actions research” and for the copyright of graphics, images, tables, and figures. The authors also wish to express their gratitude to the IEA SHC Executive Committee for supporting the Task 51 and in this way strengthening the international collaboration among researchers and practitioners. This work has been written within the Research Centre on Zero Emission Neighbourhoods in Smart Cities (FME ZEN) and the research project HELIOS —enHancing optimal ExpLoitatIOn of Solar energy in Nordic cities through digitalization of built environment (FRIPRO FRINATEK). The authors gratefully acknowledge the support from the ZEN partners and the Research Council of Norway (NFR) (project no. 257660 FME ZEN and project no. 324243 HELIOS).
Conflicts of Interest
The authors declare no conflict of interest.
References
- IEA. Renewables Information: Overview. 2021. Available online: https://www.iea.org/reports/renewables-information-overview (accessed on 6 October 2021).
- IEA. Net Zero by 2050. Paris, 2021. Available online: https://www.iea.org/reports/net-zero-by-2050 (accessed on 6 October 2021).
- Tyagi, V.V.; Rahim, N.A.A.; Rahim, N.A.; Selvaraj, J.A./L. Progress in solar PV technology: Research and achievement. Renew. Sustain. Energy Rev. 2013, 20, 443–461. [Google Scholar] [CrossRef]
- REN21 Secretariat. Renewables 2017 Global Status Report. 2017. Available online: https://www.ren21.net/wp-content/uploads/2019/05/GSR2017_Full-Report_English.pdf (accessed on 6 October 2021).
- REN21 Secretariat. Renewables 2021 Global Status Report. 2021. Available online: https://www.ren21.net/wp-content/uploads/2019/05/GSR2021_Full_Report.pdf (accessed on 1 October 2021).
- IRENA. Rise of Renewables in Cities: Energy Solutions for the Urban Future. International Renewable Energy Agency: Abu Dhabi, 2020. Available online: https://www.irena.org/-/media/Files/IRENA/Agency/Publication/2020/Oct/IRENA_Renewables_in_cities_2020.pdf (accessed on 6 October 2021).
- UN Habitat. Energy. Available online: https://unhabitat.org/topic/energy (accessed on 6 October 2021).
- Croce, S.; Vettorato, D. Urban surface uses for climate resilient and sustainable cities: A catalogue of solutions. Sustain. Cities Soc. 2021, 75, 103313. [Google Scholar] [CrossRef]
- Paatero, J.V.; Lund, P.D. Effects of large-scale photovoltaic power integration on electricity distribution networks. Renew. Energy 2007, 32, 216–234. [Google Scholar] [CrossRef] [Green Version]
- Lobaccaro, G.; Lisowska, M.M.; Saretta, E.; Bonomo, P.; Frontini, F. A Methodological Analysis Approach to Assess Solar Energy Potential at the Neighborhood Scale. Energies 2019, 12, 3554. [Google Scholar] [CrossRef] [Green Version]
- Good, C.S.; Lobaccaro, G.; Hårklau, S. Optimization of Solar Energy Potential for Buildings in Urban Areas—A Norwegian Case Study. Energy Procedia 2014, 58, 166–171. [Google Scholar] [CrossRef] [Green Version]
- Freitas, S.; Catita, C.; Redweik, P.; Brito, M.C. Modelling solar potential in the urban environment: State-of-the-art review. Renew. Sustain. Energy Rev. 2015, 41, 915–931. [Google Scholar] [CrossRef]
- Desthieux, G.; Carneiro, C.; Camponovo, R.; Ineichen, P.; Morello, E.; Boulmier, A.; Abdennadher, N.; Dervey, S.; Ellert, C. Solar Energy Potential Assessment on Rooftops and Facades in Large Built Environments Based on LiDAR Data, Image Processing, and Cloud Computing. Methodological Background, Application, and Validation in Geneva (Solar Cadaster). Front. Built Environ. 2018, 4, 14. [Google Scholar] [CrossRef]
- Florio, P.; Probst, M.C.M.; Schüler, A.; Roecker, C.; Scartezzini, J.-L. Assessing visibility in multi-scale urban planning: A contribution to a method enhancing social acceptability of solar energy in cities. Sol. Energy 2018, 173, 97–109. [Google Scholar] [CrossRef]
- Lingfors, D.; Johansson, T.; Widén, J.; Broström, T. Target-based visibility assessment on building envelopes: Applications to PV and cultural-heritage values. Energy Build. 2019, 204, 109483. [Google Scholar] [CrossRef] [Green Version]
- IEA Statistics. Electric Power Consumption (kWh per Capita)|Data. The World Bank. Available online: https://data.worldbank.org/indicator/EG.USE.ELEC.KH.PC?end=2014&most_recent_value_desc=true&start=2014&view=map (accessed on 6 October 2021).
- Nordic Energy Research. Renewable Energy in the Nordics 2021. 2021. Available online: https://www.nordicenergy.org/wordpress/wp-content/uploads/2021/09/nordicenergyresearch2021-03.pdf (accessed on 6 October 2021).
- Pasonen, R.; Mäki, K.; Alanen, R.; Sipilä, K. Arctic Solar Energy Solutions; VTT Technical Research Centre of Finland: Espoo, Finland, 2012. [Google Scholar]
- Dubey, S.; Sarvaiya, J.N.; Seshadri, B. Temperature Dependent Photovoltaic (PV) Efficiency and Its Effect on PV Production in the World—A Review. Energy Procedia 2013, 33, 311–321. [Google Scholar] [CrossRef] [Green Version]
- Thebault, M.; Gaillard, L. Optimization of the integration of photovoltaic systems on buildings for self-consumption—Case study in France. City Environ. Interact. 2021, 10, 100057. [Google Scholar] [CrossRef]
- Freitas, S.; Brito, M.C. Solar façades for future cities. Renew. Energy Focus 2019, 31, 73–79. [Google Scholar] [CrossRef]
- Lobaccaro, G.; Carlucci, S.; Croce, S.; Paparella, R.; Finocchiaro, L. Boosting solar accessibility and potential of urban districts in the Nordic climate: A case study in Trondheim. Sol. Energy 2017, 149, 347–369. [Google Scholar] [CrossRef]
- Xiang, C.; Matusiak, B.S.; Røyset, A.; Kolås, T. Pixelization approach for façade integrated coloured photovoltaics-with architectural proposals in city context of Trondheim, Norway. Sol. Energy 2021, 224, 1222–1246. [Google Scholar] [CrossRef]
- Wall, M.; Snow, M.; Lundgren, M.; Dahlberg, J.; Wyckmans, A.; Siems, T.; Voss, K.; Simon, K. Annex Plan Task 51: Solar Energy in Urban Planning. IEA SHC, 2013. Available online: https://task51.iea-shc.org/data/sites/1/publications/IEA-SHC-Task51-Annex.pdf (accessed on 6 October 2021).
- Lobaccaro, G.; Croce, S.; Lindkvist, C.; Probst, M.M.; Scognamiglio, A.; Dahlberg, J.; Lundgren, M.; Wall, M. A cross-country perspective on solar energy in urban planning: Lessons learned from international case studies. Renew. Sustain. Energy Rev. 2019, 108, 209–237. [Google Scholar] [CrossRef]
- Jørgensen, O.B.; Croce, S.; Dahlberg, J.; Delmas, A.; Garde, F.; Giostra, S.; He, J.; Horvat, M.; Kanters, J.; Kappel, K.; et al. National and International Comparison of Case Studies on Solar Energy in Urban Planning. IEA SHC Task 51. 2018. Available online: https://www.iea-shc.org/Data/Sites/1/publications/Task51-Report-C2-180208.pdf (accessed on 16 October 2021). [CrossRef]
- Jørgensen, O.B.; Dahlberg, J.; Deschamps, L.; Delmas, A.; Florio, P.; Frontini, F.; Garde, F.; Giostra, S.; Kanters, J.; Kappel, K.; et al. Approaches, Methods and Toolsfor Solar Energy in Urban Planning. IEA SHC Task 51. 2018. Available online: https://www.iea-shc.org/Data/Sites/1/publications/Task51_ReportB2_180815.pdf (accessed on 16 October 2021). [CrossRef]
- Pedersen, A.; Sehested, K.; Sørensen, E. Emerging Theoretical Understanding of Pluricentric Coordination in Public Governance. Am. Rev. Public Adm. 2011, 41, 375–394. [Google Scholar] [CrossRef]
- ENOVA SF. Energimerking.no—Energimerking av bygg. 2014. Available online: https://www.energimerking.no/no/Energimerking-Bygg/ (accessed on 6 October 2021).
- McNeel, R. Rhinoceros 3D, Version 6.0; Robert McNeel &Associates: Seattle, WA, USA, 2010. [Google Scholar]
- Jakubiec, J.A.; Reinhart, C. DIVA 2.0: Integrating Daylight and Thermal Simulations Using Rhinoceros 3D, DAYSIM and EnergyPlus. In Proceedings of the Building Simulation 2011: 12th Conference of International Building Performance Simulation Association, Sydney, Australia, 14–16 November 2011; pp. 2202–2209. [Google Scholar]
- Kanters, J.; Wall, M. The impact of urban design decisions on net zero energy solar buildings in Sweden. Urban. Plan. Transport. Res. 2014, 2, 312–332. [Google Scholar] [CrossRef] [Green Version]
- Lov om Planlegging og Byggesaksbehandling (Plan- og Bygningsloven). 2008. Available online: https://lovdata.no/dokument/NL/lov/2008-06-27-71 (accessed on 6 October 2021).
- Direktoratet for Byggkvalitet. Forskrift om Byggesak (Byggesaksforskriften). 2010. Available online: https://lovdata.no/dokument/SF/forskrift/2010-03-26-488 (accessed on 6 October 2021).
- Direktoratet for Byggkvalitet. Byggteknisk Forskrift (TEK17). 2017. Available online: https://dibk.no/regelverk/byggteknisk-forskrift-tek17/ (accessed on 6 October 2021).
- Forskrift om Økonomisk og Teknisk Rapportering, Inntektsramme for Nettvirksomheten og Tariffer. 1999. Available online: https://lovdata.no/dokument/SF/forskrift/1999-03-11-302 (accessed on 6 October 2021).
- Wall, M.; Hachem-Vermette, C.; Vettorato, D.; Croce, S.; Kanters, J.; Florio, P. Annex Plan Task 63: Solar Neighborhood Planning. IEA SHC, 2019. Available online: http://task63.iea-shc.org/Data/Sites/1/publications/IEA-SHC-Task63--Solar-Neighborhood-Planning--Annex.pdf (accessed on 11 November 2021).
- IEA SHC||Task 63||Solar Neighborhood Planning. Available online: https://task63.iea-shc.org/ (accessed on 11 November 2021).
Figure 1.
Schematic representation of the five sections of the template and the connection with the other subtasks of the Task 51 “Solar Energy in Urban Planning” [26].
Figure 1.
Schematic representation of the five sections of the template and the connection with the other subtasks of the Task 51 “Solar Energy in Urban Planning” [26].

Figure 2.
(On the left) Aerial view of the development are of Ørestad; (on the right) view of the new urban area around the Carlsberg station.
Figure 2.
(On the left) Aerial view of the development are of Ørestad; (on the right) view of the new urban area around the Carlsberg station.

Figure 3.
Adopted solar strategies for the two case studies. (a) Danish Television in Ørestad with PV panels on the roof. (b) Summer shadow analysis for nine planned high-rise buildings in the Carlsberg area (Source: © Esbensen Consult A/S).
Figure 3.
Adopted solar strategies for the two case studies. (a) Danish Television in Ørestad with PV panels on the roof. (b) Summer shadow analysis for nine planned high-rise buildings in the Carlsberg area (Source: © Esbensen Consult A/S).

Figure 4.
NTNU (on the left. Author: © Silvia Croce) and BUW (on the right. Source: © Katharina Simon). Øvre Rotvoll masterplan.
Figure 4.
NTNU (on the left. Author: © Silvia Croce) and BUW (on the right. Source: © Katharina Simon). Øvre Rotvoll masterplan.

Figure 5.
Annual solar irradiation studies for the two analyzed case studies using DIVA-for-Rhino. (a) NTNU (Author: © Silvia Croce); (b) BUW (Source: © Katharina Simon).
Figure 5.
Annual solar irradiation studies for the two analyzed case studies using DIVA-for-Rhino. (a) NTNU (Author: © Silvia Croce); (b) BUW (Source: © Katharina Simon).

Figure 6.
Aerial view of the development areas of Lund Brunnshög (on the left. Source: © Henning Larsen) and Malmö Hyllie (on the right. Source: © Malmö Stad).
Figure 6.
Aerial view of the development areas of Lund Brunnshög (on the left. Source: © Henning Larsen) and Malmö Hyllie (on the right. Source: © Malmö Stad).

Figure 7.
Lund Brunnshög: (a) Masking the areas that receive a higher solar irradiation than a pre-set threshold and (b) an alternative installation of PV (Source: © Jouri Kanters); (c,d) Malmö Hyllie: Simulation of annual solar irradiation (Source: © Jouri Kanters).
Figure 7.
Lund Brunnshög: (a) Masking the areas that receive a higher solar irradiation than a pre-set threshold and (b) an alternative installation of PV (Source: © Jouri Kanters); (c,d) Malmö Hyllie: Simulation of annual solar irradiation (Source: © Jouri Kanters).

Figure 8.
Aerial view of the Danish cases, FredericiaC and Gehry City Harbour (on the left. Source: © Gehry Partners LLP—top; © KCAP—bottom) and of the Swedish cases, Malmö Hyllie and Lund Brunnshög (on the right. Sources: © Atkins—top; © Malmö Stad—bottom).
Figure 8.
Aerial view of the Danish cases, FredericiaC and Gehry City Harbour (on the left. Source: © Gehry Partners LLP—top; © KCAP—bottom) and of the Swedish cases, Malmö Hyllie and Lund Brunnshög (on the right. Sources: © Atkins—top; © Malmö Stad—bottom).

Figure 9.
Danish cases: (a) Gehry City Harbour: solar incidence on proposed scheme with indication of optimal (green), suitable (yellow), and not suitable (red) areas for PV installation (Source: © Dansk Energi Management and Esbensen A/S); (b) FredericiaC: study on the level of daylight on the facades for the future urban development. (Source: © DEM and Esbensen A/S). Swedish cases: (c) Malmö Hyllie; view of the solar potential of roofs and facades; (d) Lund Brunnshög; annual solar irradiation on the building envelope (Source: © Jouri Kanters).

Figure 10.
View of the building integrated photovoltaic facade in Uppsala Frodeparken (on the left. Source: © White Arkitekter) and in the Zero-Emission Office Building in Trondheim (on the right. Source: © Carmel Margaret Lindkvist).
Figure 10.
View of the building integrated photovoltaic facade in Uppsala Frodeparken (on the left. Source: © White Arkitekter) and in the Zero-Emission Office Building in Trondheim (on the right. Source: © Carmel Margaret Lindkvist).

Figure 11.
Uppsala Frodeparken: (a) Source: © White Arkitekter 2020. Shadow cast analysis; (b) Source: © White Arkitekter. Simulated solar irradiation with building mass obstructing the facade and (c) Source: © White Arkitekter. Facade irradiation comparison between unobstructed and obstructed scenarios. Zero-Emission Office Building: (d) Source: © Fredrik Valde Anthonisen and Edvard Schreiner Sjøblom. Aerial view; (e) Source: © Gabriele Lobaccaro. Solar potential analysis unobstructed scenario; (f) Source: © Gabriele Lobaccaro. Solar potential analysis obstructed scenario with the current PV (dashed white line) and the two proposed areas (areas A and B) for relocation (dashed green line).


Table 1.
Classification of the building environments.
| Environment | Description |
|---|---|
 | Existing areas. The first group includes three case studies of existing urban infrastructure. It is essential to consider a scale larger than a single building to fully understand the impact on the surrounding when making urban planning decisions. This group is therefore characterized by fill-ins and densification processes, where new buildings are connected to the surrounding urban fabric. |
 | New areas. The second group includes seven case studies of completely new developments, requiring new infrastructures and detailed development plans. Urban planners are involved from the beginning of the design process, and they can have a higher level of control to address the various aspects of solar energy integration. |
Table 2.
Overview of the analyzed case studies.
| Location | Picture | Name | Classification | Areas of Interest | Area/m2 | Energy Strategies | Highlights |
|---|---|---|---|---|---|---|---|
Copenhagen  |  | Ørestad | New development | Scale and planning process | 1,830,000 | PV roof PV facades |
|
Copenhagen  |  | Carlsberg | Fill-ins and densification | Scale and planning process | 210,000 | PV roof PV facades |
|
Fredericia  |  | FredericiaC | New development | Scale and planning process | 204,000 | PV roof Solar gains Daylight DH |
|
Sonderborg  |  | Gehry City Habour | New development | Scale and planning process | 50,000 | PV roof Solar gains Daylight |
|
Trondheim  |  | Zero Emission Office Building | Fill-ins and densification | Legislation and planning process | 4000 | PV facade |
|
Trondheim  |  | Øvre Rotvoll BUW | New development | Scale and planning process | 275,000 | PV roof PV facades ST facades |
|
Trondheim  |  | Øvre Rotvoll NTNU | New development | Scale and planning process | 255,000 | PV ST |
|
Uppsala  |  | Uppsala Frodeparken | Fill-ins and densification | Legislation and planning process | 10,000 | PV facade |
|
Lund  |  | Lund Brunnshög | New development | Scale and planning process Targets and goals | 250,000 | PV roof PV façade DH Waste heat recovery |
|
Malmö  |  | Malmö Hyllie | New development | Scale and planning process Targets and goals | 500,000 | PV DH |
|
Publisher’s Note: MDPI stays neutral with regard to jurisdictional claims in published maps and institutional affiliations. |
© 2021 by the authors. Licensee MDPI, Basel, Switzerland. This article is an open access article distributed under the terms and conditions of the Creative Commons Attribution (CC BY) license (https://creativecommons.org/licenses/by/4.0/).
Share and Cite
MDPI and ACS Style
Formolli, M.; Lobaccaro, G.; Kanters, J. Solar Energy in the Nordic Built Environment: Challenges, Opportunities and Barriers. Energies 2021, 14, 8410. https://doi.org/10.3390/en14248410
AMA Style
Formolli M, Lobaccaro G, Kanters J. Solar Energy in the Nordic Built Environment: Challenges, Opportunities and Barriers. Energies. 2021; 14(24):8410. https://doi.org/10.3390/en14248410
Chicago/Turabian StyleFormolli, Matteo, Gabriele Lobaccaro, and Jouri Kanters. 2021. "Solar Energy in the Nordic Built Environment: Challenges, Opportunities and Barriers" Energies 14, no. 24: 8410. https://doi.org/10.3390/en14248410
Note that from the first issue of 2016, this journal uses article numbers instead of page numbers. See further details here.