
Environmental Impacts and Benefits of the End-of-Life of Building Materials: Database to Support Decision Making and Contribute to Circularity

 , ,
, ,  , , and
Abstract
:1. Introduction
2. Literature Review
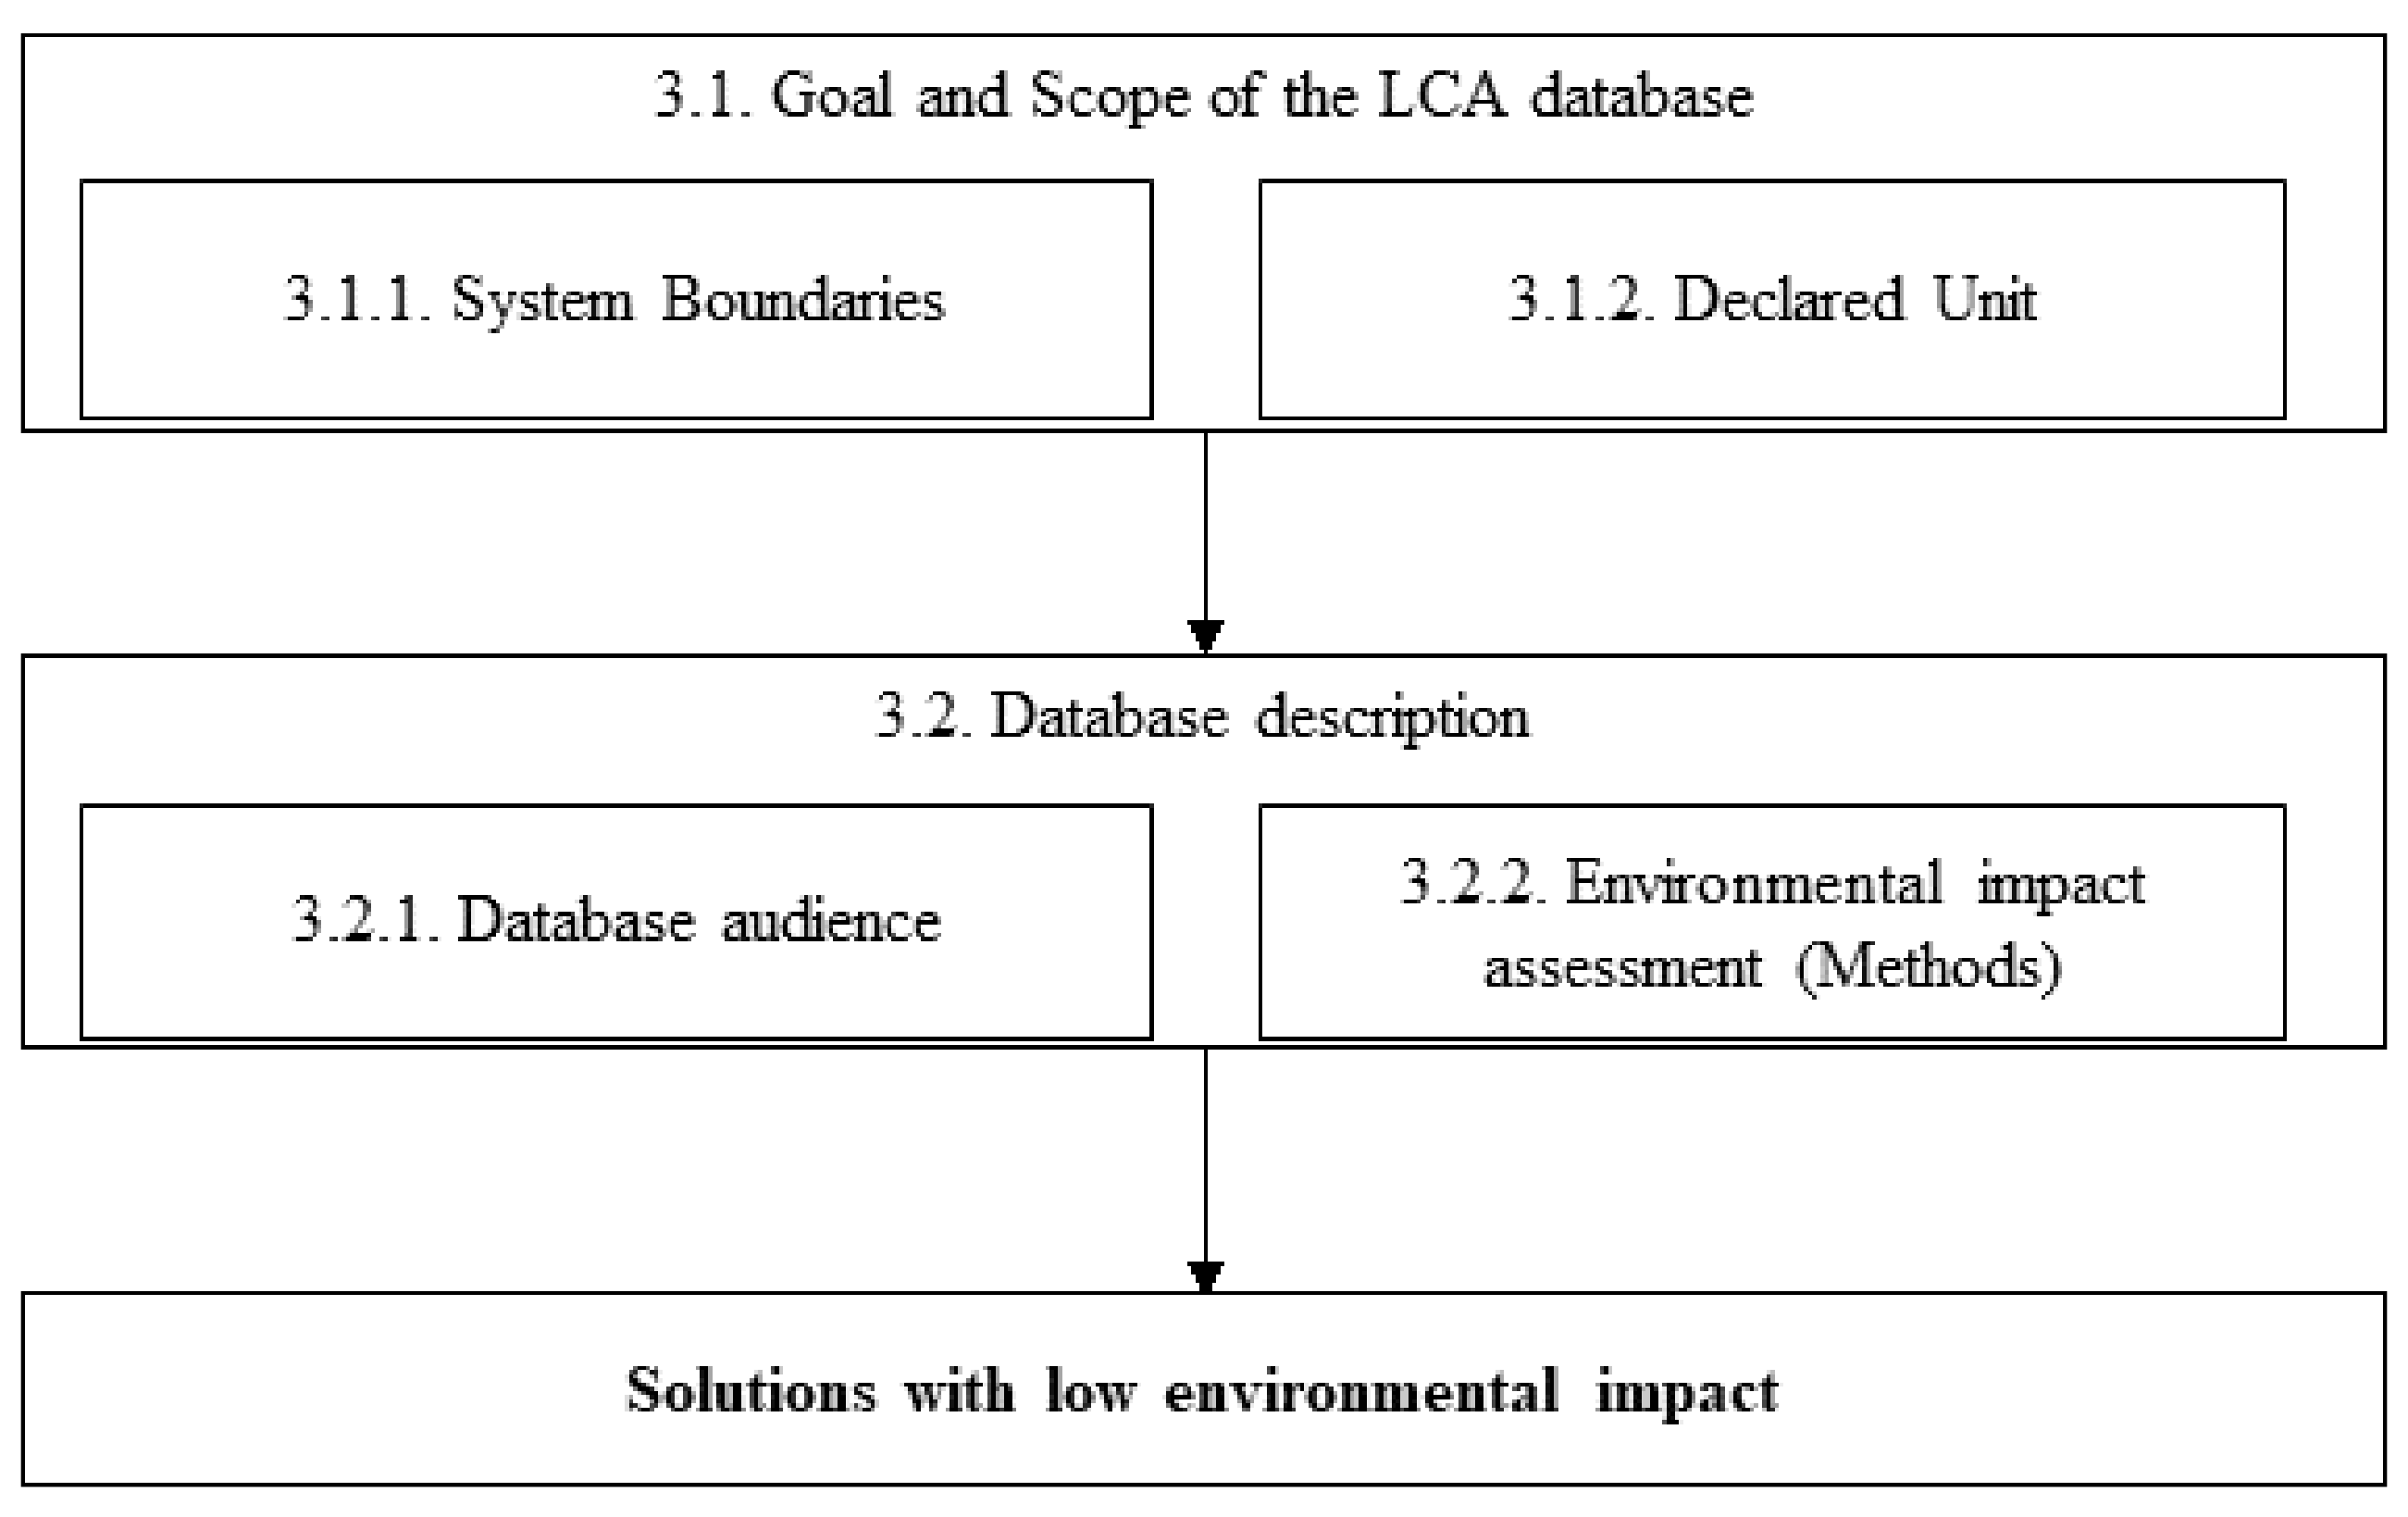
3. Methodology
3.1. Goal and Scope Definition
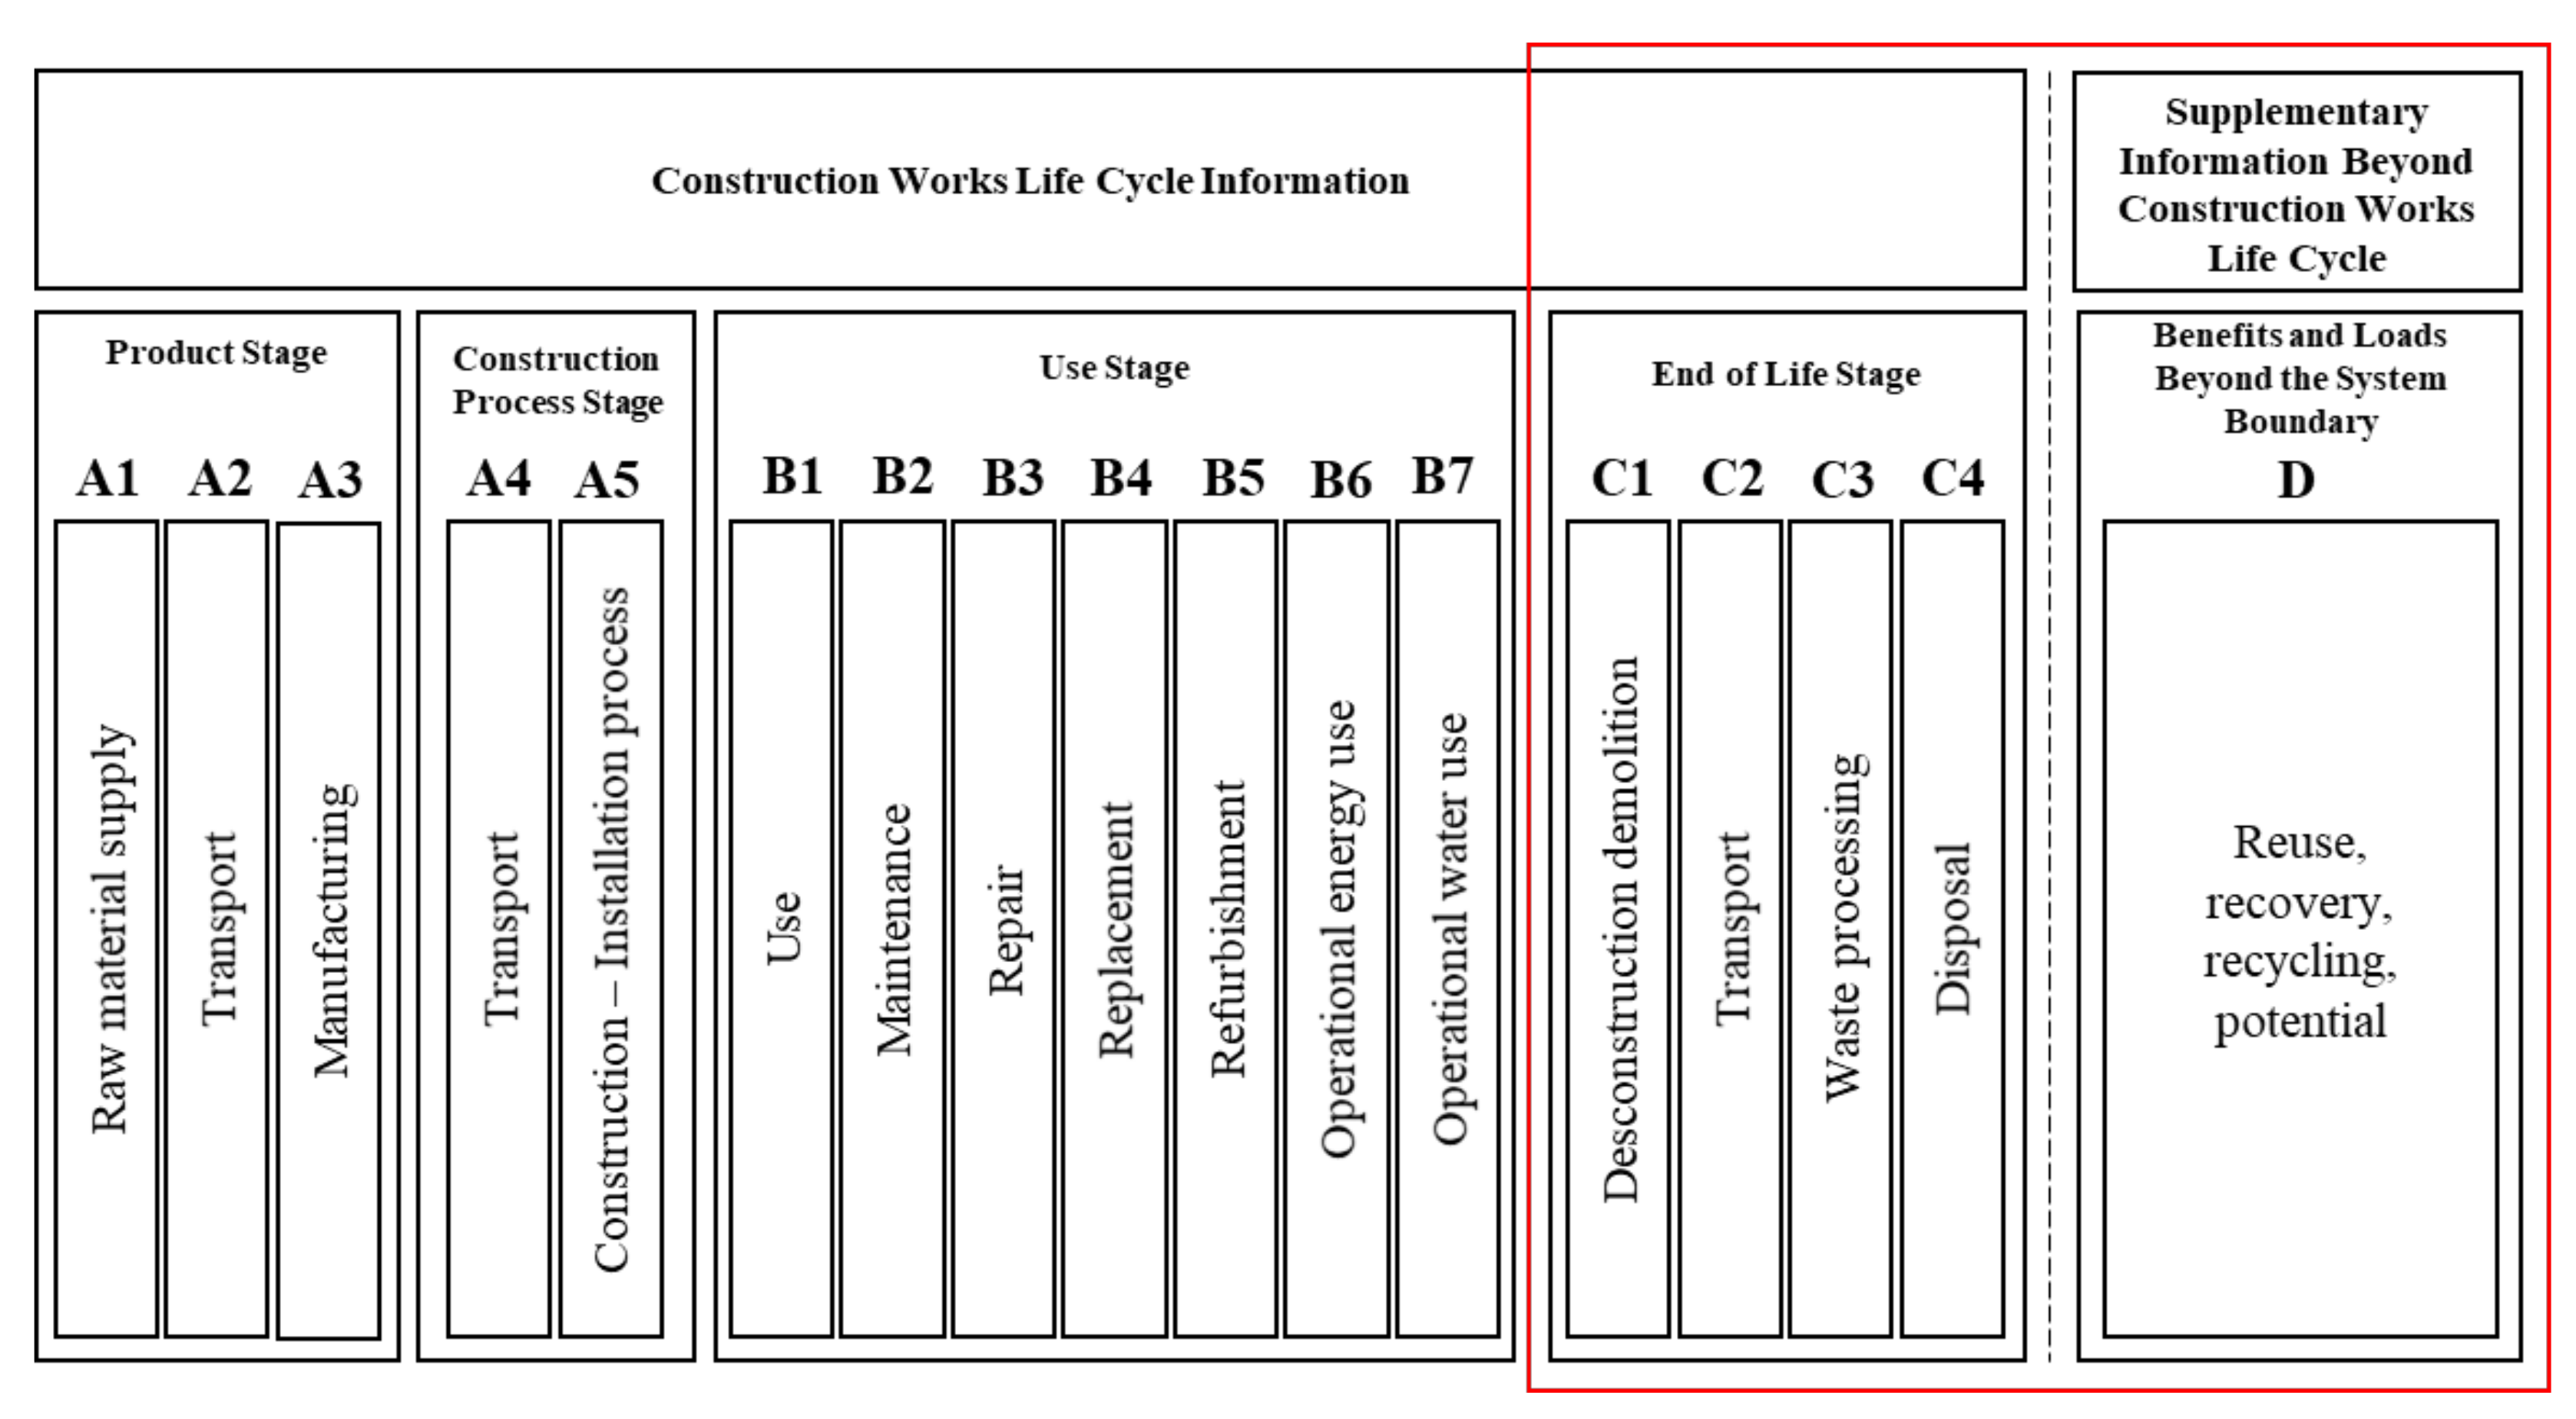
3.1.1. System Boundaries
- (i)
- selective demolition process (deconstruction) or the traditional demolition of building components;
- (ii)
- collection of construction waste and on-site sorting process;
- (iii)
- transport to the treatment plant for recycling/recovery processes or transport of mobile recycling plants; and/or
- (iv)
- disposal of waste to landfill [27].
3.1.2. Declared Unit
3.2. Database Description
3.2.1. Database Audience
3.2.2. Environmental Impact Assessment—Methods
- (i)
- the type of demolition carried out;
- (ii)
- the transport;
- (iii)
- and the processing that the CDW undergoes, including a consideration of the environmental impact avoided by the use of these secondary materials.
- Calculation of the net output streams of secondary material from the product system: adding all output streams and subtracting all input streams of this type in each sub-stage (C1 and C4), followed by the total calculation in stage C, and finally, the total of the product system;
- Calculation of impacts and potential benefits related to the processing of the net outflows calculated in the previous step: adding the impacts of the recycling and recovery processes beyond the boundary system limit (stage D), i.e., after the end-of-waste state, to the point of functional equivalence (‘when secondary material or energy replaces primary production’), and subtracting the impacts related to ‘substituting product production or generating energy from primary sources’;
- Applying a justified value correction factor (to reflect the difference in functional equivalence when the output stream ‘does not reach the functional equivalence of the replacement process’).
- (rp.(In-Ir)) at substage A1 (includes secondary material input processing and recycling processes). Only the impact of Ir is considered for the amount of secondary material used;
- (re.(Iw-It)), expressed by a reduced environmental impact (re.It instead of re.Iw), in the production system phase where the waste flow occurs;
- ((In-Ir) for Nf), this impact reduction being considered as impacts and benefits in module D, when recycling occurs after the end-of-waste state.
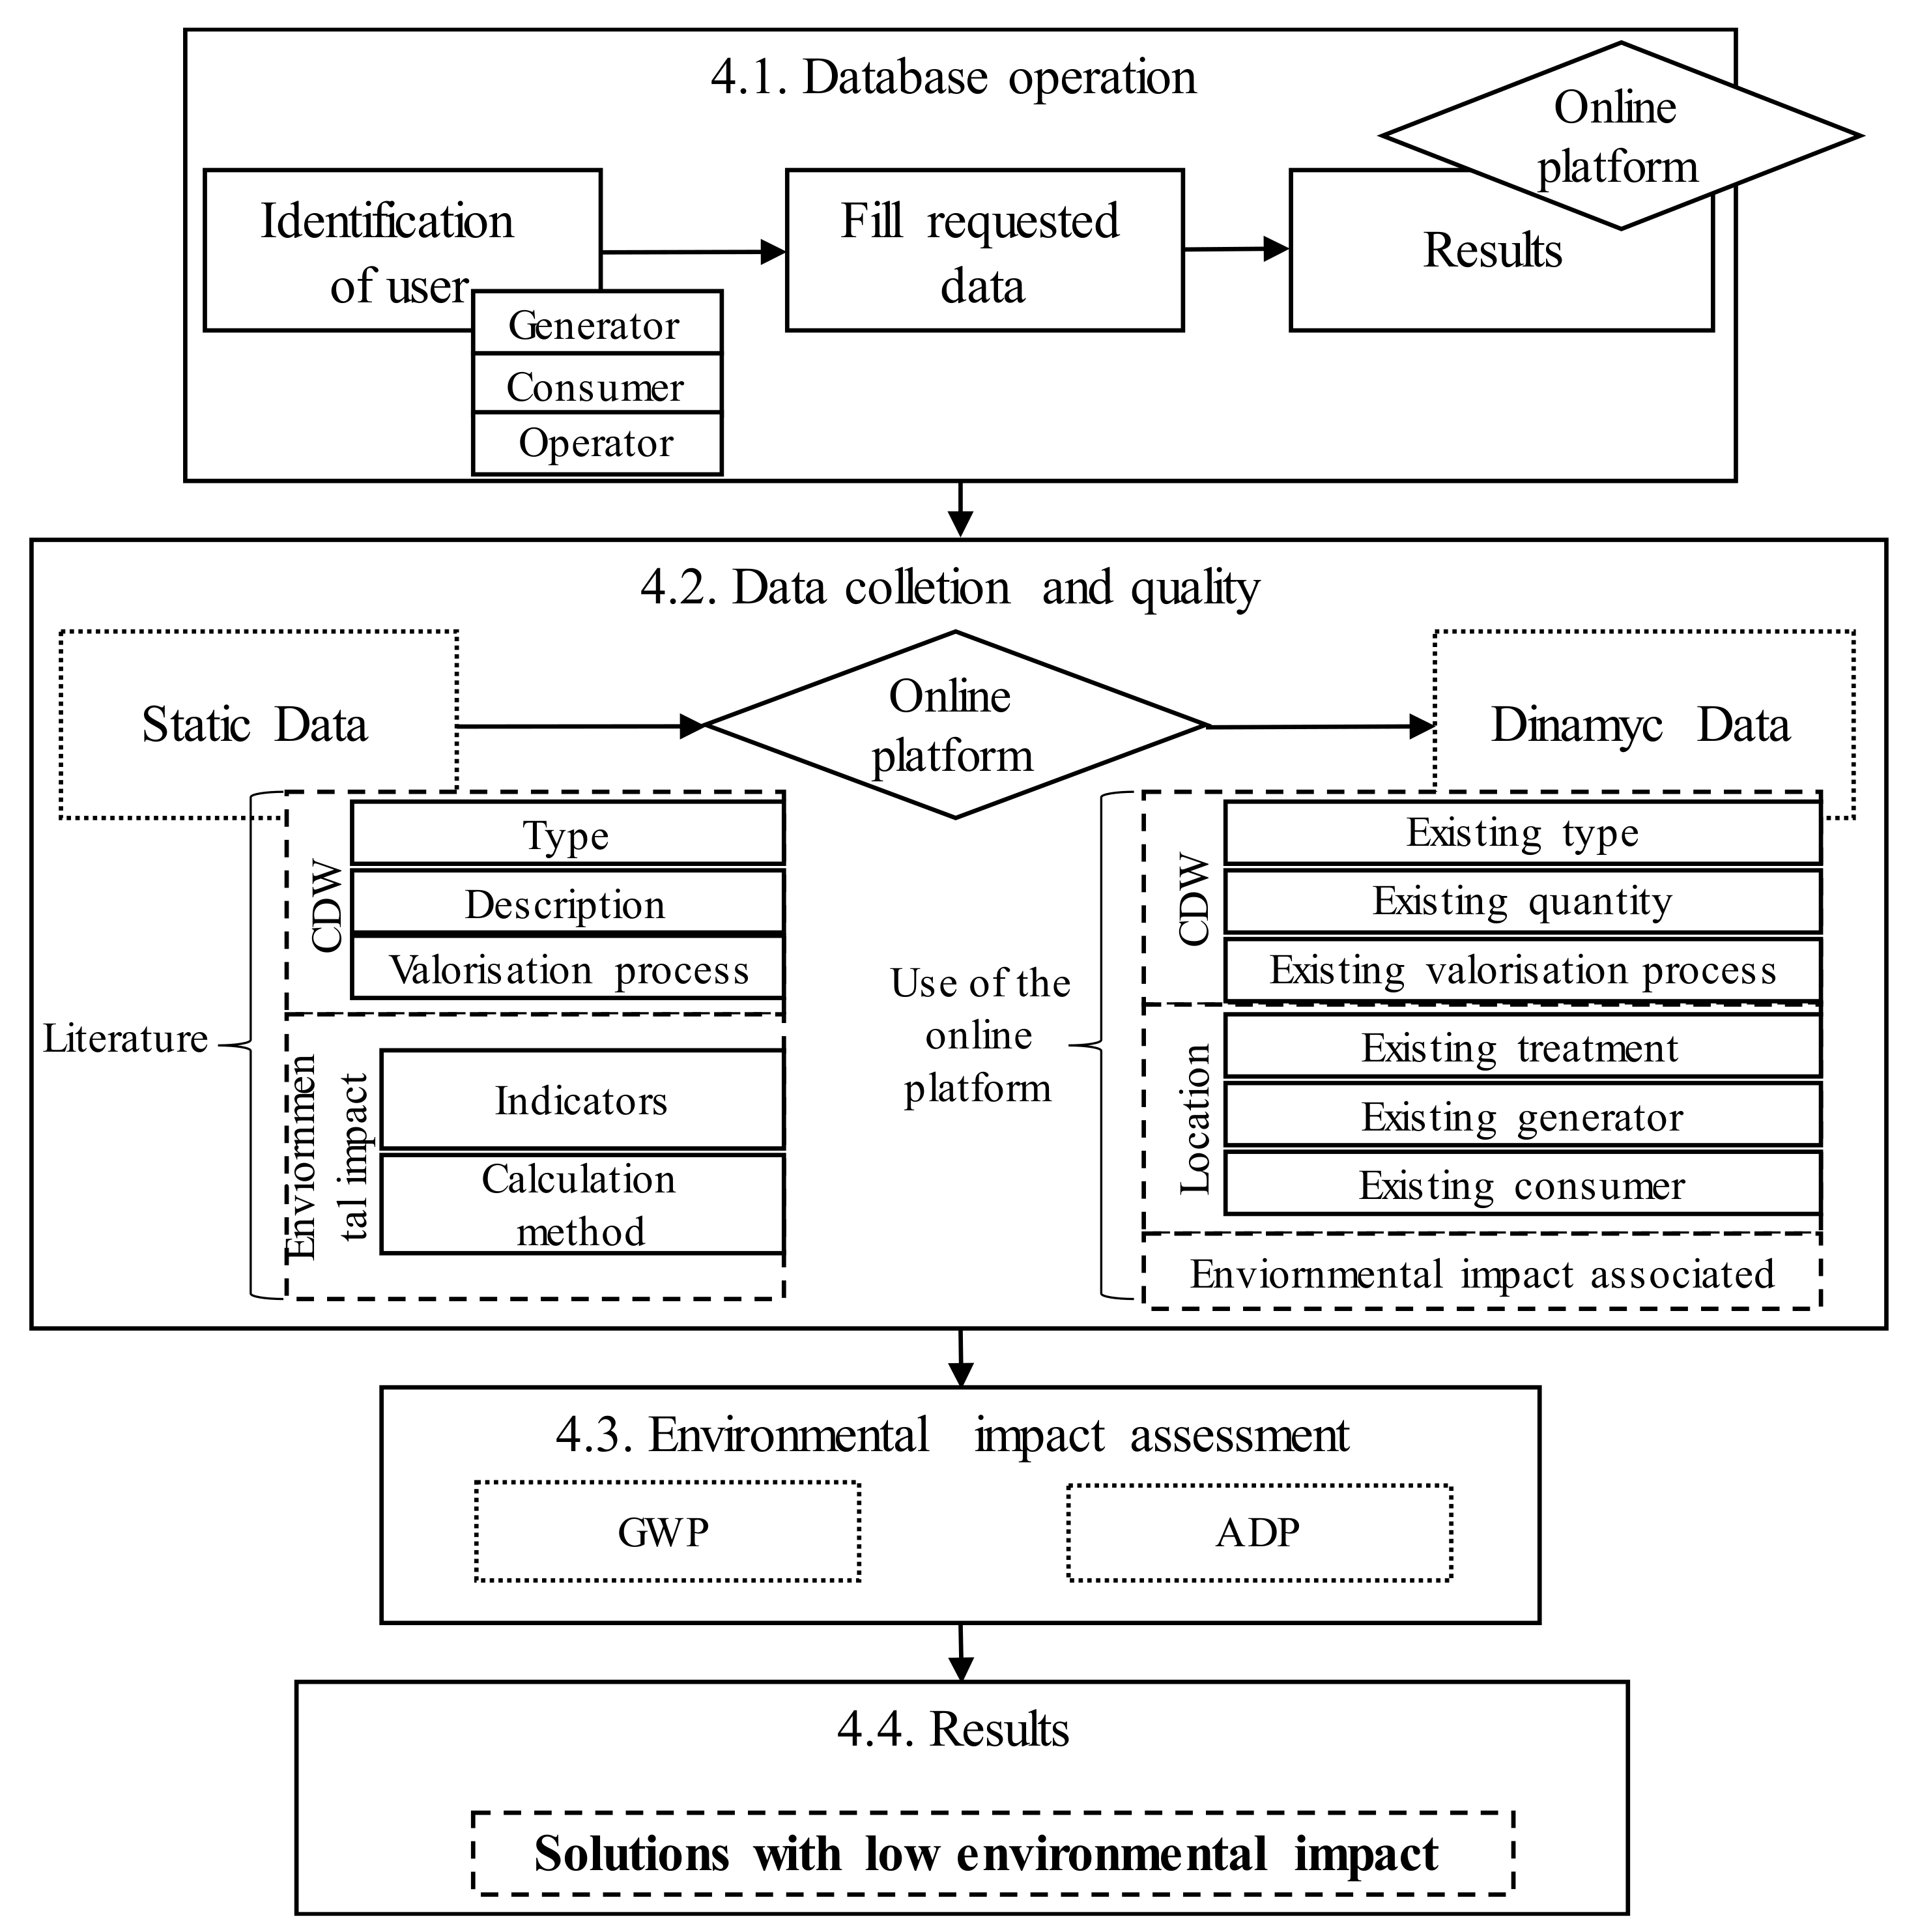
4. Database Development
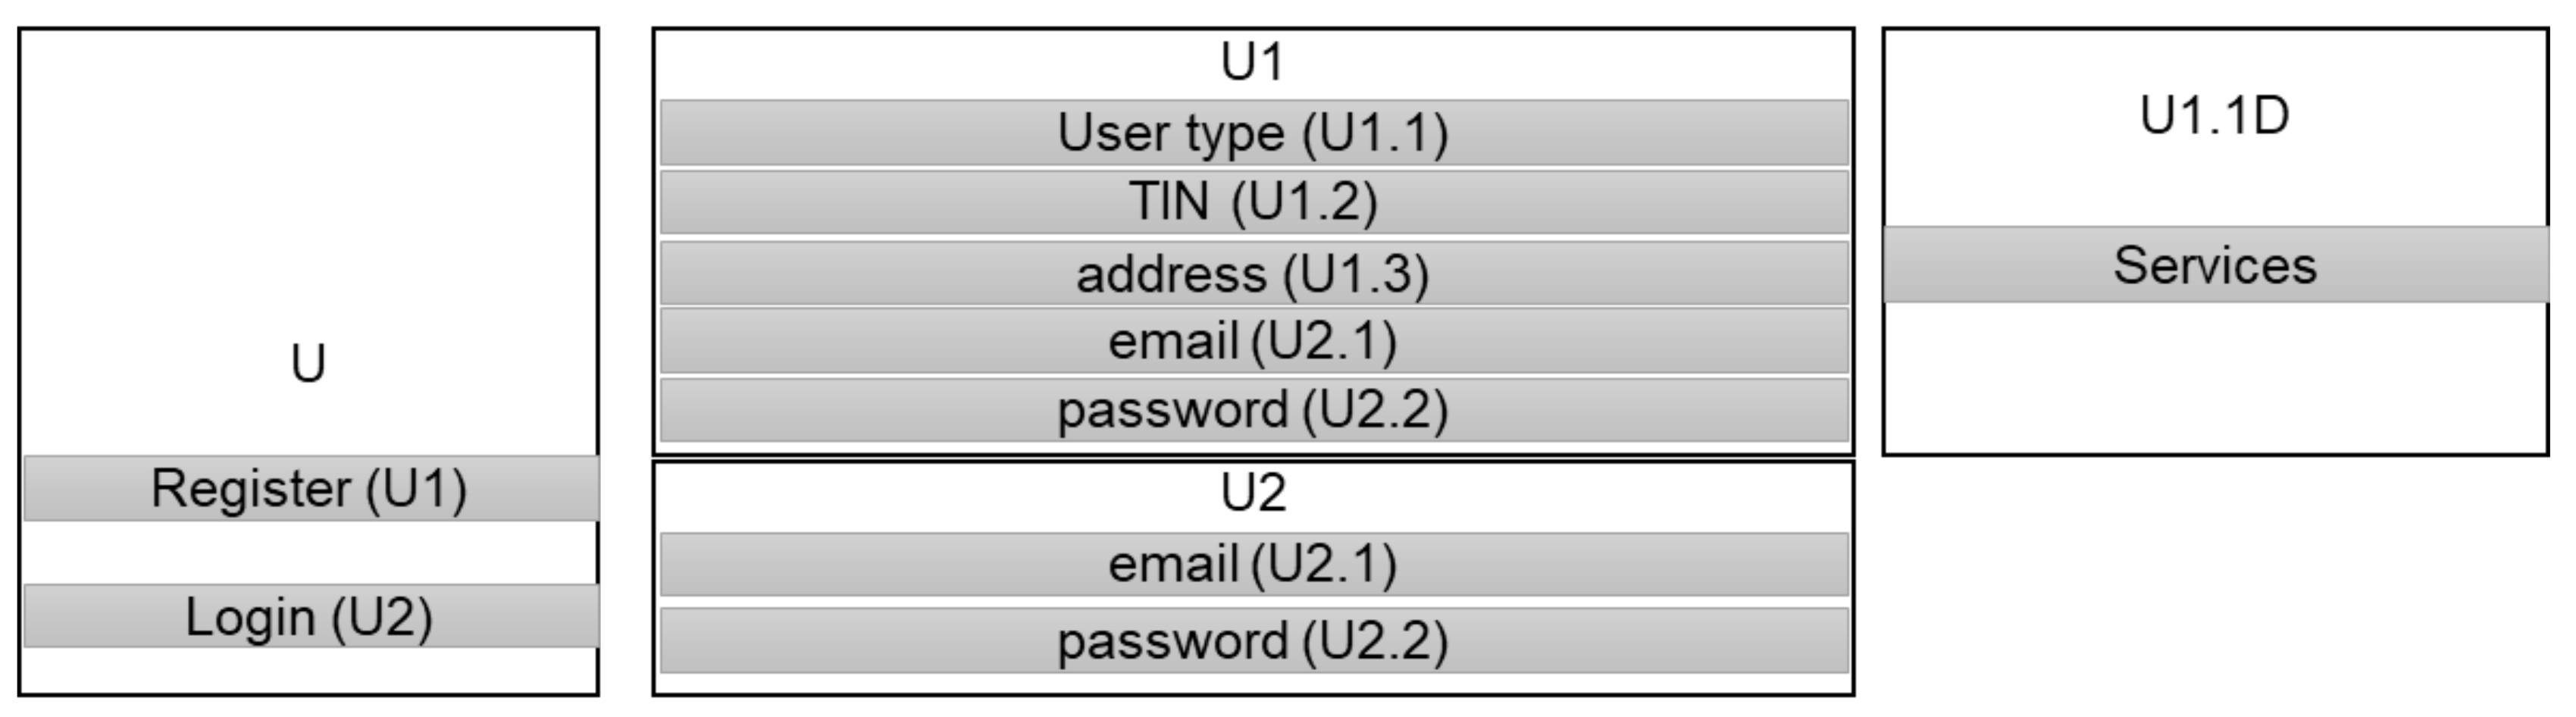
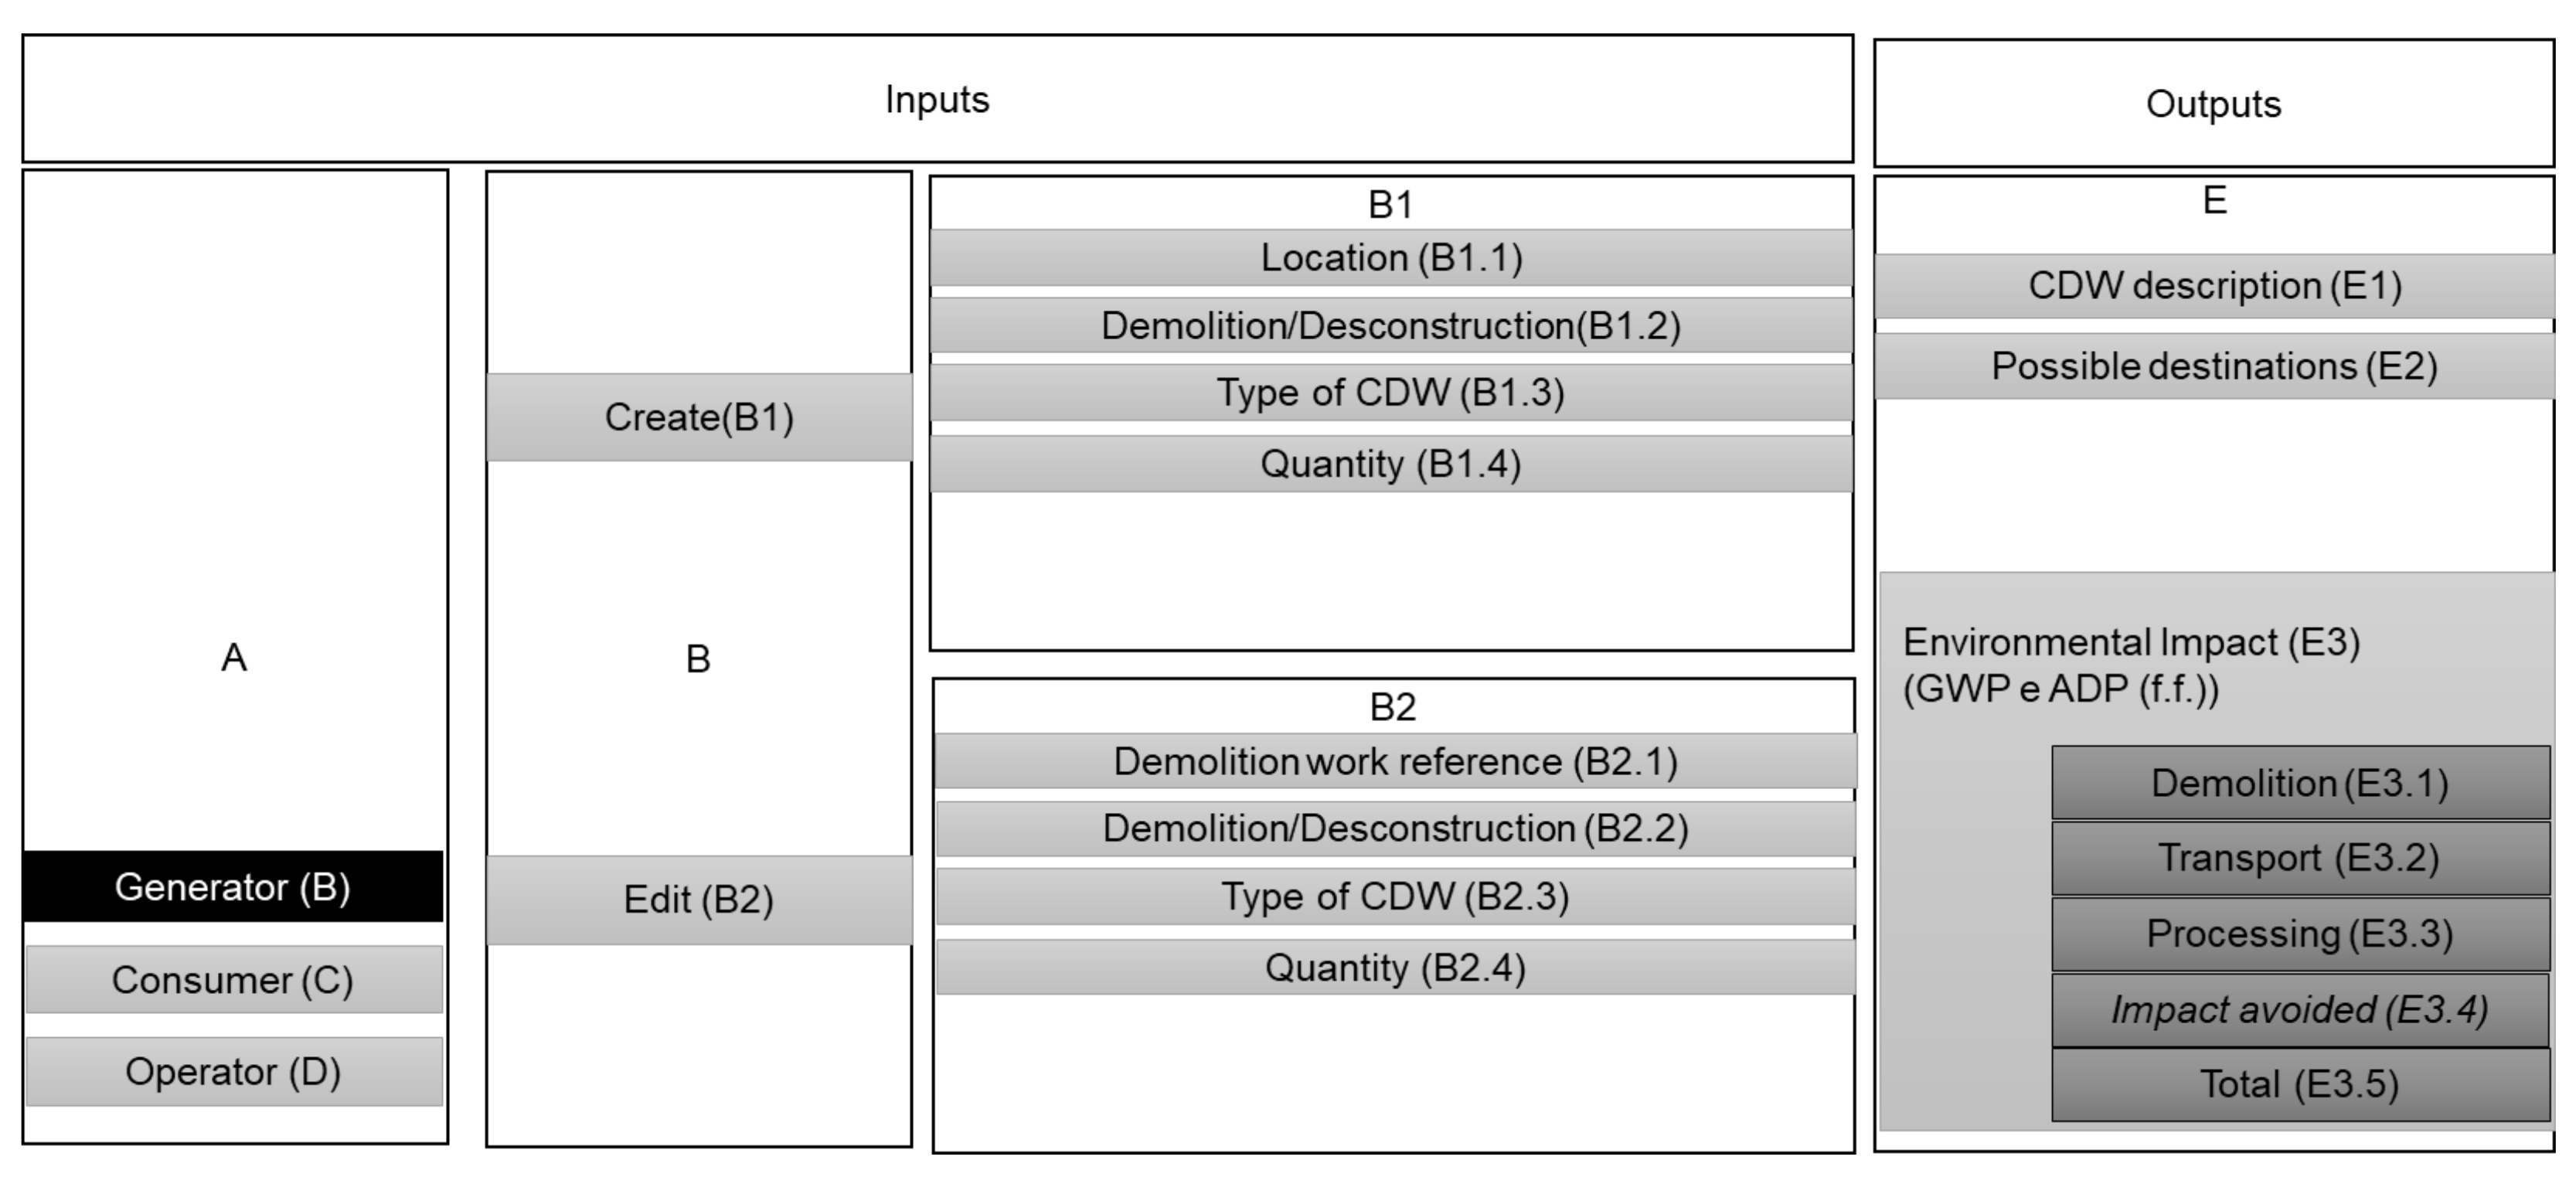
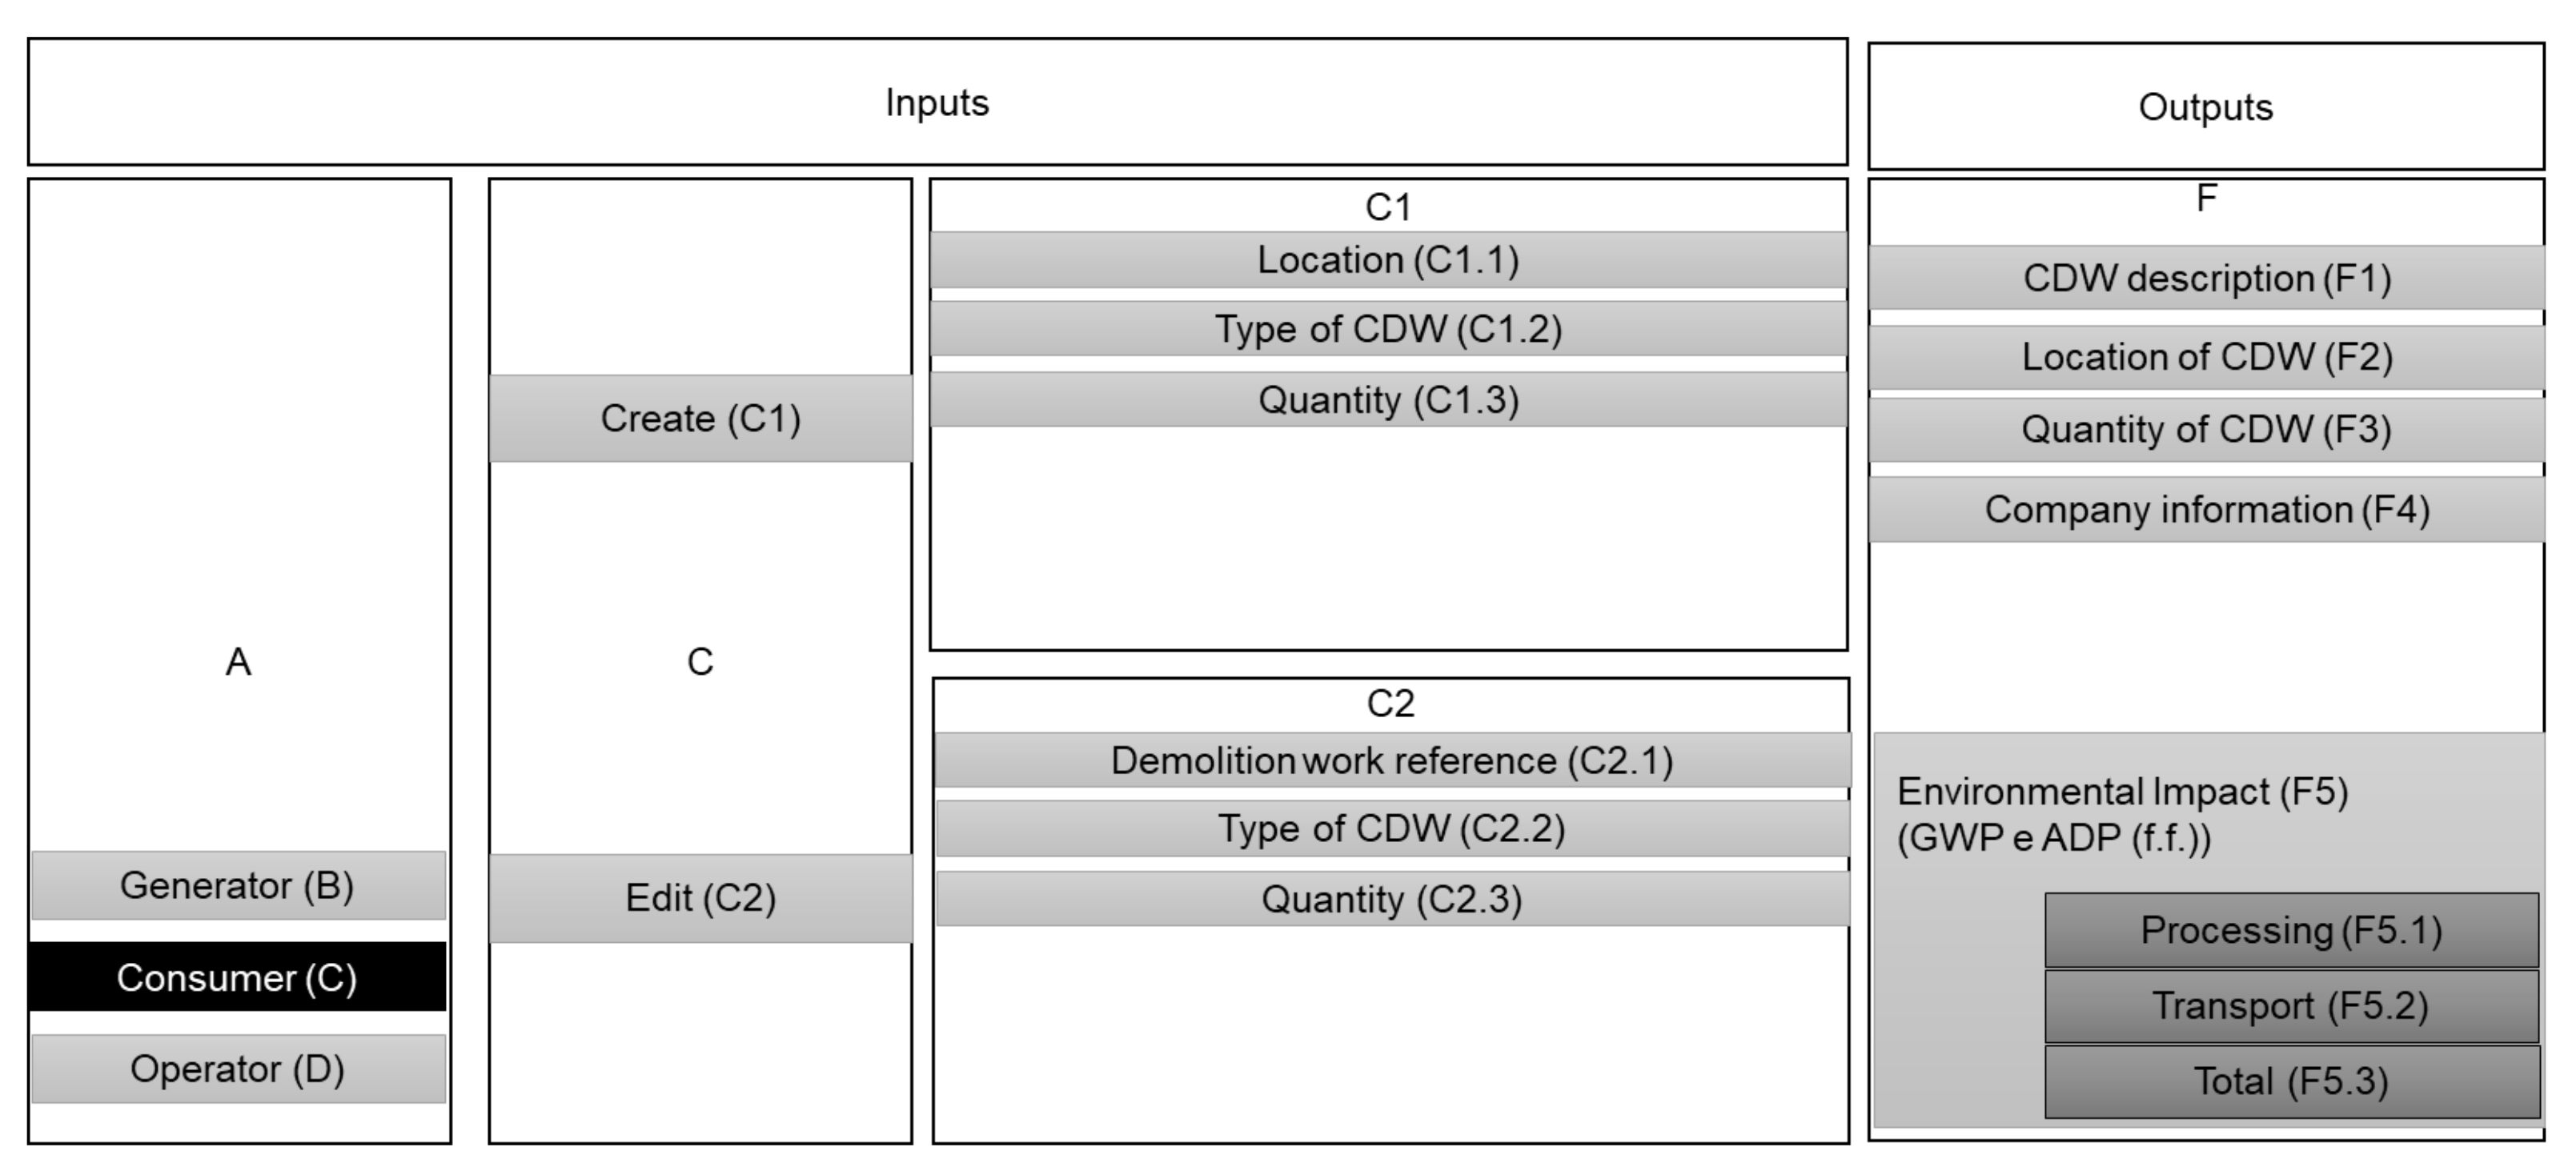
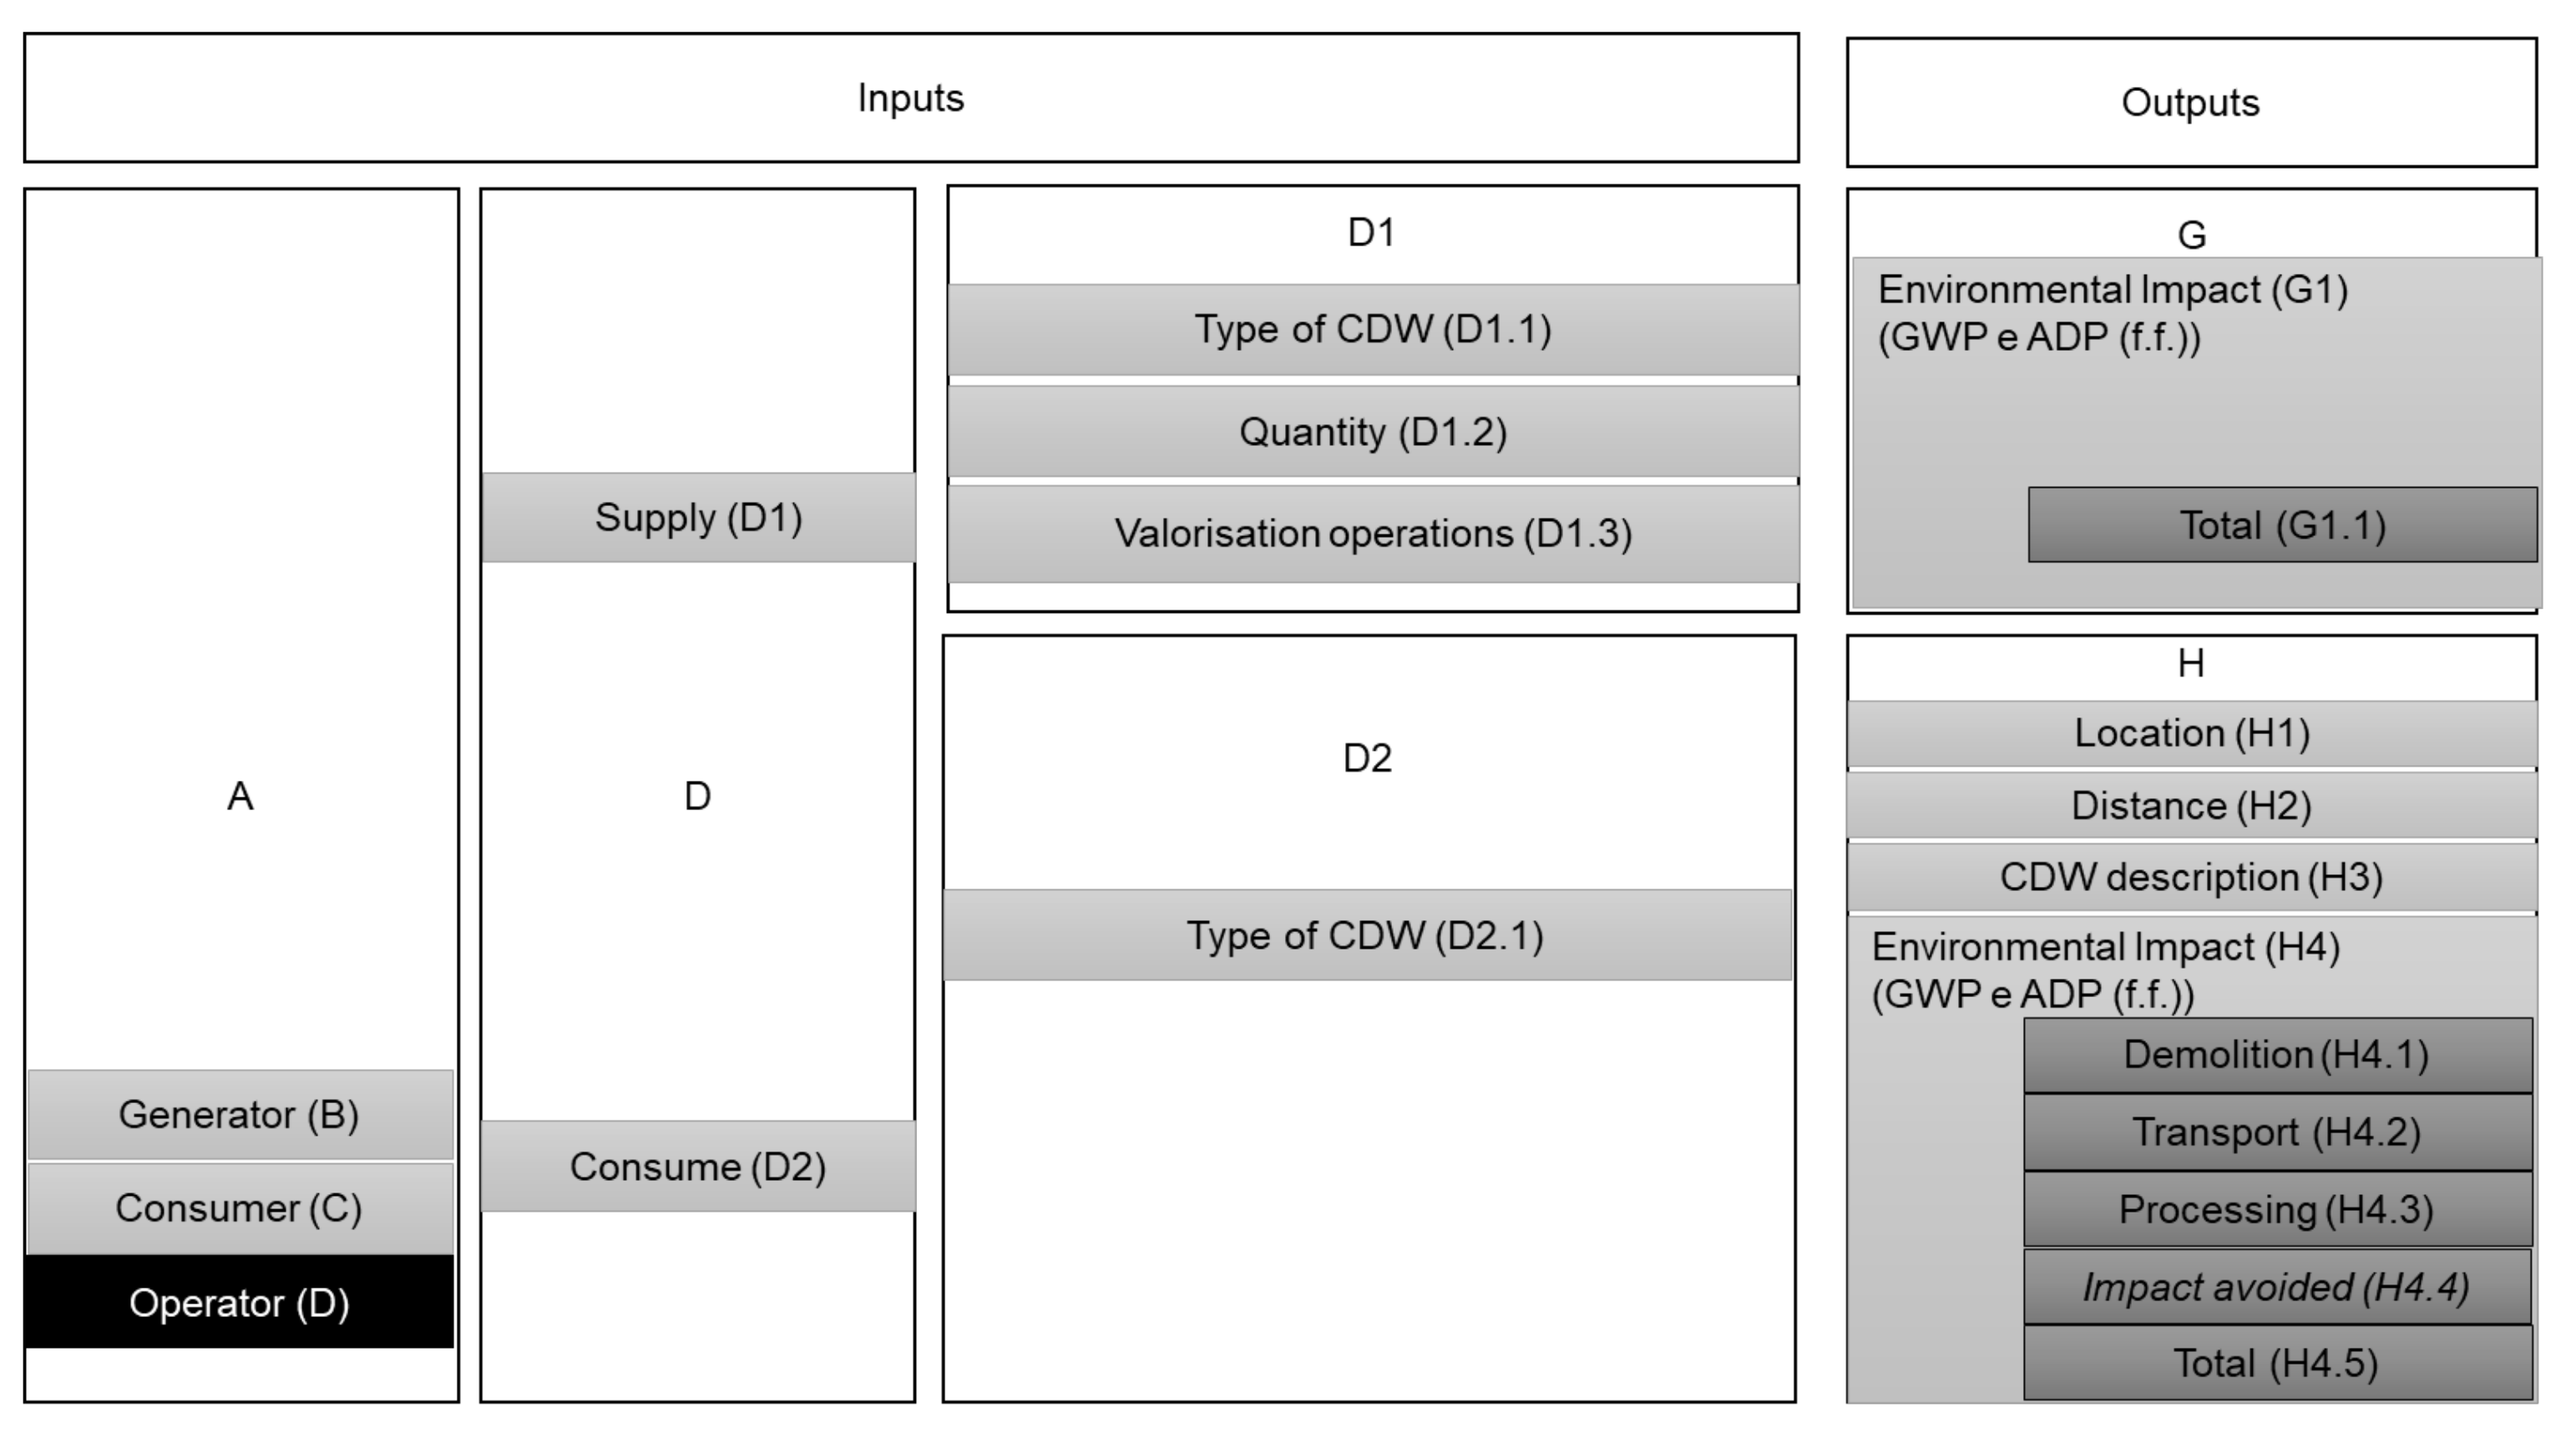
4.1. Database Operation
4.2. Data Collection and Quality
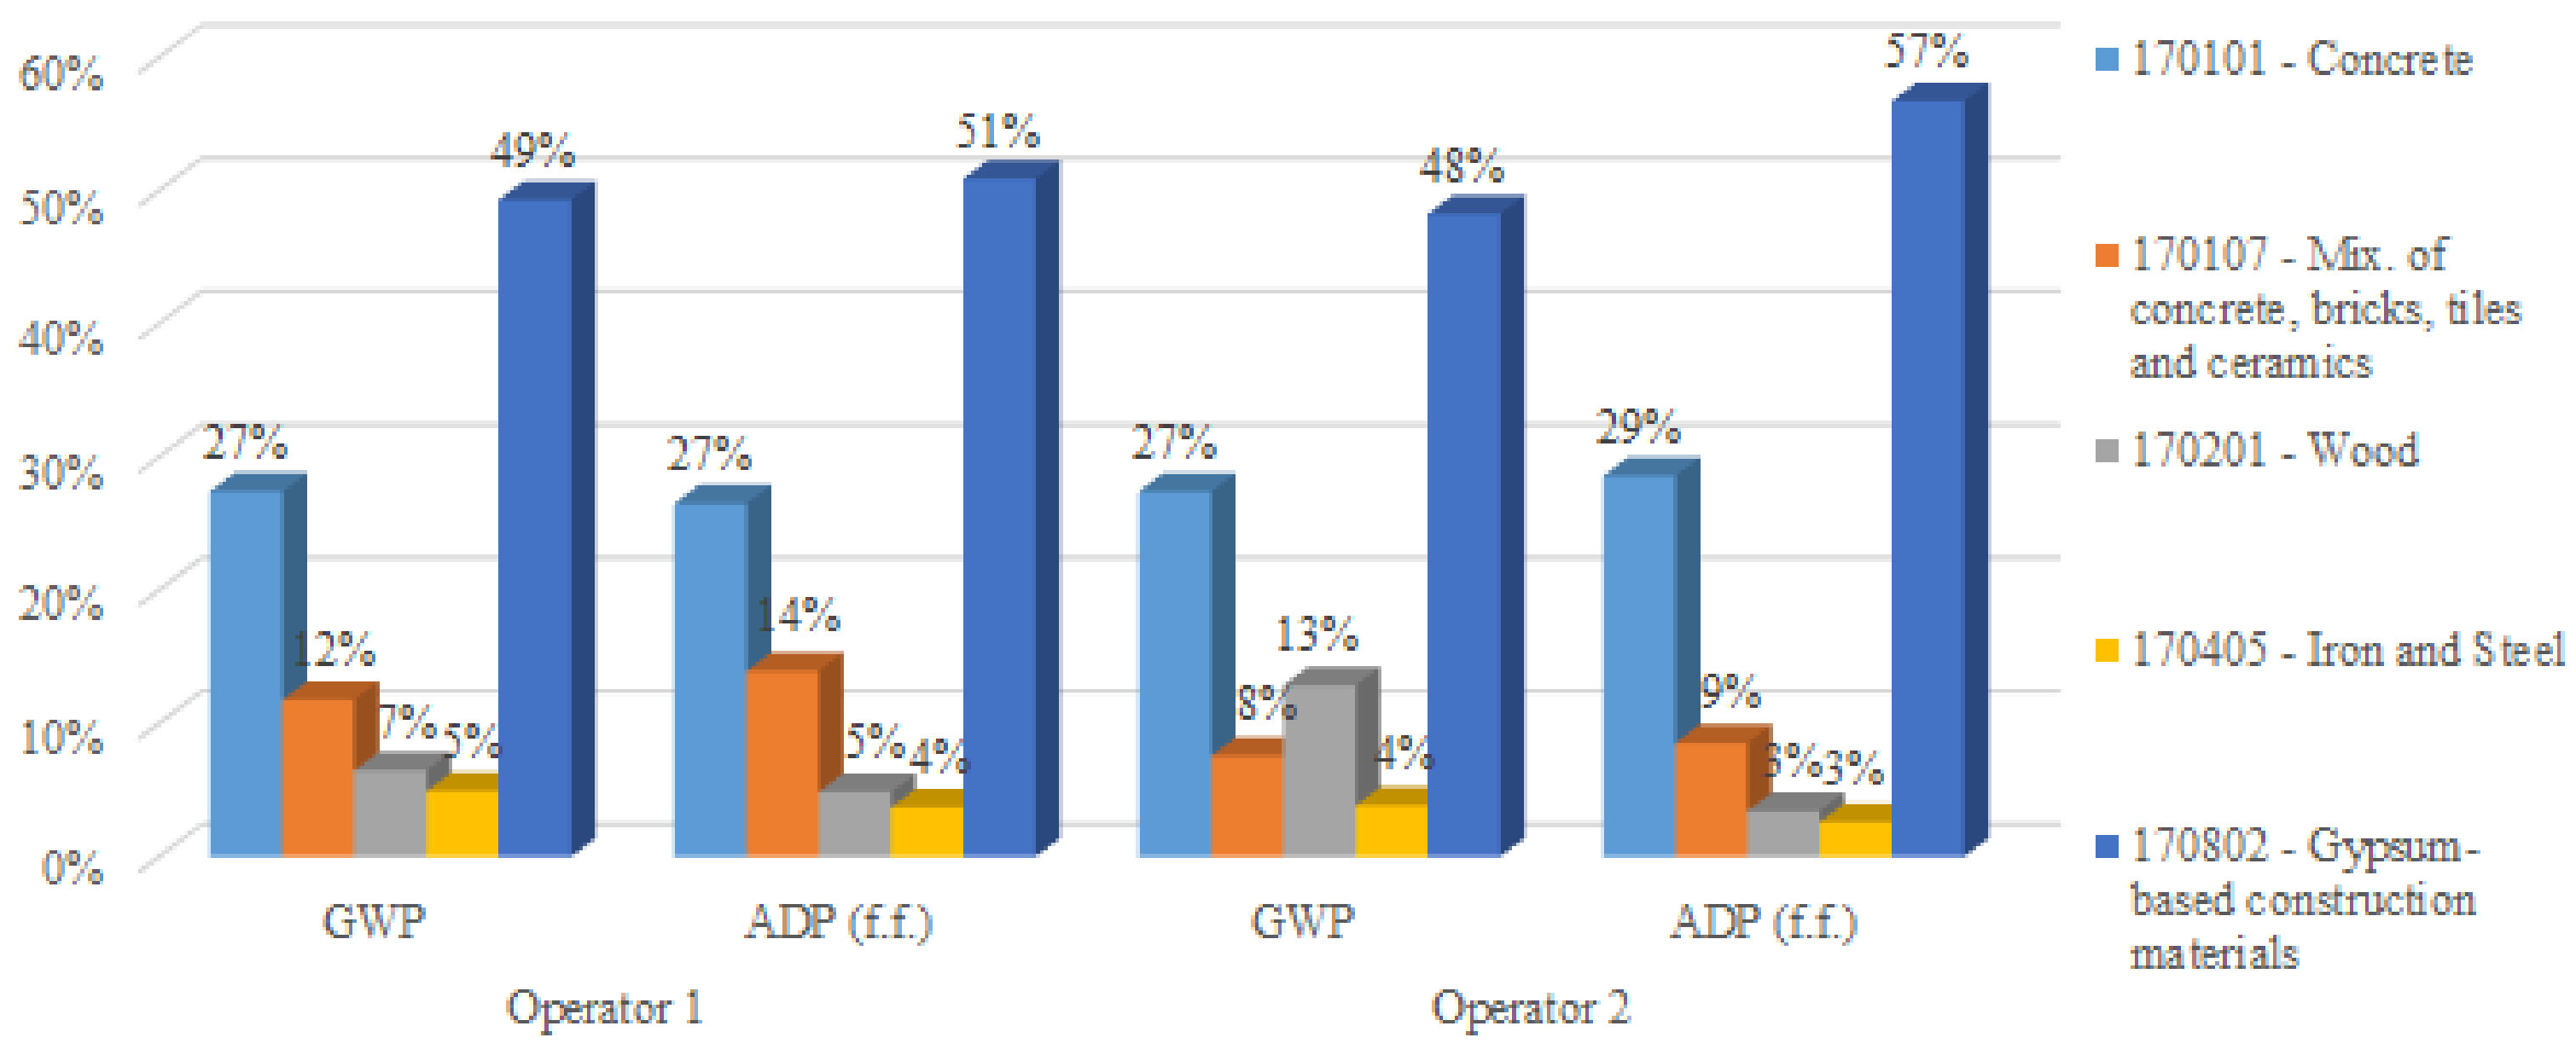
4.3. Environmental Impact Assessment—Indicators
- GWP (fossil)—This indicator accounts for GWP from greenhouse gas (GHG) emissions and removals from any process that involves oxidation or the reduction of fossil fuels, or emissions from materials containing fossil carbon through their transformation or degradation (e.g., combustion, incineration, landfilling, etc.). This indicator also accounts for GWP from GHG emissions, e.g., from peat and calcination, as well as GHG removals, e.g., from the carbonation of cement-based materials and lime;
- GWP (biogenic)—This indicator accounts for GWP from the transformation of CO2 into biomass from all sources except native forests, because the transfer of carbon, sequestered by living biomass, from nature into the product system is declared as GWP (biogenic). This indicator also accounts for GWP from transfers of any biogenic carbon from previous product systems into the product system under study. This indicator also covers biogenic emissions into the air from biomass from all sources except native forests due to oxidation or degradation (e.g., combustion, solid waste disposal) as well as all transfers of biogenic carbon from biomass from all sources except native forests into subsequent product systems in the form of biogenic CO2;
- GWP (luluc)—This indicator accounts for GHG emissions and removals (CO2, CO, and CH4) originating from changes in the defined carbon stocks caused by land use and land use changes associated with the declared/functional unit. This indicator includes biogenic carbon exchanges resulting, e.g., from deforestation or other soil activities (including soil carbon emissions). For native forests, all related CO2 emissions are included and modelled under this subcategory (including connected soil emissions, products derived from native forest, and residues). CO2 uptake related to the carbon content of biomass entering the product system from native forests is set to zero. Impacts are declared in the modules where they occur.
4.4. Results
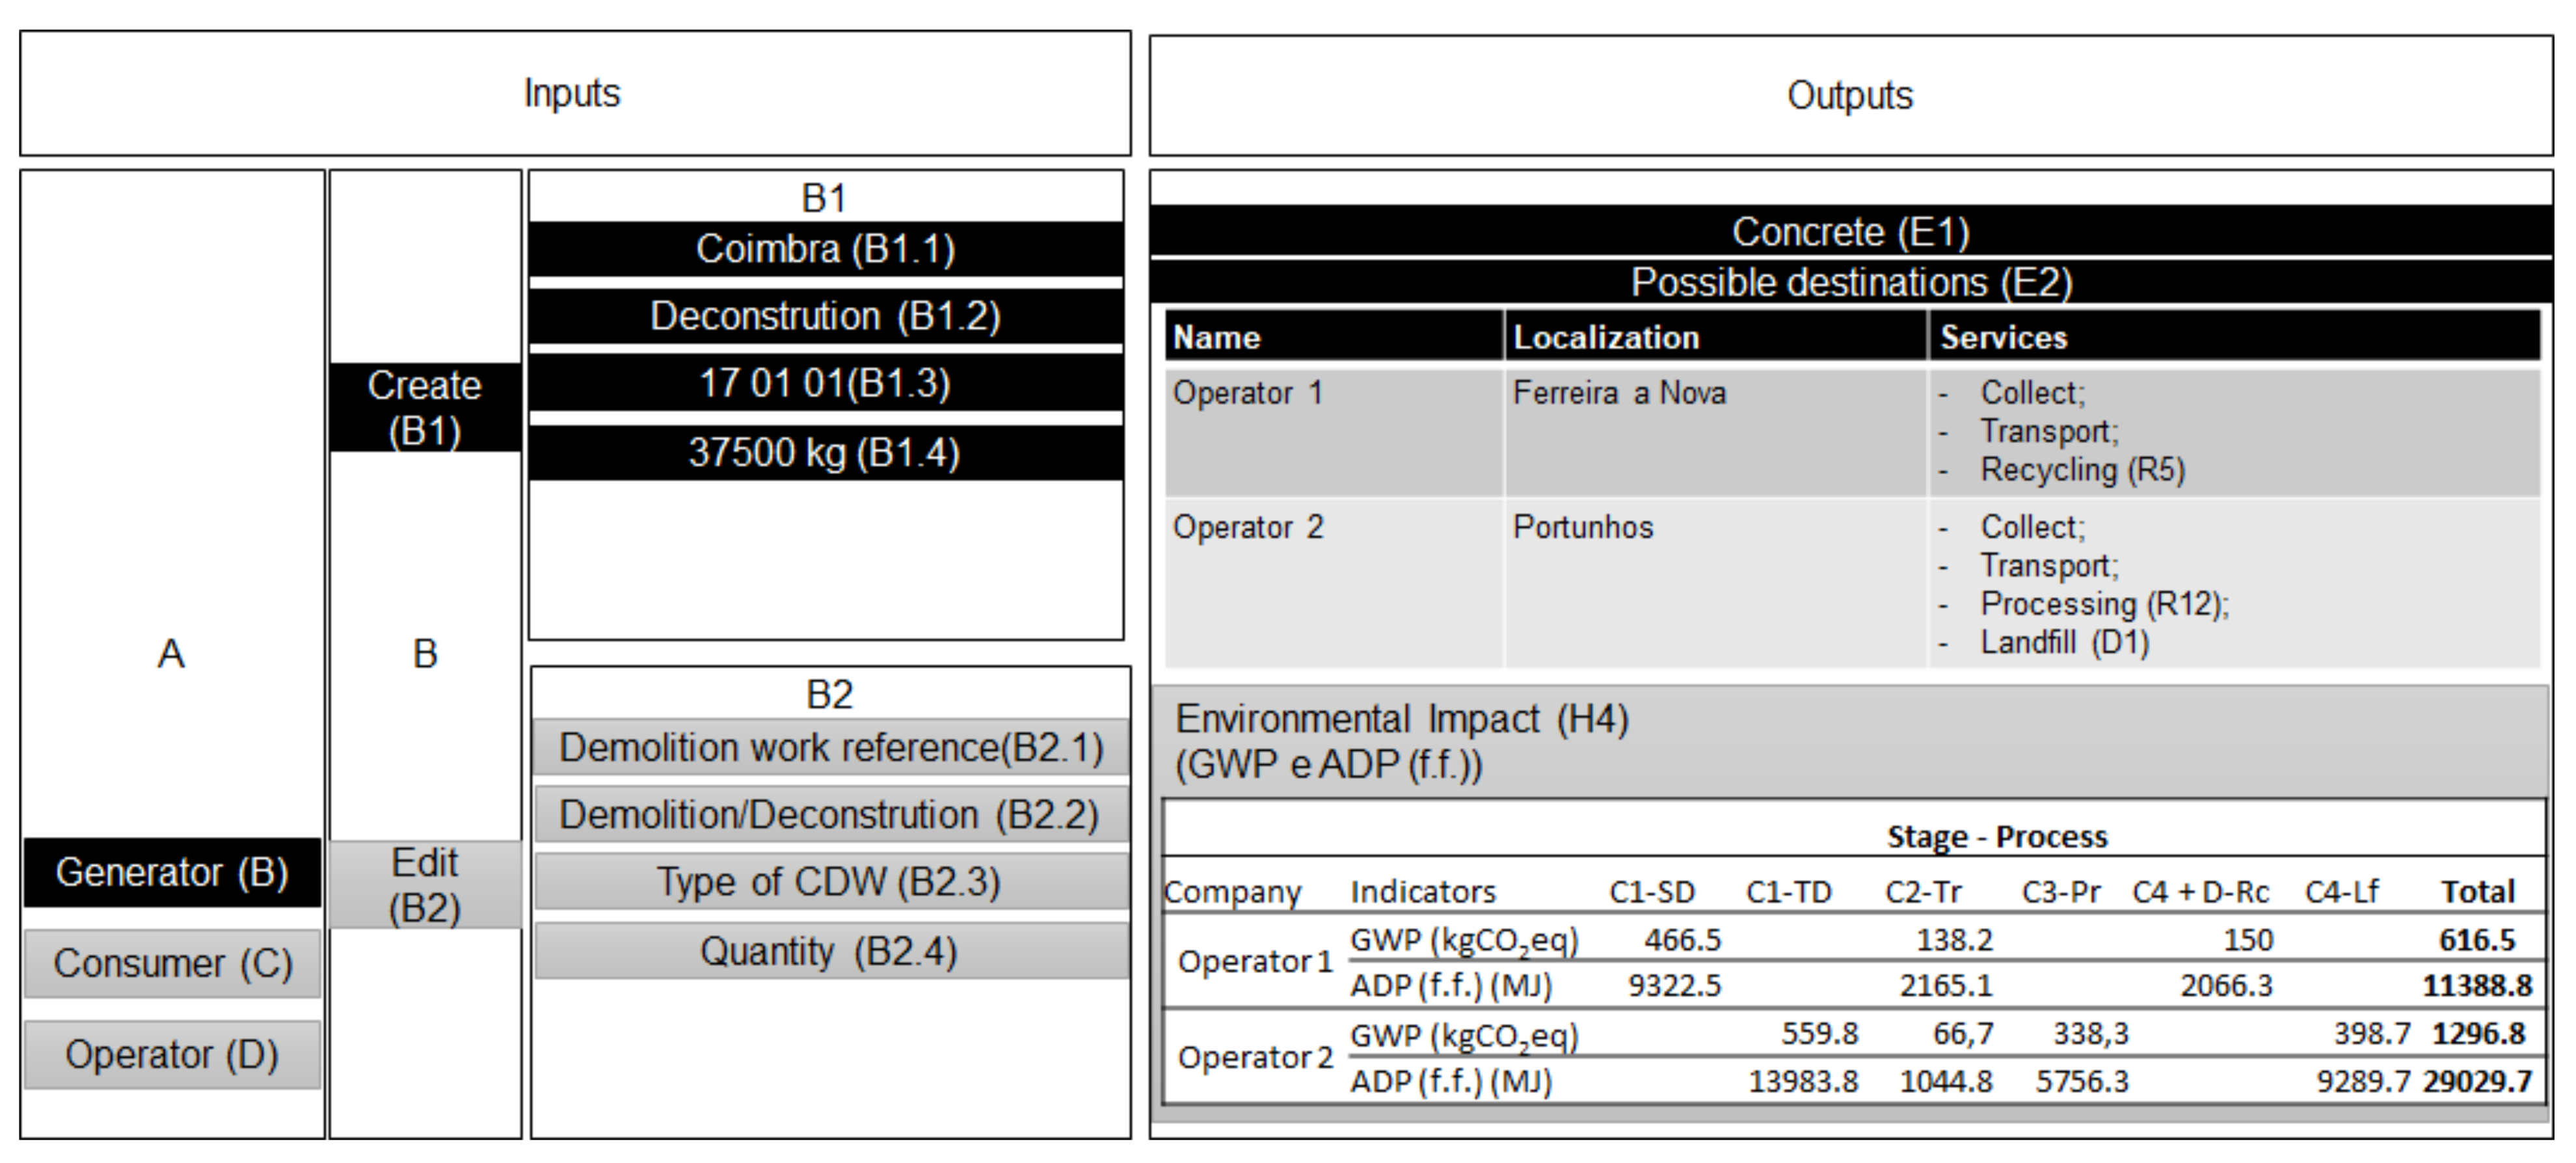
5. Case Studies
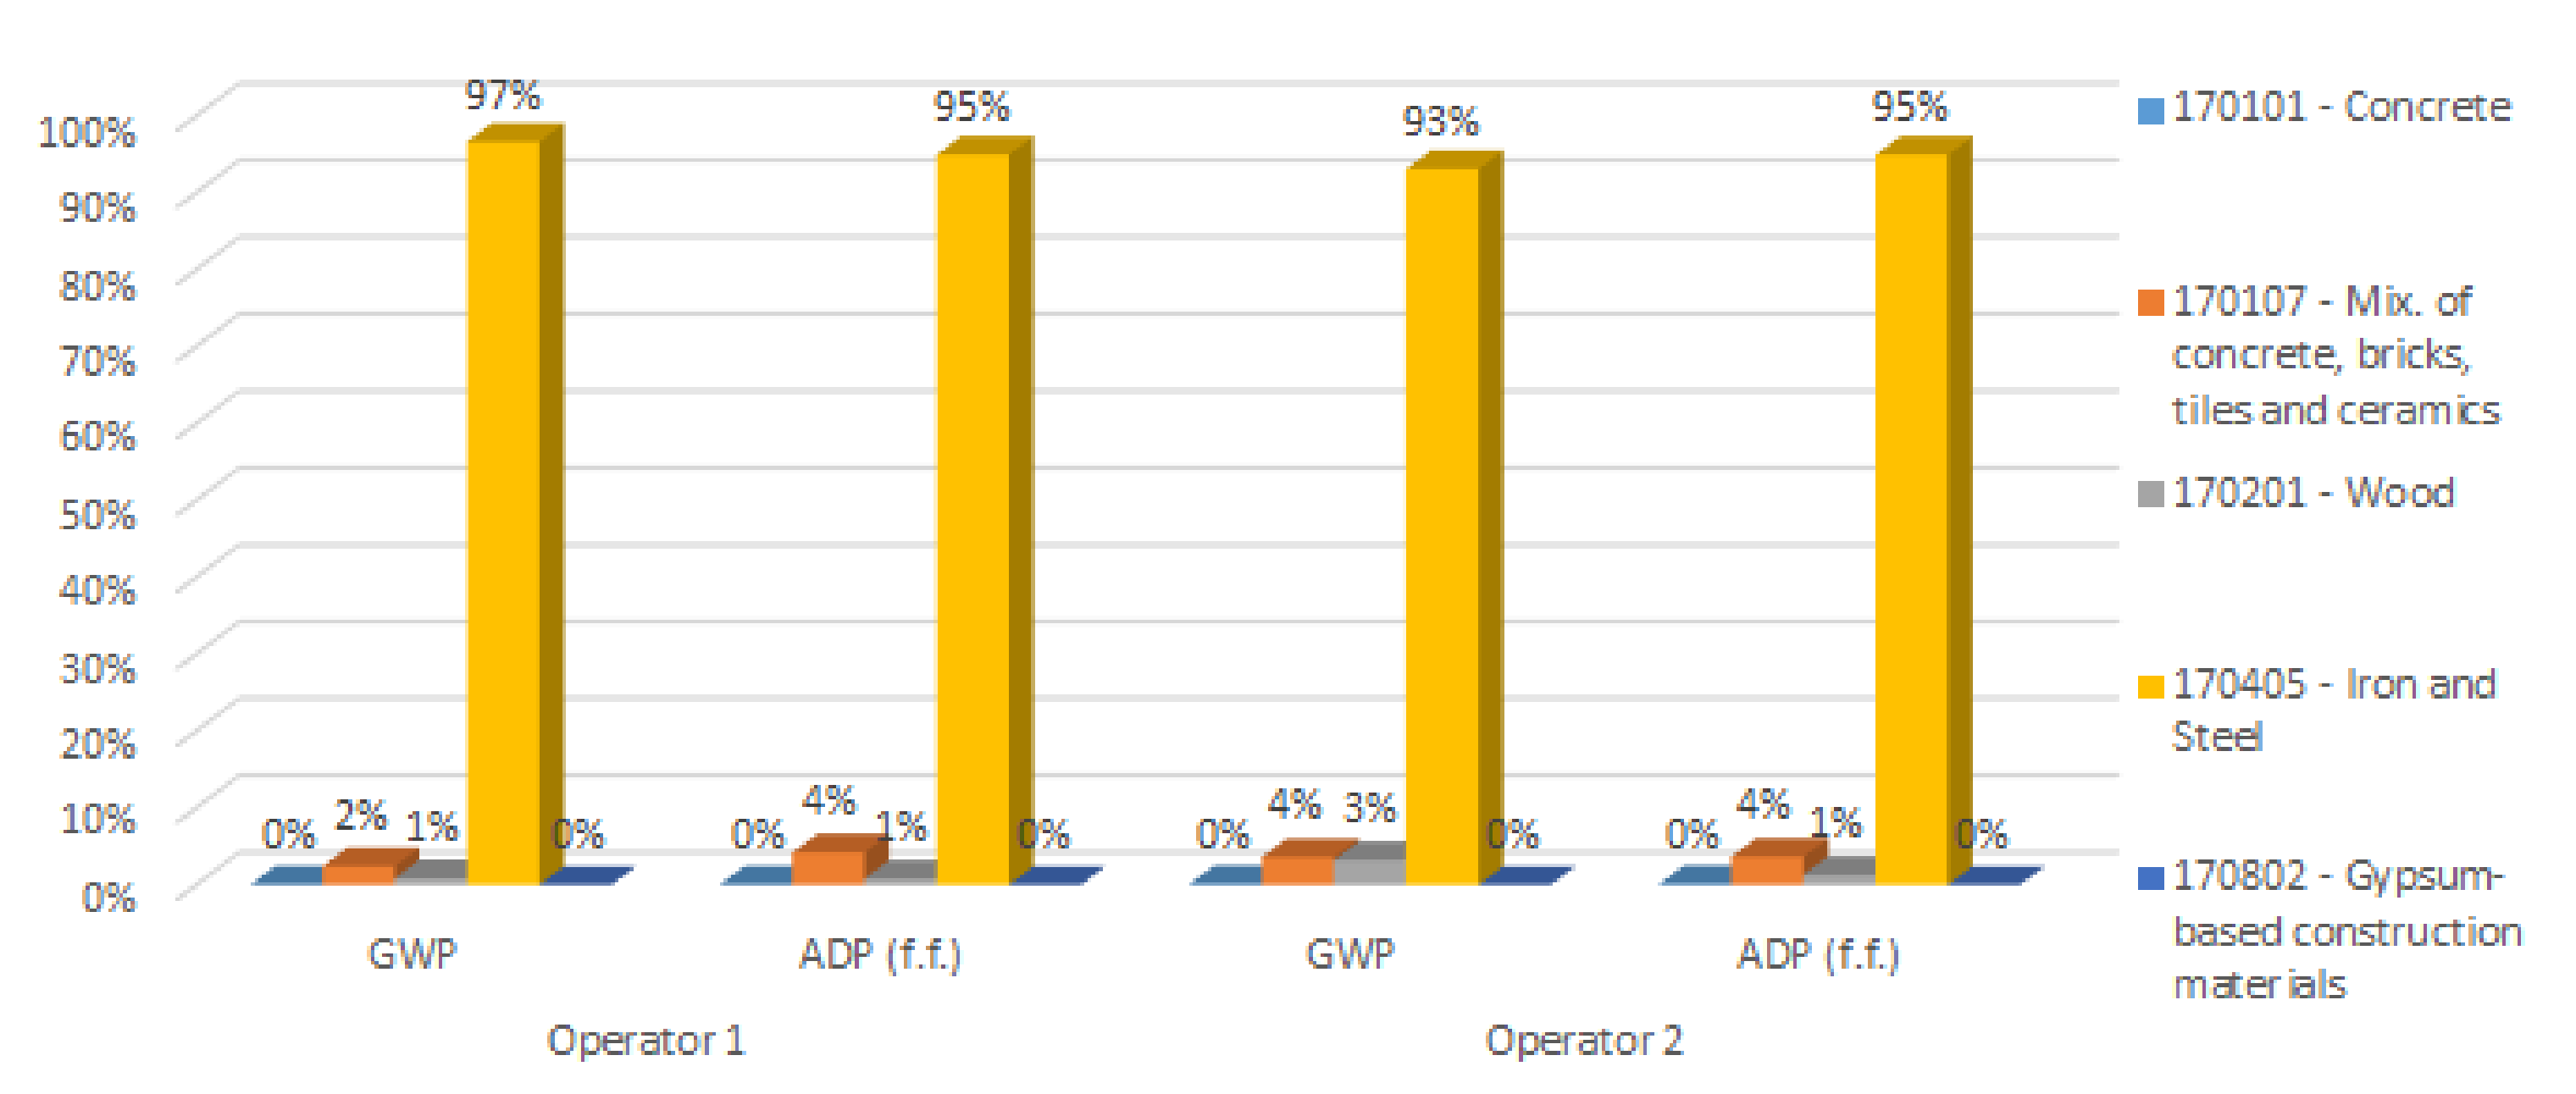
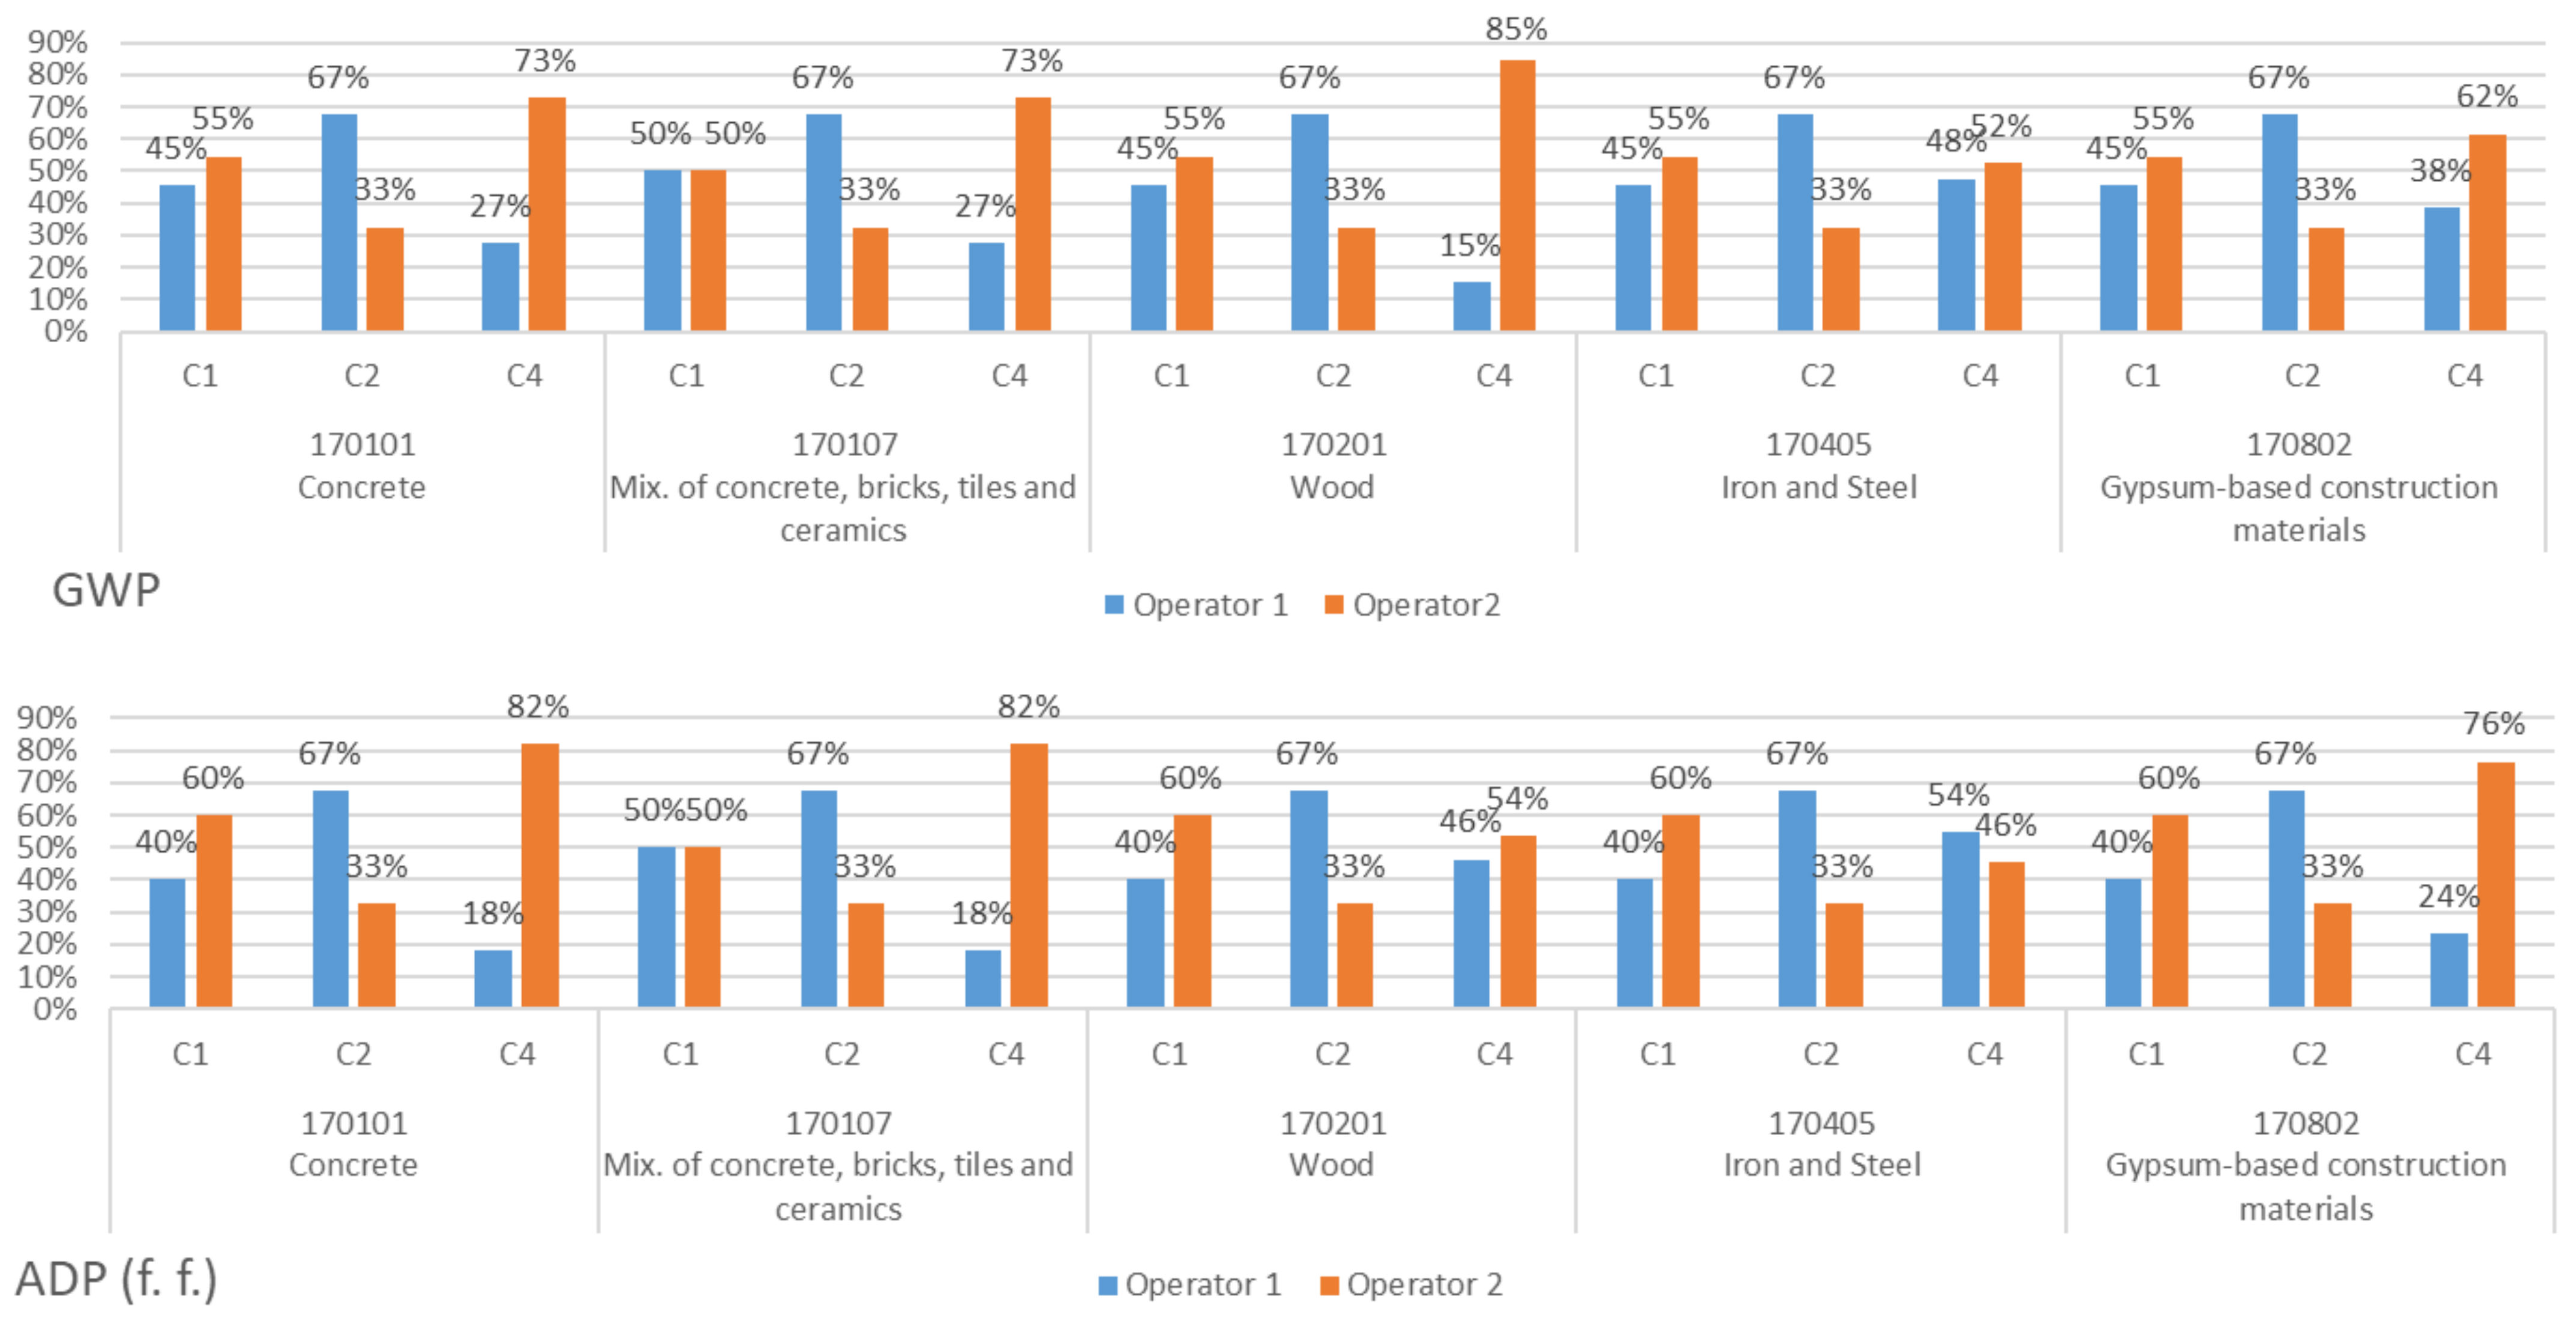
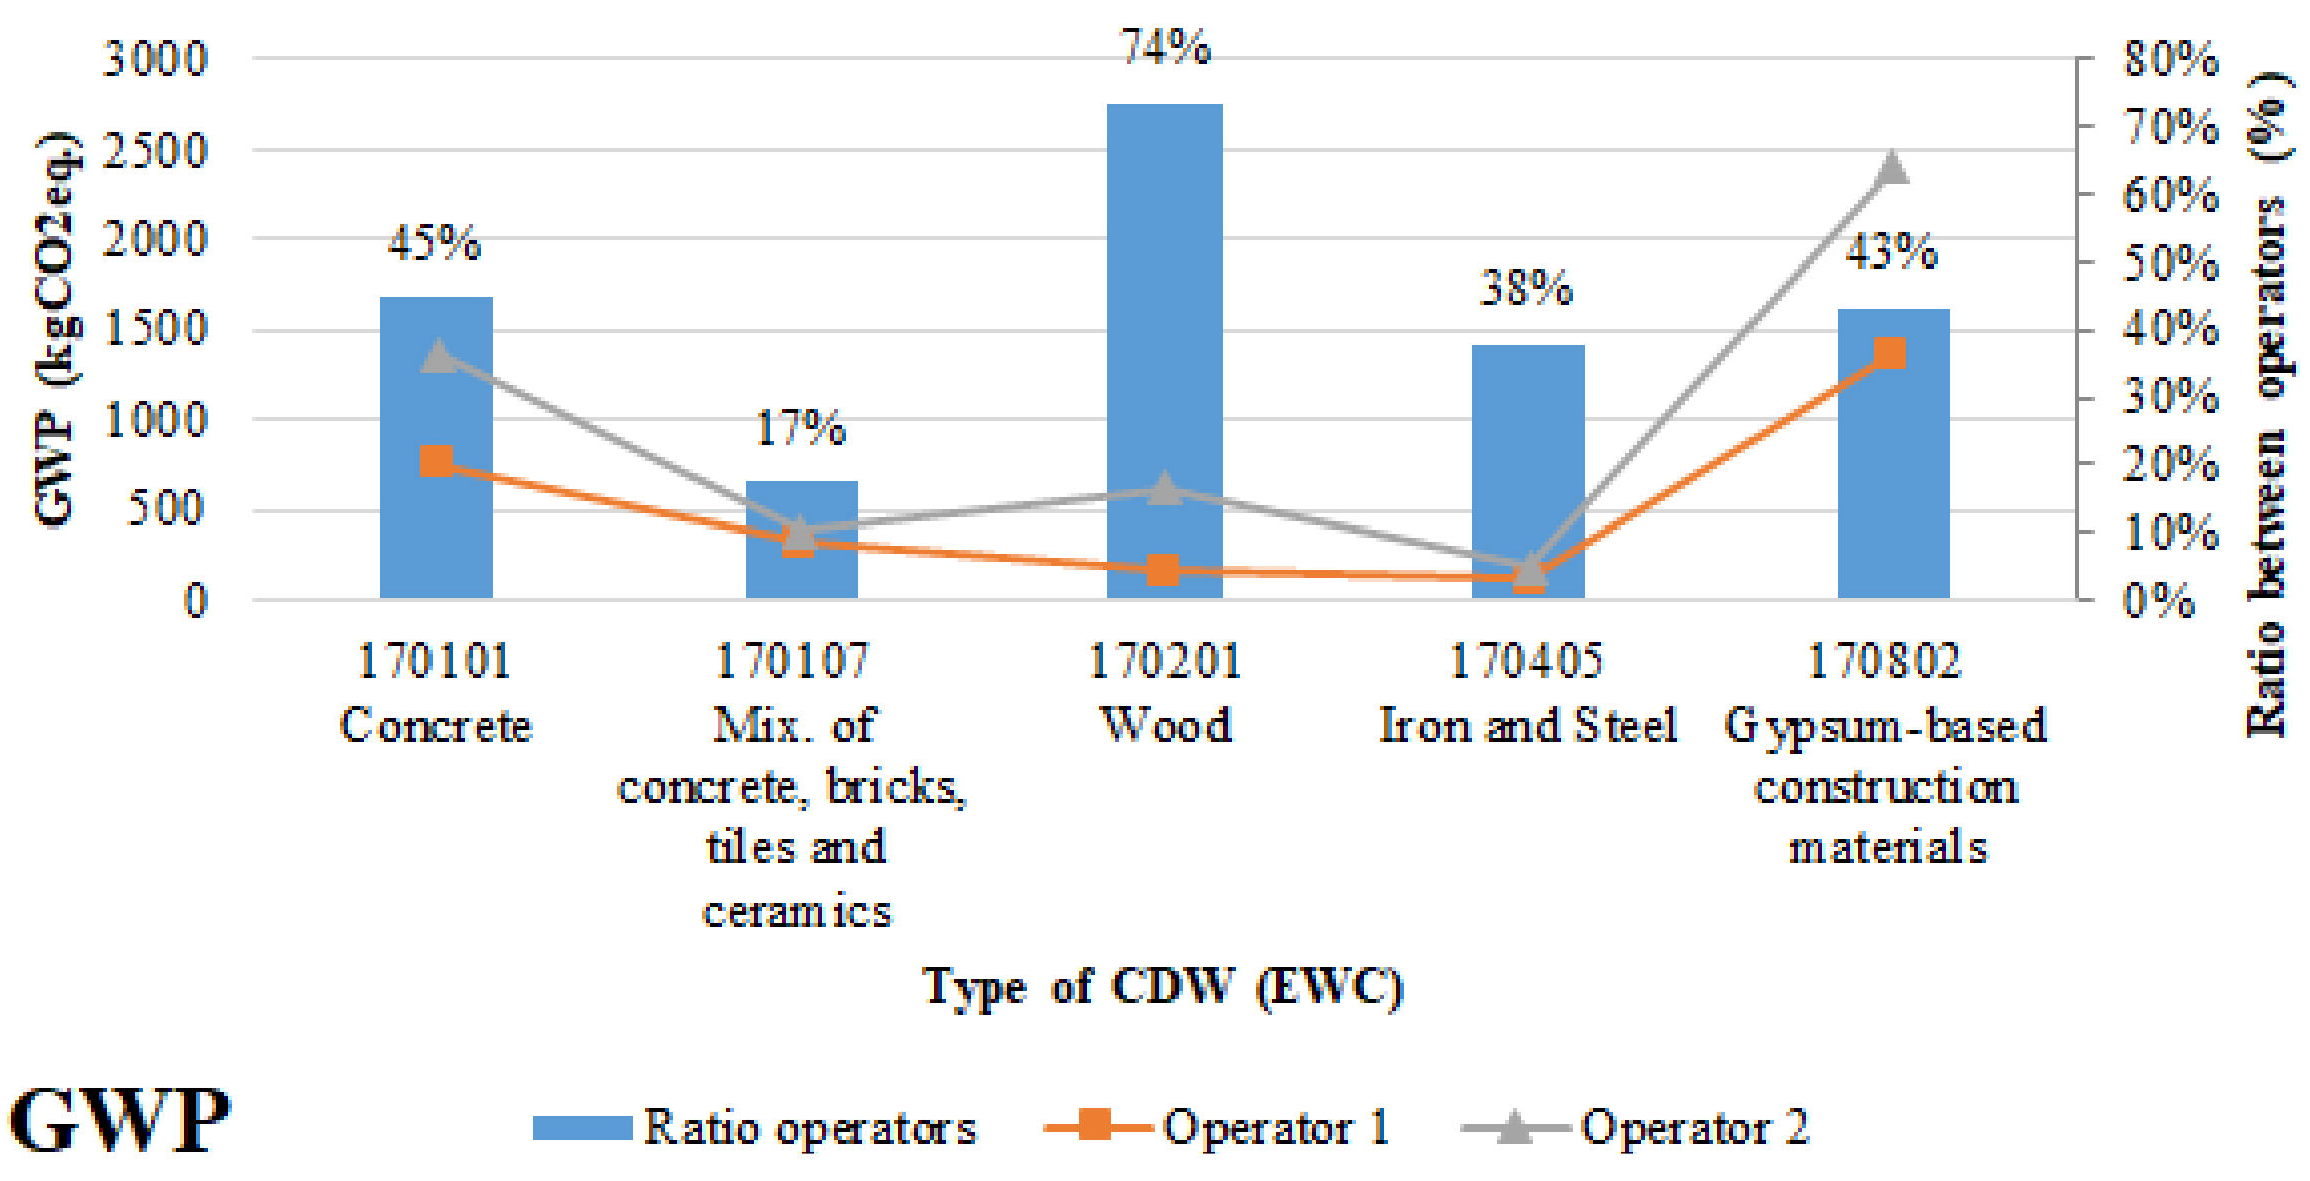
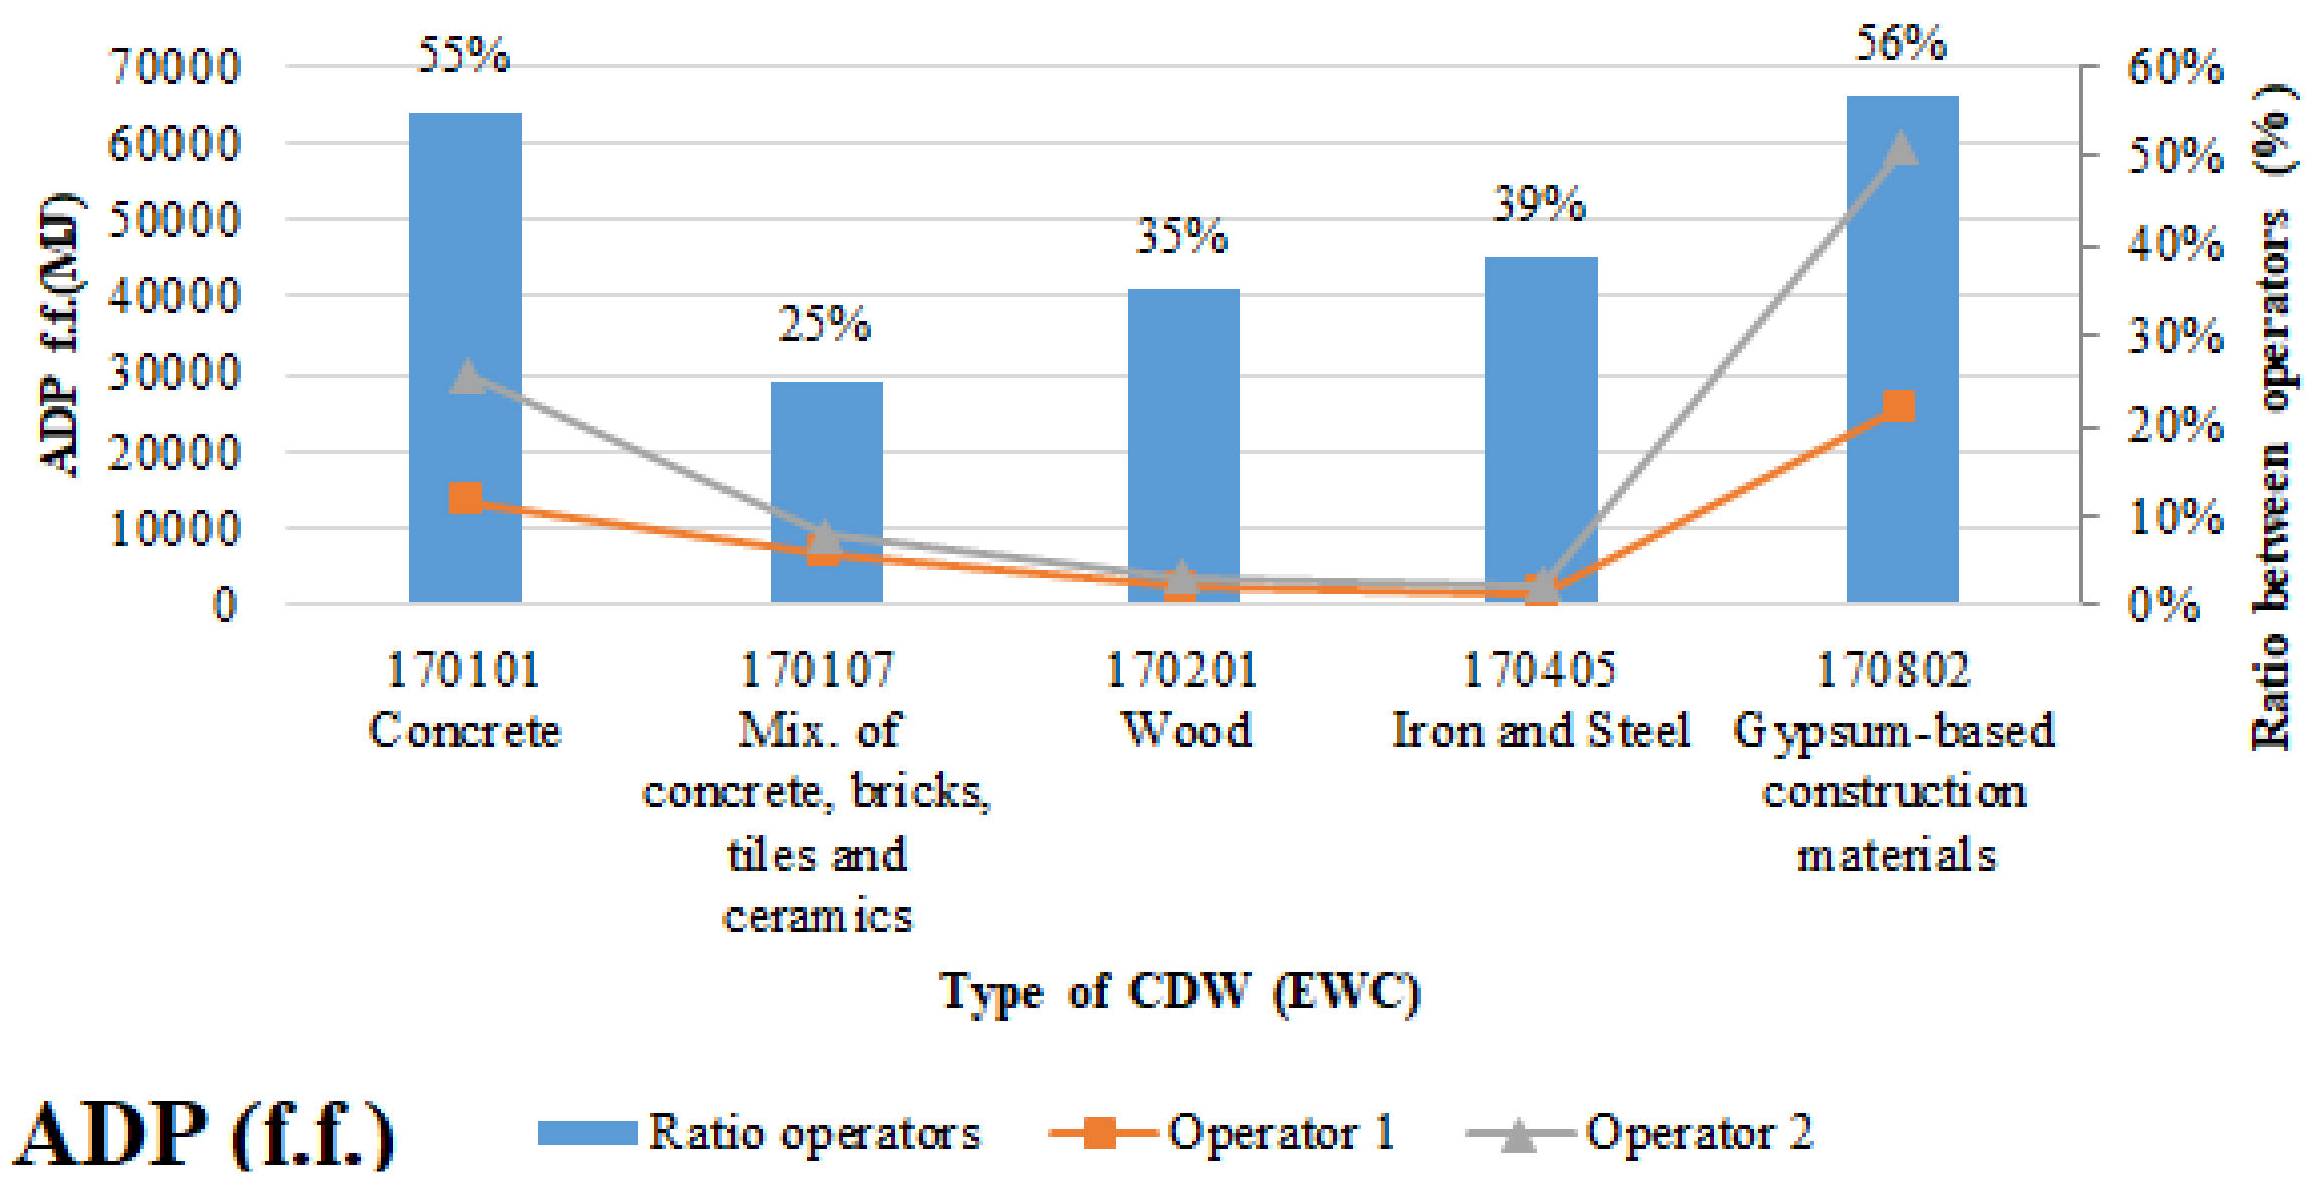
5.1. Sustainable Rehabilitation
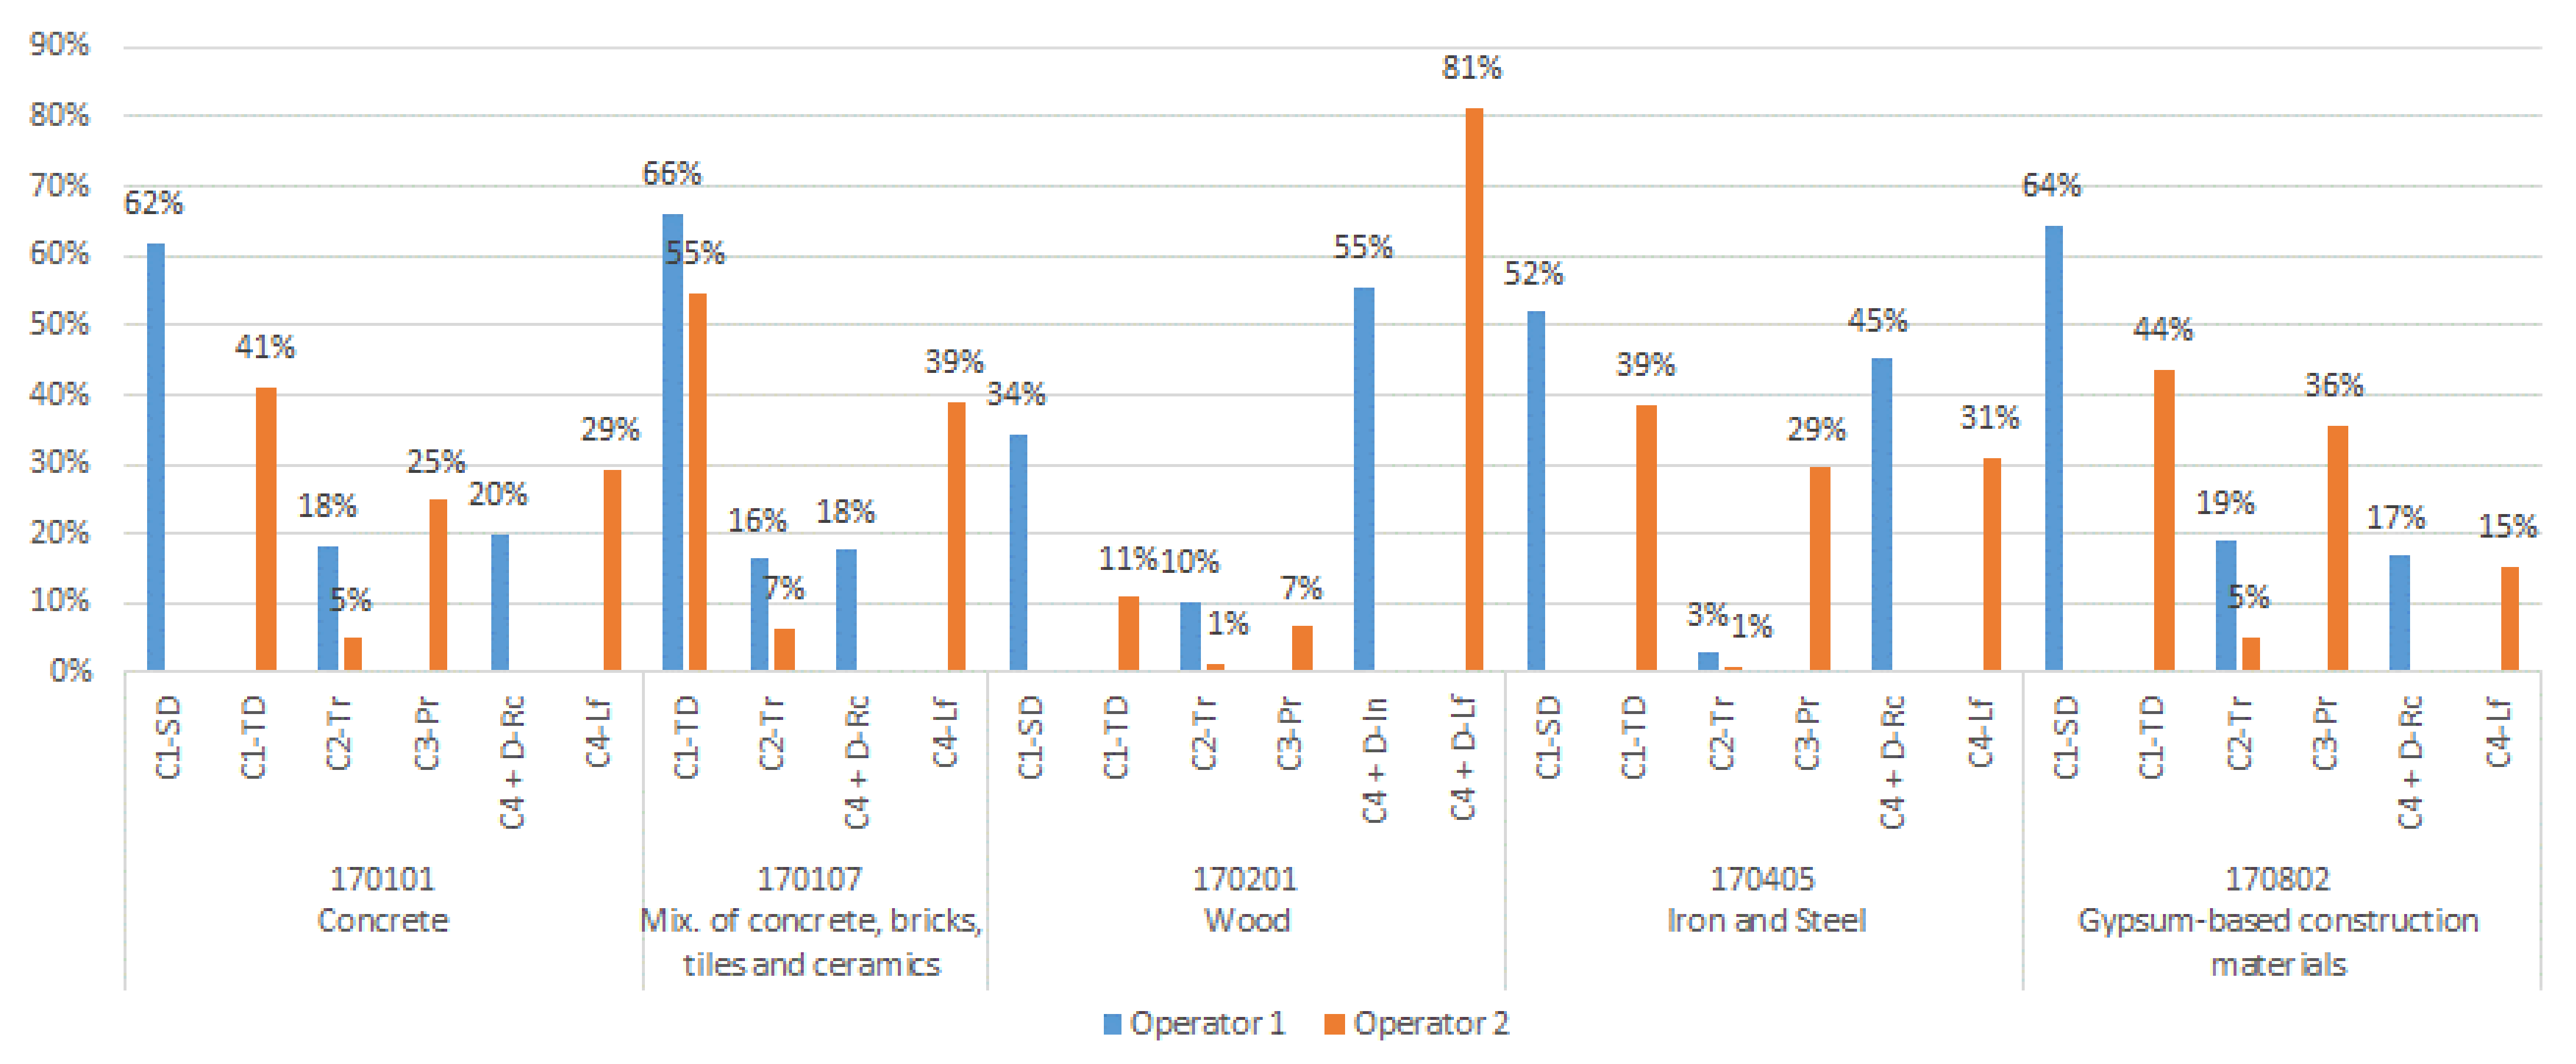
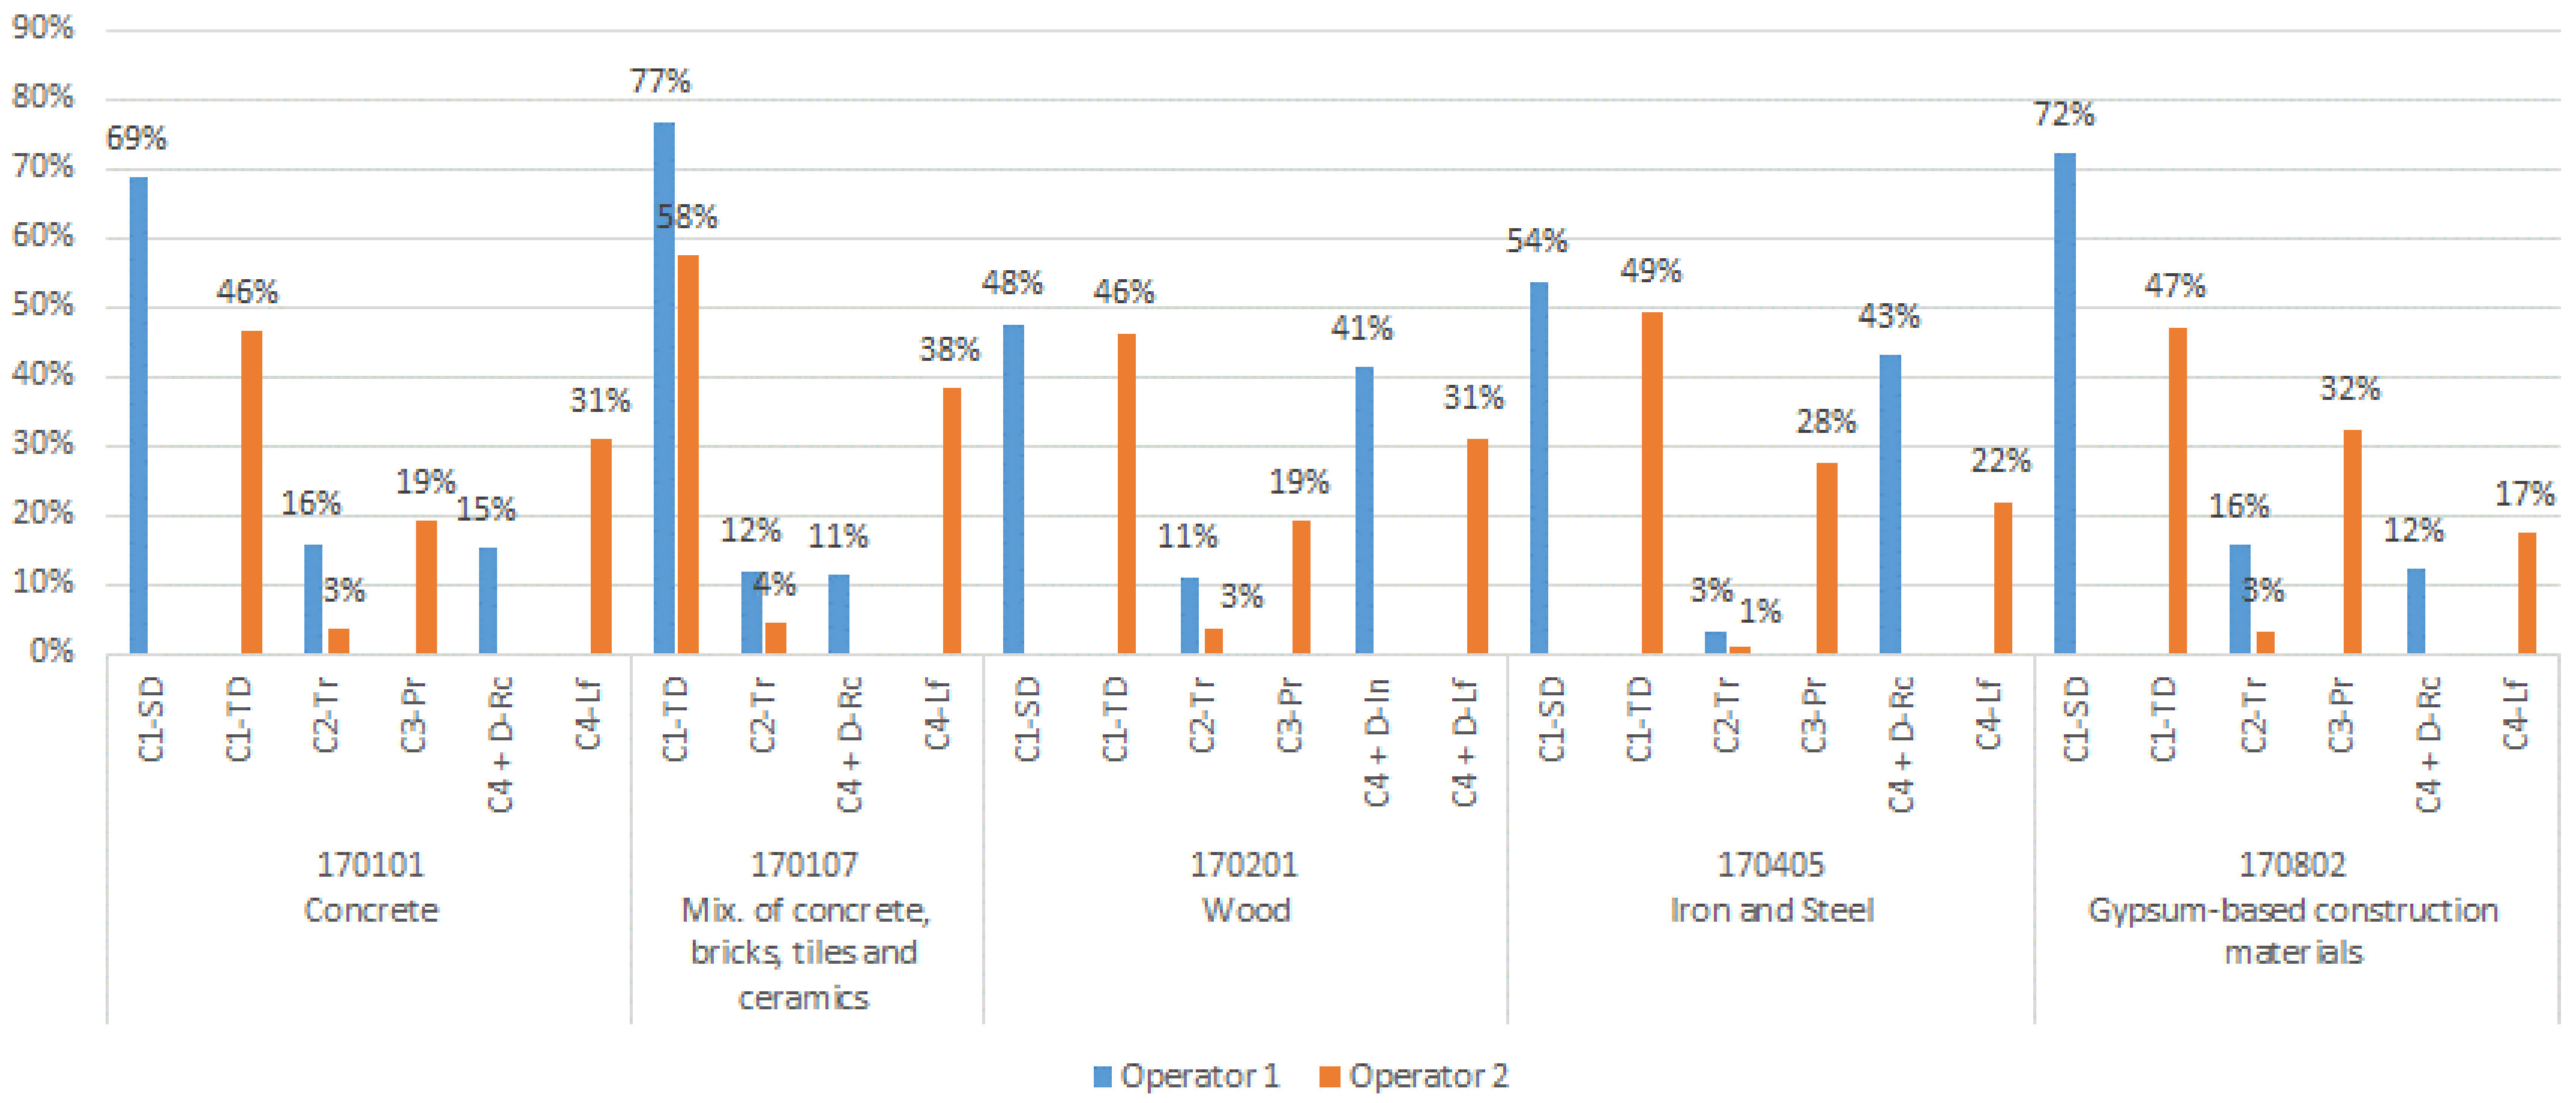
- 170101: Concrete;
- 170107: Mixtures of concrete, bricks, tiles, and ceramics other than those mentioned in 170106;
- 170201: Wood;
- 170405: Iron and steel;
- 170802: Gypsum-based construction materials other than those mentioned in 170801.
Results
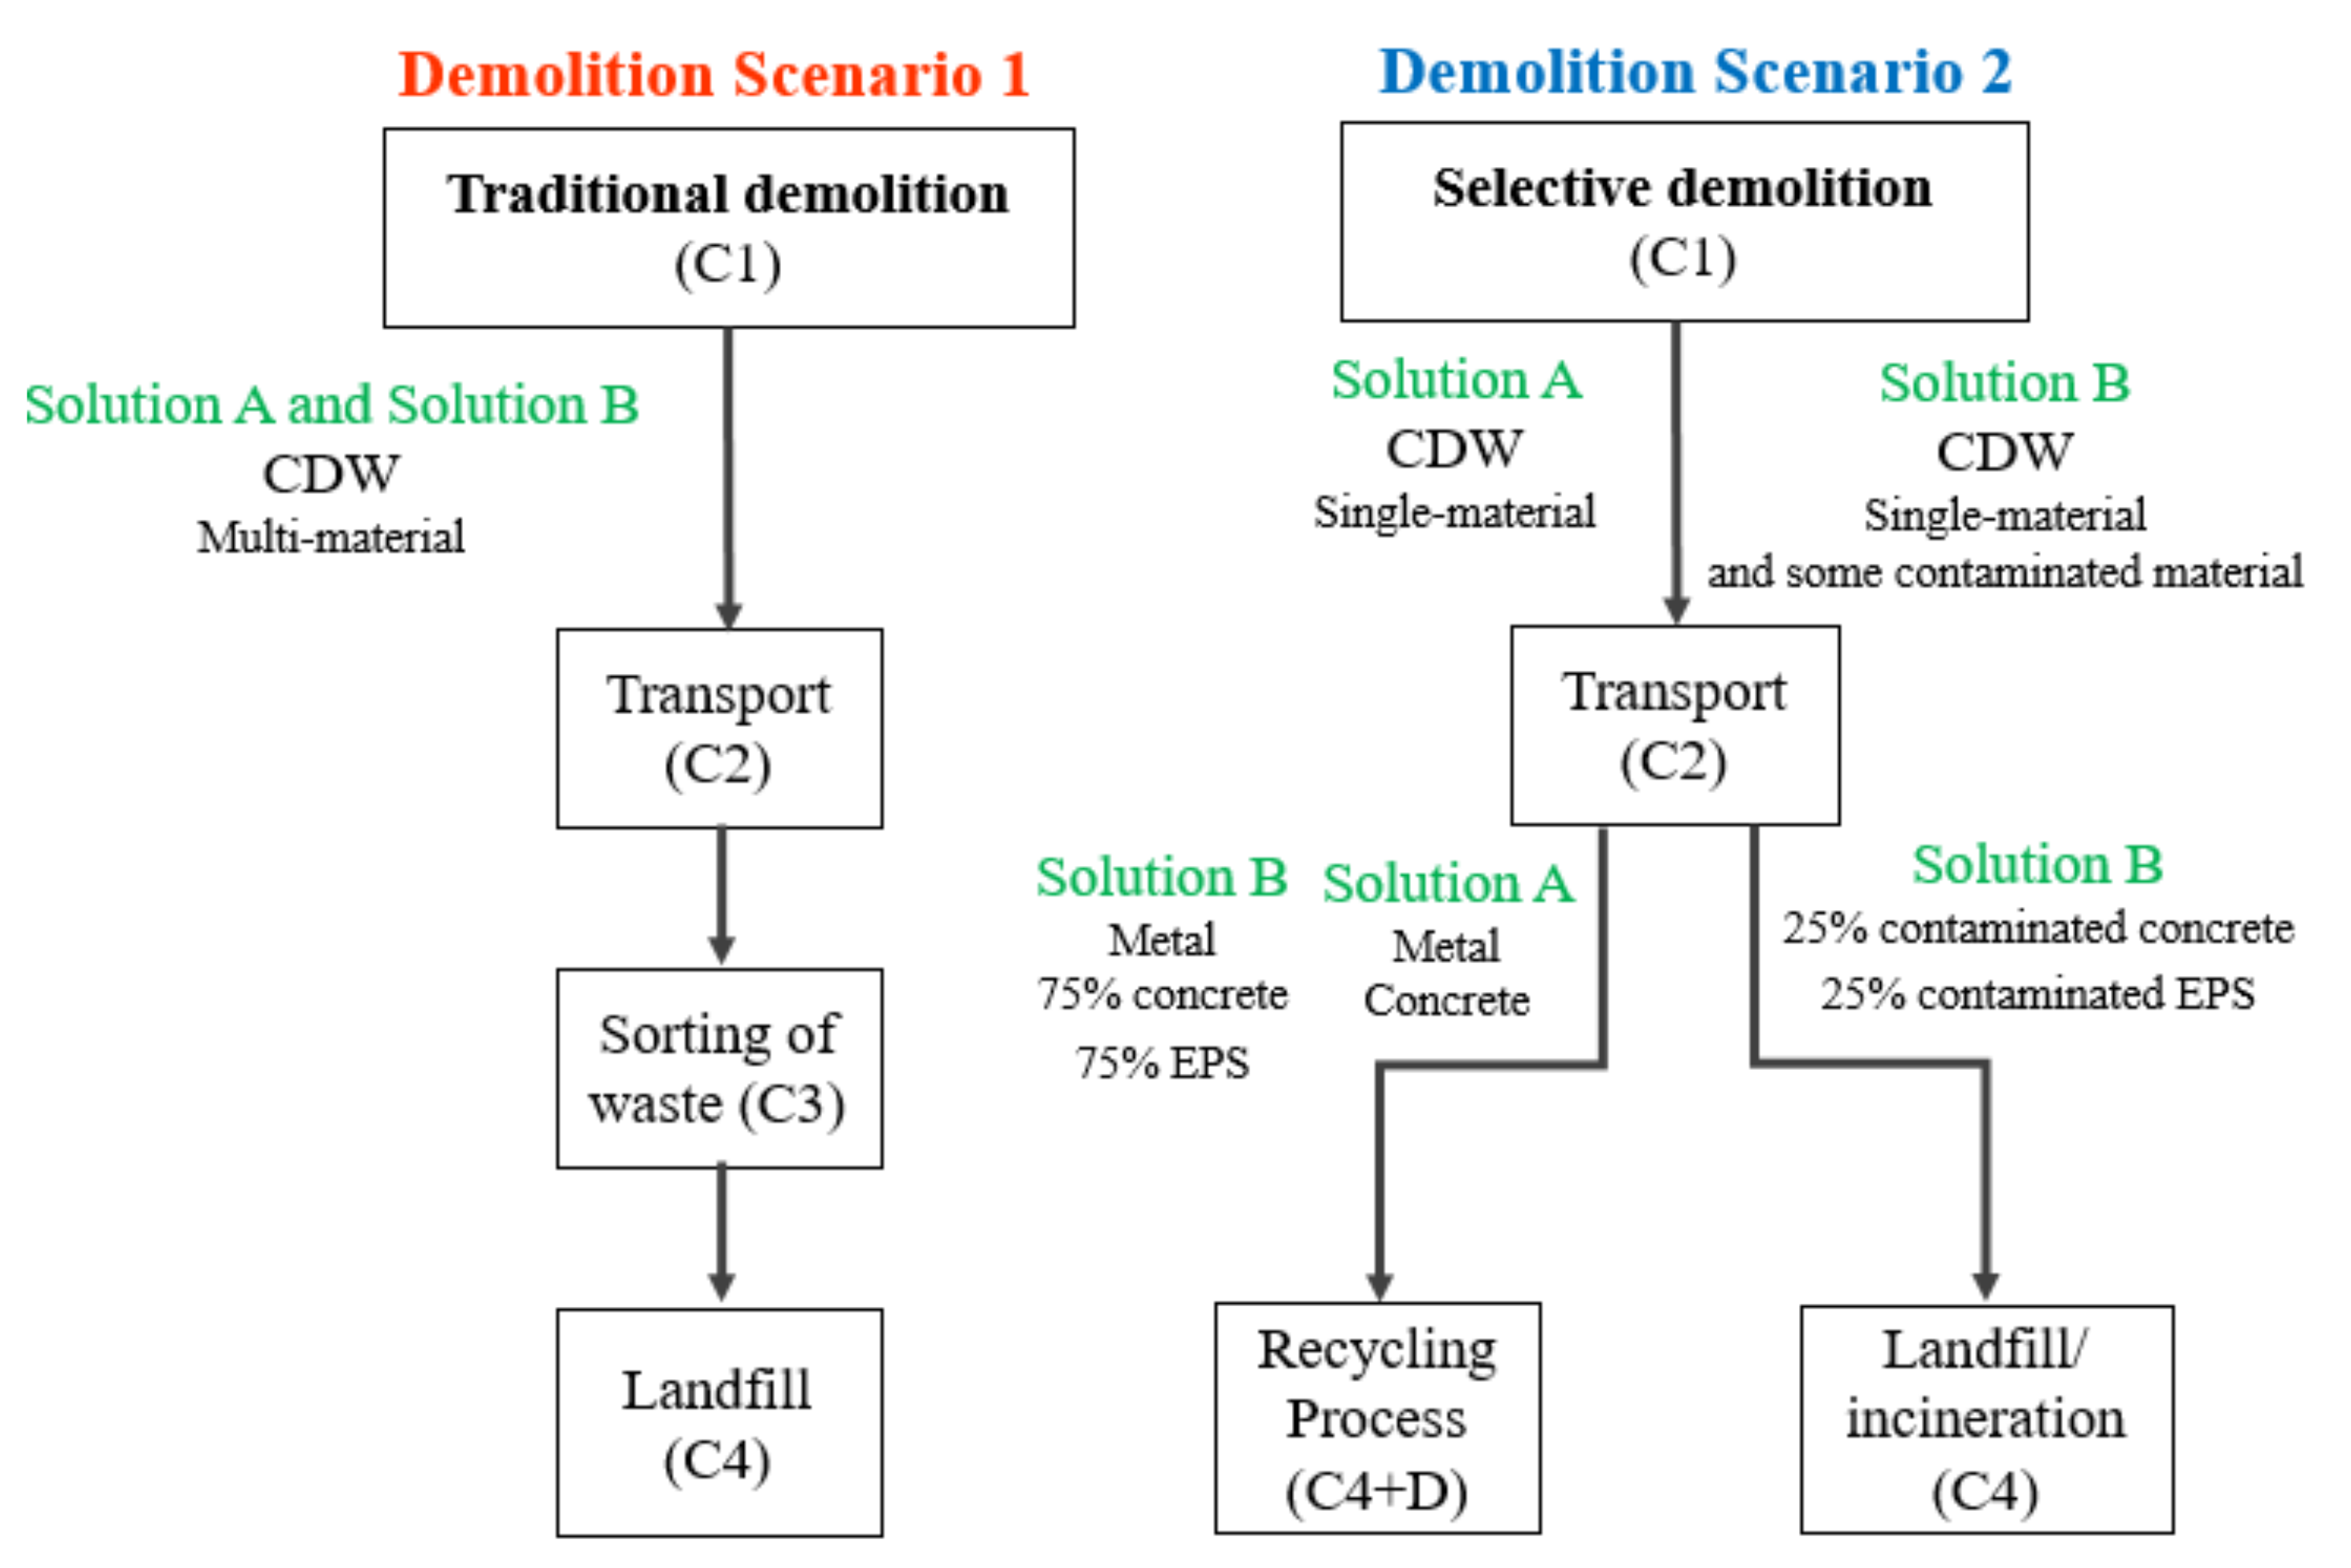
5.2. ‘Pre-Wall’ System
- (i)
- a solution without insulation material, with only steel reinforcement and concrete, with 20 cm of total thickness (Solution A); and
- (ii)
- a similar solution, with an insulation layer (expanded polystyrene, EPS) in the ‘pre-wall’ core, with 5 cm thickness, with a total thickness of 25 cm (Solution B).
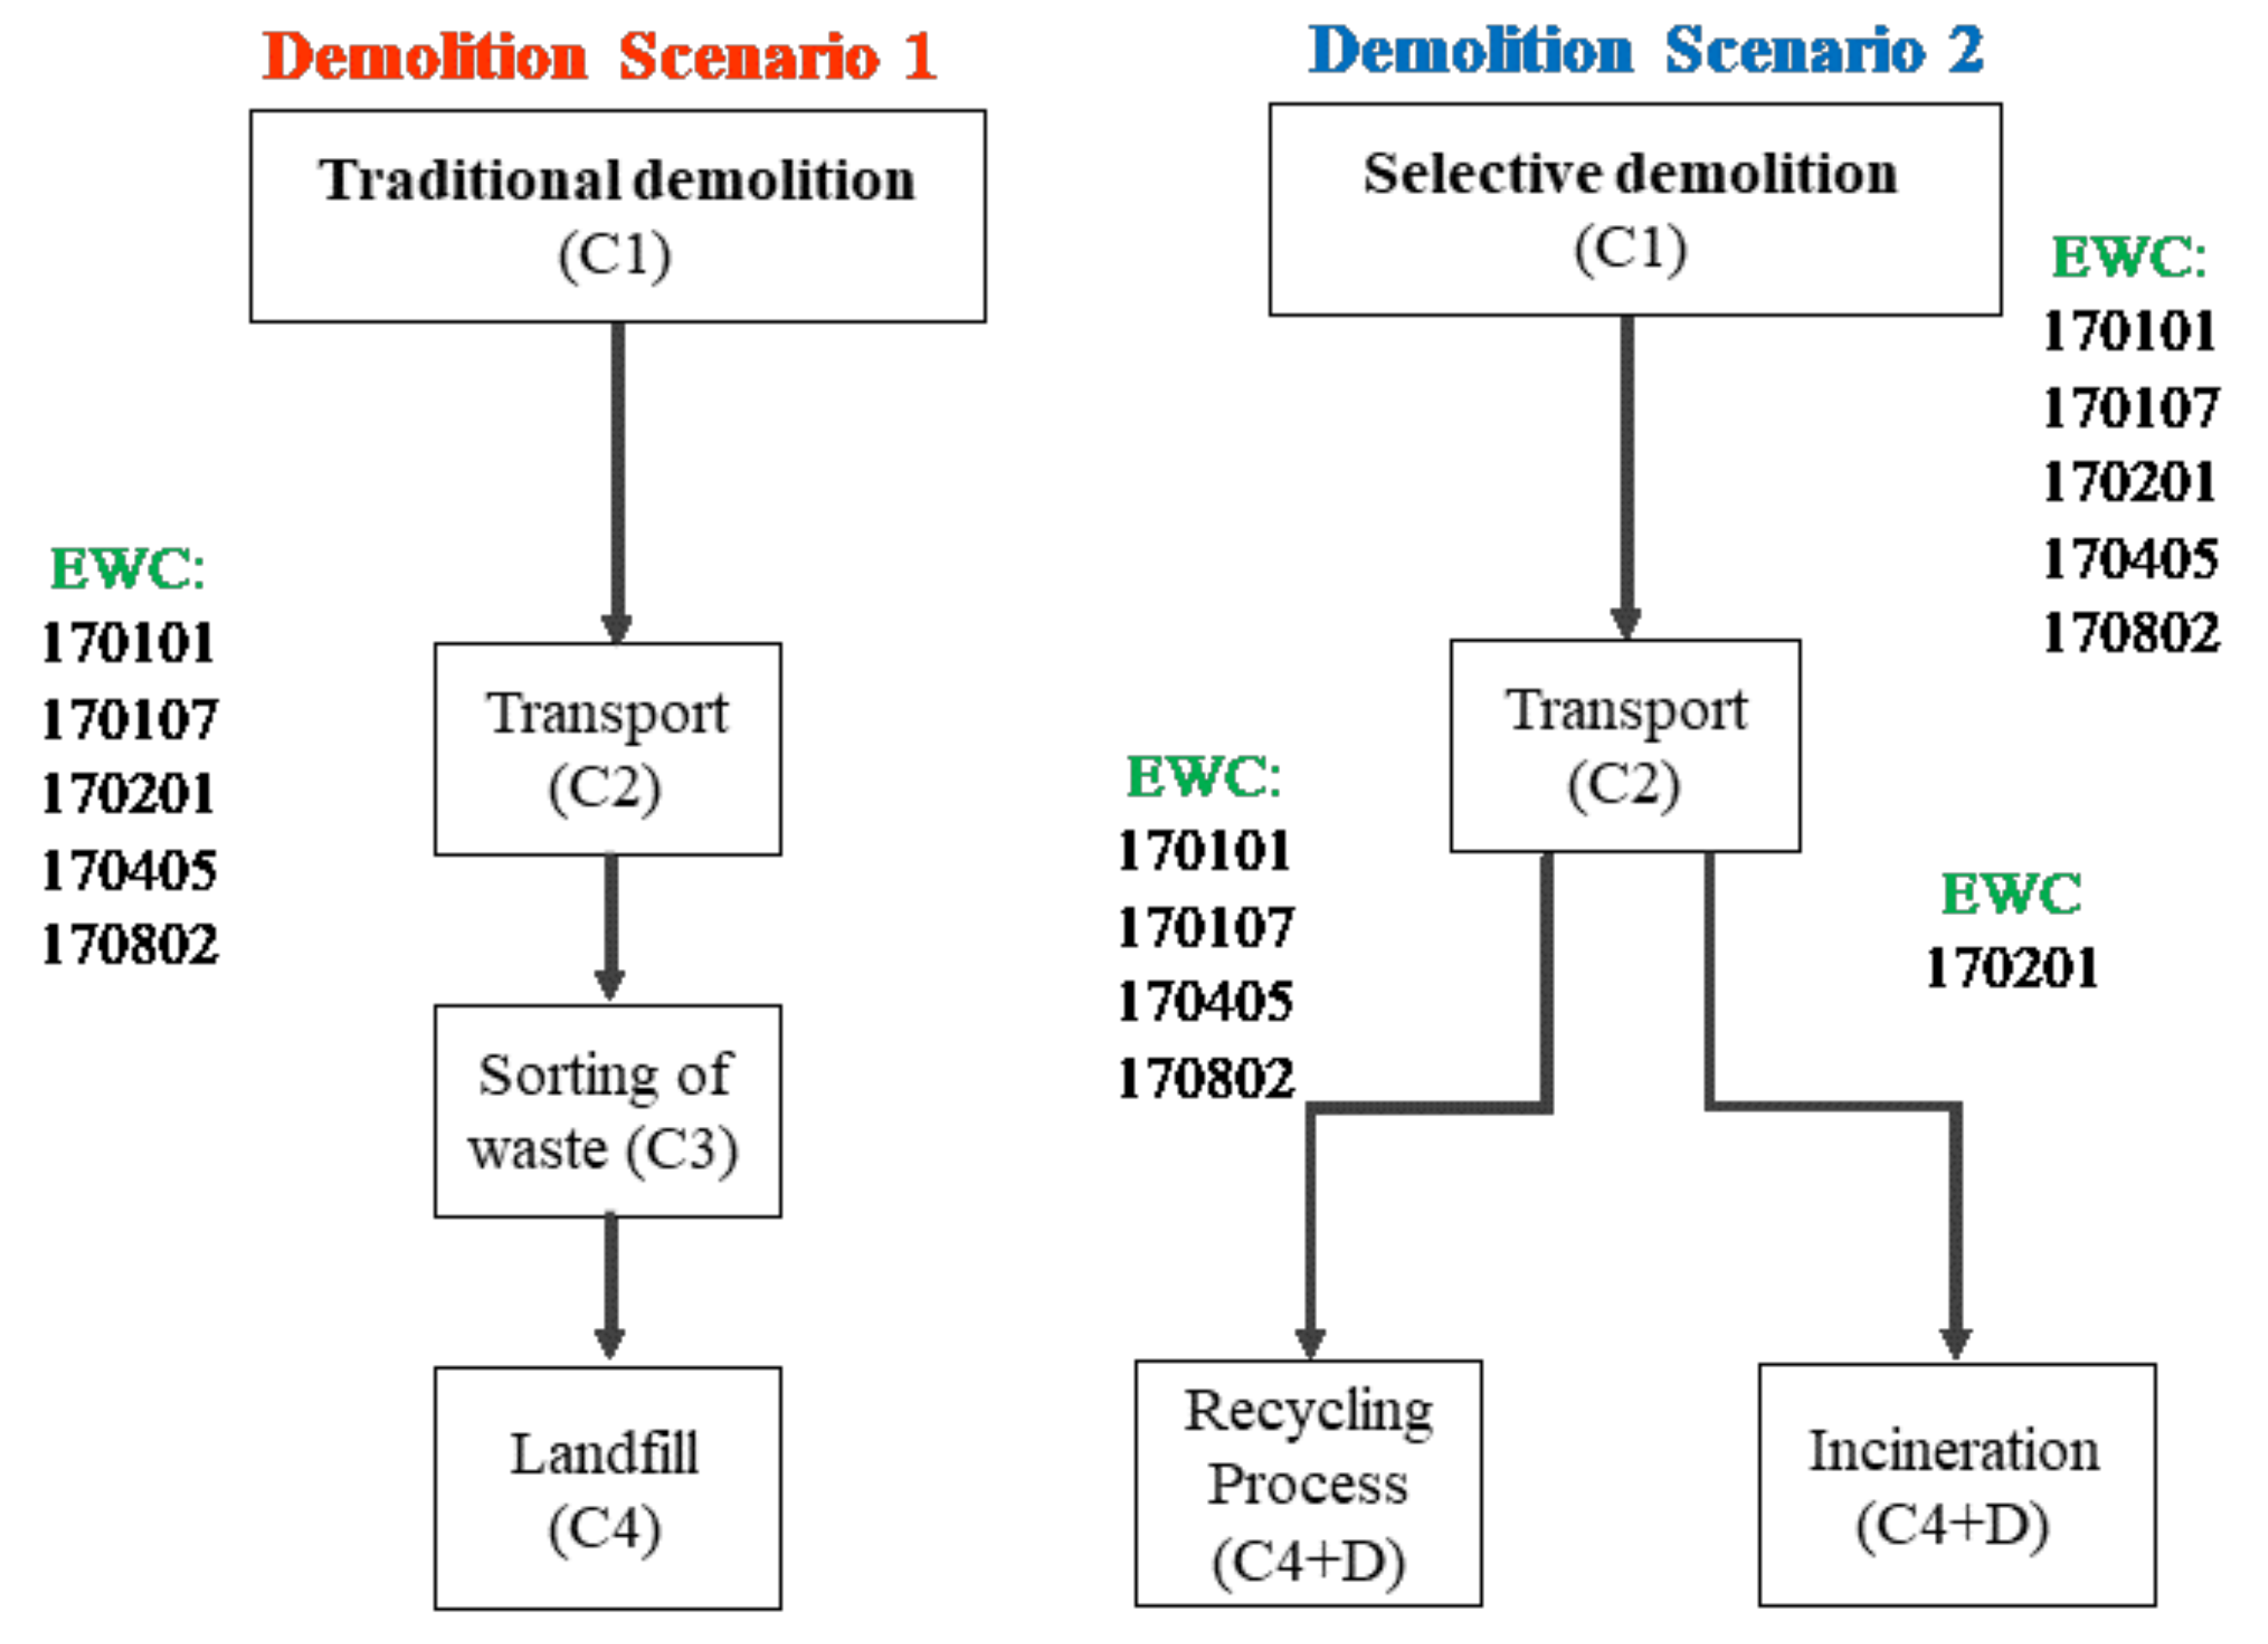
- Traditional demolition (Scenario 1), considering the complete demolition of the walls and transport of the CDW to landfill;
- Selective demolition (Scenario 2), with dismantling on site and separation of different waste types for recycling, when possible, and with the contaminated materials that are impossible to separate being sent to landfill.
5.3. Discussion
6. Conclusions
Author Contributions
Funding
Informed Consent Statement
Data Availability Statement
Acknowledgments
Conflicts of Interest
References
- Vitale, P.; Arena, N.; Di Gregorio, F.; Arena, U. Lifecycle assessment of the end-of-life phase of a residential building. Waste Manag. 2016, 60, 311–321. [Google Scholar] [CrossRef] [PubMed]
- Silvestre, J.D.; Lasvaux, S.; Hodková, J.; de Brito, J.; Pinheiro, M.D. Native LCA—A systematic approach for the selection of environmental datasets as generic data: Application to construction products in a national context. Int. J. Life Cycle Assess. 2015, 20, 731–750. [Google Scholar] [CrossRef]
- Butera, S.; Christensen, T.H.; Astrup, T.F. Lifecycle assessment of construction and demolition waste management. Waste Manag. 2015, 44, 196–205. [Google Scholar] [CrossRef] [PubMed] [Green Version]
- Banias, G.; Achillas, C.; Vlachokostas, C.; Moussiopoulos, N.; Papaioannou, I. A web-based Decision Support System for the optimal management of construction and demolition waste. Waste Manag. 2011, 31, 2497–2502. [Google Scholar] [CrossRef] [PubMed]
- Neto, R.O.; Gastineau, P.; Cazacliu, B.G.; Le Guen, L.L.; Paranhos, R.S.; Petter, C.O. An economic analysis of the processing technologies in CDW recycling platforms. Waste Manag. 2017, 60, 277–289. [Google Scholar] [CrossRef] [PubMed] [Green Version]
- Eurostat. Sustainable Development in the European Union–Monitoring Report on Progress towards the SDGs in an EU Context, Edition 2020. Available online: https://ec.europa.eu/eurostat/web/products-statistical-books/-/ks-02-20-202 (accessed on 15 October 2021).
- European Commission. Directive 2018/851 Amending Directive 2008/98/EC on Waste Framework. Official Journal of the European Union. 2018. Available online: https://eur-lex.europa.eu/legal-content/EN/TXT/?uri=uriserv:OJ.L_.2018.150.01.0109.01.ENG (accessed on 15 October 2021).
- Coelho, A.; de Brito, J. Economic analysis of conventional versus selective demolition—A case study. Resour. Conserv. Recycl. 2011, 55, 382–392. [Google Scholar] [CrossRef]
- COM 614. Closing the Loop–EU Action Plan for the Circular Economy. Communication from the Commission to the Europe-an Parliament, the Council, the European Economic and Social Committee and the Committee of the Regions. European Commission: Brussels, Belgium, 2015. Available online: https://eur-lex.europa.eu/legal-content/EN/TXT/?uri=CELEX:52015DC0614 (accessed on 15 October 2021).
- Zanni, S.; Simion, I.M.; Gavrilescu, M.; Bonoli, A. Lifecycle assessment applied to circular designed construction materials. Procedia CIRP 2018, 69, 154–159. [Google Scholar] [CrossRef]
- Rodrigues, F.; Matos, R.; Alves, A.; Ribeirinho, P.; Rodrigues, H. Building lifecycle applied to refurbishment of a traditional building from Oporto, Portugal. J. Build. Eng. 2018, 17, 84–95. [Google Scholar] [CrossRef] [Green Version]
- CEN. Sustainability of Construction Eorks e Assessment of Environmental Performance of Buildings e Calculation Method; FprEN 15978; Comité Européen de Normalisatio: Brussels, Belgium, 2011. [Google Scholar]
- CEN. Sustainability of Construction Works e Environmental Product Declarations—Core Rules for the Product Category of Construction Products; EN 15804:2012+A2; Comité Européen de Normalisation: Brussels, Belgium, 2019. [Google Scholar]
- Blengini, G.A.; Di Carlo, T. Energy-saving policies and low-energy residential buildings: An LCA case study to support decision makers in Piedmont (Italy). Int. J. Lifecycle Assess. 2010, 15, 652–665. [Google Scholar] [CrossRef]
- Silvestre, J.D.; de Brito, J.; Pinheiro, M.D. Environmental impacts and benefits of the end-of-life of building materials e calculation rules, results and contribution to a “cradle to cradle” lifecycle. J. Clean. Prod. 2014, 66, 37–45. [Google Scholar] [CrossRef]
- Silvestre, J.D.; de Brito, J.; Pinheiro, M.D. From the new European Standards to an environmental, energy and economic assessment of building assemblies from cradle-to-cradle (3E-C2C). Energy Build. 2013, 64, 199–208. [Google Scholar] [CrossRef]
- Oregi, X.; Hernandez, P.; Gazulla, C.; Isasa, M. Integrating simplified and full lifecycle approaches in decision making for building energy refurbishment: Benefits and barriers. Buildings 2015, 5, 354–380. [Google Scholar] [CrossRef] [Green Version]
- Trinius, W.; Sievert, J.; Schmincke, E.; Grootens, F.; Pankow, N.; Untergutsch, A.; Görke, J.; Werner, F.; Lützkendorf, T.; Passer, A. TEXTE 130/2020: Basic Principles and Recommendations for Describing the Dismantling, Post-Use and Disposal Stage of Construction Products—A Guidance Document for the Construction Product Industry and Standardization Bodies for the Design of Modules C and D in EPD and PCR. Project no 3714 95 309 0. German Environmental Agency: Des-sau-Rosslau, Germany. Available online: https://www.umweltbundesamt.de/publikationen (accessed on 8 May 2021).
- European Commission. EU Construction & Demolition Waste Management Protocol. Official Journal of the European Union. 2016. Available online: https://ec.europa.eu/docsroom/documents/20509/ (accessed on 15 October 2021).
- European Parliament. European waste framework directive: Directive 2008/98/EC of the European Parliament and of the Council of 19 November 2008 on Waste and Repealing Certain Directives. Available online: https://eur-lex.europa.eu/legal-content/EN/TXT/?uri=celex%3A32008L0098 (accessed on 15 October 2021).
- Xiaodong, L.; Zhu, Y.; Zhihui, Z. An LCA-based environmental impact assessment model for construction processes. Build. Environ. 2010, 45, 766–775. [Google Scholar]
- Schuer, C.; Keoleian, G.A.; Reppe, P. Lifecycle energy and environmental performance of a new university building: Model-ling challenges and design implications. Energy Build. 2003, 35, 1049–1064. [Google Scholar] [CrossRef]
- Blengini, G.A. Life cycle of buildings, demolition and recycling potential: A case study in Turin, Italy. Build. Environ. 2009, 44, 319–330. [Google Scholar] [CrossRef]
- Coelho, A.; de Brito, J. Influence of construction and demolition waste management on the environmental impact of buildings. Waste Manag. 2012, 32, 532–541. [Google Scholar] [CrossRef] [PubMed]
- C+D. C+D Project: Close the Loop by Disclosing the Benefits of Buildings’ Deconstruction and Materials Re-use. Available online: https://www.eeagrants.gov.pt/en/programmes/environment/projects/projects/cplusd-close-the-loop-by-disclosing-the-benefits-of-buildings-deconstruction-and-materials-re-use/ (accessed on 20 May 2021).
- Martínez, E.; Nuñez, Y.; Sobaberas, E. End of life of buildings: Three alternatives, two scenarios. A case study. Int. J. Lifecycle Assess. 2013, 18, 1082–1088. [Google Scholar] [CrossRef]
- Coelho, A.; de Brito, J. Environmental analysis of a construction and demolition waste recycling plant in Portugal—Part I: Energy consumption and CO2 emissions. Waste Manag. 2013, 33, 1258–1267. [Google Scholar] [CrossRef] [PubMed]
- Asdrubali, F.; Baldassarri, C.; Fthenakis, V. Lifecycle analysis in the construction sector: Guiding the optimization of conven-tional Italian buildings. Energy Build. 2013, 64, 73–89. [Google Scholar] [CrossRef]
- Peuportier, B.; Herfray, G.; Malmqvist, T.; Zabalza, I.; Staller, H.; Tritthart, W.; Wetzel, C.; Szalay, Z. Lifecycle assessment methodologies in the construction sector: The contribution of the European LORE-LCA project. In Proceedings of the SB11 Helsinki: World Sustainable Building Conference, Helsinki, Finland, 18–21 October 2011. [Google Scholar]
- Blengini, G.A.; Garbarino, E.; Solar, S.; Shields, D.J.; Hámor, T.; Vinai, R.; Agioutantis, Z. Lifecycle assessment guidelines for the sustainable production and recycling of aggregates: The sustainable aggregates resource management project (SARMa). J. Clean. Prod. 2012, 27, 177–181. [Google Scholar] [CrossRef]
- European Parliament. Directive (EU) of the European Parliament and of the Council Amending Directive 2010/31/EU on the Energy Performance of Buildings and Directive 2012/27/EU on Energy Efficiency, 2018/844, Brussels, Belgium. 2018. Available online: https://eur-lex.europa.eu/legal-content/EN/TXT/?uri=uriserv%3AOJ.L_.2018.156.01.0075.01.ENG (accessed on 15 October 2021).
- European Commission. Energy efficiency—Revision of the Energy Performance of Buildings Directive. Available online: https://ec.europa.eu/info/law/better-regulation/have-your-say/initiatives/12910-Revision-of-the-Energy-Performance-of-Buildings-Directive-2010-31-EU (accessed on 15 October 2021).
- EcoInvent. EcoInvent Database 3.7. 2021. Available online: https://www.ecoinvent.org/ (accessed on 28 July 2021).


| User Profile | Decision Maker | Input | Output |
|---|---|---|---|
| CDW generator |
|
|
|
| CDW consumer |
|
|
|
| CDW operator |
|
|
|
|
|
|
| EWC | Quantity Produced | Recycling Amount | Recycling Operation | Recovery Amount | Recovery Operations | Disposal Amount | Disposal Operation | |
|---|---|---|---|---|---|---|---|---|
| (kg) | (%) | (%) | (%) | (%) | ||||
| 170101 | 37,500 | 29.6 | 0 | Not applicable | 0 | Not applicable | 100 | D1 |
| 170107 | 14,000 | 11.0 | 0 | Not applicable | 0 | Not applicable | 100 | D1 |
| 170201 | 4500 | 3.5 | 0 | Not applicable | 100 | R1 | 0 | Not applicable |
| 170405 | 900 | 0.7 | 0 | Not applicable | 100 | R4 | 0 | Not applicable |
| 170802 | 70,000 | 55.2 | 0 | Not applicable | 0 | Not applicable | 100 | D1 |
| Material | Weight (kg) |
|---|---|
| Mixture of concrete | 390 |
| Metal (Steel) | 12 |
| EPS (optional) | 2 |
| Total | 404 |
| ImpactCategory | Units | Demolition | Transport | Processing | Recycling | Landfill | TOTAL | % Reduction | |||
|---|---|---|---|---|---|---|---|---|---|---|---|
| Scenario1 | Scenario 2 | Scenario 1 | Scenario 2 | Scenario 1 | Scenario 2 | Scenario 1 | Scenario 1 | Scenario 2 | |||
| GWP | kgCO2eq./m2 | 6.8 | 5.6 | 0.8 | 1.5 | 4.2 | 2.2 | 4.9 | 16.6 | 9.4 | 43 |
| ADP (f.f.) | MJ/m2 | 163.1 | 108.7 | 11.3 | 23.3 | 69.8 | 30.8 | 104.5 | 348.6 | 162.8 | 53 |
| ImpactCategory | Units | Demolition | Transport | Processing | Recycling | Landfill | TOTAL | % Reduction | ||||
|---|---|---|---|---|---|---|---|---|---|---|---|---|
| Scenario 1 | Scenario 2 | Scenario 1 | Scenario 2 | Scenario 1 | Scenario 2 (75%) | Scenario 1 | Scenario 2 (25%) | Scenario 1 | Scenario 2 | |||
| GWP | kgCO2eq./m2 | 14.4 | 12.0 | 0.7 | 1.5 | 4.4 | −3.0 | 5.2 | 1.1 | 24.7 | 11.6 | 52 |
| ADP (f.f.) | MJ/m2 | 164.1 | 109.4 | 11.3 | 23.3 | 70.3 | −97.0 | 105.0 | 24.3 | 350.7 | 60.0 | 83 |
Publisher’s Note: MDPI stays neutral with regard to jurisdictional claims in published maps and institutional affiliations. |
© 2021 by the authors. Licensee MDPI, Basel, Switzerland. This article is an open access article distributed under the terms and conditions of the Creative Commons Attribution (CC BY) license (https://creativecommons.org/licenses/by/4.0/).
Share and Cite
Antunes, A.; Martins, R.; Silvestre, J.D.; do Carmo, R.; Costa, H.; Júlio, E.; Pedroso, P. Environmental Impacts and Benefits of the End-of-Life of Building Materials: Database to Support Decision Making and Contribute to Circularity. Sustainability 2021, 13, 12659. https://doi.org/10.3390/su132212659
Antunes A, Martins R, Silvestre JD, do Carmo R, Costa H, Júlio E, Pedroso P. Environmental Impacts and Benefits of the End-of-Life of Building Materials: Database to Support Decision Making and Contribute to Circularity. Sustainability. 2021; 13(22):12659. https://doi.org/10.3390/su132212659
Chicago/Turabian StyleAntunes, Ana, Ricardo Martins, José Dinis Silvestre, Ricardo do Carmo, Hugo Costa, Eduardo Júlio, and Pedro Pedroso. 2021. "Environmental Impacts and Benefits of the End-of-Life of Building Materials: Database to Support Decision Making and Contribute to Circularity" Sustainability 13, no. 22: 12659. https://doi.org/10.3390/su132212659