
The Long-Term Impact of Wind Power Generation on a Local Community: Economics Analysis of Subjective Well-Being Data in Chōshi City


1
Research Institute for Environmental Economics and Management, Waseda University, Tokyo 169-8050, Japan
2
Department of Business Administration and Information, Kyoto College of Economics, Kyoto 610-1111, Japan
3
Faculty of Political Science and Economics, Waseda University, Tokyo 169-8050, Japan
4
Faculty of Economics, Fukui Prefectural University, Fukui 910-1195, Japan
*
Author to whom correspondence should be addressed.
Energies 2021, 14(13), 3984; https://doi.org/10.3390/en14133984
Submission received: 10 May 2021
/
Revised: 25 June 2021
/
Accepted: 30 June 2021
/
Published: 2 July 2021
(This article belongs to the Special Issue Economic Analysis on Energy and Environmental Issues and Policy)
Abstract
:In this study, we analyzed the external effects of wind turbines, which are often considered detrimental to the promotion of wind power generation. Understanding these externalities is essential to reaching a consensus with residents who live near the site of a planned wind turbine. Our research objective was to determine the relationship between wind turbines and people’s well-being in areas where they have been installed for a long time. We hypothesized that wind turbines would have a negative impact on people’s well-being. We conducted a survey by postal mail in Chōshi City, Chiba Prefecture, Japan, to examine the external effects of wind turbines, adopting a subjective well-being index to measure respondents’ well-being. Regression analysis suggests that having a view of wind power turbines has a positive effect on the subjective well-being of local residents. Moreover, the results indicate that such well-being increases with increasing distance from the turbines. Except for scenic elements, we found that wind turbines are not always considered desirable by residents. Therefore, it is important to further clarify the external influence of wind turbines and other facilities in local communities.
1. Introduction
From the perspective of climate change and energy security, the rapid introduction of renewable energy is greatly expected. Countries around the world have been researching and introducing renewable energies that take advantage of local natural capital [1,2,3,4]. Despite the remarkable growth of photovoltaic energy via a feed-in-tariff (FIT) scheme, the installed capacity of renewable energy has not been fully utilized in Japan. Therefore, the introduction of other renewable energy sources, such as wind and geothermal power generation, has been greatly expected. In fact, in announcing that it will achieve carbon neutrality by 2050, the Japanese government proposed the expansion of onshore wind power and offshore wind power [5]. However, it has been suggested that the operation of wind power generation facilities may bring negative externalities to local communities. For example, Japan’s Ministry of the Environment [1] reported typical damage and negative impacts that building or operating wind turbines has caused, including obstructed views, noise, low-frequency sounds, impacts on animals and plants, and shadow flicker, which represent negative externalities for local residents, leading to conflicts regarding the construction of wind turbines.
Conflicts related to the construction of wind turbines are considered to be a disincentive for their expansion. In Japan, conflicts have occurred in approximately 40% of the cases of wind turbine construction [6,7]. According to estimates by the Ministry of the Environment [8], the potential for wind power energy in Japan is approximately 1.9 million MW. However, the amount of installed capacity as of 2020 was 443.9 MW [9], which shows that the use of wind power is lagging behind its potential. Of course, such conflicts also exist in other countries. In Europe, for example, wind power is more widely installed than in Japan (approximately 220,000 MW in 2020) [10]. However, in Europe, as in Japan, approximately 40% of projects have been postponed due to disputes [11]. In response to these conflicts, in 2008, the International Energy Agency Wind Technology Collaboration Programme (IEA Wind TCP) started a task force related to the social acceptability of wind power, which has been working toward more rapid introduction of wind power in Europe [12].
Given the current situation, it is critical to develop a framework to deal with the conflicts related to turbine construction and accelerate the introduction of wind turbines in Japan. One option is to share the benefits related to the construction and operation of wind turbines. Therefore, it is necessary to examine the possible negative externalities and review relevant studies that can be used for discussion with residents. To the best of our knowledge, such studies have not been conducted in Japan. Therefore, this study is the first attempt to examine whether and how wind generation results in negative externalities in Japan.
The purpose of this study is to clarify the extent of externalities in areas where wind turbines have actually been in operation for a long time. There are some areas in Japan where wind turbines have been operating for a long time after conflicts were resolved, but the externalities in these areas have not been clarified. We believe that clarifying these external externalities will be useful for building consensus when constructing wind turbines in the future. We hypothesize that even if conflicts did not occur, externalities exist and have some negative impact on people. The purpose of this study is to clarify this hypothesis.
While wind power mitigates the negative externalities of conventional electricity technologies, notably the emission of CO2 and other air pollutants, it also entails externalities [13]. There are many studies on the externalities of wind turbines, for example, visual pollution [14,15,16,17], noise pollution [18,19,20,21,22], and impacts on wildlife [23,24,25,26,27]. Several studies have investigated the negative impacts on landscape aesthetics [14,15,16,28,29]. While there have been several studies on the noise impact of wind turbines [18,19,20,21,22], many studies report that annoyance does not indicate evidence of causal health effects [13]. In addition, wind turbines may change the habitats of wildlife such as birds and bats, and many studies have examined whether and how wildlife is impacted [24,25,26,27,28]. However, whether the general effect on wildlife is positive or negative is uncertain [13].
On the other hand, wind turbines do not always lead to only negative externalities for residents. They can induce positive externalities by stimulating the tourism industry if they can create special landscapes. There are numerous studies about such effects on tourism, but with different results, so the evidence on local tourism effects remains mixed [13]. Some case studies establish negative impacts on local touristic appeal [29,30,31], while others detect negligible effects or enhanced attractiveness [32,33,34,35,36].
There are typically two types of methods for conducting research on wind turbine externalities. First, there are research methods involving the use of questionnaire surveys, such as the contingent valuation method (CVM) and choice experiment (CE). These estimate respondents’ willingness to pay (WTP) to prevent the construction of wind turbines or their willingness to accept (WTA) construction. Many CVM and CE studies have shown that neighboring residents perceive negative externalities from wind turbines [16,37,38,39]. On the other hand, some studies show that consumers are willing to pay for wind turbines to obtain green electricity [40,41,42,43]. There is also an analytical method that combines the CVM and CE with the travel cost method (TCM), which predicts landscape value from tourist travel costs [44]. Kipperberg et al. [45] used this method to show the negative impact of wind turbines. These methods have some problems. First, they may be affected by strong opposition from local residents to the construction of wind turbines. In such cases, the results will be greatly biased. In addition, the scenarios of the questionnaires used in these methods can greatly affect respondents’ evaluations. In this regard, we need to be very careful when creating questionnaire scenarios.
A second analytical method involves the use of a hedonic approach [46]. When people select housing, they make decisions by considering environmental factors, including noise levels and landscape. The hedonic method in this context is based on the premise that land prices include people’s WTP for the environment. By using this method, we can assess how the externalities of wind turbines, such as noise and landscape effects, affect land prices [47]. Jensen et al. [29] analyzed the impact of the presence of wind farms on land prices using Danish land price data. In their study, they analyzed the negative influence of wind turbines in terms of landscape and noise separately. Numerous other studies have also used the hedonic method, including those by Sims and Dent [48] in the UK, Heintzelman and Tuttle [49] in the USA, Dröes and Koster [50] in the Netherlands, Sunak and Madlener [51] in Germany, and Gibbons [52] in England and Wales. However, in the Japanese context, using the hedonic method of analysis is difficult because there are only a few cases where wind power generation facilities have been introduced near housing, and there is a very small amount of data on housing transactions near wind power generation facilities. However, there are some cases where wind turbines are constructed very close to residences, because there are no regulations controlling the distance between them in Japan.
In recent years, the life satisfaction approach (LSA) using subjective well-being has attracted attention as a new analytical method. Compared to the CVM and hedonic approach, the LSA avoids bias resulting from the expression of attitudes or the complexity of valuation; it also avoids misconceptions regarding the real estate market (slow adjustment of prices, incomplete information, transaction costs, etc.) [53,54,55]. Several studies have used the LSA to analyze, for example, air pollution [56,57], landscape amenities [58], noise pollution [59,60,61], and flood disasters [62].
Kunimitsu [63] analyzed the positive influence of the existence of physical capital in an area on well-being, while Brereton et al. [64] show the positive impact of airports on well-being. On the other hand, some studies show that the “not in my backyard” (NIMBY) attitude has a negative impact on well-being. For example, roads [64,65,66,67], dumping grounds [64], and nuclear power plants [68] have been shown to have a negative impact on well-being. On the other hand, in the context of wind turbines, the NIMBY argument has been controversial. Some studies argue that NIMBY may not be an appropriate framework. They claim that “NIMBY resistance may be a result of opposition rather than an explanation of it” [69]. Other studies claim the proximity hypothesis, which states that people are more likely to oppose the introduction of a controversial facility if they live closer to it [70,71].
A handful of studies used the LSA to investigate wind turbines in Germany [55,72]. These studies found negative effects of wind turbines on happiness, but such effects appeared to be both spatially and temporally limited [13,55,72]. In this study, similar to those of Krekel and Zerrahn [55] and von Möllendorff and Welsch [72], our analysis is focused on the relationship between subjective well-being and wind turbines.
The first feature of this study is that, similar to Krekel and Zerrahn [55], we use detailed distance data. Since the degree of externalities from wind turbines may vary greatly depending on the distance from people’s place of residence, we also consider this point in the analysis.
Second, we examine what elements of wind turbines affect well-being. Krekel and Zerrahn [55] focused on the distance to existing wind power generators and well-being. In this study, we focus not only on the distance from wind turbines but also on whether residents can see or hear them. Even if residents live close to a wind turbine, it is possible that its influence will differ depending on whether they can see it.
In addition, different from Krekel and Zerrahn [55] and von Möllendorff and Welsch [72], this study features an analysis of an area where wind power generation has operated for a long period of time. Krekel and Zerrahn [55] point out that although the well-being of people in an area where wind turbines are introduced will be negatively affected in the short term, the influence will decrease over time. Therefore, in this study, we analyze the relationship between wind turbines and the well-being of people in areas where the turbines have been operating for a long time. Specifically, we analyze Chōshi City; currently, the oldest wind turbine in Chōshi has been in operation since 2001 [73]. In other words, Chōshi is a region where wind turbines have existed for more than a decade. The reason why this study chose Chōshi will be discussed in the next section.
To analyze the relationship between wind turbines and the subjective well-being of local residents, it is necessary to grasp their positional relationship. In this study, we adopted a postal mail survey approach to gather completed questionnaires. By gathering more data on subjective well-being from residents who live near or moderately close to a wind turbine, we were able to analyze this relationship.
2. Materials and Methods
2.1. Research Context: Subject Area and Wind Power Generation Facility
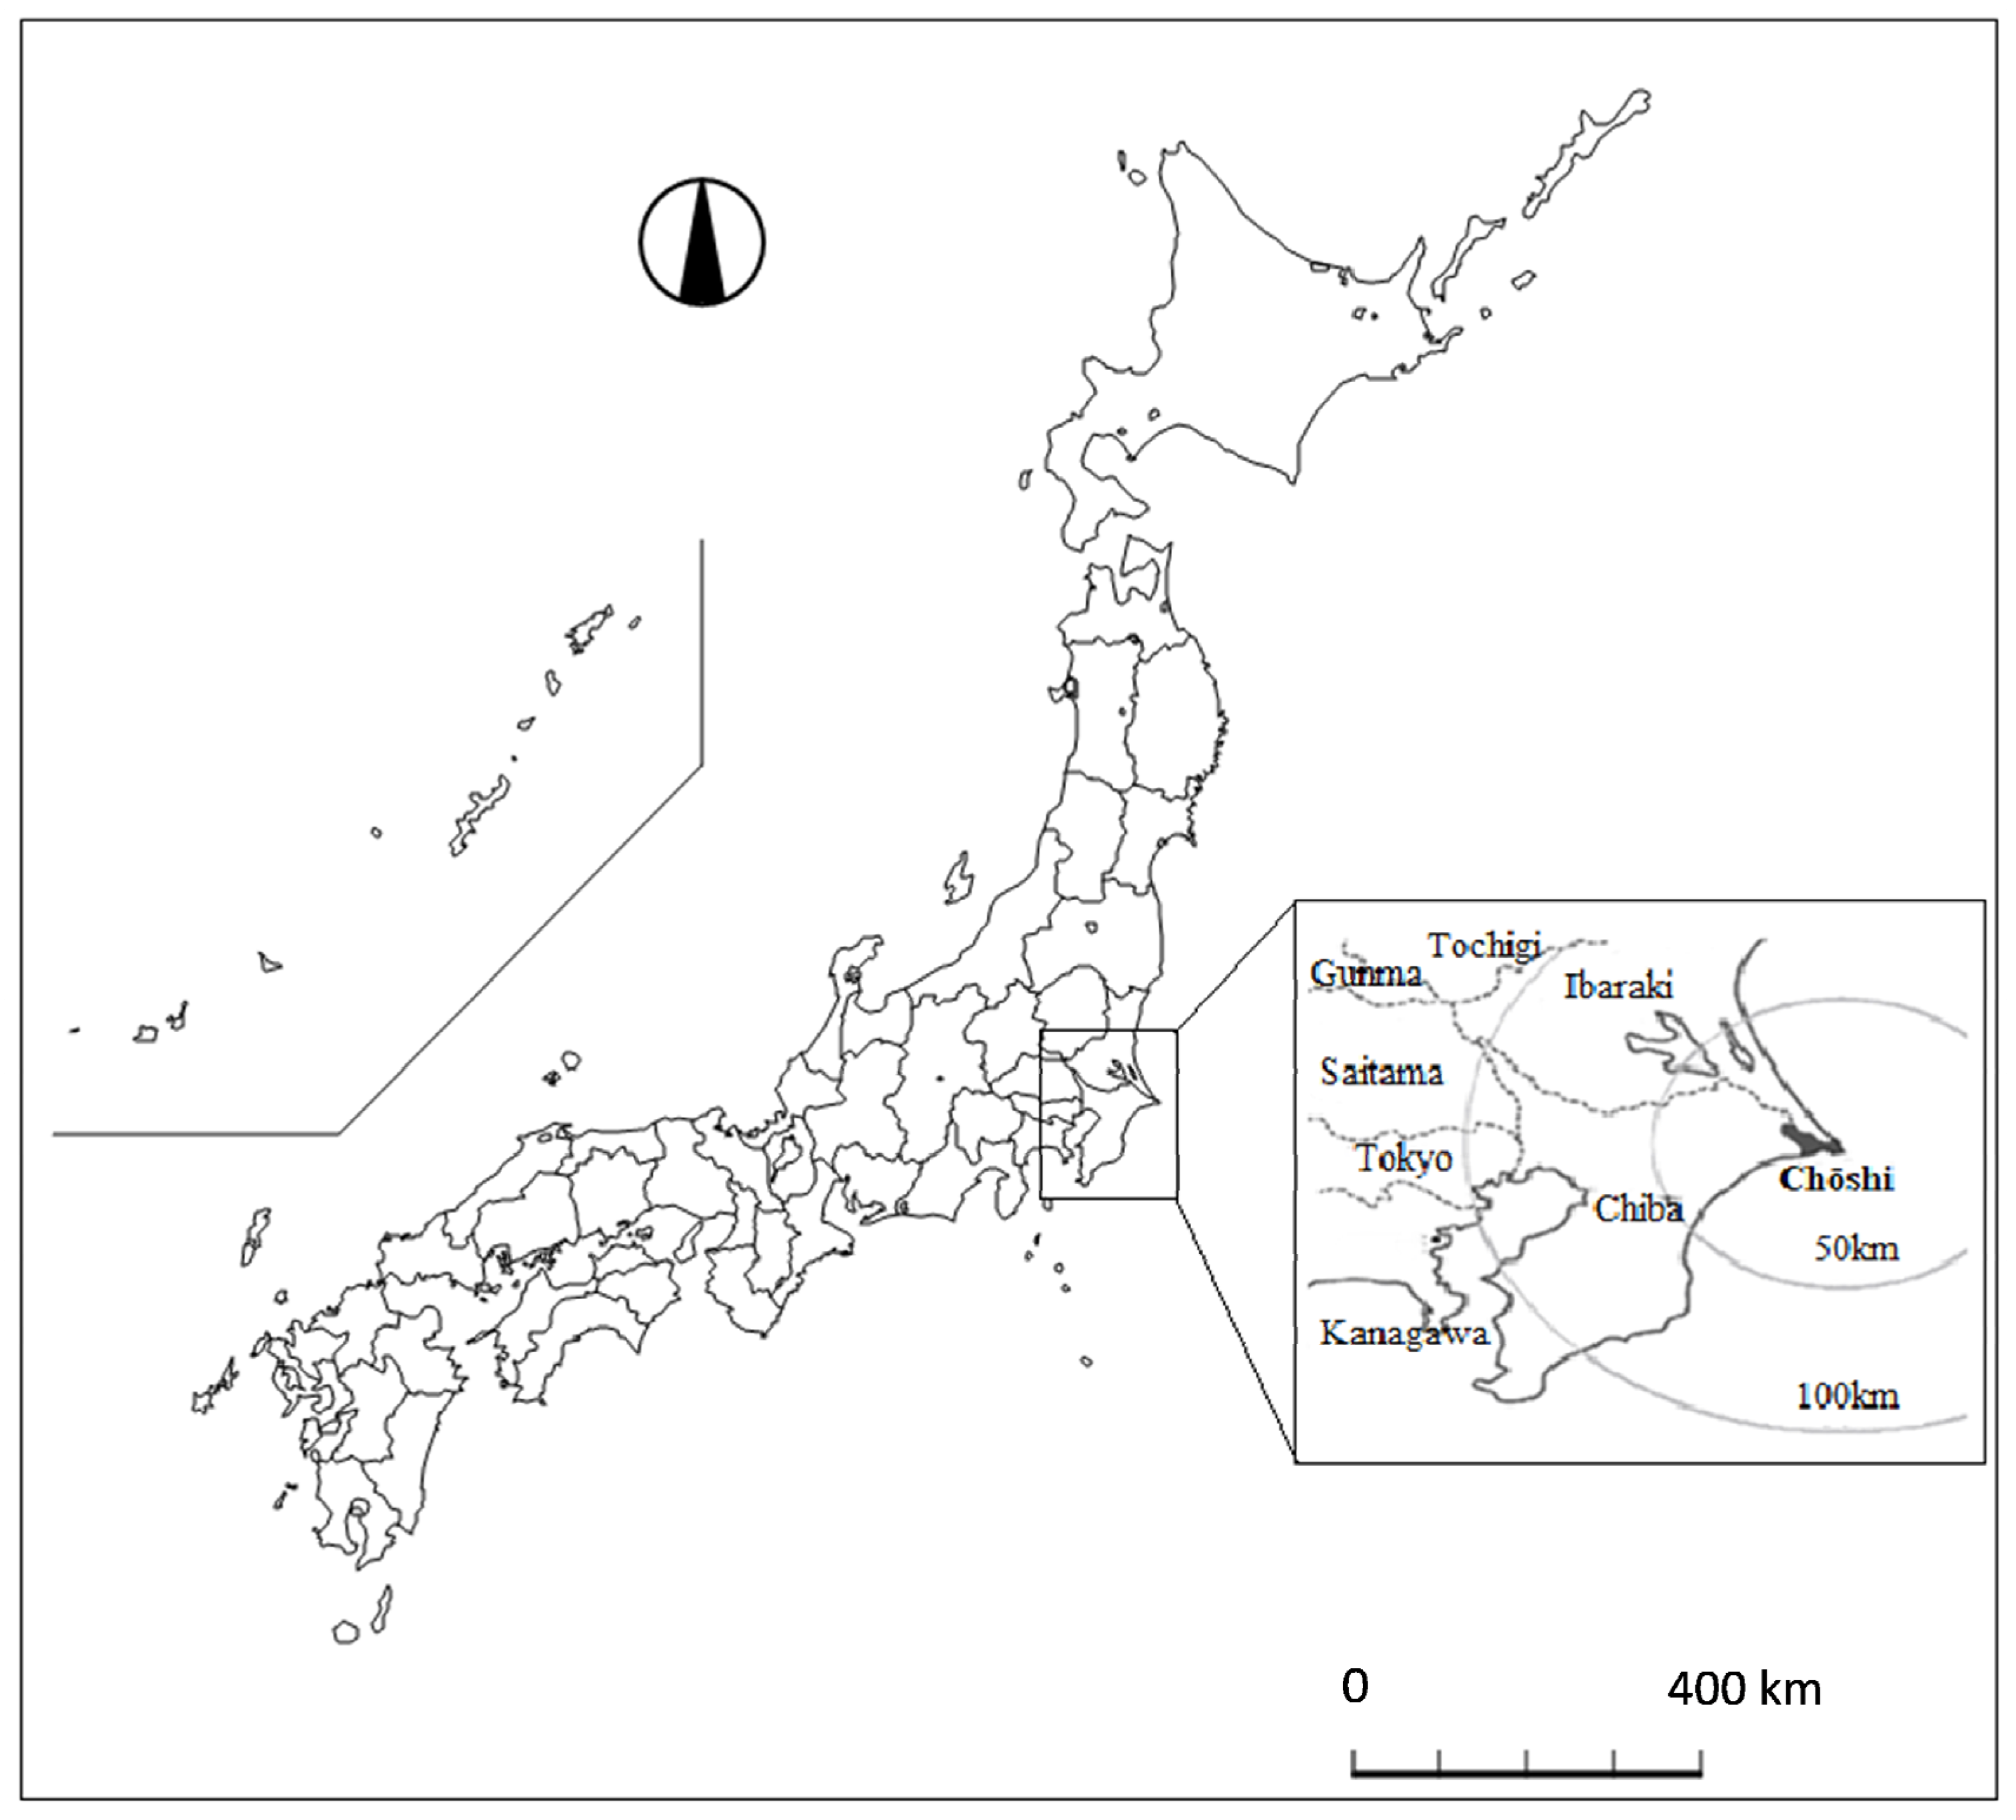
Chōshi City, the subject area of our study, is part of Chiba Prefecture in the Kanto area, which comprises 7 prefectures, including Tokyo (Figure 1) [74,75]. We combined a map of Chōshi [74] and a map of Japan with Mandara 10 (free mapping software) [75] to construct Figure 1. Chiba Prefecture is in the eastern Kanto area, and Chōshi is located in the far eastern part of this area, approximately 100 km from central Tokyo. Similar to other municipalities in Japan, Chōshi has experienced problems related to a declining birth rate and an aging population; its population was approximately 59,000 as of 2021 [76], but it was more than 80,000 in 1995. In terms of age distribution, the 65–69 age group is the largest across genders and amounts to a higher share of the older population than the national average [77].
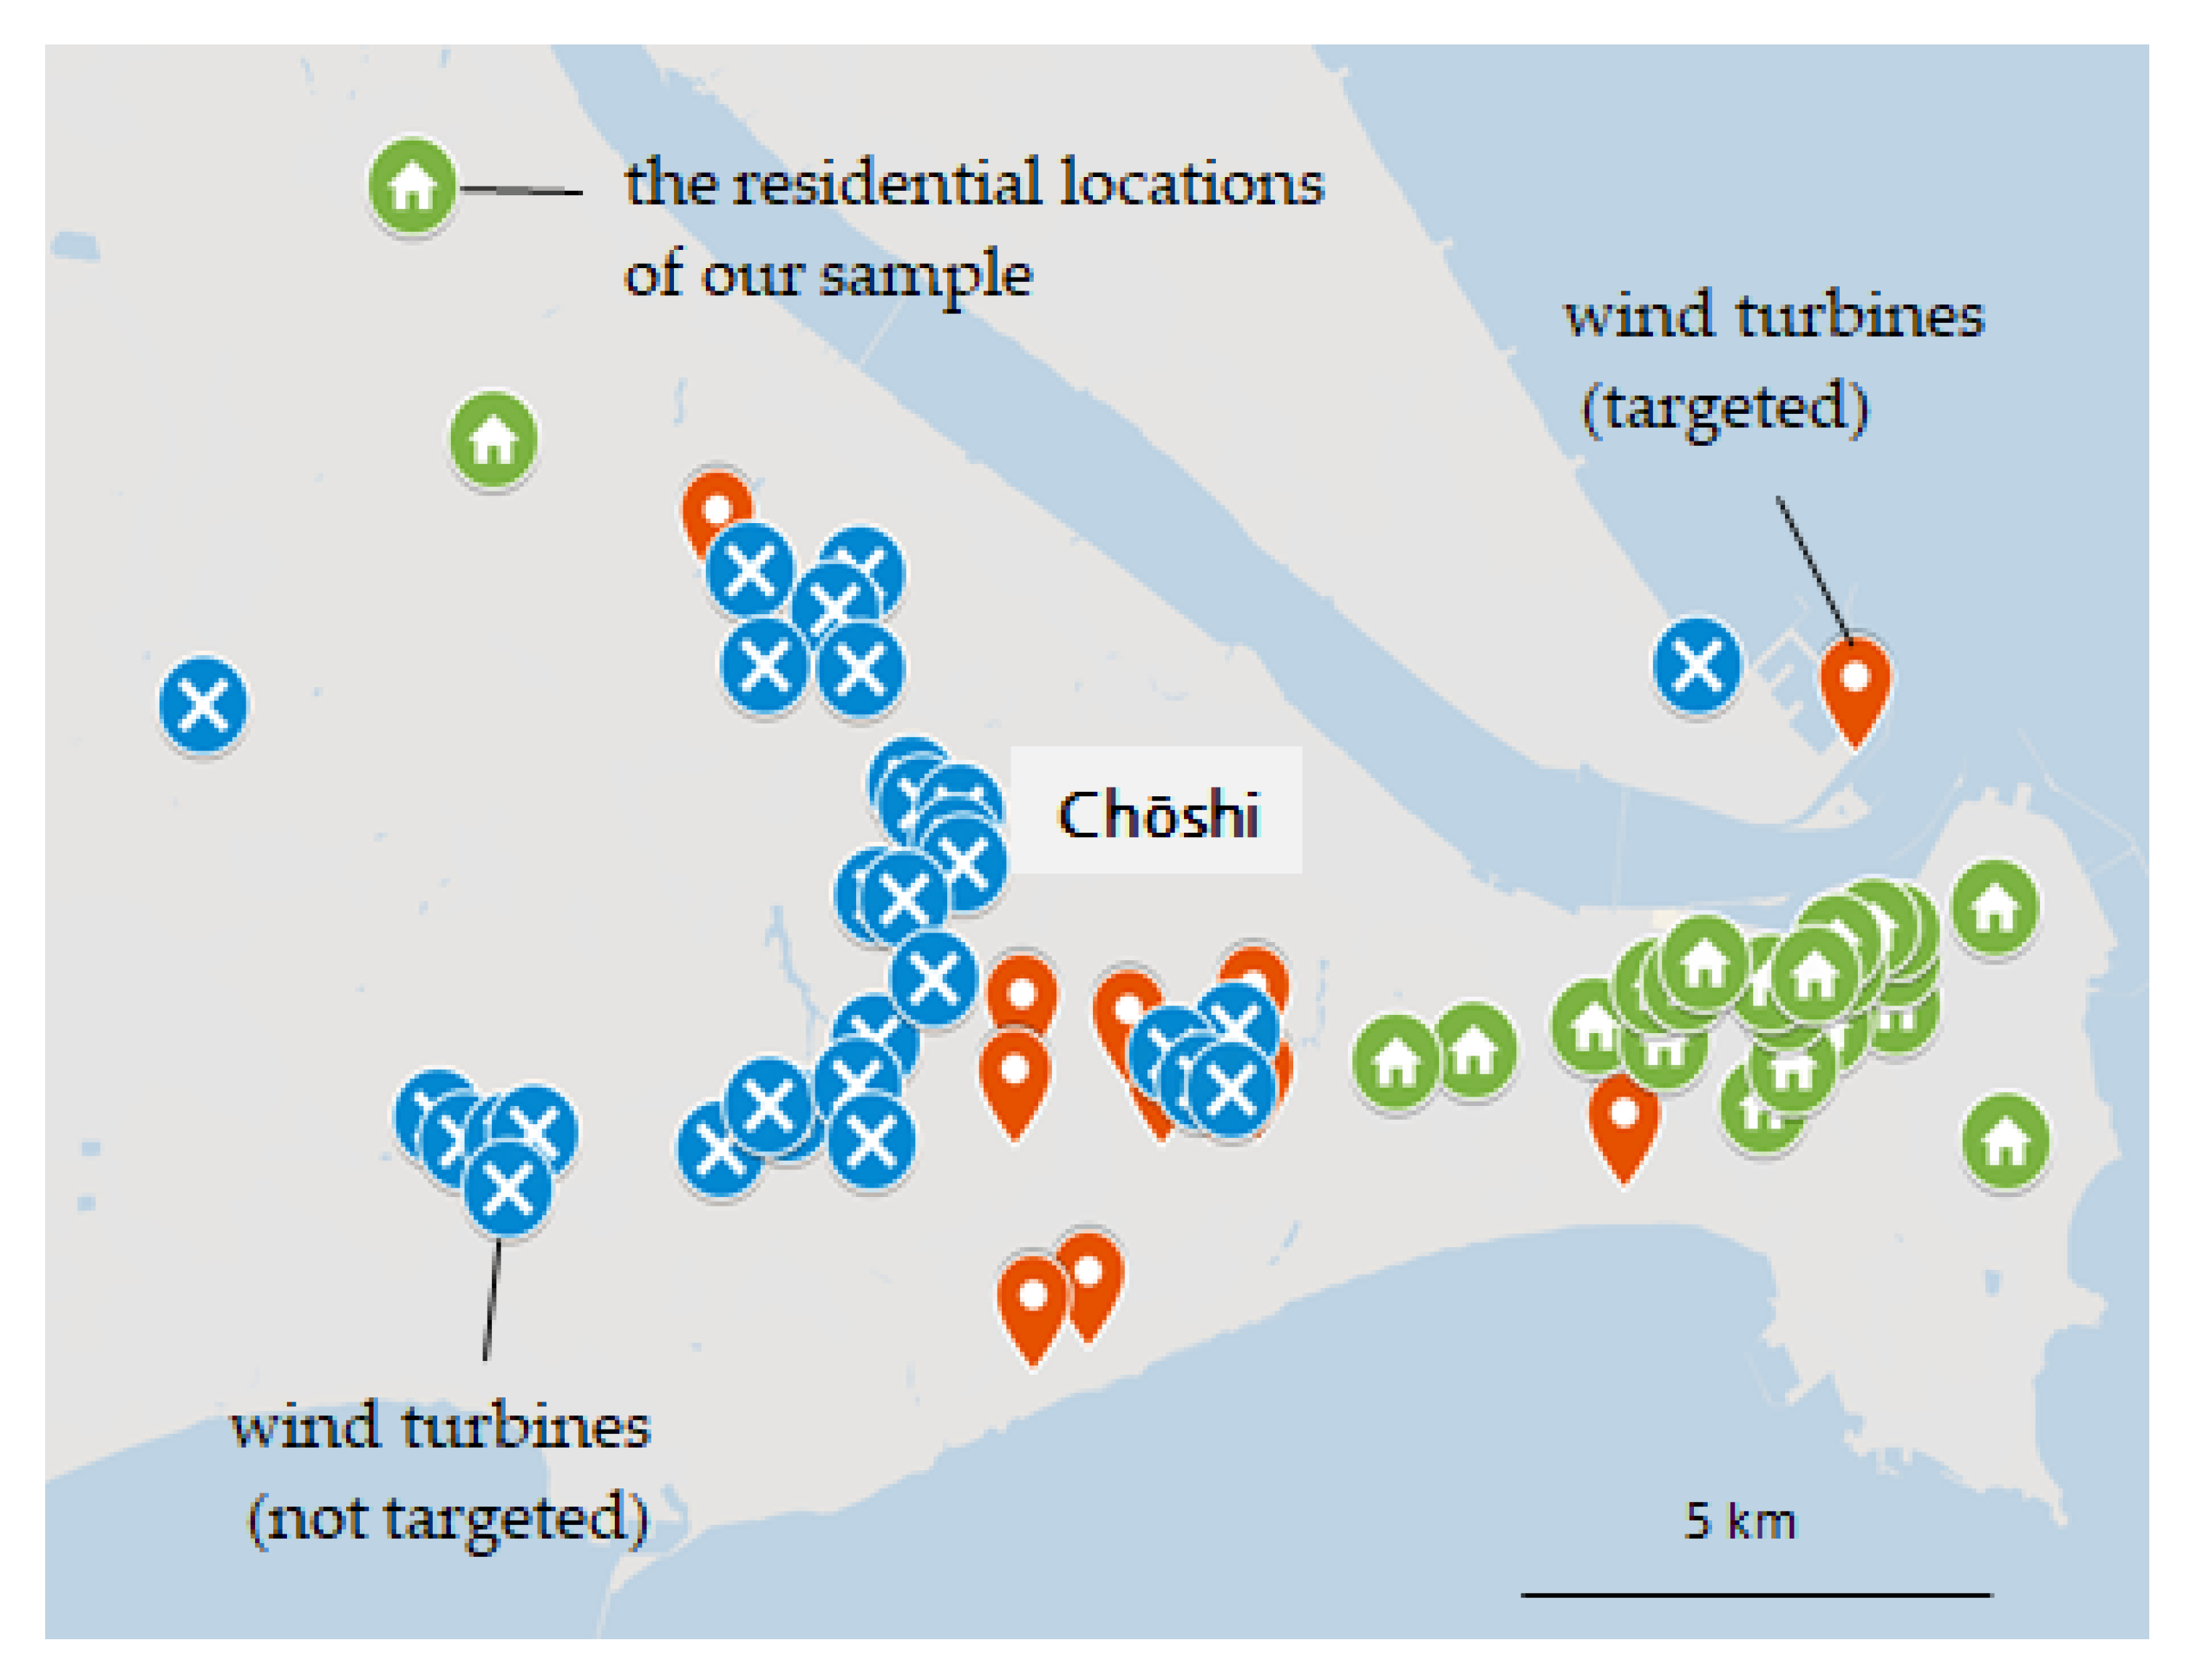
According to the “Wind Power Generation Facilities and Installations Report in Japan” [73], 35 wind power generation facilities were operating in Chōshi as of March 2017. Indeed, the eastern part of the city had a concentration of commercial facilities before the construction of wind turbines began (Figure 2). Figure 2 shows a map of the Chōshi area and the locations of wind turbines. We mapped the locations of wind turbines on Google Maps using address information from NEDO [73] and the basic residence register for Chōshi City. The home icons indicate the residential locations of our sample, the X icons indicate wind turbines that were not targeted, and balloon pins represent the targeted wind turbines. Although there are windmills in Asahi City and Kamisu City around Chōshi City, we focused on windmills in Chōshi and houses near them. We also excluded from our analysis those windmills that were already out of operation even if they were located near targeted houses. The average output of wind farm facilities is 1500 kW; however, some facilities have much a higher output, up to 2400 kW. Since the size of wind turbines in Chōshi does not vary much, in this study we considered their size to be almost constant.
An offshore wind farm was first introduced in Japan east of Chōshi, and it has been operational since 2013. Wind farms were also introduced in Asahi and Kamisu, which are located to the west and north of Chōshi, respectively. Given the number of wind farms that have been introduced around Chōshi, it appears reasonable that its residents are familiar with wind farms. There have also been few conflicts with residents regarding the introduction of wind farms [78]. Therefore, we chose Chōshi as the survey area.
2.2. Survey Design and Data
We specified the survey area to collect information from residents who lived close to wind turbines. We selected Chōshi City as our study area because, as explained in the previous section, it is an area where several wind turbines have been installed for a long time. Chōshi consists of 166 areas. Given budget limitations, we decided to focus on 25 areas. There are three areas near wind turbines. We randomly chose 22 towns from the remaining areas.
To collect questionnaires from the residents of the selected towns, we conducted the survey by postal mail. To do so, we accessed the Basic Resident Ledger at the Chōshi City Hall, which allowed us to look up the names and addresses of residents for research purposes. Using the basic residence registers, we randomly selected 300 people from the 25 areas and mailed them the questionnaires.
The survey included questions on subjective happiness, individual attributes, and wind turbines. Regarding the latter, we asked respondents whether the turbines were visible from their homes, and for their evaluation of noise and low-frequency sounds emitted by the turbines. We applied the same questions to other buildings (steel towers, factories, large shopping centers, etc.) located near their homes. To develop questions on evaluating wind turbines, we referred to materials published by the Ministry of the Environment [5], which discloses public complaints regarding wind turbines. We also included the same questions for other buildings.
It is possible that questions about wind turbines can themselves lead to negative answers from people due to confirmation bias, such as the framing effect [79]. Therefore, we applied the same questions to other buildings located near their homes. These questions help to keep people from focusing their negative impressions on wind turbines. In addition, due to confirmation bias [79], people may decide on their answers regarding subjective well-being based only on their evaluation of wind turbines. As a way to deal with this issue, we asked the subjective well-being question first so that the evaluation of wind turbines would not directly affect the answer.
Since our objective was to examine the relationship between the distance from wind turbines and residents’ happiness, we needed the distance information. This information was obtained by using Google Maps. For the three towns located near wind turbines, we used street number data to measure the distance between individual homes and the turbines, and for the other 22 towns, we used postal codes to measure the distance between the town and the closest wind turbine.
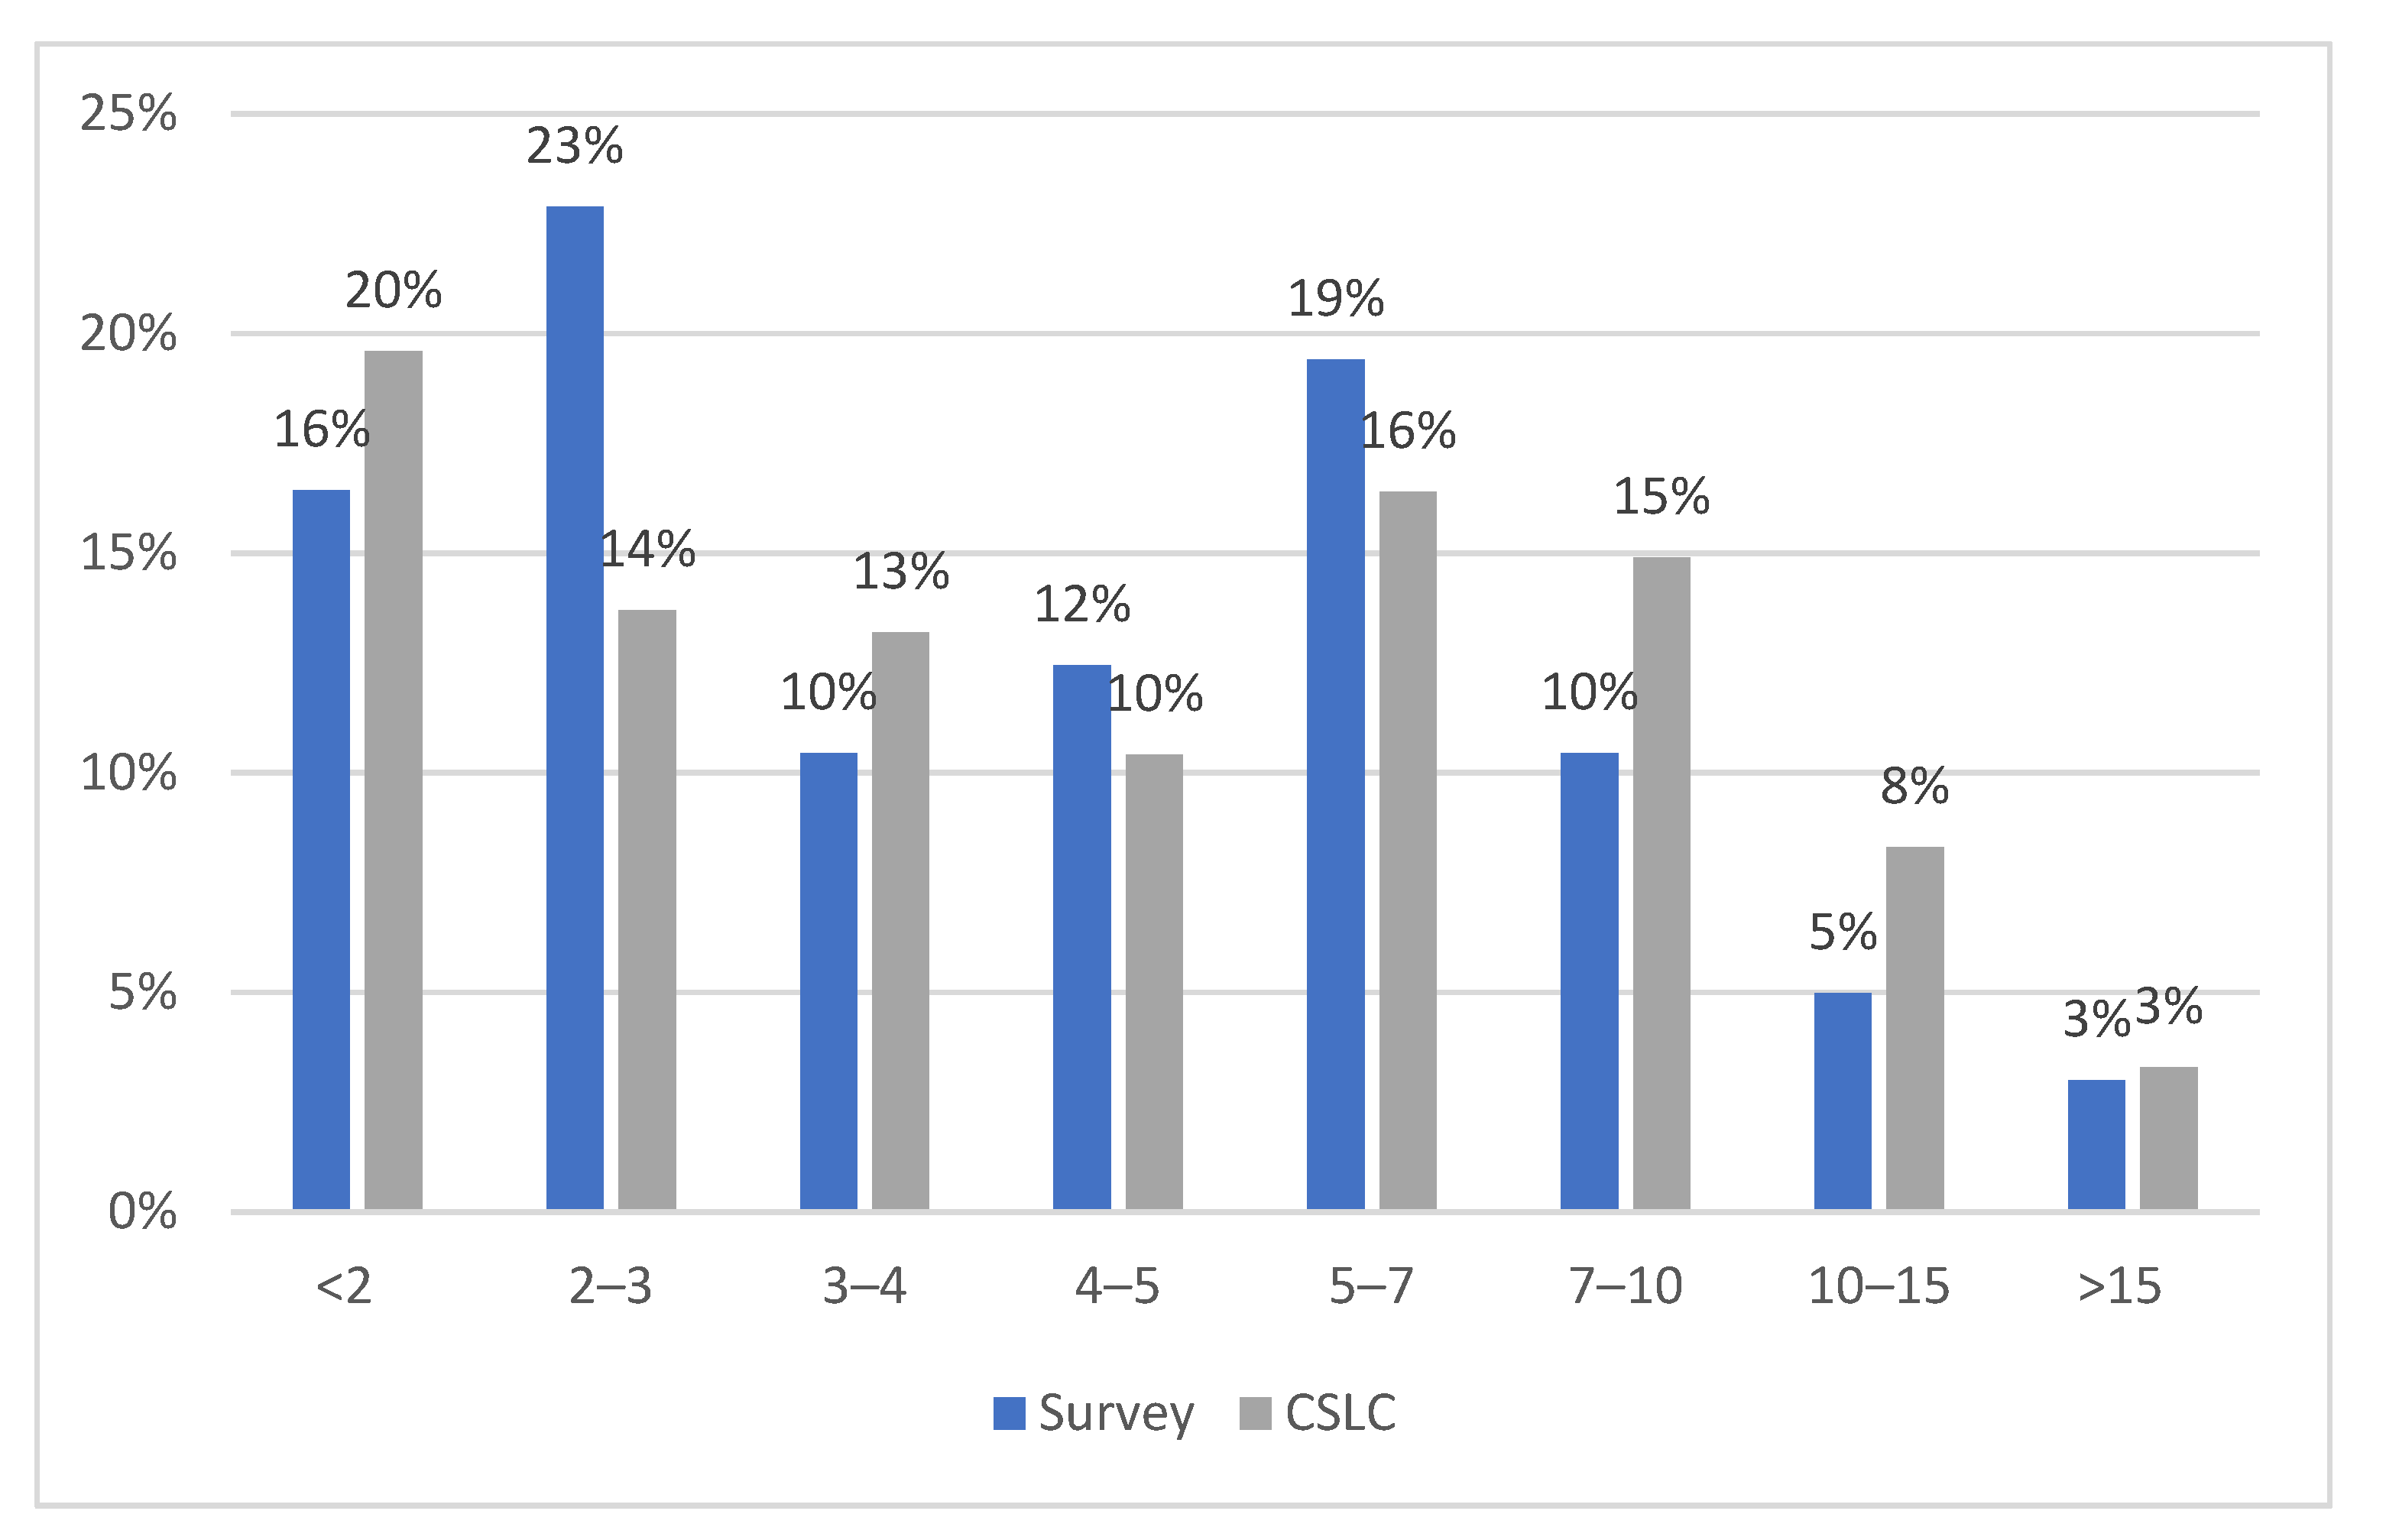
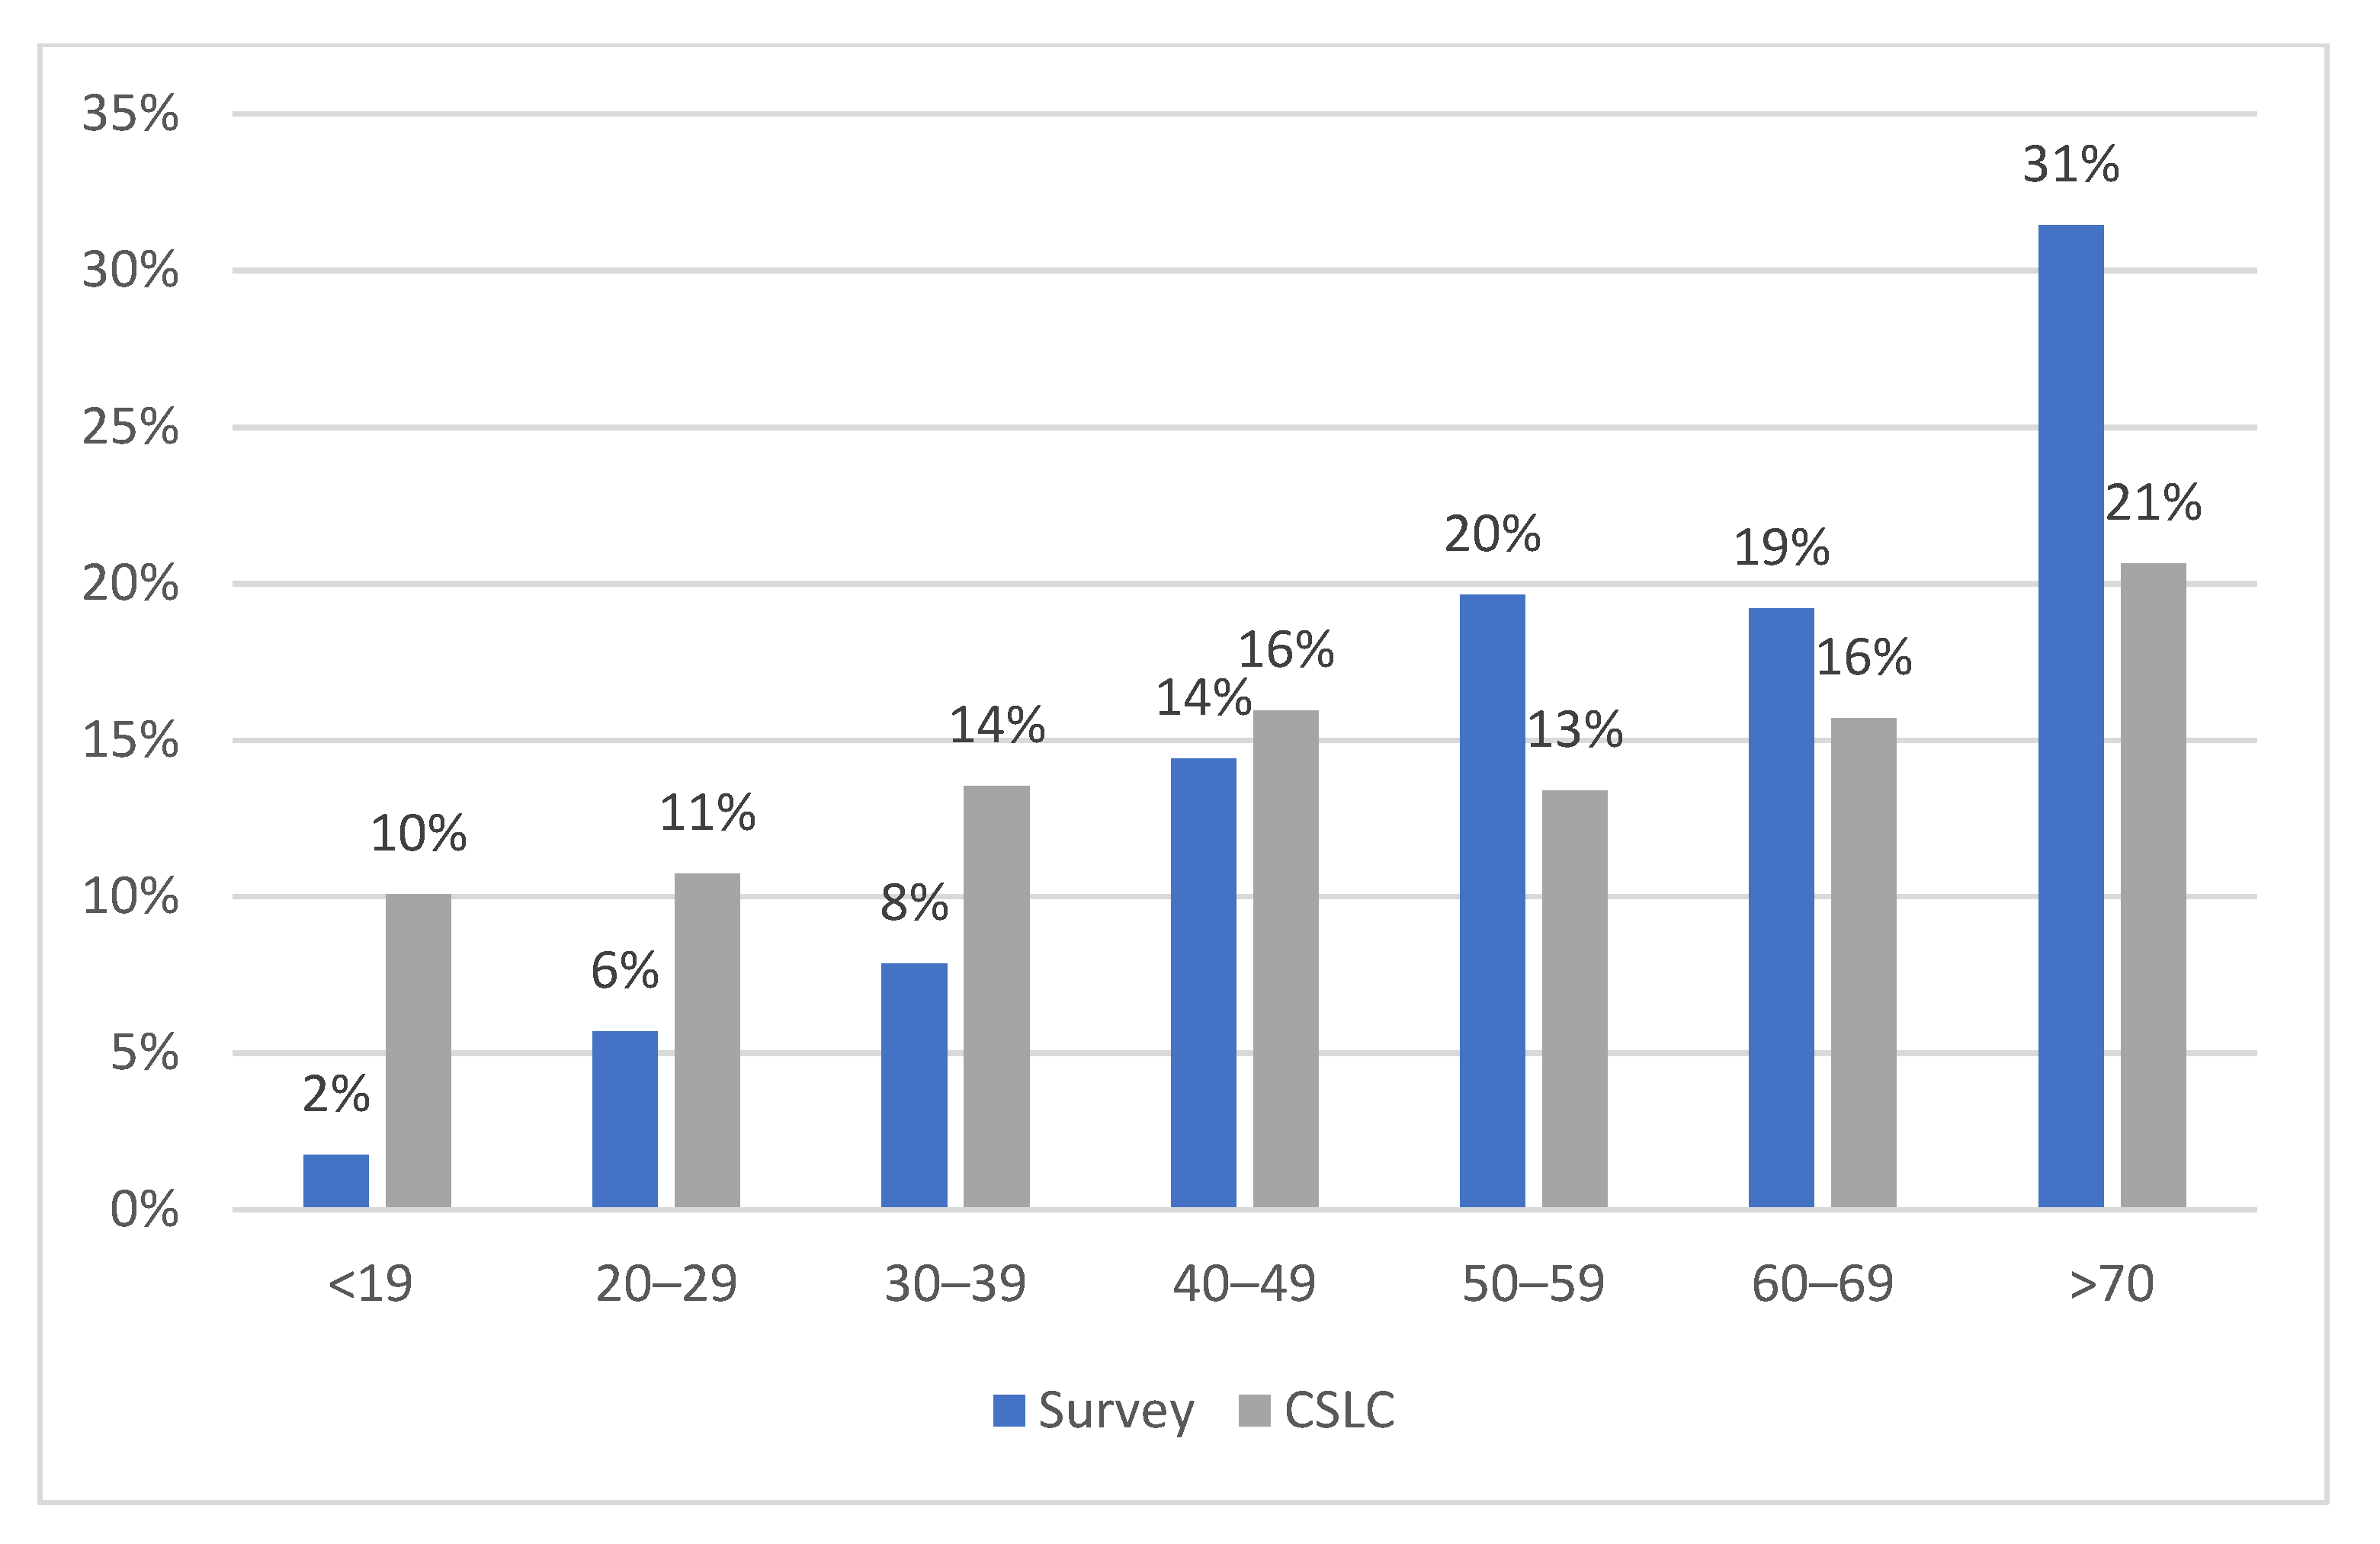
We mailed the questionnaire to 600 people and obtained 229 responses, for a response rate of 38%. Figure 3 shows the income distribution of our sample compared with national population statistics obtained from the Comprehensive Survey of Living Conditions (CSLC) [80]. Compared to the population, our sample contains a larger share of people earning an annual income of JPY 2 to 3 million and a lower share of people earning more than JPY 7 million. Figure 4 shows the age distribution of our sample versus the population [80]. Note that the survey targeted residents who are 18 years of age or older. Compared to the national age distribution, our sample had a smaller share of young respondents, especially the 10–19 age group, because only people who are older than 18 years of age are eligible to complete our survey. On the other hand, our sample contained more people aged 50 and above, and especially older than 70 years. In summary, we had a greater share of respondents who earned less income and were older compared to the general population, which could partially be because the rate of aging in Chōshi (33.7%) is higher than the national average (26%). In any event, the difference in demographic information between the sample and the national population should be noted when interpreting the estimation results.
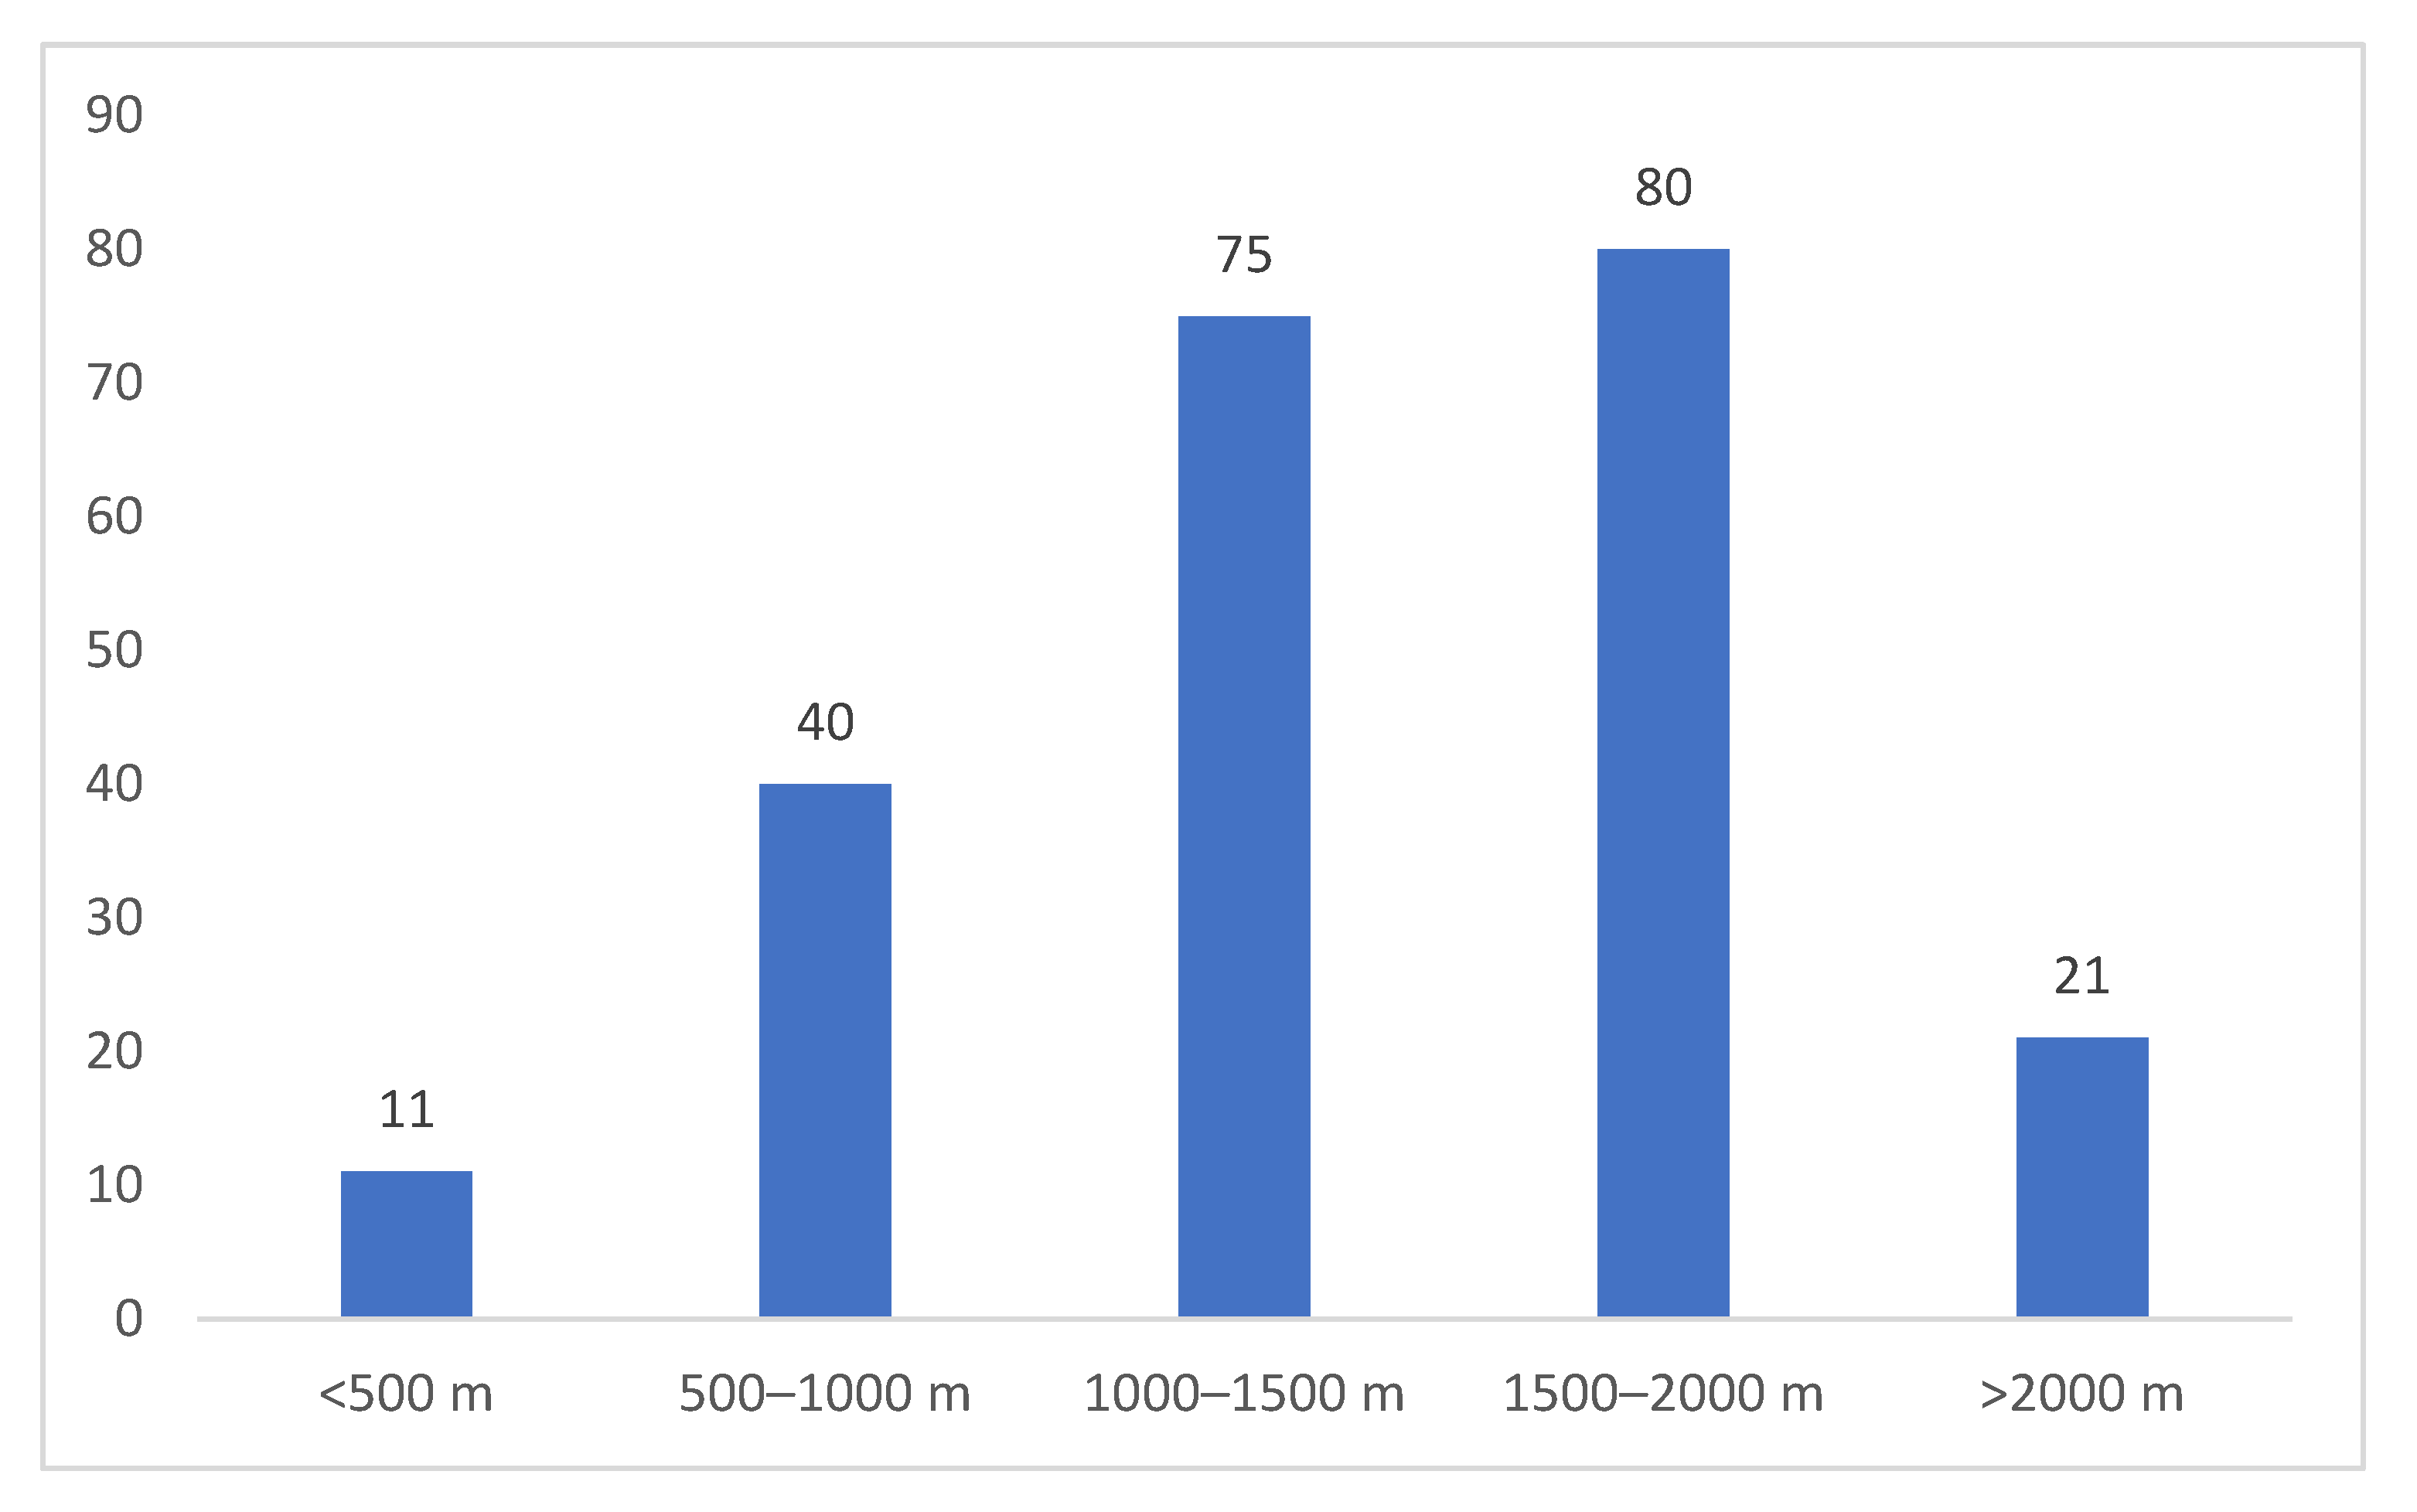
Figure 5 shows the distribution of distance from residential areas to wind turbines. The majority of respondents live in areas 1500 to 2000 m from wind turbines, followed by people who live within 1000 to 1500 m of wind turbines. At the extremes, some live more than 2000 m from turbines, while others live within 500 m.
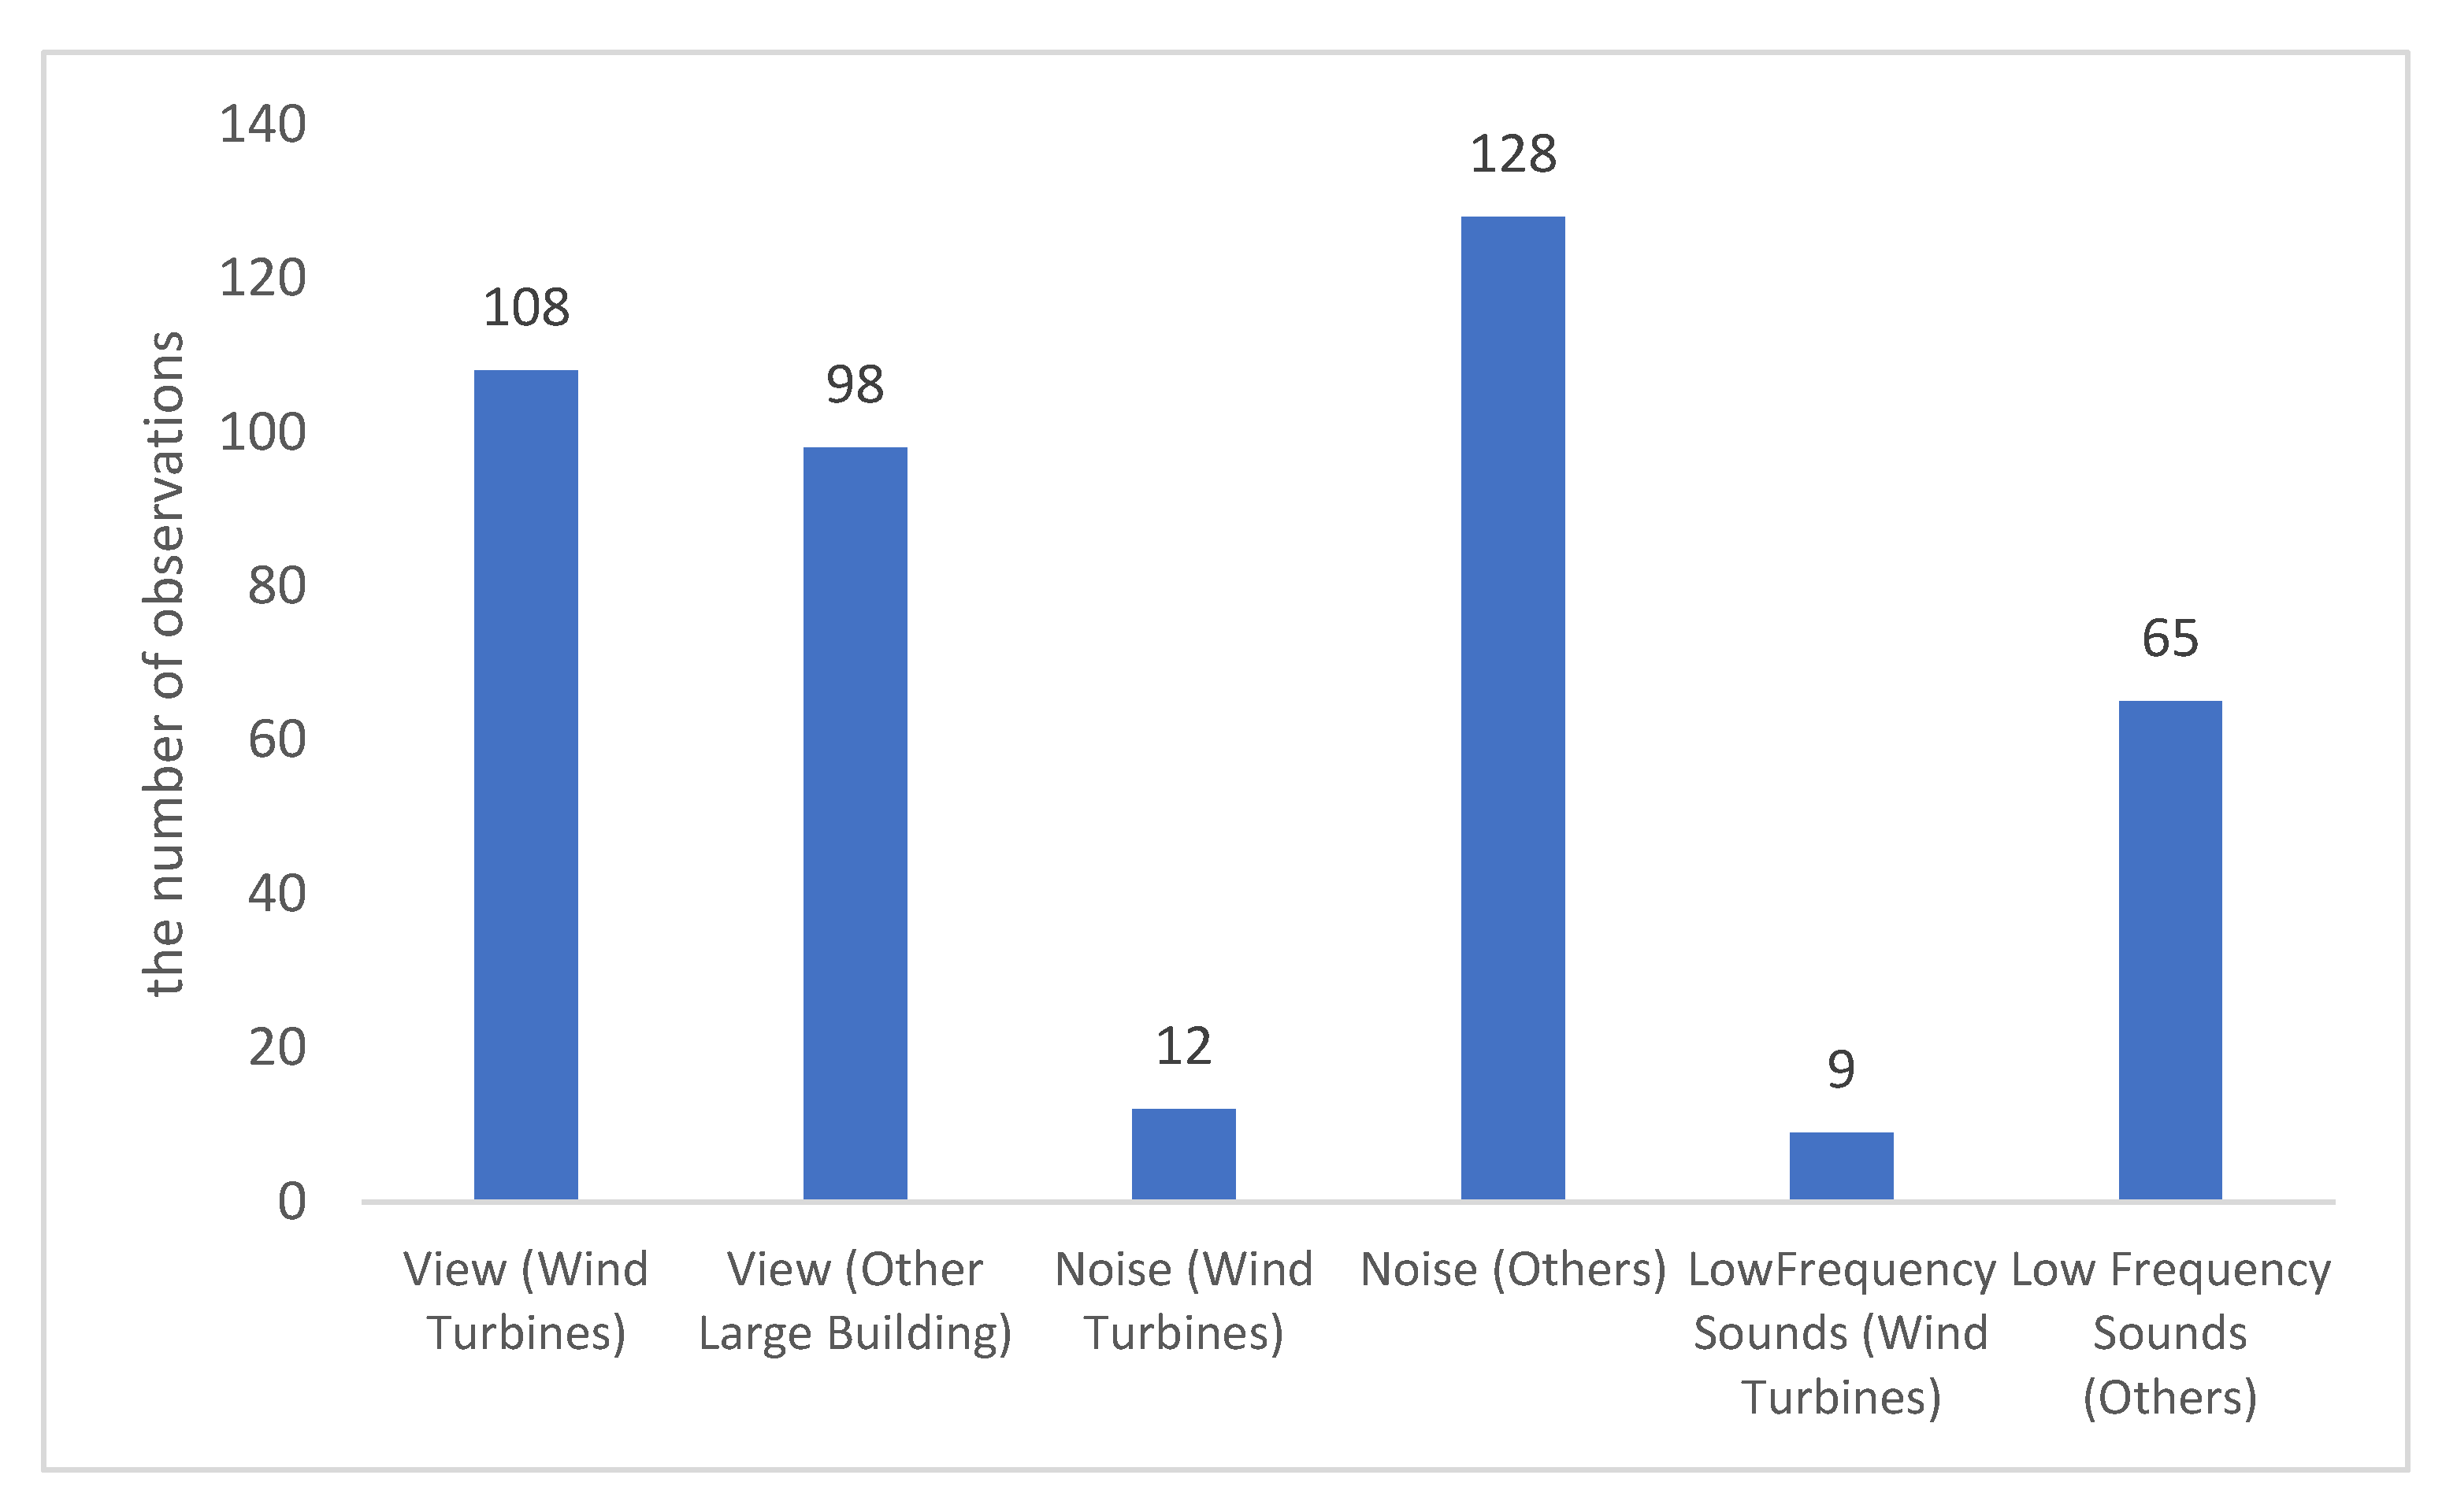
Figure 6 graphically summarizes factors of the residential environment related to the presence of wind turbines and other large buildings, such as visibility and audibility. With regard to visibility, we asked respondents, “How many wind turbines can you see from your home?” and totaled how many saw at least one. We found that almost half of the respondents could see wind turbines from their homes. We also asked, “Do you have any large structures (e.g., towers, factories, large shopping centers) near your home?” We found that large buildings were visible from 44% of respondents’ homes. Regarding the sound, we asked, “Do you hear the sound of wind turbines (e.g., blades blowing in the wind, mechanical noise from the generator)?” Figure 6 shows that only a small proportion of respondents could hear noise or low-frequency sounds of wind turbines. We also asked the same question about the noise of other large buildings. Among the respondents, 57 and 29% heard noise or low-frequency sounds, respectively, from other buildings.
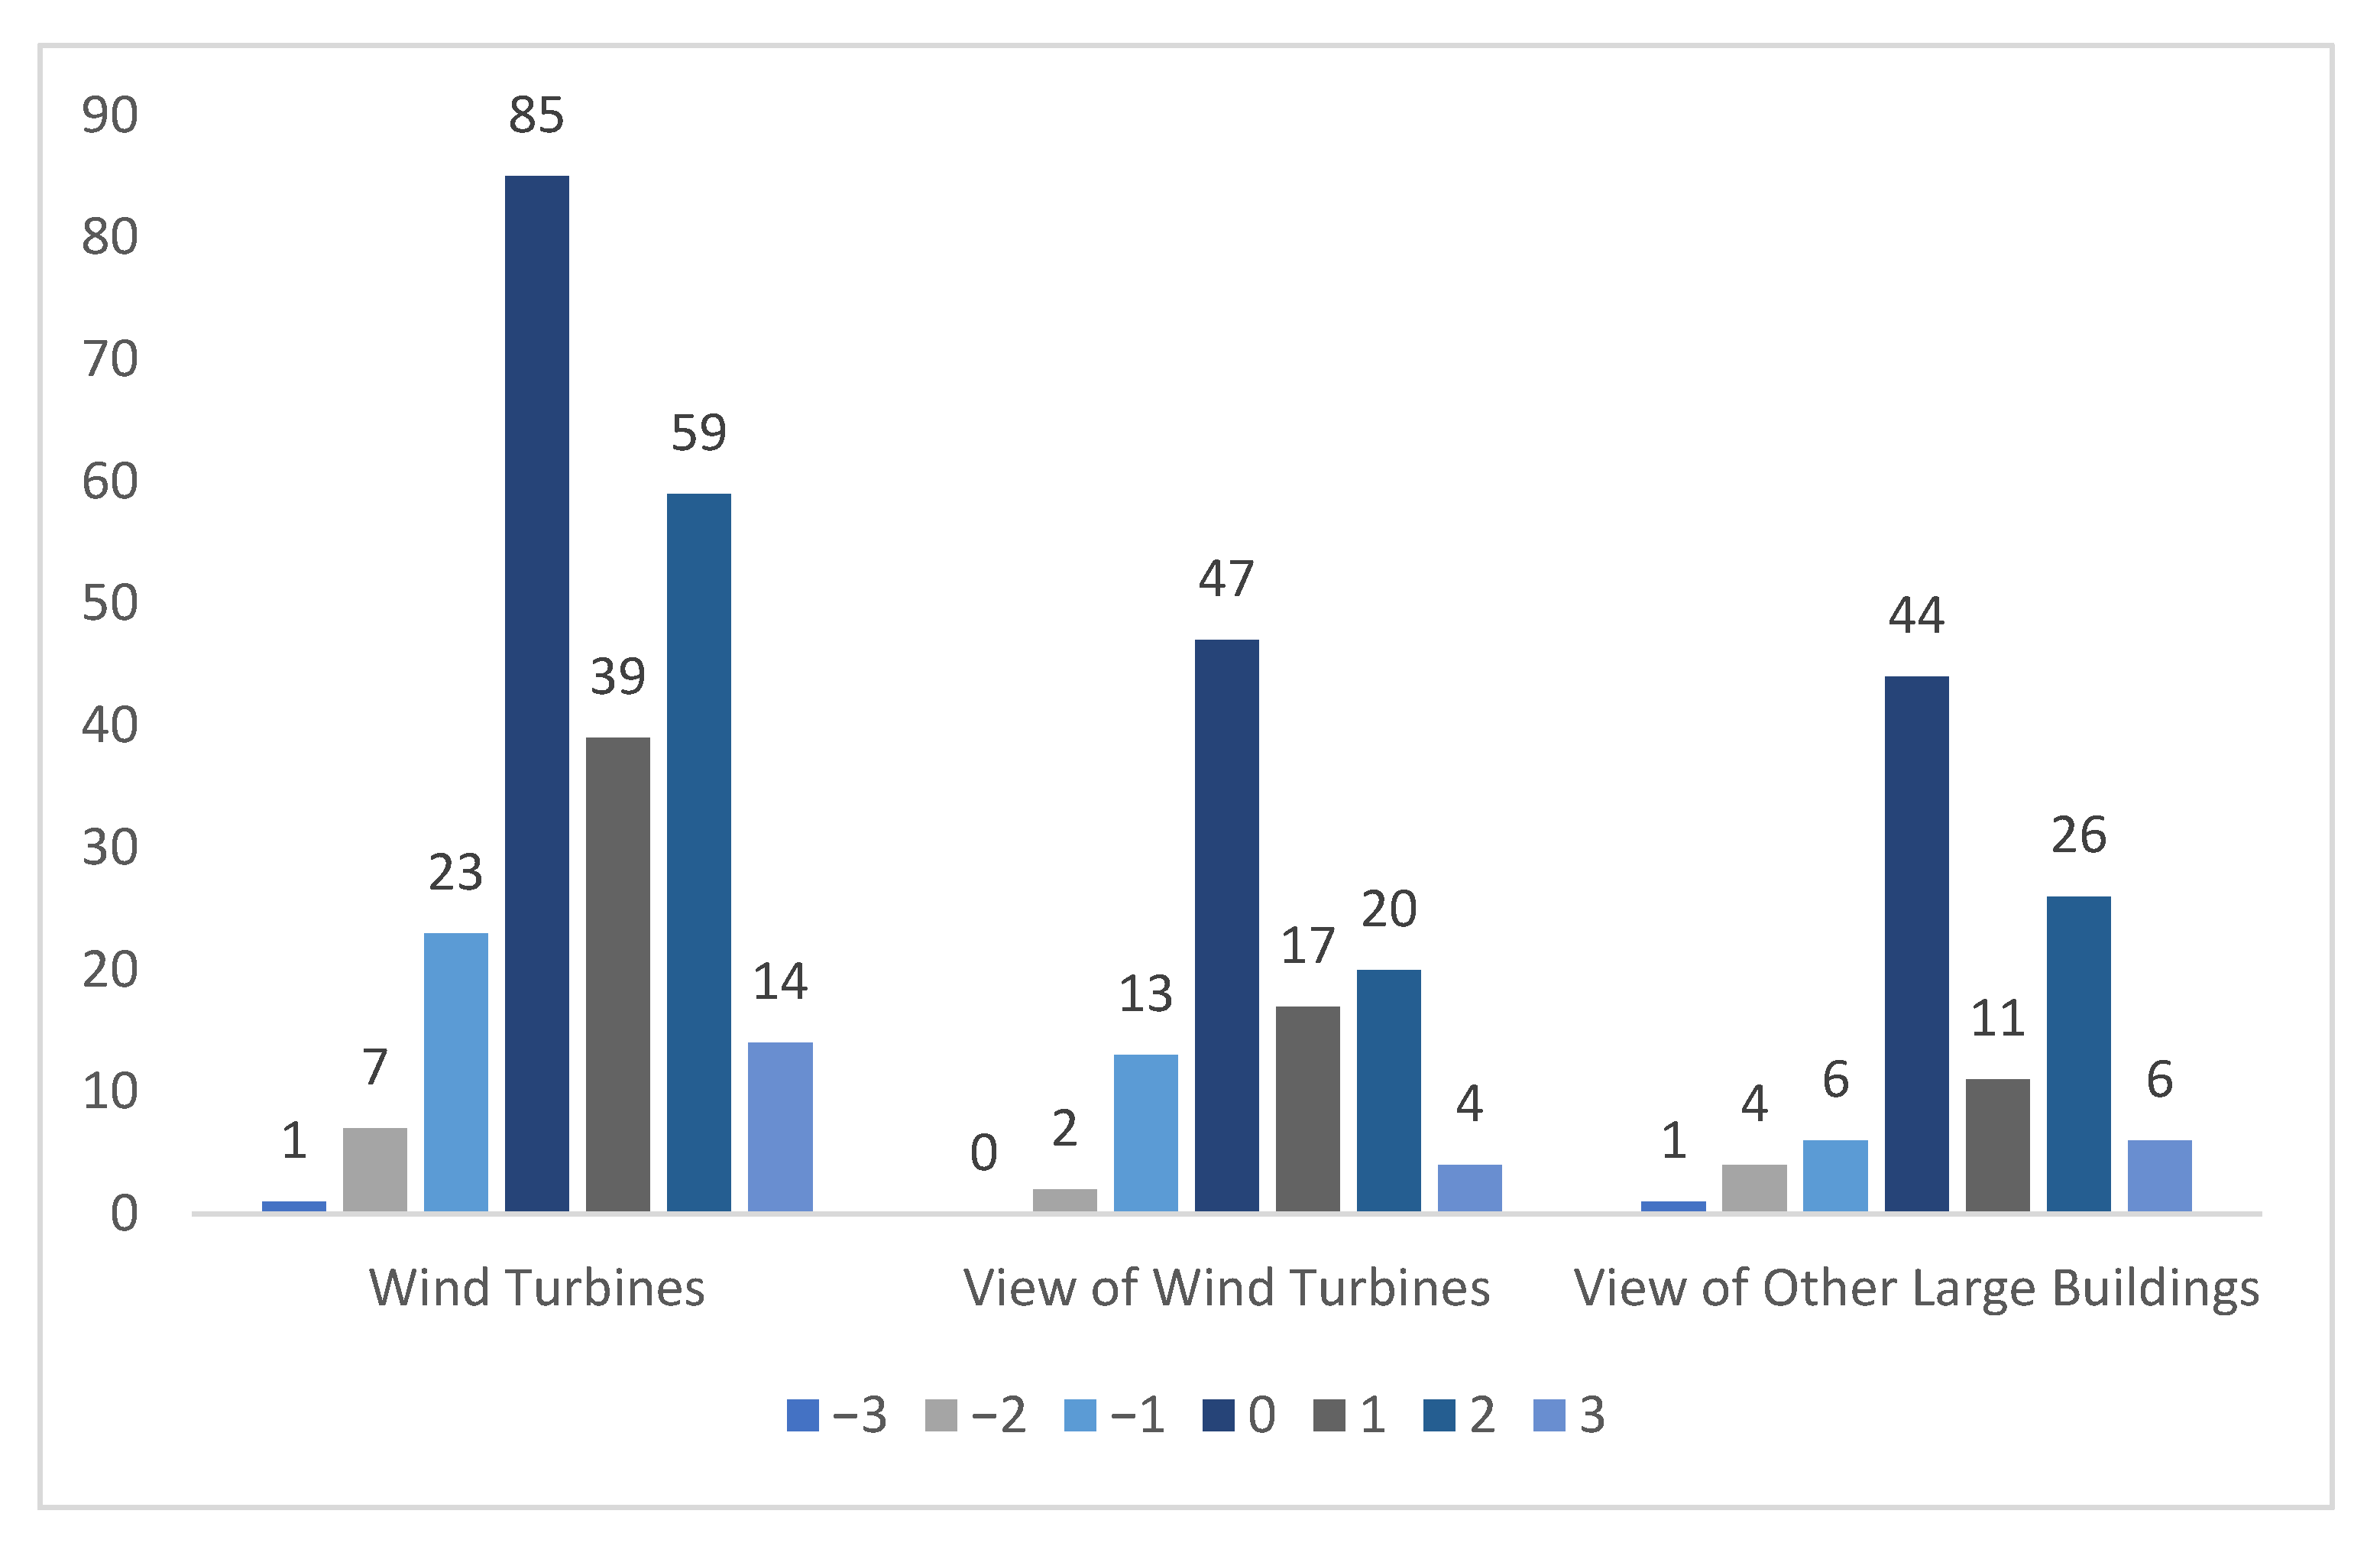
Figure 7 summarizes the evaluation of wind turbines, having a view of them, and having a view of other large buildings. We asked respondents whether they liked or disliked the presence of wind turbines, having a view of wind turbines, and the presence of other buildings. For each question, if respondents were indifferent, they scored it a zero; if they felt positive (1 to 3) or negative (−1 to −3) they would give positive (1 to 3) or negative (−1 to −3) scores. Larger values indicate stronger positive or negative feelings. The results show that the majority of respondents were indifferent toward wind turbines and having a view of wind turbines and other large buildings from their home. Nonetheless, more respondents answered with positive scores.
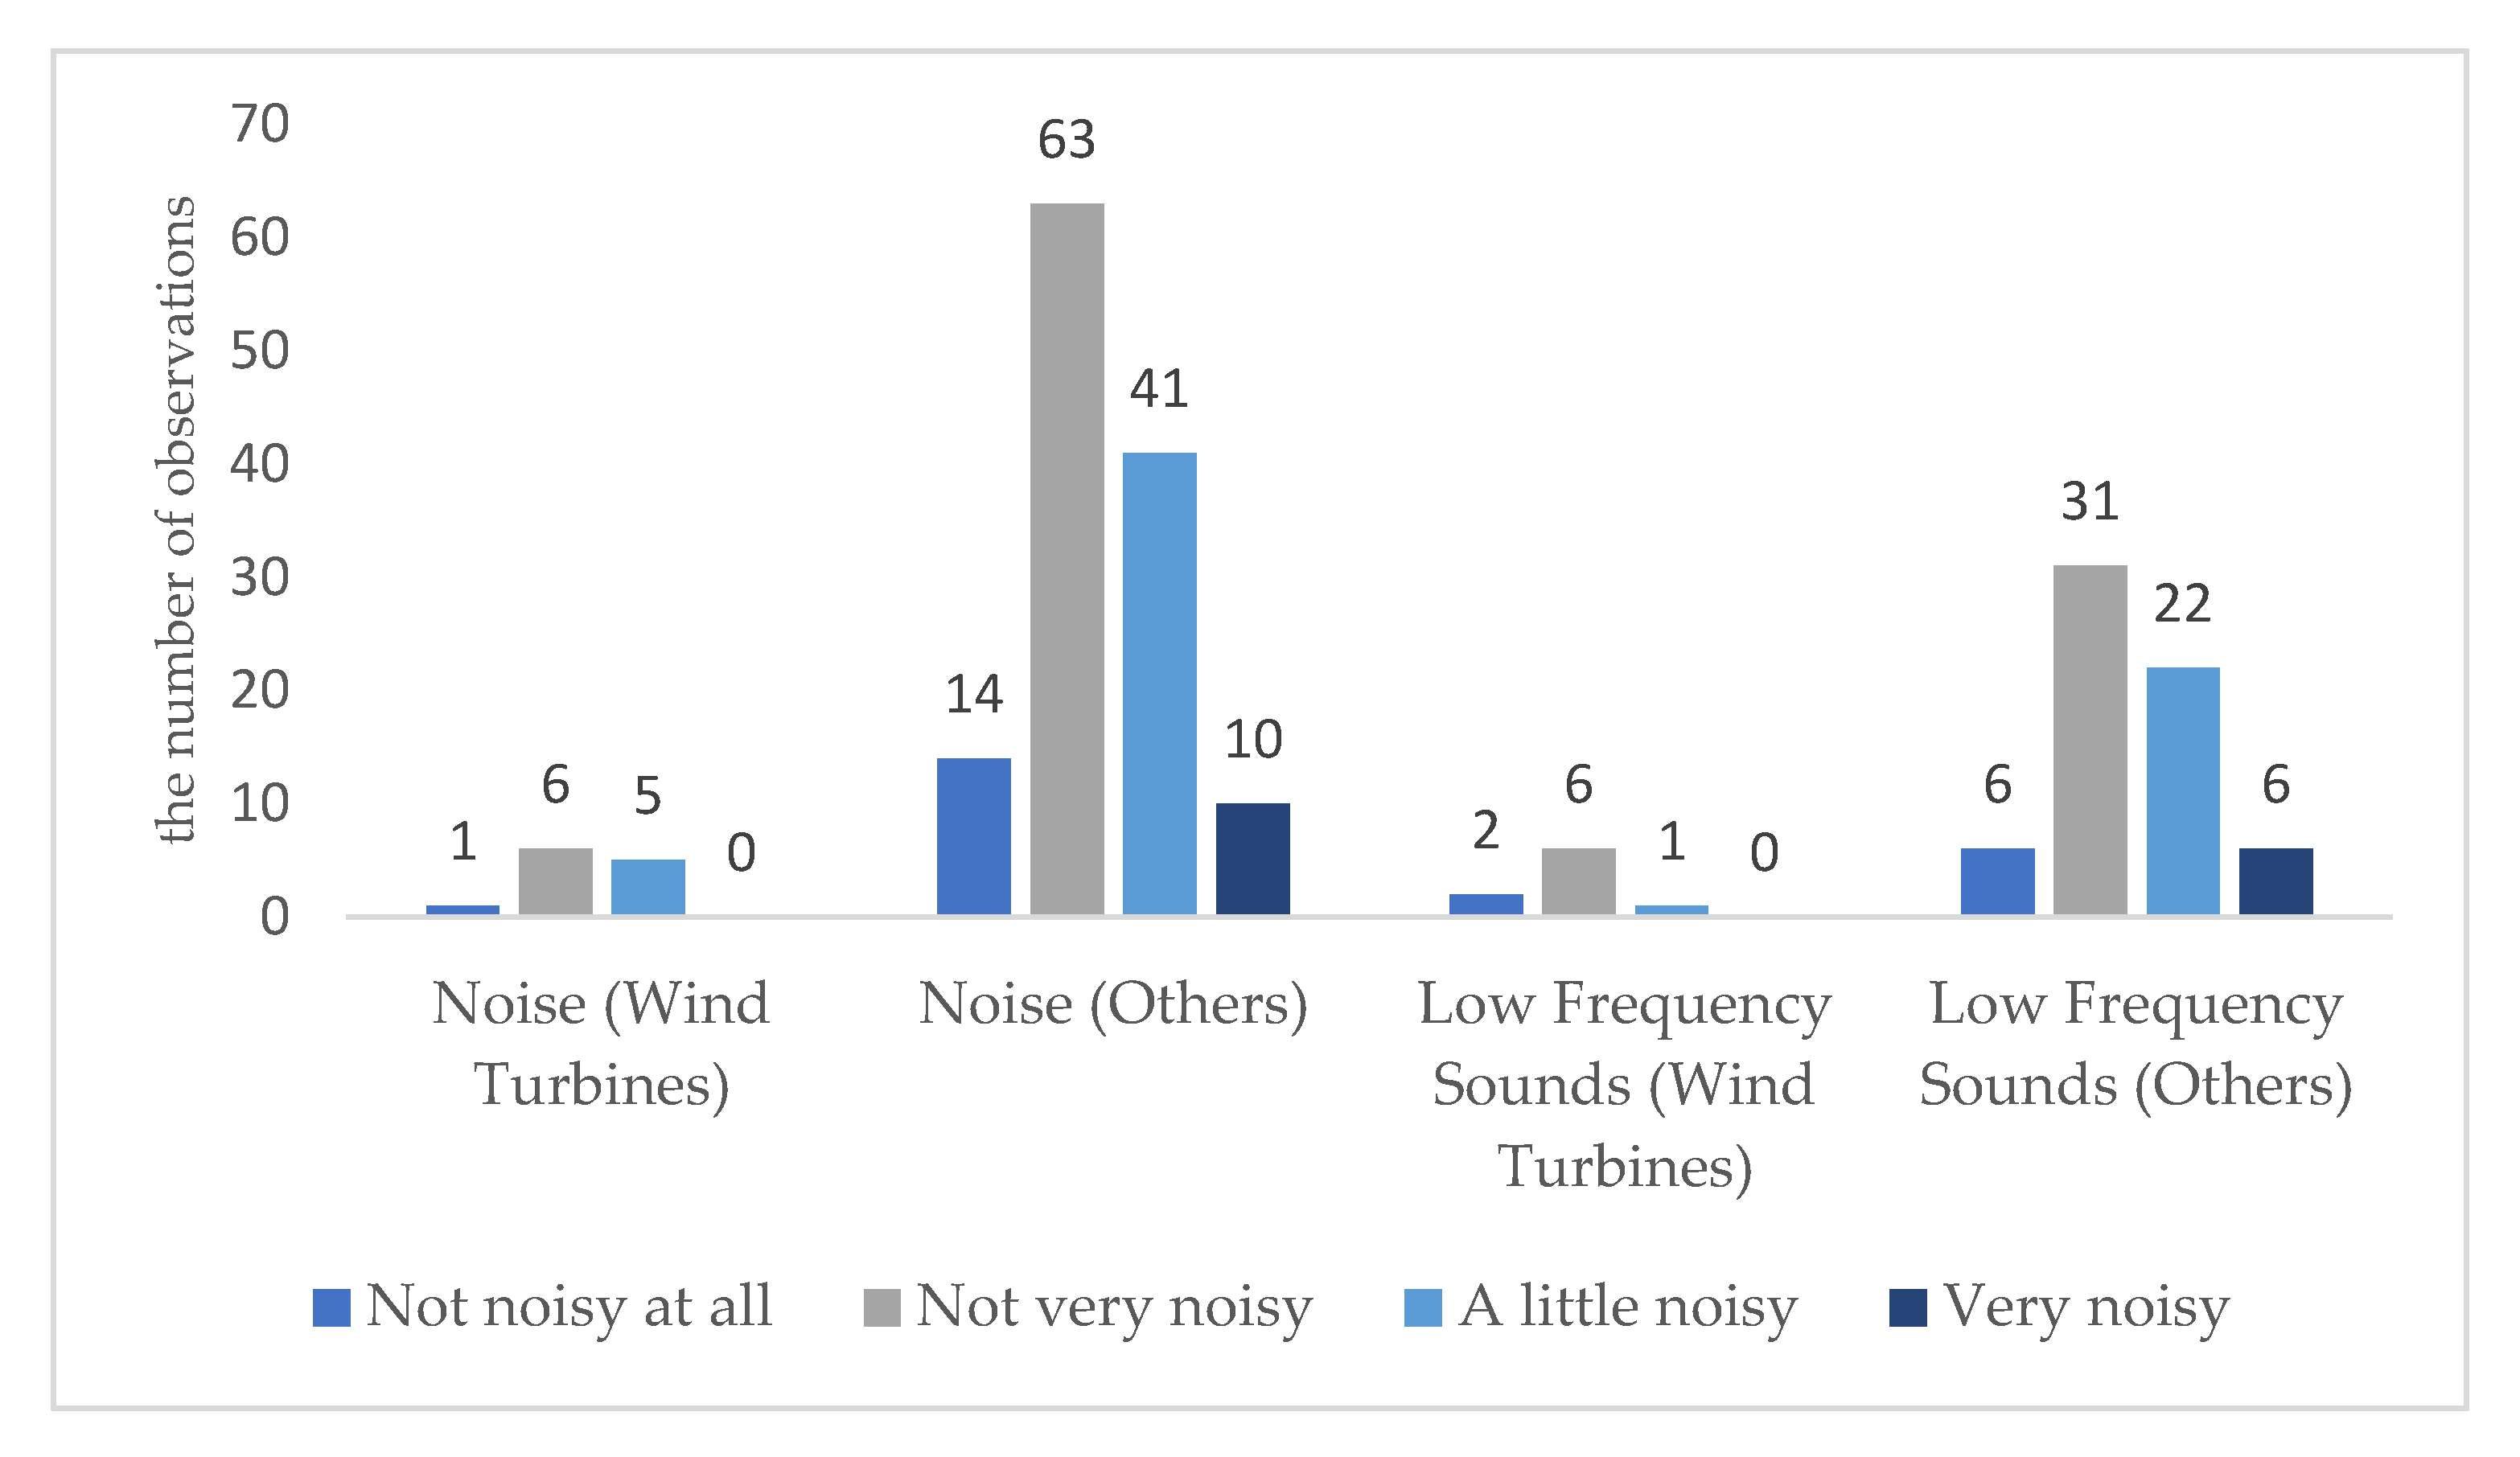
Figure 8 shows the evaluation of noise and low-frequency sounds generated by wind turbines and other large buildings. We asked respondents to rate the noise and infrasound on a 4-point scale from “Not noisy at all” to “Very noisy”. Only respondents who previously reported that they could hear such noise (Figure 6) were asked this question. A few respondents gave negative scores to wind turbines, while a greater number felt uncomfortable with the noise and low-frequency sounds from other large buildings.
Summarizing the results from Figure 6, Figure 7 and Figure 8, approximately half of the respondents could see wind turbines from their homes, and having such a view was not necessarily perceived as negative. Although noise and low-frequency sounds are often associated with wind turbines, the respondents did not perceive them as issues related to wind turbines, but rather to the other buildings considered in our survey. Based on the results of the open-ended questions, many respondents are concerned about sounds from factories and from cars and trucks driving near their homes.
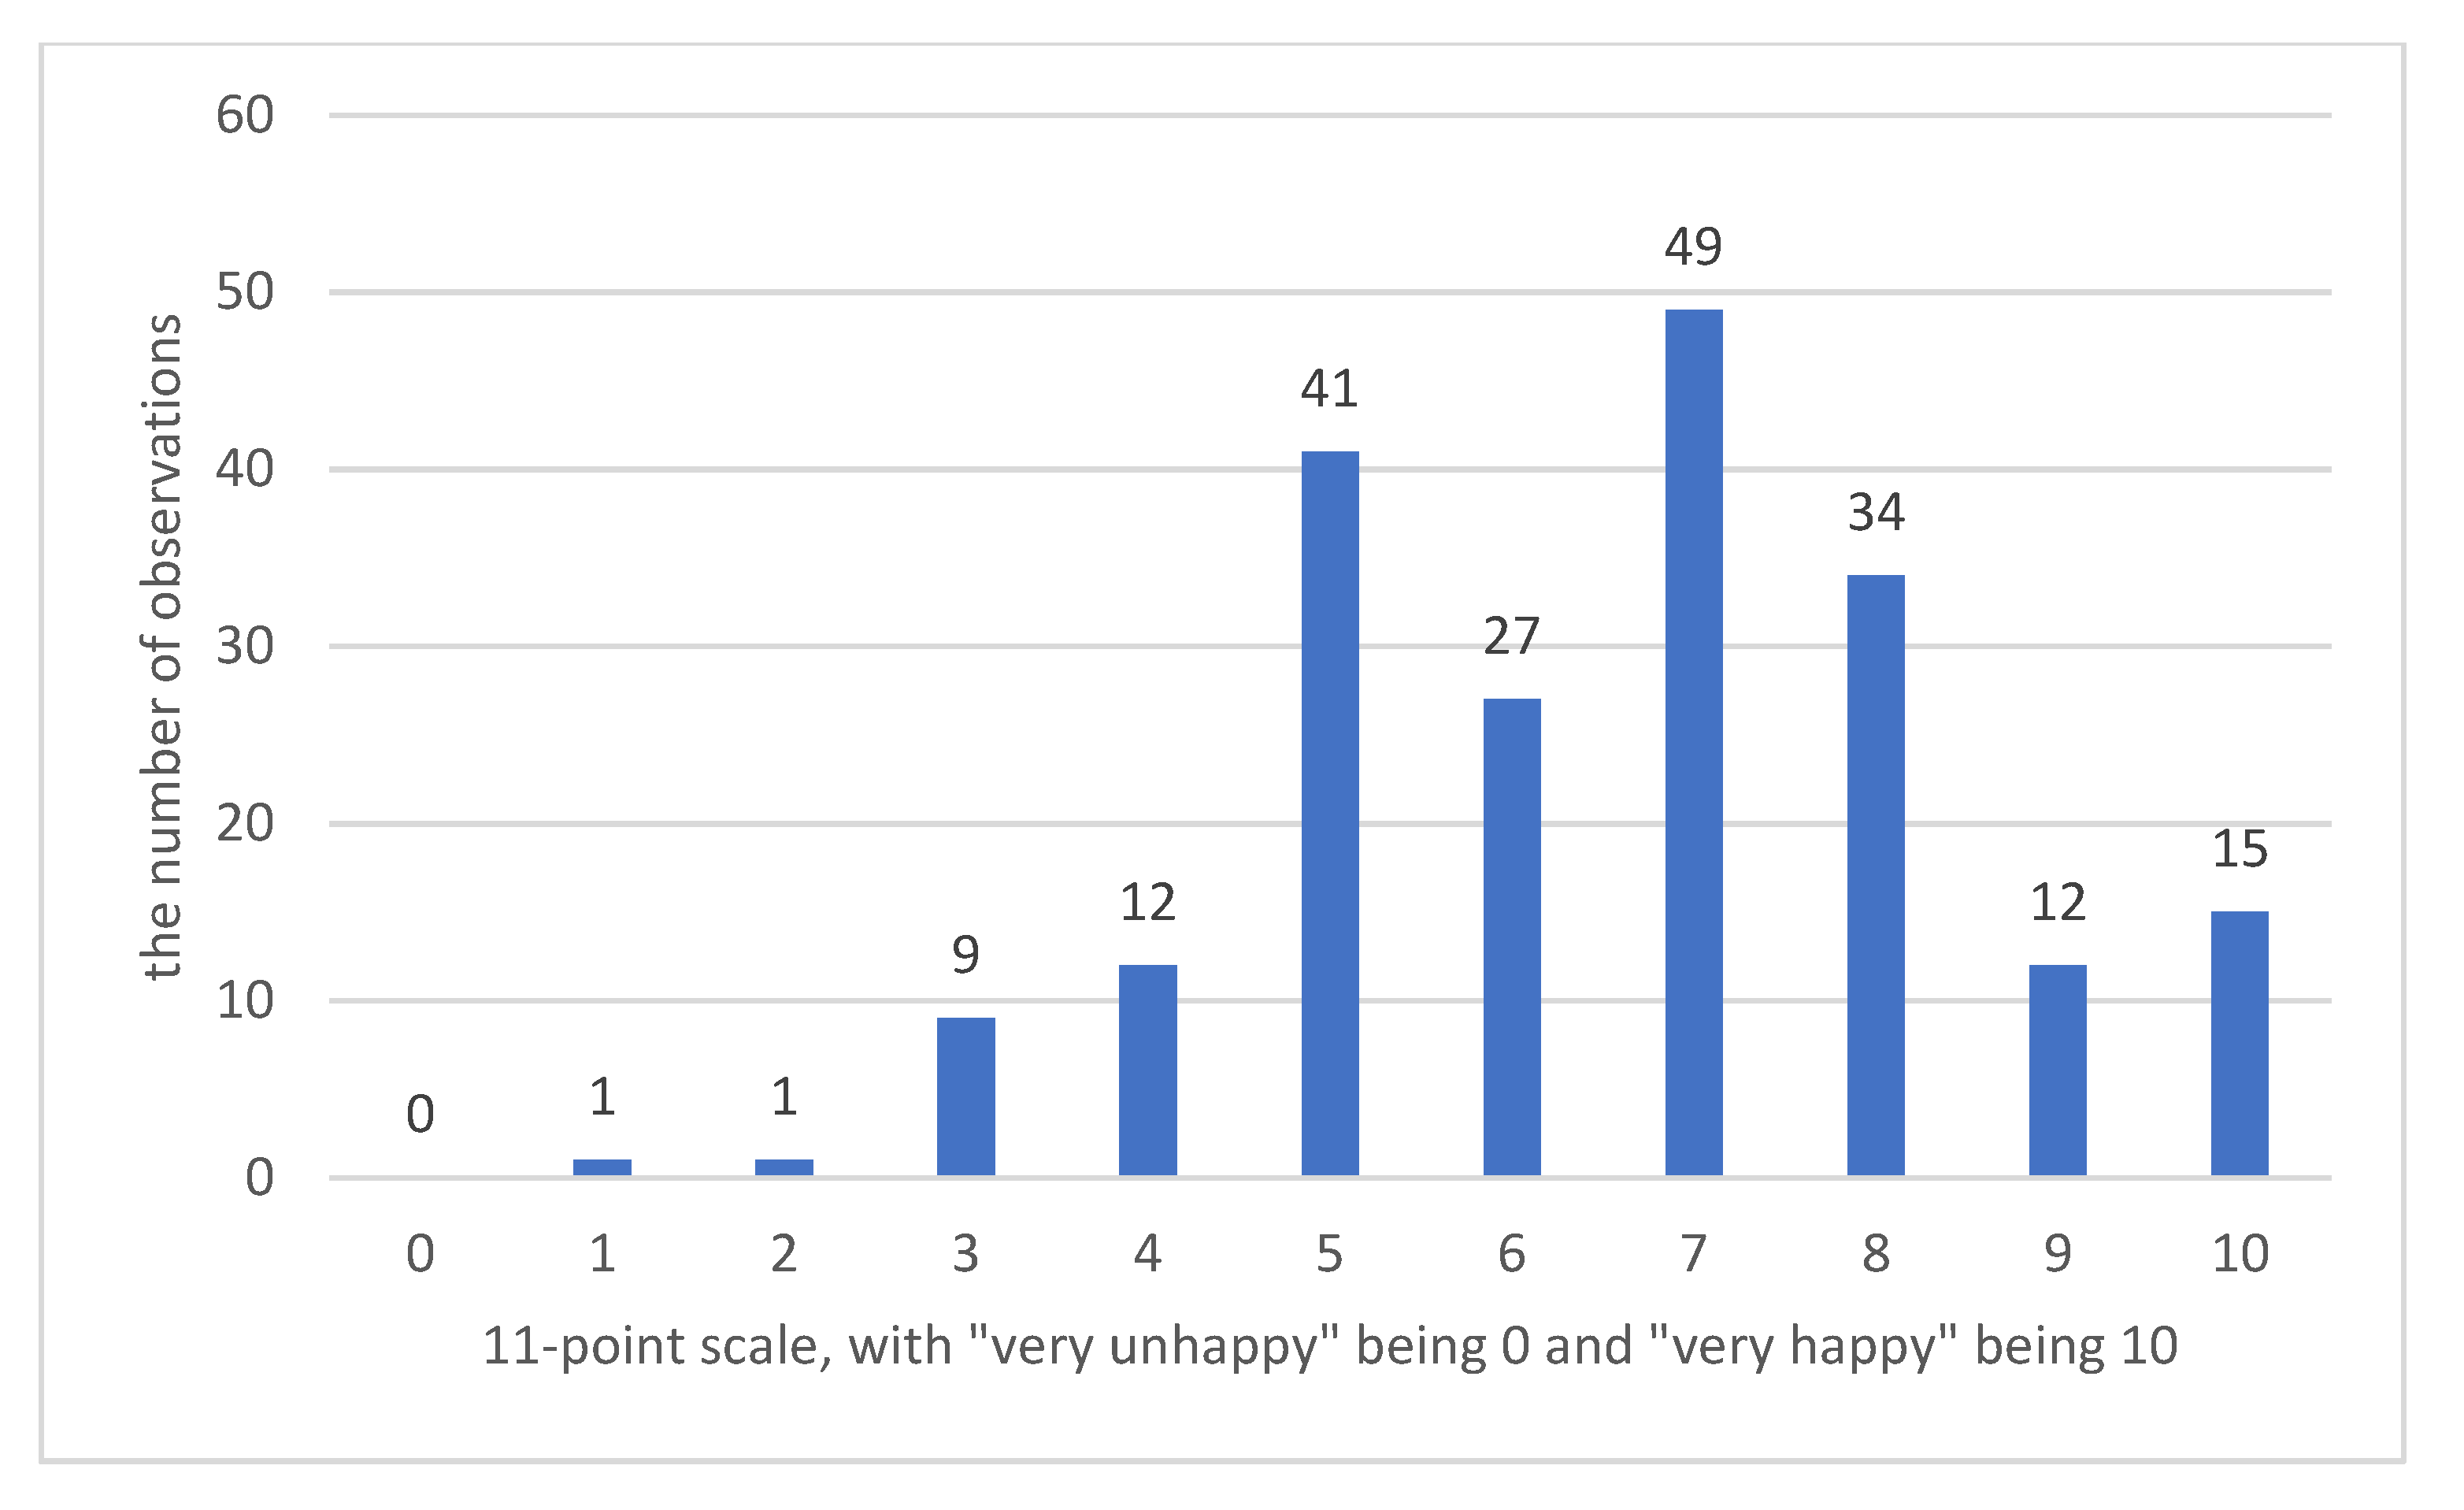
Figure 9 shows the distribution of happiness levels. For subjective well-being, we asked “How happy are you at the moment?” with responses ranging from “Very unhappy” (0) to “Very happy” (10). This was based on a survey method of life satisfaction conducted by the Cabinet Office in Japan [81]. In our survey, the average level of subjective well-being was 6.56, which is higher than the life satisfaction of the 2018 Cabinet Office survey (5.89) [81]. The reason for this may be that the Cabinet Office survey included many young people under the age of 19, while our survey had more elderly people and fewer young people. The level of life satisfaction in Japan is higher among the elderly than the young. However, as for the shape of the distribution, the results were similar to the Cabinet Office survey, with many people giving scores of 5 and 7 or 8.
2.3. Estimation Model
This study examined the relationship between happiness and the presence of wind turbines based on the following estimation model:
The dependent variable represents the well-being of individual i. The independent variable, , is a dummy variable for whether residents can see wind turbines from their houses. is a set of dummy variables based on the distance between wind turbines and respondents’ homes. The base group, within 500 m, indicates that a wind turbine is located within 500 m of their home. We also constructed four dummy variables, each of which is equal to one if people live 500 to 1000 m, 1000 to 1500 m, 1500 to 2000 m, or beyond 2000 m from wind turbines. is a dummy variable that is equal to 1 if respondents can hear the sound generated by wind turbines and other sources in their residential areas and 0 otherwise.
is a vector of individual attributes that includes dummy variables for male gender, employment status, at least a high school education, marital status, annual income, and the duration respondents have been living at their home. It also includes the age variable and its squared term. represents the error term. , , , and are estimation parameters.
Although we cannot observe , which is the true degree of well-being, we asked respondents to rate their subjective degree of well-being on a scale of 0 to 10 by means of a questionnaire. We define as subjective well-being obtained from the questionnaire. Then the relationship between and is as shown in Equation (2):
() is a threshold value that divides , the unobservable well-being level, into 10 levels, and it is also a parameter to be estimated. If we assume that the error term in Equation (1) follows a normal distribution, the equation we should estimate can be written as Equation (3):
This is known as the ordered probit model, and we can estimate the parameters by the maximum likelihood method.
We used three estimation models based on Equation (3). In Models 1 and 2, we used a dummy variable that takes the value of 1 if respondents can see wind turbines from their home; this dummy is used as a proxy for viewi. noisei. is used in Model 2. Table 1 shows the descriptive statistics of the data that we used for estimation. In Model 5, to check the robustness of variables other than the wind turbine information, we removed the wind turbine information variable from Equation (1). Of the initial 229 respondents, we removed those with unclear income information, leaving a sample size of 201.
3. Estimation Results
Estimation Results of Ordered Probit Models
Table 2 presents the results of the ordered probit analysis. Regarding the visibility of wind turbines, the estimation result of Model 1 shows that the dummy variable (View), representing whether people can see wind turbines from their home, is positive and statistically significant at the 10% level. However, it is not significant in Model 2, which has an additional variable representing noise. In terms of distance, the dummy variable indicating a distance of 1000 to 1500 m from wind turbines is positively significant at the 5% level in Models 1 and 2. The dummy variable indicating a distance of more than 2000 m from wind turbines is positively significant at the 5% level in Models 1 and 2. From these results, we find that a certain distance from wind turbines (1000–1500 m or more than 2000 m) may positively affect well-being, but may also positively affect well-being with respect to the view of the wind turbines. We did not find any significant impact of noise on well-being in any model. While Table 1 indicates that more than half of the respondents could hear noise, based on the regression results (Table 2), that does not affect their perceived level of well-being.
Regarding any impact of individual attributes, we observed similar results in all models. Our estimation results suggest that the dummy variable for male gender is negatively related to well-being, while those for employment and marital status are positively related. The coefficient of Ln Age is negative, but its squared term is positive. The results of Ln Age and its squared term show that well-being decreases with age but increases again after a certain age. Regarding annual income, setting the dummy variable for less than JPY 2 million as the base group, the dummy variables for annual income of JPY 4 to 5 million, JPY 5 to 7 million, and JPY 7 to 10 million are significantly positive. The dummy variable for annual income of JPY 10 to 15 million is positive and significant at the 10% level in Model 2 only. However, we find that the dummy variable for income more than JPY 15 million is not related to well-being. Finally, respondents who have lived in their current homes for 10 to 20 years or 20 to 30 years have higher well-being than those who have lived in their homes for less than 10 years.
4. Discussion
4.1. Discussion
Contrary to expectations, our study finds that the existence of wind turbines does not negatively affect the well-being of residents, because there were few negative evaluations of noise and low-frequency sounds. Moreover, noises from sources other than wind turbines do not affect well-being, suggesting that such noises in Chōshi may be considered to be at an acceptable level. There are two possible explanations. First, it is conceivable that the noise level in Chōshi is generally acceptable to the residents. Second, although there are noises, including those from wind turbines in Chōshi, residents are already used to their environment, hence their well-being may remain unaffected. To clarify this point, it is necessary to analyze the data using a quantitative noise level measure.
We also find that a view of wind turbines is positively related to well-being. We suggest that positive evaluations of wind turbines, as shown in Figure 7, could contribute to the estimation results. Moreover, the respondents did not negatively evaluate other large facilities.
Based on these results, we think that wind turbines could operate without having a negative impact on people in areas with some pre-existing or low-frequency noise. However, we need to pay more attention to the noise of wind turbines and health hazards. The relationship between noise or annoyance from wind turbines and health hazards has been noted [82]. On the other hand, the health hazards of noise tolerated by residents are uncertain. In the future, we will need to analyze the relationship between noise, health hazards, and subjective well-being in more detail.
4.2. Research Limitations
We will discuss the limitations of our study. First, there is the issue of sample size. Our study is based on a limited sample. Therefore, we need to keep in mind the possibility of bias in our analysis results.
Second, there is a possible problem of endogeneity. For example, some of the residents originally had a positive impression of wind turbines. An analysis that does not control for these factors could result in biases in the estimation results. While we did not address endogeneity in our model this time, we believe that an additional analysis considering endogeneity is needed in the future.
Third, there is the measurement problem of visible wind turbines. In this study, we were not able to identify whether the wind turbines visible to respondents are nearby or distant. For example, in Chōshi City, there are places where nearby wind turbines cannot be seen from houses because they are blocked by forest. In such a situation, the view of wind turbines that affects respondents positively may not be invisible wind turbines near the house, but those that are visible far from the house. In order to solve this problem in the future, it will be necessary to measure the distance between houses and wind turbines that are actually visible.
Fourth, there is the problem of missing information on windmills. There are currently wind turbines in Chōshi with sizes ranging from 1500 to 2400 kW. Our analysis is based on the assumption that all wind turbines in Chōshi are the same size. However, the impact on people may vary greatly depending on the size of the turbine. We also did not analyze the number of wind turbines in detail, but it is also possible that the impact on people may change depending on the number of wind turbines they can see. Therefore, further analysis considering these factors is recommended.
4.3. Future Recommendations
First, we need to consider a more detailed classification of factors that can be negative externalities of wind turbines. In this study, we focused on landscape and noise as externalities; however, there are other possible problems such as flicker and shadows depending on the time of day. In addition, the shape and appearance of wind turbines could also be considered for analysis. To sum up, in order to examine people’s acceptance of wind turbines, these types of externalities of wind turbines should be included in the estimation models.
Second, additional health hazards caused by the externalities of wind turbines can be investigated. For example, there are many studies on wind turbine noise and health hazards, but the relationship between acceptable levels of noise and health hazards is uncertain [81]. We believe that an analysis of health hazards is important to improve the cost–benefit analysis of wind turbines.
Third, we could analyze possible changes in preferences over time. This would require an analysis using panel data such as the one used by Krekel and Zerrahn [55]. With cross-sectional data, we cannot analyze effects that change over time. Therefore, we believe that it is very important to investigate how the negative externalities of wind turbines that decrease over time change over a longer period of time.
Fourth, an analysis of wind turbines as a tourism resource is desirable. In order to comprehensively consider sustainable local economic development, it is important to discuss wind turbines not only as a region-specific energy resource, but also as a tourism resource. In order to do so, we need to analyze wind turbines not in terms of negative externalities that destroy the existing natural landscape, but as entities that complement the landscape and make it more valuable.
Fifth, we are considering the use of cross terms. Initially, we analyzed the combined effect of distance to and view of wind turbines to conduct a more detailed analysis of the influence of landscape on well-being. By using the cross term between distance and view, we expected to test whether people who can see wind turbines from a certain distance and those who cannot have different levels of happiness. However, as mentioned in the research limitations, we were not able to do a detailed analysis due to the small sample size. For a future study, we could analyze the distance at which the view of wind turbines affects the level of well-being by using a larger sample.
Sixth, factors other than wind turbines near houses could be further investigated. From the questionnaire survey, we found that there are environmental factors that may affect people more than wind turbines. However, we were not able to use them for the ordered probit analysis in this study. We could analyze the effects of wind turbines more precisely by controlling the effects of other buildings and noise around houses.
Seventh, it is important to analyze attachment to the land and well-being. In the present study, our analysis showed that the number of years of residence increased the level of well-being. The length of residence may indicate attachment to the land [83]. Residents who are attached to the land where wind turbines exist may have a higher level of well-being due to the view of the turbines. On the other hand, residents who are attached to the landscape before the construction of wind turbines may have a lower level of well-being due to the turbines. We need to conduct an analysis that takes into account the landscape of wind turbines, the level of well-being, and attachment to the region at the same time.
5. Conclusions
This study investigated the externalities of wind turbines, which is an essential procedure for developing a framework to reach a consensus among local residents. Using a subjective well-being index to measure respondents’ well-being, we examined how wind turbines affect well-being. We collected data for the analysis through questionnaires distributed via postal mail to randomly selected residents in Chōshi City in Japan.
Contrary to expectations, our survey results suggest a mixed assessment of the view of wind turbines. Additionally, noise and low-frequency sounds, often considered externalities of wind turbines, do not attract much attention from respondents.
The regression analysis suggests that the view of wind turbines positively affects respondents’ well-being. In particular, there is a large positive influence on people who can see wind turbines from a distance of 1500 m or less. On the other hand, the impact of noise on happiness could not be shown in this analysis.
Bearing these estimation results in mind, we recommend that the acceptability of wind turbines at planned construction sites should be assessed. In particular, preferences with regard to potential factors of conflict, such as noise, should be carefully examined. This survey reveals that our respondents did not consider noise or low-frequency sounds to be a serious issue.
Initially, we expected that there would be some negative externalities in areas where wind turbines had been installed for a long time. However, the results of our analysis show that the landscape and noise of wind turbines may not have a negative impact on people’s well-being in Chōshi City, which was selected as our study site. Most of the existing studies on negative externalities of wind turbines were conducted in areas where clear environmental changes were expected due to the introduction of the turbines. However, in order to recommend the construction of wind turbines, it is necessary to investigate in more detail their externalities not only in areas where conflicts occur, but also in areas where turbines have been in operation for a long time. We suggest analyzing in more detail what is accepted by people in areas where the introduction of wind turbines is successful, and what factors have a positive impact on people.
Furthermore, if wind turbines can increase tourist satisfaction, municipal governments might be able to develop them as tourist attractions. This study suggests that it is important to consider such externalities for residents when developing construction plans for wind turbines.
One limitation of this study is that our survey targeted an area where wind turbines have been in place for several years. Krekel and Zerrahn [55] suggest that the negative impacts of wind turbines on well-being decrease with time. While this may apply to Chōshi City, we cannot effectively conclude that this is the case, since we did not conduct the survey immediately after the wind turbines were built. In addition, we focused on analyzing the information about wind turbines separately with regard to visual and noise perception and distance, and we used only cross-sectional data for analysis. However, it is possible that people’s subjective evaluation of their visual and auditory perceptions of wind turbines may change over time. In the future, we will need to conduct a panel data analysis to account for changes over time.
Author Contributions
Conceptualization, Y.K.; methodology, Y.K.; validation, Y.K., T.H.A. and M.N.; formal analysis, Y.K.; investigation, Y.K., T.H.A. and M.N.; writing—original draft preparation, Y.K.; writing—review and editing, T.H.A. and M.N.; visualization, Y.K.; project administration, Y.K.; funding acquisition, T.H.A. All authors have read and agreed to the published version of the manuscript.
Funding
This study was financially supported by the Asahi Glass Foundation and the Research Institute for Environmental Economics and Management (RIEEM) of Waseda University. Toshi Arimura is grateful for the financial support from the Environment Research and Technology Development Fund (JPMEERF20202008) of the Environmental Restoration and Conservation Agency.
Data Availability Statement
The datasets used and/or analyzed during the current study are available from the corresponding author upon reasonable request.
Acknowledgments
The authors would like to thank all the reviewers and the journal edi-tors for their insightful comments and suggestions toward improving our manuscript. The authors acknowledge the helpful comments made by Tetsuya Tsurumi and the seminar participants at the Society for Environmental Economics and Policy Studies (SEEPS) 2017 Annual Conference (September 2017, Japan).
Conflicts of Interest
The authors declare that they have no conflict of interest.
References
- Wang, J.; Zong, Y.; You, S.; Træholt, C. A review of Danish integrated multi-energy system flexibility options for high wind power penetration. Clean Energy 2017, 1, 23–35. [Google Scholar] [CrossRef] [Green Version]
- Molina-Moreno, V.; Núñez-Cacho, U.P.; Cortés-García, F.J.; Peña-García, A. The use of led technology and biomass to power public lighting in a local context: The case of Baeza (Spain). Energies 2018, 11, 1783. [Google Scholar] [CrossRef] [Green Version]
- Ortega, C.; Younes, A.; Severy, M.; Chamberlin, C.; Jacobson, A. Resource and Load Compatibility Assessment of Wind Energy Offshore of Humboldt County, California. Energies 2020, 13, 5707. [Google Scholar] [CrossRef]
- Seyedhashemi, H.; Hingray, B.; Lavaysse, C.; Chamarande, T. The Impact of Low-Resource Periods on the Reliability of Wind Power Systems for Rural Electrification in Africa. Energies 2021, 14, 2978. [Google Scholar] [CrossRef]
- Japan Wind Power Association. Available online: https://www.meti.go.jp/shingikai/enecho/denryoku_gas/saisei_kano/pdf/028_05_00.pdf (accessed on 4 June 2021).
- Ministry of the Environment. Report of the Study Group on the Basic Concept of Environmental Impact Assessment for Wind Power Generation Facilities June 2011 [Translated from Japanese]. Available online: https://www.env.go.jp/press/files/jp/17727.pdf (accessed on 9 April 2021).
- Azechi, K.; Hori, S.; Nishikizawa, S.; Murayama, T. Influential Factors Relating to Environmental Conflict Occurrence During the Planning Stage for Wind Farm Projects in Japan. J. Jpn. Soc. Energy Resour. 2013, 35, 11–22. [Google Scholar]
- Azechi, K.; Nishikizawa, S.; Harashina, S. Empirical Analysis of Factors for Conflict Resolution at the Project Stage of Wind Farm Developments. Plan. Public Manag. 2014, 37, 54–64. [Google Scholar]
- Ministry of the Environment. Available online: https://www.env.go.jp/earth/report/h23-03/chpt4.pdf (accessed on 9 April 2021).
- Japan Wind Power Association (JWPA). Wind Power Installed in Japan (as of the End of 2020; Revised March 15) [Translated from Japanese]. Available online: http://jwpa.jp/pdf/dounyuujisseki2020graph.pdf (accessed on 9 April 2021).
- WindEurope. Wind Energy in Europe 2020 Statistics and the Outlook for 2021–2025. Available online: https://s1.eestatic.com/2021/02/24/actualidad/210224_windeurope_combined_2020_stats.pdf (accessed on 9 April 2021).
- European Wind Energy Association asbl/vzw (EWEA). WindBarriers Administrative and Grid Access Barriers to Wind Power July 2010. Available online: http://www.ewea.org/fileadmin/files/library/publications/reports/WindBarriers_report.pdf (accessed on 9 April 2021).
- IEA Annual Report 2009; IEA Wind: Paris, France, 2010; Available online: https://community.ieawind.org/HigherLogic/System/DownloadDocumentFile.ashx?DocumentFileKey=c3268c8d-809e-c9fe-a94b-e6a0d142e516&forceDialog=0 (accessed on 9 April 2021).
- Zerrahn, A. Wind power and externalities. Ecol. Econ. 2017, 141, 245–260. [Google Scholar] [CrossRef]
- Devine-Wright, P. Beyond NIMBYism: Towards an integrated framework for understanding public perceptions of wind energy. Wind Energy 2005, 8, 125–139. [Google Scholar] [CrossRef]
- Van Rensburg, T.M.; Kelley, H.; Jeserich, N. What influences the probability of wind farm planning approval: Evidence from Ireland. Ecol. Econ. 2015, 111, 12–22. [Google Scholar] [CrossRef]
- Mattmann, M.; Logar, I.; Brouwer, R. Wind power externalities: A meta-analysis. Ecol. Econ. 2016, 127, 23–36. [Google Scholar] [CrossRef] [Green Version]
- Huber, N.; Hergert, R.; Price, B.; Zäch, C.; Hersperger, A.M.; Pütz, M.; Kienast, F.; Bolliger, J. Renewable energy sources: Conflicts and opportunities in a changing landscape. Reg. Environ. Chang. 2017, 17, 1241–1255. [Google Scholar] [CrossRef]
- Knopper, L.D.; Ollson, C.A. Health effects and wind turbines: A review of the literature. Environ. Health 2011, 10, 78. [Google Scholar] [CrossRef] [Green Version]
- Bakker, R.H.; Pedersen, E.; van den Berg, G.P.; Stewart, R.E.; Lok, W.; Bouma, J. Impact of wind turbine sound on annoyance, self-reported sleep disturbance, and psychological distress. Sci. Total Environ. 2012, 425, 42–51. [Google Scholar] [CrossRef] [Green Version]
- McCunney, R.J.; Mundt, K.A.; Colby, W.D.; Dobie, R.; Kaliski, K.; Blais, M. Wind turbines and health: A critical review of the scientific literature. J. Occup. Environ. Med. 2014, 56, e108–e130. [Google Scholar] [CrossRef]
- Schmidt, J.H.; Klokker, M. Health effects related to wind turbine noise exposure: A systematic review. PLoS ONE 2014, 9, e114183. [Google Scholar] [CrossRef] [PubMed] [Green Version]
- Onakpoya, I.J.; O’Sullivan, J.; Thompson, M.J.; Heneghan, C.J. The effect of wind turbine noise on sleep and quality of life: A systematic review and meta-analysis of observational studies. Environ. Int. 2015, 82, 1–9. [Google Scholar] [CrossRef]
- Nunneri, C.; Lenhart, H.J.; Burkhard, B.; Windhorst, W. Ecological risk as a tool for evaluating the effects of offshore wind farm construction in the North Sea. Reg. Environ. Chang. 2018, 8, 31–43. [Google Scholar] [CrossRef]
- Pearce-Higgins, J.W.; Stephen, L.; Douse, A.; Langston, R.H.W. Greater impacts of wind farms on bird populations during construction than subsequent operation: Results of a multi-site and multi-species analysis. J. Appl. Ecol. 2012, 49, 386–394. [Google Scholar] [CrossRef]
- Northrup, J.M.; Wittemyer, G. Characterising the impacts of emerging energy development on wildlife, with an eye towards mitigation. Ecol. Lett. 2013, 16, 112–125. [Google Scholar] [CrossRef]
- May, R.; Reitan, O.; Bevanger, K.; Lorentsen, S.H.; Nygård, T. Mitigating wind-turbine induced avian mortality: Sensory, aerodynamic and cognitive constraints and options. Renew. Sustain. Energy Rev. 2015, 42, 170–181. [Google Scholar] [CrossRef]
- Schuster, E.; Bulling, L.; Köppel, J. Consolidating the state of knowledge: A synoptical review of wind energy’s wildlife effects. Environ. Manag. 2015, 56, 300–331. [Google Scholar] [CrossRef] [Green Version]
- Wolsink, M. Wind power implementation: The nature of public attitudes: Equity and fairness instead of “backyard motives. Renew. Sustain. Energy Rev. 2007, 11, 1188–1207. [Google Scholar] [CrossRef]
- Jensen, C.U.; Panduro, T.E.; Lundhede, T.H. The vindication of Don Quixote: The impact of noise and visual pollution from wind turbines. Land Econ. 2014, 90, 668–682. [Google Scholar] [CrossRef]
- Ladenburg, J. Attitudes towards offshore wind farms—The role of beach visits on attitude and attitude and demographic relations. Energy Policy 2010, 38, 1297–1304. [Google Scholar] [CrossRef]
- Broekel, T.; Alfken, C. Gone with the wind? The impact of wind turbines on tourism demand. Energy Policy 2015, 86, 506–519. [Google Scholar] [CrossRef] [Green Version]
- Dalton, G.J.; Lockington, D.A.; Baldock, T.E. A survey of tourist attitudes to renewable energy supply in Australian hotel accommodation. Renew. Energy 2008, 33, 2174–2185. [Google Scholar] [CrossRef]
- Lilley, M.B.; Firestone, J.; Kempton, W. The effect of wind power installations on coastal tourism. Energies 2010, 3, 1–22. [Google Scholar] [CrossRef] [Green Version]
- Frantál, B.; Kunc, J. Wind turbines in tourism landscapes: Czech experience. Ann. Tour. Res. 2011, 38, 499–519. [Google Scholar] [CrossRef]
- Landry, C.E.; Allen, T.; Cherry, T.; Whitehead, J.C. Wind turbines and coastal recreation demand. Resour. Energy Econ. 2012, 34, 93–111. [Google Scholar] [CrossRef]
- Nordman, E.; Mutinda, J. Biodiversity and wind energy in Kenya: Revealing landscape and wind turbine perceptions in the world’s wildlife capital. Energy Res. Soc. Sci. 2016, 19, 108–118. [Google Scholar] [CrossRef]
- Groothuis, P.A.; Groothuis, J.D.; Whitehead, J.C. Green vs. green: Measuring the compensation required to site electrical generation windmills in a viewshed. Energy Policy 2008, 36, 1545–1550. [Google Scholar] [CrossRef] [Green Version]
- Jones, C.R.; Eiser, J.R. Understanding ‘local’ opposition to wind development in the UK: How big is a backyard? Energy Policy 2010, 38, 3106–3117. [Google Scholar] [CrossRef] [Green Version]
- Meyerhoff, J.; Ohl, C.; Hartje, V. Landscape externalities from onshore wind power. Energy Policy 2010, 38, 82–92. [Google Scholar] [CrossRef]
- Borchers, A.M.; Duke, J.M.; Parsons, G.R. Does willingness to pay for green energy differ by source? Energy Policy 2007, 35, 3327–3334. [Google Scholar] [CrossRef]
- Ma, C.; Rogers, A.A.; Kragt, M.E.; Zhang, F.; Polyakov, M.; Gibson, F.; Chalak, M.; Pandit, R.; Tapsuwan, S. Consumers’ willingness to pay for renewable energy: A meta-regression analysis. Resour. Energy Econ. 2015, 42, 93–109. [Google Scholar] [CrossRef] [Green Version]
- Soon, J.J.; Ahmad, S.A. Willingly or grudgingly? A meta-analysis on the willingness-to-pay for renewable energy use. Renew. Sustain. Energy Rev. 2015, 44, 877–887. [Google Scholar] [CrossRef]
- Sundt, S.; Rehdanz, K. Consumers’ willingness to pay for green electricity: A meta-analysis of the literature. Energy Econ. 2015, 51, 1–8. [Google Scholar] [CrossRef] [Green Version]
- Englin, J.; Cameron, T.A. Augmenting travel cost models with contingent behavior data. Environ. Resour. Econ. 1996, 7, 133–147. [Google Scholar] [CrossRef]
- Trice, A.H.; Wood, S.E. Measurement of Recreational Benefits. Land Econ. 1958, 34, 195–207. [Google Scholar] [CrossRef]
- Rosen, S. Hedonic prices and implicit markets: Product differentiation in pure competition. J. Political Econ. 1974, 82, 34–55. [Google Scholar] [CrossRef]
- Day, B.; Bateman, I.; Lake, I. Beyond implicit prices: Recovering theoretically consistent and transferable values for noise avoidance from a hedonic property price model. Environ. Resour. Econ. 2007, 37, 211–232. [Google Scholar] [CrossRef]
- Sims, S.; Dent, P. Property stigma: Wind farms are just the latest fashion. J. Prop. Invest. Financ. 2007, 25, 626–651. [Google Scholar] [CrossRef]
- Heintzelman, M.D.; Tuttle, C.M. Values in the wind: A hedonic analysis of wind power facilities. Land Econ. 2012, 88, 571–588. [Google Scholar] [CrossRef]
- Dröes, M.I.; Koster, H.R.A. Renewable energy and negative externalities: The effect of wind turbines on house prices. J. Urban Econ. 2016, 96, 121–141. [Google Scholar] [CrossRef] [Green Version]
- Sunak, Y.; Madlener, R. The impact of wind farm visibility on property values: A spatial difference-in-differences analysis. Energy Econ. 2016, 55, 79–91. [Google Scholar] [CrossRef]
- Gibbons, S. Gone with the wind: Valuing the visual impacts of wind turbines through house prices. J. Environ. Econ. Manag. 2015, 72, 177–196. [Google Scholar] [CrossRef] [Green Version]
- Villamagna, A.; Giesecke, C. Adapting human well-being frameworks for ecosystem service assessments across diverse landscapes. Ecol. Soc. 2014, 19, 11. [Google Scholar] [CrossRef] [Green Version]
- Horcea-Milcu, A.I.; Leventon, J.; Hanspach, J.; Fischer, J. Disaggregated contributions of ecosystem services to human well-being: A case study from Eastern Europe. Reg. Environ. Chang. 2016, 16, 1779–1791. [Google Scholar] [CrossRef]
- Krekel, C.; Zerrahn, A. Does the presence of wind turbines have negative externalities for people in their surroundings? Evidence from well-being data. J. Environ. Econ. Manag. 2017, 82, 221–238. [Google Scholar] [CrossRef] [Green Version]
- Levinson, A. Valuing public goods using happiness data: The case of air quality. J. Public Econ. 2017, 96, 869–880. [Google Scholar] [CrossRef]
- Ferreira, S.; Akay, A.; Brereton, F.; Cuñado, J.; Martinsson, P.; Moro, M.; Ningal, T.F. Life satisfaction and air quality in Europe. Ecol. Econ. 2013, 88, 1–10. [Google Scholar] [CrossRef] [Green Version]
- Ambrey, C.L.; Fleming, C.M.; Chan, A.Y.C. Estimating the cost of air pollution in South East Queensland: An application of the life satisfaction non-market valuation approach. Ecol. Econ. 2014, 97, 172–181. [Google Scholar] [CrossRef]
- Kopmann, A.; Rehdanz, K. A human well-being approach for assessing the value of natural land areas. Ecol. Econ. 2013, 93, 20–33. [Google Scholar] [CrossRef]
- Van Praag, B.M.S.; Baarsma, B.E. Using happiness surveys to value intangibles: The case of airport noise. Econ. J. 2005, 115, 224–246. [Google Scholar] [CrossRef] [Green Version]
- Rehdanz, K.; Maddison, D. Local environmental quality and life-satisfaction in Germany. Ecol. Econ. 2008, 64, 787–797. [Google Scholar] [CrossRef]
- Luechinger, S.; Raschky, P.A. Valuing flood disasters using the life satisfaction approach. J. Public Econ. 2009, 93, 620–633. [Google Scholar] [CrossRef]
- Kunimitsu, Y. Regional factors affecting the satisfaction of residents: Evidence from structural equation model in Japan. Soc. Indic. Res. 2015, 120, 483–497. [Google Scholar] [CrossRef]
- Brereton, F.; Clinch, J.P.; Ferreira, S. Happiness, geography and the environment. Ecol. Econ. 2008, 65, 386–396. [Google Scholar] [CrossRef]
- Smyth, R.; Mishra, V.; Qian, X. The environment and well-being in urban China. Ecol. Econ. 2008, 68, 547–555. [Google Scholar] [CrossRef]
- Tanaka, R.; Hashimoto, S.; Hoshino, S.; Shimizu, N.; Kuki, Y. How do regional characteristics affect residents’ subjective well-being? J. Rural Plan. Assoc. 2013, 32, 167–172. [Google Scholar] [CrossRef] [Green Version]
- Tsurumi, T.; Kuramashi, K.; Managi, S. Monetary value evaluation using life satisfaction approach: Subjective well-being and nuclear power plant. Soc. Environ. Sci. Jpn. 2013, 26, 571–578. [Google Scholar]
- Rand, J.; Hoen, B. Thirty years of North American wind energy acceptance research: What have we learned? Energy Res. Soc. Sci. 2017, 29, 135–148. [Google Scholar] [CrossRef] [Green Version]
- Mueller, C.E. Effects of spatial proximity to proposed electric power lines on residents’ expectations, attitudes, and protest behavior: A replication study. Energy Policy 2019, 130, 341–346. [Google Scholar] [CrossRef]
- Wüstenhagen, R.; Wolsink, M.; Bürer, M.J. Social acceptance of renewable energy innovation: An introduction to the concept. Energy Policy 2007, 35, 2683–2691. [Google Scholar] [CrossRef] [Green Version]
- Von Möllendorff, C.; Welsch, H. Measuring renewable energy externalities: Evidence from subjective well-being data. Land Econ. 2017, 93, 109–126. [Google Scholar] [CrossRef] [Green Version]
- The New Energy and Industrial Technology Development Organization (NEDO). The Wind Power Generation Facilities and Installations Report in Japan (Last Updated on 28 June 2018) [Translated from Japanese]. Available online: http://www.nedo.go.jp/library/fuuryoku/index.html (accessed on 9 April 2021).
- Chōshi City. Location and Geographical Features of Chōshi City [Translated from Japanese]. Available online: https://www.city.choshi.chiba.jp/sisei/about_choshi/profile/ichi.html (accessed on 9 April 2021).
- MANDARA 10. Available online: https://ktgis.net/mandara/ (accessed on 9 April 2021).
- Chōshi City. Available online: https://www.city.choshi.chiba.jp/sisei/about_choshi/toukei/ (accessed on 9 April 2021).
- Ministry of Internal Affairs and Communications. Population Census 2015. Available online: http://www.stat.go.jp/data/kokusei/2015/kekka.html (accessed on 9 April 2021).
- Ando, T.; Nagai, H. The Location of Wind Turbines in Chōshi City, Chiba Prefecture and the Perceptions of Local Residents: Toward Consensus Building [Translated from Japanese]. Jpn. Wind Energy Soc. 2006, 30, 112–118. [Google Scholar]
- Tversky, A.; Kahneman, D. The Framing of decisions and the psychology of choice. Science 1981, 211, 453–458. [Google Scholar] [CrossRef] [Green Version]
- Ministry of Health, Labor and Welfare. Comprehensive Survey of Living Conditions 2016. Available online: https://www.mhlw.go.jp/toukei/saikin/hw/k-tyosa/k-tyosa16/index.html (accessed on 9 April 2021).
- Cabinet Office. First Report on the “Satisfaction and Quality of Life Survey” 2019 [Translated from Japanese]. Available online: https://www5.cao.go.jp/keizai2/manzoku/pdf/report01.pdf (accessed on 8 June 2021).
- Kubo, T.; Hasunuma, H.; Morimatsu, Y.; Fujino, Y.; Hara, K.; Ishitake, T. Influences of low-frequency and other noises produced by wind turbines: An epidemiological literature review. [Nihon koshu eisei zasshi] Jpn. J. Public Health 2017, 64, 403–411. [Google Scholar]
- Bidwell, D. The role of values in public beliefs and attitudes towards commercial wind energy. Energy Policy 2013, 58, 189–199. [Google Scholar] [CrossRef]
Figure 1.
Map of Tokyo metropolitan area and Chōshi City in Japan.

Figure 2.
Map of Chōshi area and locations of wind turbines.

Figure 3.
Distribution by income class (comparison of our survey data and Comprehensive Survey of Living Conditions (CSLC)).
Figure 3.
Distribution by income class (comparison of our survey data and Comprehensive Survey of Living Conditions (CSLC)).

Figure 4.
Distribution by age (comparison of our survey data and Comprehensive Survey of Living Conditions (CSLC)).
Figure 4.
Distribution by age (comparison of our survey data and Comprehensive Survey of Living Conditions (CSLC)).

Figure 5.
Distribution of distance from wind turbines to residences.

Figure 6.
Situation around the place of residence.

Figure 7.
Evaluation of wind turbines and other large buildings.

Figure 8.
Evaluation of sounds around places of residence.

Figure 9.
Distribution by subjective well-being. Well-being was measured on an 11-point scale, from “very unhappy” (0) to “very happy” (10).
Figure 9.
Distribution by subjective well-being. Well-being was measured on an 11-point scale, from “very unhappy” (0) to “very happy” (10).


Table 1.
Descriptive statistics (N = 201 observations).
| Variable | Mean | Std. Dev. | Min | Max |
|---|---|---|---|---|
| Well-being | 6.56 | 1.85 | 1 | 10 |
| View | 0.49 | 0.50 | 0 | 1 |
| Distance (<500 m) | 0.05 | 0.22 | 0 | 1 |
| Distance (500–1000 m) | 0.18 | 0.39 | 0 | 1 |
| Distance (1000–1500 m) | 0.32 | 0.47 | 0 | 1 |
| Distance (1500–2000 m) | 0.36 | 0.48 | 0 | 1 |
| Distance (>2000 m) | 0.08 | 0.28 | 0 | 1 |
| Noise | 0.58 | 0.49 | 0 | 1 |
| Income (<2 million JPY) | 0.16 | 0.37 | 0 | 1 |
| Income (2–3 million JPY) | 0.23 | 0.42 | 0 | 1 |
| Income (3–4 million JPY) | 0.10 | 0.31 | 0 | 1 |
| Income (4–5 million JPY) | 0.12 | 0.33 | 0 | 1 |
| Income (5–7 million JPY) | 0.19 | 0.40 | 0 | 1 |
| Income (7–10 million JPY) | 0.10 | 0.31 | 0 | 1 |
| Income (10–15 million JPY) | 0.05 | 0.22 | 0 | 1 |
| Income (>15 million JPY) | 0.03 | 0.17 | 0 | 1 |
| Male | 0.51 | 0.50 | 0 | 1 |
| Employment | 0.60 | 0.49 | 0 | 1 |
| Ln Age | 4.00 | 0.35 | 2.9 | 4.5 |
| Ln Age Squared | 16.12 | 2.70 | 8.4 | 20.1 |
| Education (≧High school) | 0.27 | 0.45 | 0 | 1 |
| Marriage | 0.63 | 0.48 | 0 | 1 |
| Duration of Residence (<10 years) | 0.11 | 0.31 | 0 | 1 |
| Duration of Residence (10–20 years) | 0.18 | 0.39 | 0 | 1 |
| Duration of Residence (20–30 years) | 0.24 | 0.43 | 0 | 1 |
| Duration of Residence (>30 years) | 0.46 | 0.50 | 0 | 1 |
Table 2.
Results of ordered probit analysis.
| Variable | Model 1 | Model 2 | Model 3 | ||||||
|---|---|---|---|---|---|---|---|---|---|
| Coef. | Std Error | Coef. | Std Error | Coef. | Std Error | ||||
| View | 0.55 | 0.30 | * | 0.50 | 0.30 | * | |||
| Distance (500–1000 m) | 0.74 | 0.71 | 0.84 | 0.71 | |||||
| Distance (1000–1500 m) | 1.36 | 0.68 | ** | 1.46 | 0.69 | ** | |||
| Distance (1500–2000 m) | 0.94 | 0.70 | 0.98 | 0.70 | |||||
| Distance (>2000 m) | 1.54 | 0.83 | * | 1.61 | 0.84 | * | |||
| Noise | 0.29 | 0.28 | |||||||
| Male | –1.08 | 0.28 | *** | –1.06 | 0.28 | *** | –0.97 | 0.27 | *** |
| Employment | 0.64 | 0.34 | * | 0.67 | 0.34 | ** | 0.58 | 0.33 | * |
| Ln Age | –14.97 | 8.14 | * | –15.60 | 8.08 | * | –12.74 | 7.70 | * |
| Ln Age Squared | 2.08 | 1.08 | * | 2.17 | 1.07 | ** | 1.77 | 1.02 | * |
| Education (≧High school) | 0.37 | 0.30 | 0.36 | 0.30 | 0.42 | 0.30 | |||
| Marriage | 0.68 | 0.30 | ** | 0.70 | 0.30 | ** | 0.78 | 0.29 | *** |
| Income (2–3 million JPY) | 0.55 | 0.42 | 0.60 | 0.42 | 0.50 | 0.42 | |||
| Income (3–4 million JPY) | 0.31 | 0.52 | 0.35 | 0.52 | 0.34 | 0.50 | |||
| Income (4–5 million JPY) | 1.34 | 0.50 | *** | 1.36 | 0.50 | *** | 1.36 | 0.50 | *** |
| Income (5–7 million JPY) | 1.18 | 0.48 | ** | 1.20 | 0.48 | ** | 1.13 | 0.47 | ** |
| Income (7–10 million JPY) | 2.19 | 0.56 | *** | 2.27 | 0.56 | *** | 2.06 | 0.54 | *** |
| Income (10–15 million JPY) | 0.98 | 0.66 | 1.13 | 0.67 | * | 1.00 | 0.67 | ||
| Income (>15 million JPY) | 0.97 | 0.89 | 0.86 | 0.90 | 0.86 | 0.84 | |||
| Duration of Residence (10–20 years) | –1.07 | 0.50 | ** | –1.10 | 0.50 | ** | –1.18 | 0.48 | ** |
| Duration of Residence (20–30 years) | –1.15 | 0.47 | ** | –1.18 | 0.47 | ** | –1.21 | 0.46 | *** |
| Duration of Residence (>30 years) | –0.54 | 0.46 | –0.56 | 0.46 | –0.60 | 0.44 | |||
| /cut1 | –30.31 | 15.15 | –31.08 | 14.99 | –27.58 | 14.29 | |||
| /cut2 | –29.59 | 15.13 | –30.36 | 14.97 | –26.85 | 14.27 | |||
| /cut3 | –27.76 | 15.10 | –28.54 | 14.94 | –25.03 | 14.24 | |||
| /cut4 | –26.88 | 15.09 | –27.67 | 14.94 | –24.18 | 14.23 | |||
| /cut5 | –25.41 | 15.09 | –26.19 | 14.93 | –22.76 | 14.22 | |||
| /cut6 | –24.72 | 15.08 | –25.50 | 14.92 | –22.07 | 14.22 | |||
| /cut7 | –23.49 | 15.07 | –24.26 | 14.92 | –20.89 | 14.21 | |||
| /cut8 | –22.31 | 15.07 | –23.07 | 14.91 | –19.72 | 14.21 | |||
| /cut9 | –21.60 | 15.06 | –22.36 | 14.91 | –19.00 | 14.21 | |||
| Observations | 201 | 201 | 201 | ||||||
| LR chi2 | 55.06 | *** | 56.18 | *** | 47.35 | *** | |||
| Pseudo R2 | 0.07 | 0.07 | 0.06 | ||||||
*** p < 0.01, ** p < 0.05, * p < 0.1.
Publisher’s Note: MDPI stays neutral with regard to jurisdictional claims in published maps and institutional affiliations. |
© 2021 by the authors. Licensee MDPI, Basel, Switzerland. This article is an open access article distributed under the terms and conditions of the Creative Commons Attribution (CC BY) license (https://creativecommons.org/licenses/by/4.0/).
Share and Cite
MDPI and ACS Style
Kunugi, Y.; Arimura, T.H.; Nakai, M. The Long-Term Impact of Wind Power Generation on a Local Community: Economics Analysis of Subjective Well-Being Data in Chōshi City. Energies 2021, 14, 3984. https://doi.org/10.3390/en14133984
AMA Style
Kunugi Y, Arimura TH, Nakai M. The Long-Term Impact of Wind Power Generation on a Local Community: Economics Analysis of Subjective Well-Being Data in Chōshi City. Energies. 2021; 14(13):3984. https://doi.org/10.3390/en14133984
Chicago/Turabian StyleKunugi, Yushi, Toshi H. Arimura, and Miwa Nakai. 2021. "The Long-Term Impact of Wind Power Generation on a Local Community: Economics Analysis of Subjective Well-Being Data in Chōshi City" Energies 14, no. 13: 3984. https://doi.org/10.3390/en14133984
Note that from the first issue of 2016, this journal uses article numbers instead of page numbers. See further details here.