Article

Effect of Pretreatments on Convective and Infrared Drying Kinetics, Energy Consumption and Quality of Terebinth

by
Yousef Abbaspour-Gilandeh
1,*,
Mohammad Kaveh
1,
Hamideh Fatemi
2,
Esmail Khalife
3,
Dorota Witrowa-Rajchert
4 and
Małgorzata Nowacka
4,*
1
Department of Biosystems Engineering, College of Agriculture and Natural Resources, University of Mohaghegh Ardabili, Ardabil 5619911367, Iran
2
Department of Horticulture, College of Agriculture and Natural Resources, University of Mohaghegh Arda-bili, Ardabil 5619911367, Iran
3
Department of Civil Engineering, Cihan University-Erbil, Kurdistan Region, Iraq
4
Department of Food Engineering and Process Management, Institute of Food Sciences, Warsaw University of Life Sciences-SGGW, 02-787 Warsaw, Poland
*
Authors to whom correspondence should be addressed.
Appl. Sci. 2021, 11(16), 7672; https://doi.org/10.3390/app11167672
Submission received: 2 July 2021 / Revised: 2 August 2021 / Accepted: 18 August 2021 / Published: 20 August 2021
(This article belongs to the Special Issue Drying Technologies in Food Processing)

Abstract

:
This study is focused on the influence of convective drying (50, 60, and 70 °C) and infrared (IR) power (250, 500, and 750 W) on the drying kinetics, the specific energy consumption of terebinth drying as well as quality and bioactive compounds upon various pretreatments such as ultrasound (US), blanching (BL), and microwave (MW). Compared to convective drying, IR drying decreased more the drying time and energy consumption (SEC). Application of higher IR powers and air temperatures accelerated the drying process at lower energy consumption (SEC) and higher energy efficiency and moisture diffusion. Terebinth dried by a convective dryer at 60 °C with US pretreatment showed a better color compared to other samples. It also exhibited the polyphenol and flavonoid content of 145.35 mg GAE/g d.m. and 49.24 mg QE/g d.m., respectively, with color variations of 14.25 and a rehydration rate of 3.17. The proposed pretreatment methods significantly reduced the drying time and energy consumption, and from the other side it increased energy efficiency, bioactive compounds, and quality of the dried samples (p < 0.01). Among the different pretreatments used, microwave pretreatment led to the best results in terms of the drying time and SEC, and energy efficiency. US pretreatment showed the best results in terms of preserving the bioactive compounds and the general appearance of the terebinth.

1. Introduction

Terebinth belongs to the Pistacacia genus from the Anacardiaceae family. This genus includes 11 tree and bush species which can be found in some Asian countries including Iran, Iraq, Turkey, and Syria [1]. Terebinth has three subspecies (Cabulica, Mutica, and Kurdica). Kurdica can be widely found in the Zagros mountains (Kurdistan, Ilam, Kermanshah, and West Azarbayjan) and is among the most important species of this region. Terebinth is rich in vitamins A, B, and D. It reinforces the nervous system and could help in treating anemia [2].
Recently, researchers have become interested in investigating the presence of antioxidant compounds in crops especially fruits and vegetables. Health-aiding properties of antioxidants and their role in preventing diseases could well explain these rising interests. Antioxidants prevent the oxidation process which is one of the main causes of diseases such as cancer [3]. It seems that drying can be a potent alternative to enhance durability and decline the quality loss of the products during long-term storage [4]. Drying is one of the oldest methods to preserve fruits and vegetables. By declining the moisture content, drying can decrease or stop the enzymic and microbial activities while producing products at lower weights and volumes [5]. Since most of the fruits and vegetables can be found in a specific season, their abundance and low price can result in their decay. Therefore, processing methods can prevent their loss while offering higher profits by presenting them in other seasons [6]. Drying is a preservation technique in which the moisture content of the product is declined to a stable level. Drying fruits can be achieved through various methods including sun-drying, hot-air, microwave (MW), infrared (IR), vacuum freezing, freeze-drying, and their combinations.
The dried products have a longer shelf-life and lower volume, weight, and transportation, packaging, and storage costs. Among all the mentioned aspects, a proper drying method can make it possible to access high-quality fruits throughout the year [7]. Moisture discharge in the dried samples can be achieved under controlled conditions through evaporation by hot-air (convective and vacuum) or waves microwave (MW-dryer), or moisture sublimation (freeze-drying). Convective drying will result in cellular destruction which is proportional to the amount of moisture discharged. To resolve this problem, other drying methods such as freeze-drying, microwave, etc. have been suggested. Studies have shown that all these methods suffer from several drawbacks such as long process time and high energy consumption [8].
Pretreatments can help in resolving these issues. Ultrasound (US) waves have frequencies over 18 kHz which cannot be detected by human ears. US waves can be classified into two ranges strong: low-frequency (18–100 kHz) and weak: high frequency (over 100 kHz) [9,10,11]. By inducing a sponge-like texture in the food, US waves can enhance the heat and mass transfer rates during the drying process. The use of US pretreatment or its direct application in the drying chamber can lead to the best results in terms of the shorter processing time and preservation of the product quality while optimizing the energy consumption [12]. On the other hand, US treatment is a safe, simple, and relatively low-cost method that can be applied in industrial scale studies that have revealed that US energy can be widely employed as a pretreatment for drying various fruits [13]. For example, blackberry treated with US, microwave (MW), and blanching (BL) used before convective drying shortened the processing time compared to the control samples. Furthermore, US treatments also led to the lowest specific energy consumption (SEC), shrinkage, and color variations [14]. Moreover, Rybak et al. [15] evaluated the effect of pretreatments such as US, BL, and pulsed electric field (PEF) on the drying time, effective moisture diffusion, quality, and energy of the red bell pepper slices dried using freeze-drying. The results indicated that the use of various pretreatments can reduce the kinetics of the drying, however, the highest effective moisture diffusion, as well as the shortest drying time and SEC, were achieved in the blanched red bell pepper. Furthermore, Sledz et al. [16] explored the drying time and SEC of parsley leaves drying under the US and blanching pretreatment in a convective-MW dryer at three temperatures (20, 30, and 40 °C) and two microwave levels (100 and 300 W). The results indicated that a rise in the temperature of the inlet air and MW power and the use of US and blanching pretreatment can decrease the drying time and SEC compared to the controls.
Additionally, Ren et al. [12] examined the effects of US and BL in water on the bioactive features (total phenol, total flavonoids, and quercetin) in onions dried by convective and freeze-drying methods. The results indicated that the US pretreatment performed better in preserving the quality and antioxidant features of the dried onions. Comparing the two drying methods, the use of freeze-drying led to higher quality preservation in the dried onions. Similarly, Nowacka et al. [17] investigated the bioactive features (antioxidants, total phenol, and flavonoid contents, and vitamin C), drying time, and effective moisture diffusion of cranberry snacks using hot water blanching and US pretreatments in an MW-vacuum dryer. Their results indicated that the dried cranberries with pretreatments required shorter drying times compared to the controls. The antioxidant and total phenol and flavonoid contents of the pretreated samples were also enhanced compared to the controls. Moreover, the color variations and textural damage showed a decrease. In another study, the influence of US energy and blanching on the drying time, color variations, rehydration rate, and bioactive properties of cashew apple dried by hot-air dryer was investigated [18]. The results indicated that the blanching and blanching pretreatment can decrease the drying time as a result of an increment in effective moisture diffusion. Additionally, bioactive properties and rehydration rate were significantly higher in US pretreatment compared to blanching pretreatment and control group.
Examination of various references showed that the majority of the studies evaluated the effect of one or two pretreatments considering one of the drying techniques. In the present study, the effects of three pretreatments (ultrasound, blanching, and microwave) on drying kinetics, thermal parameters (moisture diffusion coefficient, SEC, and energy efficiency), qualitative properties (color and rehydration rate), and bioactive properties (total phenol content and flavonoid content) of terebinth is discussed using two different drying methods: convective drying at three levels (50, 60, and 70 °C) and IR (250, 500, and 750 W).

2. Materials and Methods

2.1. Sample Preparation

The material chosen for the study was terebinth—Kordika cultivar, which was purchased from the Sardasht market located in West Azerbaijan province, Iran. For the study terebinth samples with similar sizes have been chosen. The mean initial moisture of the samples was 3.85% on a dry basis, which was measured by an oven method (Memmert, UFB500, Germany). The samples were transferred to a refrigerator at 4 ± 0.5 °C for proper storage. Prior to the experiments, the terebinth samples were removed from the refrigerator and placed at room temperature for half an hour. The samples were stored not longer than one week.

2.2. Pretreatment Methods

2.2.1. Ultrasound (US)

Samples (80 g) were US-treated using an ultrasonic bath (Parsonic, 7500 s, Tehran, Iran) at a frequency of 28 kHz and a power of 70 W. The time was set up for 30 min after preliminary studies of sonication time (10, 20, 30 min; for 10 and 20 min data not shown). The surface of the distilled water was filled to the recommended point on the ultrasound bath. The prepared samples were placed in a tank full of distilled water at 30 °C for ultrasonic bath pretreatment. The experiments were conducted twice.

2.2.2. Blanching (BL)

The samples were exposed to hot water vapor. Pretreatment was performed at a constant temperature (80 °C) for 2 min after preliminary studies of different conditions (70 °C for 2.5 min—data not shown, 80 °C for 2 min, 90 °C for 1.5 min—data not shown). Then, the pre-treated samples with hot water were placed on the drain for two min and then dried with paper towels. Afterward, they were placed in cylindrical glass containers and dried by a convective-infrared dryer until reaching a constant weight. The experiments were conducted twice.

2.2.3. Microwave (MW)

Preliminary studies have shown that among the following parameters of microwaves: 180 W for 3 min, 360 W for 2.5 min, and 540 W for 2 min, the best results in terms of the quality dried material (rehydration rate, color, total phenol content, flavonoids content) of were obtained for 360 W. Thus, the cleaned terebinth samples were placed in the microwave chamber 360 W for 2.5 min to apply microwave pretreatment. After the pretreatment process, all samples were weighed. The pretreatment process was performed using a microwave oven (Sharp R-I96T, Sharp, Electronics, Bangkok, Thailand). The experiments were conducted twice and 80 g of sample was used in each experiment.

2.3. Drying Methods

2.3.1. Convective Drying (CV)

The pre-processed and control terebinth samples were dried at three temperatures levels of 50, 60, and 70 °C in a convective dryer equipped with an air circulation fan at a speed of 1 m/s until the final humidity content reached 0.1 dry basis (d.b). The inlet air velocity in the drying chamber was provided by a centrifugal fan (1 hp/3000 rpm) and a speed control valve. A turbine anemometer (Anemometer, Lutron-YK, 80AM, China) at an accuracy of 0.01 was used to measure the velocity of the exhaust air from the drying chamber. The inlet air temperature was supplied by three electric heaters. The rectangular duct of the dryer chamber was well insulated by fiberglass. Fresh terebinth sample was placed on a tray (60 × 40 cm2). Each run, 80 g sample was dried. Before each test, the dryer was turned on for twenty minutes to reach the desired temperature. During drying, the weight of the samples was measured at 3 min intervals using a digital scale (GF-600; Japan) at an accuracy of ±0.001 g. Finally, the samples were stored at room temperature for 15 min and then packed in polyethylene bags. The final moisture content of dried samples was measured on average as 0.1 on a dry basis. Each experiment was performed in two replications.

2.3.2. Infrared Drying (IR)

To dry the terebinth samples by an infrared system, three levels of infrared intensity (250, 500, and 750 W) that are suitable for agricultural products were used. Three infrared lamps were installed. The distance between the lamps and the product was adjusted so that the radiation intensity was 20 cm away from the surface of the samples. In this research, infrared and hot air dryers made by the Department of Mechanical Engineering of Biosystems of Mohaghegh Ardabil University were used. For mass transfer kinetics analysis, mass variation during the drying process was recorded every three minutes using a digital scale (GF-600; Japan) at an accuracy of ±0.001 g. After the drying step was completed, the samples were ground for further analysis in the laboratory of the Department of Horticulture, Mohaghegh Ardabili University.

2.4. Moisture Ratio (MR)

The moisture ratio of terebinth samples during the drying process was determined by Equation (1) [8]:
MR = (MtMe)/(M0Me),
where MR is the dimensionless moisture ratio, Mx is the moisture content at any sample position (kg water/kg dry matter), M0 is the initial moisture content, and Me is the equilibrium moisture content.

2.5. Determination of Effective Moisture Diffusivity Coefficient (Deff)

Using Fick’s law, it is possible to calculate the effective moisture diffusion coefficient of terebinth (spherical shape) [1]:
MR   =   6 / π 2   n   =   1 ( 1 / 2 n 2 ) exp ( n 2 π 2 D eff t / r e 2 ) ,
where re is the radius of terebinth seed (m), n is the index ranging from 1 to infinity, t is the drying time (s), and Deff is the effective diffusivity coefficient (m2/s). By solving Equation (2), the value of the moisture diffusion can be determined by Equation (3) [7]:
Ln(MR) = ln(6/π2) − (Deffπ2t/re2),
For long drying times, only the first term of Equation (4) is included:
MR = (6/π2)exp(−Deffπ2t/re2),
K1 can be determined by plotting (ln(MR)) vs. Equation (5). In this way, the effective moisture diffusion coefficient (Deff) can be obtained [19].
K1 = (Deffπ2/re2),

2.6. Specific Energy Consumption (SEC)

SEC refers to the energy transferred by waves as heat which can lead to the drying of the product. The energy consumption of various pretreatments was first calculated. Then the SEC of each dryer was estimated.
SEC for MW, US, and BL pretreatments can be determined by Equations (6)–(8), respectively [14]:
SECMW = P·t/Mw,
SECUS = UP·t/Mw,
SECBL = Q·t/Mw,
In which:
UP = UIcosΦ
Q = m·Ca·Δt,
where SECMW, SECUS, and SECBL are the specific energy consumption for microwave (MJ/kg), ultrasonic and blanching drying methods, respectively (kJ/kg), t is the total drying time (min), Mw represents the weight loss (kg), UP is the US power (W), while U and I are the applied voltage (V) and current (A) of the US generator, respectively. cosΦ is the power factor and equals 0.8. K is the lamp power (W), ΔT is the temperature difference (°C), Q is the volume flow rate of air into the drying chamber (m3/min), Ca represents the specific heat (kJ/kg·°C), m is the mass of water (kg).

2.6.1. Energy Consumption for CV Dryer

The heat-providing energy can be obtained by Equation (11) [20]:
EUter = A·v·Ca·рa·Δt·t,
The mechanical energy of the blower can be calculated by Equation (12) [21]:
EUmec = ΔP·Mair·t,
The SEC of terebinth drying by a convective dryer can be determined by Equation (13) [22]:
SECCV = EU(mec + ter)/Mw,
where EUter is the thermal energy consumption (kJ), A denotes the tray area (m2), v represents the inlet air velocity (m/s), ρa stands for air density (kg/m3), EUmec is the mechanical energy (kJ) and ΔP denotes the pressure difference (mbar). Mair is the volumetric flow rate of air (m3/h), SECCV is the specific energy consumption for convective (kJ/kg).

2.6.2. Energy Consumption for IR Dryer

The SEC of terebinth drying by an IR dryer can be determined by Equation (14) [23]:
SECIR = K·t/Mw,
where SECIR specific energy consumption for infrared (kJ/kg) and K is the lamp power (W).
Finally, the equations in Table 1 were used to calculate the energy consumed by various pretreatments using different dryers.

2.7. Energy Efficiency

The energy efficiency was determined by Equation (23) [24]:
ήe = Eeva/SEC,
Eeva = hf·g·mw,
where ήe is the energy efficiency (%), and Eeva is the energy required to evaporate moisture (kJ). Where hf.g. is the latent heat of vaporization (kJ/kg) and Eeva is the consumed energy (KJ).
In Equation (24), hf·g shows the latent evaporation heat (kJ/kg) which is calculated as a function of absolute temperature (Tabs K) [21]:
hf·g = (7.33 × 10⁶ − 16Tabs2)0.5; 273.16 < Tabs < 338.72,
hf·g = (2.503 × 10³ − 2.386(Tabs − 273.16); 337.72 < Tabs < 533.16,

2.8. Rehydration Rate (RR)

Rehydration rate is a complex process that can indicate physicochemical changes during the drying process and can be considered as a measure of the amount of damage to food texture [26]. To calculate the rehydration rate, 5 g of dried samples (ca. 7 fruits) were immersed in distilled water (100 mL, 20 °C) for 3 h. Subsequently, the samples were taken out of the water and their excess water was eliminated by a dehumidifier paper. Rehydration rate can be calculated using Equation (26) [15]:
RR = Wr/Wd,
where Wr is the weight of the sample after rehydration (g) and Wd is the initial weight of the dried sample (g).

2.9. Color

Color is one of the important quality aspects of processed and unprocessed foods. Color along with taste and texture play a key role in food acceptability and can also indicate chemical changes in the food [27]. The color space, published by the International Commission on Lighting (CIE) in 1976, known as the L*a*b*, was employed to measure food color parameters. In this method, the color properties of the material are assessed by the brightness (L*), green-red (a*), and the blue-yellow (b*) components. A colorimeter (HP-200, China) was used to measure the L*a*b* parameters of dried terebinth. The total color difference in dried terebinth (ΔE) was calculated by Equation (27) [26]:
Δ E   =   ( ( L 0 * L * ) + ( a 0 * a * ) + ( b 0 * b * ) ) 1 / 2 ,
where L0*, a0*, b0*, and b0 represent the lightness, greenness/redness, and blueness/yellowness of the fresh terebinth samples, respectively, while the L*, a*, b* represent the color parameters of the dried samples, respectively.

2.10. Total Phenol Content

The total phenolic compounds in terebinth extract were investigated by Folin–Ciocalteu colorimetric method [28]. The 20 mg of dried sample was mixed with 2 mL of 80% methanol solution and homogenized by overtaxing for 2 min, placed 24 h in a shaker at room temperature, and then put in an ultrasonic bath for 10 min. Then the extract was filtered through filter paper. Then, 1 mL of such prepared extract was mixed with 2.5 mL of Folin–Ciocalteu reagent and after 5 min, it was well mixed with 5 mL of saturated sodium carbonate. The samples were kept in the dark for 90 min and then their absorbance was read in three replications using a spectrophotometer (UV-Vis 2100, UNICO Company, USA) at a wavelength of 765 nm. The total phenolic content was expressed in terms of μg gallic acid (GAE) per milliliter of the extract using the line equation plotted for gallic acid.

2.11. Flavonoids Content

The total flavonoid content of the sample was determined by the method of Tylewicz et al. [29] with slight modification. In brief, 20 μL of the extracts (in methanol solvent) were diluted with 1 mL deionized water. Then 75 μL of 5% sodium nitrite was added. After 5 min, 0.15 mL of 10% aluminum chloride was added to the solution. After 6 min, 0.5 mL 1 M sodium hydroxide was added and the total volume of the solution was finally increased to 3 mL using deionized water. The adsorption of the resulting solution was read immediately at 510 nm. Total flavonoid content was expressed in terms of mg quercetin content per 100 g of the sample. To plot the standard quercetin curve, a base solution of quercetin was prepared and different concentrations (10 to 100 μL/mL) were prepared and the standard curve was drawn based on the adsorption versus concentration.

2.12. pH

To obtain the pH of the terebinth samples before and after drying, 10 g terebinth was homogenized with 100 mL distilled water and then its pH was measured using a pH meter (Metrohm, Switzerland).

2.13. Statistical Analysis

In this study, three pretreatments (microwave, ultrasound, and blanching) and two dryers (convective at 50, 60, and 70 °C and IR with 250, 500, and 750 W power) were studied using a complete factorial design and in three replications. The linear and reciprocal interaction of the factors were evaluated using analysis of variance in the SAS software version 9.4 to identify statistically effective factors. The effect of temperature and concentration on the means was determined using Duncan’s multiple range test to evaluate the significance of the data at the 95% error probability level.

3. Results and Discussion

According to Table 2, various pretreatments (US, MW, and BL) significantly affected time, Deff, SEC, ήe, total color difference, rehydration rate (RR), total phenolic content (TPC), total flavonoids content (TFC), and pH at the probability level of 1%. The two studied CV (50, 60, and 70 °C) and IR (250, 500, and 750 W) dryers significantly affected time, Deff, SEC, ήe, total color difference, RR, TPC, TFC, and pH at the probability level of 1%. The reciprocal effects of the two treatments also showed significant influence on all the parameters at the probability level of 1% (Table 2).

3.1. Convective and Infrared Drying

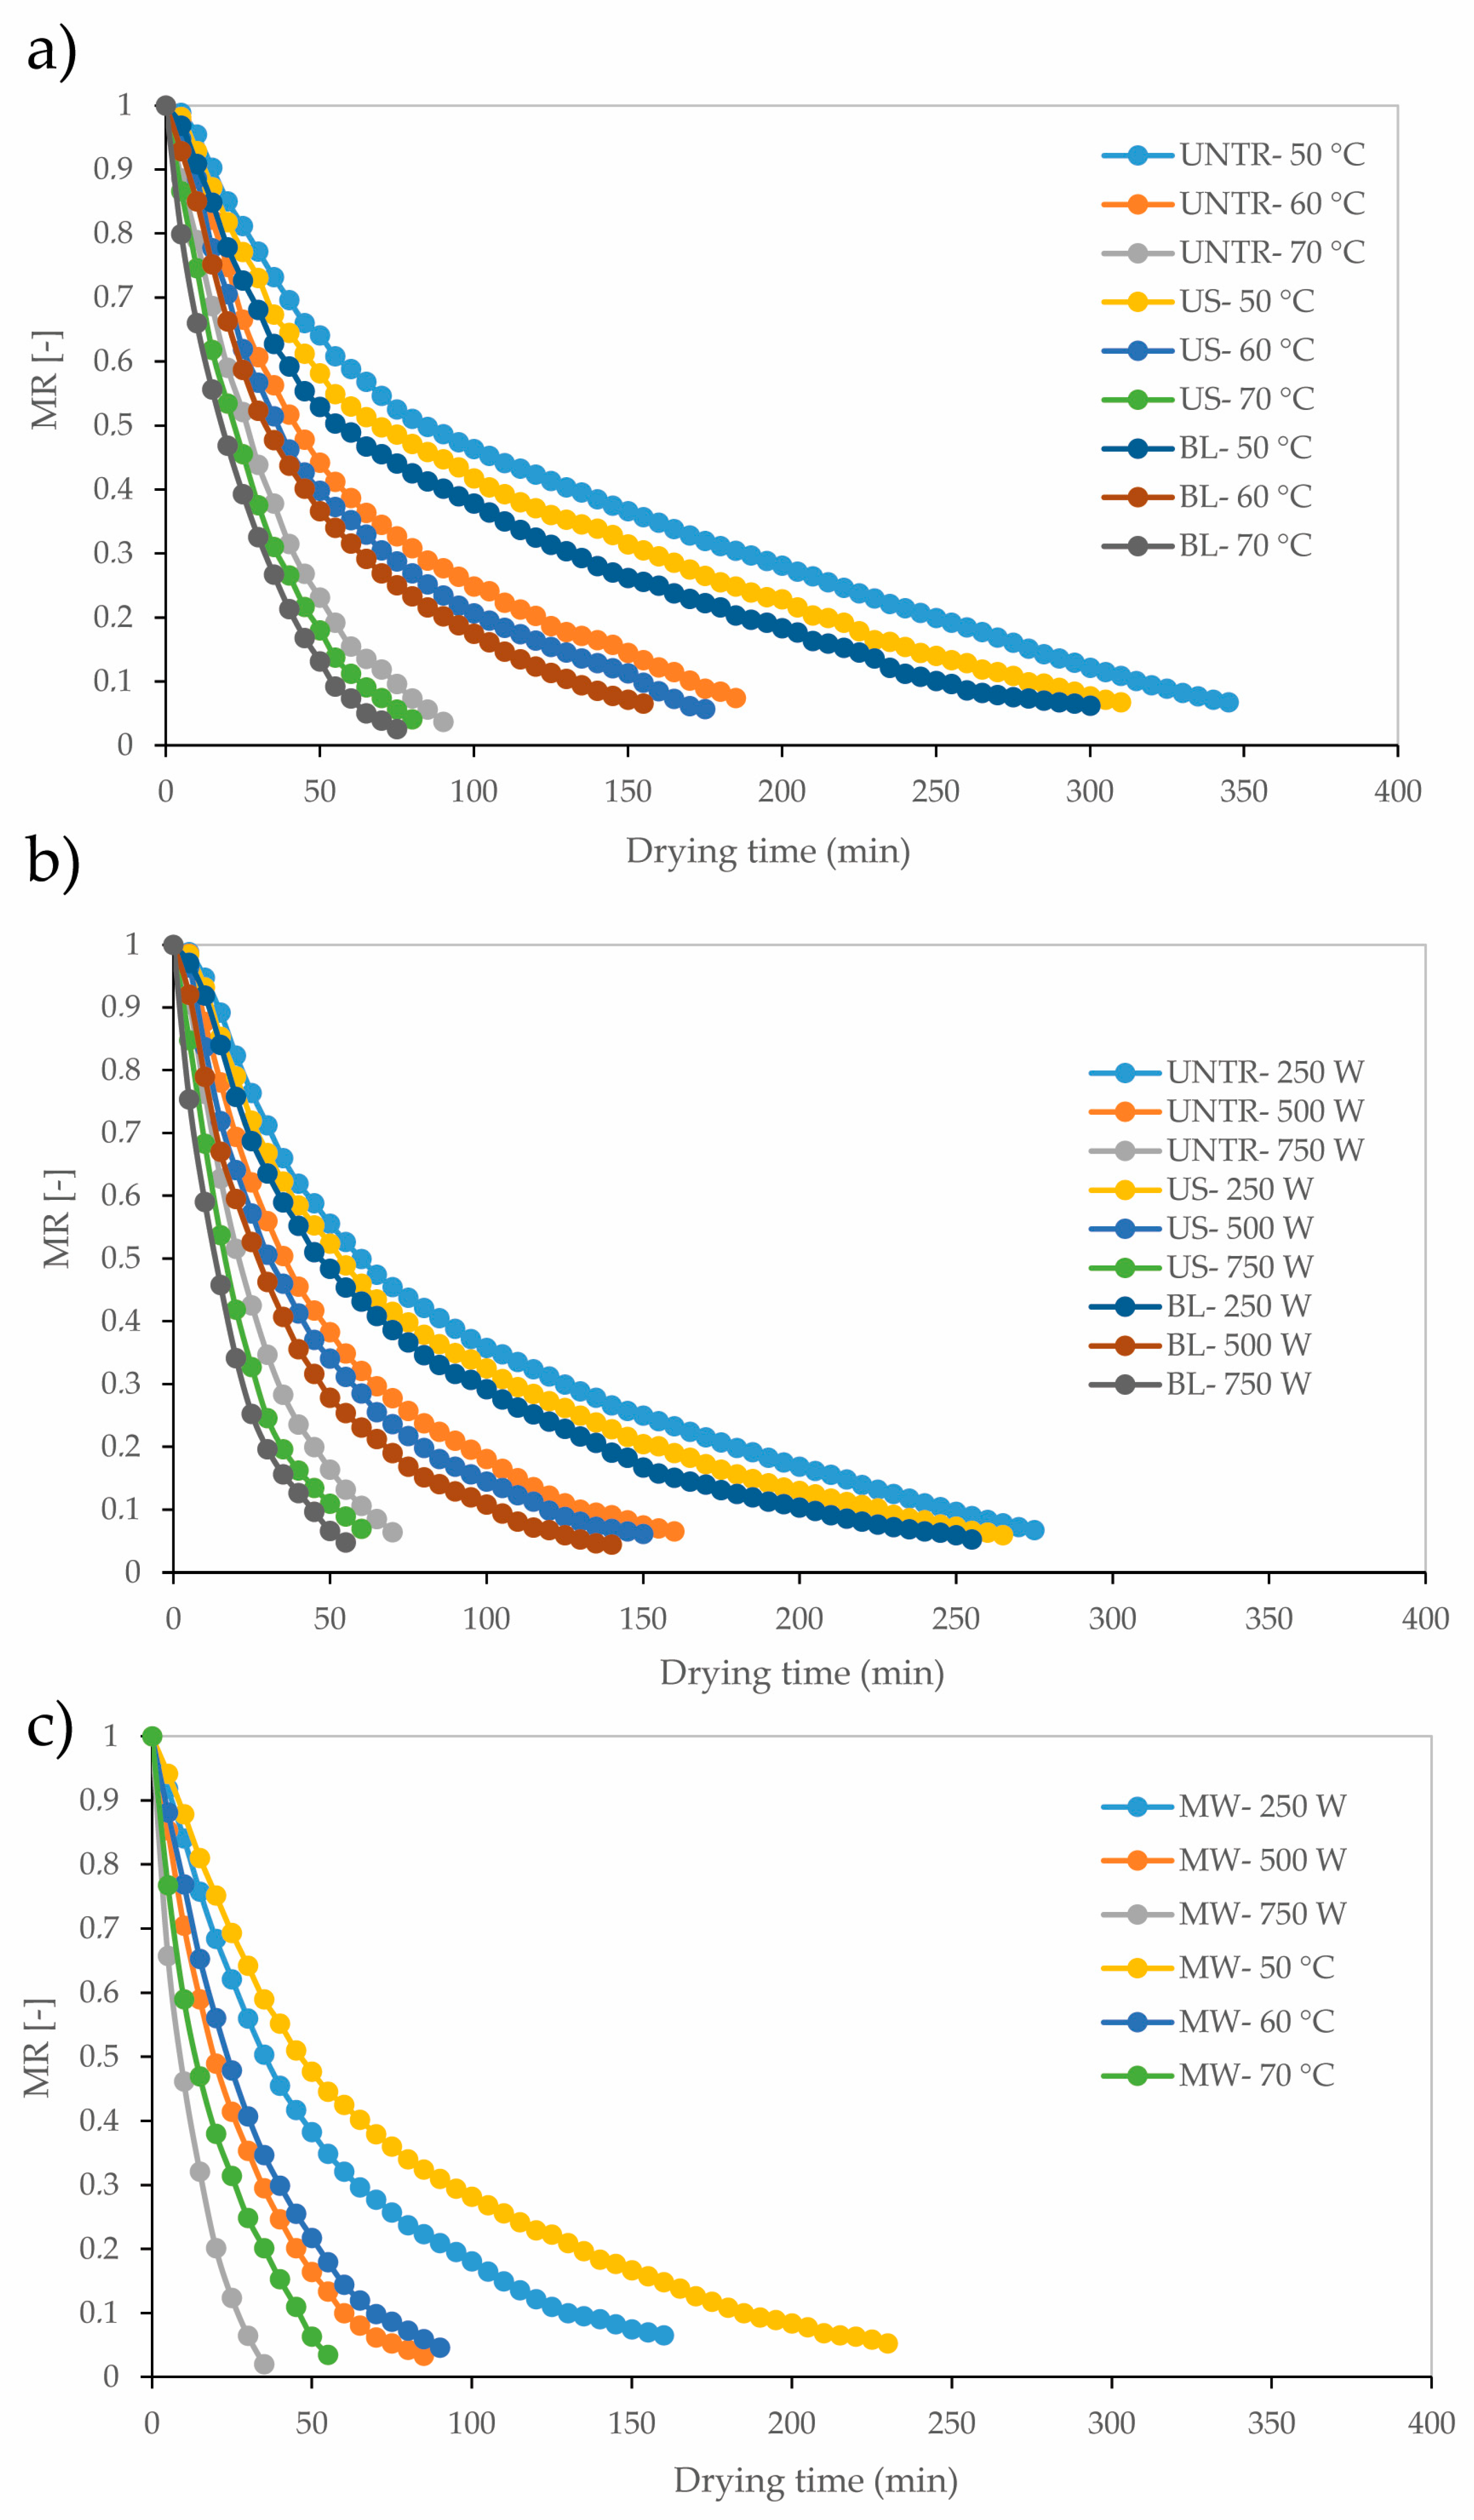
3.1.1. Kinetics and Drying Time of Terebinth

Figure 1 shows the results for various dryers (CV at temperature 50–70 °C and IR with infrared power of 250, 500, and 750 W) as well as different pretreatments (US, MW, and BL) on drying terebinth. The longest drying time (345 min) was obtained for the convective dryer working at a temperature of 50 °C in the case of control samples, while for IR dryer operating at 250 W for controls was 275 min. At the beginning of the drying, a sharp descending kinetics slope in the initial drying steps was observed, which got milder in the next stages. The reason could be high moisture diffusion in the initial steps of the drying. As time passed, the moisture content of the product was declined and the moisture diffusion was decremented which reduced the drying rate in the terebinth layers, hence prolonging the drying time which can be observed in the final stages of the drying [6].
A comparison of Figure 1a,b shows that the drying time was declined by enhancing the temperature due to the increased movement of the water molecules in the product as a result of heat which accelerated the evaporation. Moreover, a rise in the temperature enhanced the moisture transfer rate to the surface, thus accelerating the evaporation. Therefore, the drying rate will be incremented at high temperatures [30]. Similar results were also reported by Liu et al. [13], Kaveh et al. [22], and Ghanem et al. [5] for drying pear slices, green pea, and lemon, respectively.
It can also be observed that in the IR dryer, with increasing the power, the slope of the moisture ratio was incremented, thus reducing the drying time. A rise in the IR power increased the dryer temperature. On the other hand, it enhanced the moisture absorption capacity of the air due to the increase in temperature difference between the air and the product which accelerated the product heating resulting in better water evaporation and shortening the drying time [31]. The results can be compared with the findings of Jafari et al. [32] in drying eggplant slices and Adak et al. [4] in drying strawberries.
According to Figure 1a–c, the use of pretreatment (in both dryers) reduced the drying time in the range of 3.6 to 51.4% in comparison to samples without pretreatments. In pre-treated samples, the change in the rate of moisture transfer from the center of the sample to the surface increased. By examining the effect of different pretreatments at various temperatures for CV drying and powers for IR drying, it can be found that MW pretreatment can reduce drying time more than the other two pretreatments (US and BL). MV pretreatment reduced the drying time in the range of 33.3–51.4% for CV drying and 41.8–50% for IR drying when compared to the samples dried without pretreatment at various temperatures and powers, while for BL and US applied before CV drying the reduction was in the range of 13.0–16.7% and 5.4–11.1%, respectively. For IR drying the BL and US treatment resulted in a decrease of drying in the range of 7.3–21.3% and 3.6–14.3%, respectively. This may be because the microwave pretreatment destroyed the surface of the terebinth making its pores larger, hence, the humidity can quickly leave the surface. Similar results have been reported in drying turnips [33]. Comparison of the results indicated that the blanching pretreatment shortened the drying time more than US pretreatment. Blanching treatment inactivates the enzymes and removes oxygen from the intercellular spaces, and as a result, the mass transfer occurred faster in these samples [34]. Similar results were reported by other researchers for example Tao et al. [6], Wang et al. [35], and Adabi et al. [31] in drying white cabbage and apple slices and black mulberry using different pretreatments (US and BL), respectively.

3.1.2. Effective Moisture Diffusivity of Convective and Infrared Drying of Terebinth

Investigation of the effects of temperature and infrared power on the Deff of terebinth indicated that a rise in the temperature of the CV dryer and the power of the IR dryer can significantly enhance the Deff. Statistical analysis revealed that the reciprocal effects of dryer type and pretreatment were significant for the Deff parameter (Table 2). The highest Deff (9.77 ×10⁻⁹ m2/s) was achieved under MW pretreatment at 750 W using an IR dryer, while the lowest (6.53 ×10⁻¹⁰ m2/s) was observed in the CV dryer at 50 °C in the control sample. The results showed an increment in the Deff with increasing the temperature in all cases. The reason is that the temperature elevation led to enhanced molecular motion and surface suction caused more water molecules to leave the product (increased mass transfer) and consequently reduced the drying time and incremented the Deff [33]. With increasing IR power, the Deff also increased as the IR ray’s penetration into the material led to the oscillation of water molecules and increased the internal vapor pressure. In this case, the molecules will need less energy to transfer from the porous material, therefore a rise in IR power will enhance the Deff [7]. These results are in line with the reports by other researchers such as Jafarifar et al. [19] for drying walnuts in the IR power range of 500–1500 W, Salehi et al. [36] for button mushroom slices in the IR power range of 150–375 W, and Doymaz et al. [7] for jujube fruit in the IR power range of 62–125 W.
At constant temperature and IR power, the Deff showed an increment in the pretreatment mode (MW, US, and BL) as compared to the control. Variations and decreases in textural density and integrity after pretreatments promoted the moisture migration from the center to the surface, hence, the moisture will rapidly leave the product [17]. A comparison of different pretreatments (in both dryers) indicated that the MW and US pretreatment had the most and the least effects on the Deff. Microwaves make the product porous [37] and by increasing the thickness and inflating the product, opened the capillary tubes and facilitated the moisture transfer and consequently shortened the drying time compared to other pretreatments (US and BL). On the other hand, MW pretreatment enhances the sample heating due to the increase in the polarization of water molecules, followed by volumetric heating and heat generation inside the sample, which leads to a large pressure difference between the center and the surface. As a result, the texture of the product is more destroyed in the microwave pretreatment, promoting moisture loss during drying while rising the moisture diffusion coefficient [14].
The results also showed that the blanching pretreatment increased the moisture diffusion more than ultrasonic pretreatment. The reason is that blanching degrades the cell membrane resistance due to high temperature, hence, moisture can be transferred from the inside of the product to the outside at higher rates. This increased the diffusion coefficient of the product compared to the US treatment. Similarly, in a study on cranberry snacks in a microwave-vacuum dryer with ultrasonic and blanching pretreatment, it was found that the use of different pretreatments enhanced the Deff compared to the control samples [17]. Wang et al. [35] dried apple slices by microwave-vacuum dryer using different pretreatments (US, BL, and osmotic dehydration) and determined the value of Deff in the range of 1.64–3.46 × 10⁻⁸ m2/s. This indicates that the use of different pretreatments enhanced the Deff. Taghinezhad et al. [33] obtained the highest and lowest Deff of turnip drying as 1.007 × 10⁻⁹ to 8.11 × 10⁻⁹ m2/s using an IR-convective dryer with various pretreatments (the US, BL, and MW). They stated that the highest value of diffusion coefficient was obtained for MW pretreatment while the lowest value was observed in the control sample.

3.1.3. Specific Energy Consumption (SEC) of Convective and Infrared Drying of Terebinth

Table 3 lists the SEC of terebinth drying using the CV and IR dryers with various pretreatments. Using US, BL, and MW significantly reduced the SEC for both dryers (p < 0.05). Comparing the dryers and three pretreatments, it can be found that the lowest SEC (26.25 MJ/kg) was obtained for MW pretreatment and IR drying at 750 W. Whereas the highest SEC (142.58 MJ/kg) was also calculated in the control sample using a CV dryer at 50 °C.
As the inlet air temperature of the dryer increased, the SEC decreased for all pretreatments. As expected, a rise in the temperature incremented thermal gradient and mass transfer, giving rise to faster moisture exit and hence shorter drying time which decremented SEC [22].
It can be seen that the highest SEC was related to the method in which hot air was used without pretreatment. In the convective method of drying, all the energy from the hot air is not completely consumed for the process and a significant amount of that is wasted by the output flow. In the IR method, all the energy of the lamps is radiated directly to the sample and heats it. Therefore, there is no energy loss through the outlet valves [21]. These results are consistent with the studies by Onwude et al. [25] and Motevali and Tabatabaei [23].
In comparison between different pretreatments in both drying methods (CV and IR), the lowest energy consumption was for MW pretreatment. In the MW pretreatment, heat is generated in the entire product due to the absorption of waves by the moisture and the vibration of water molecules. This will resolve the problems related to thermal conductivity compared to US and BL and reduce the drying time [14].
Mierzwa et al. [38] dried raspberries using a CV dryer under different pretreatments and showed that the lowest SEC can be obtained in microwave pretreatment. In drying strawberries with IR-convective dryers under different pretreatments (MW, BL, and US) it was stated that the MW pretreatment had the lowest SEC [33]. In another study, Adabi et al. [31] dried blackberries using different dryers (CV, IR- CV, and IR) and pretreatments (BL, US, and MW). They concluded that microwave pretreatment can further reduce the energy consumption of all three dryers.

3.1.4. Energy Efficiency of Convective and Infrared Drying of Terebinth

As listed in Table 3, the highest energy efficiency was achieved at the IR power of 750 W with MW pretreatment while the lowest energy efficiency was observed at 50 °C in CV drying with no pretreatment. Increasing the temperature and IR power enhanced the energy efficiency. A rise in the temperature and IR power enhanced the moisture removal rate and shortened the drying time (Figure 1a–c) due to the thermal gradient between the product and the drying temperature. Consequently, the efficiency of the process will be increased [23]. On the other hand, comparing different pretreatments, it can be observed that the highest efficiency occurred upon applying microwave pretreatment. The lowest efficiency is seen in ultrasound pretreatment. For both dryers (CV and IR), the pretreatments improved energy efficiency as pretreatment increase the rate of textural destruction and accelerated the rate of moisture removal. Using ultrasonic and blanching changed (destruction) the product texture thus, no hard layer will be formed [33,39]. This is similar to the results obtained from drying turnips [33] and blackberries [14]. The researchers declared that with increasing temperature and IR power and using different pretreatments, energy efficiency showed an increasing trend.

3.2. Properties of Convective and Infrared Dried Terebinth

3.2.1. Effect of Pretreatments (US, BL, MW) Applied before Convective and Infrared Drying on Color of Terebinth

Color is one of the key factors, which is important for consumers [27,40]. Figure 2 shows the effect of temperature in CV drying, IR power in IR drying, and pretreatment method on the total color difference (ΔE). The highest ΔE (26.26) is related to the power of 250 W in the control sample. The IR method with MW pretreatment (compared to other pretreatments) exhibited the highest amount and rate of color changes. In this method, although the samples are placed in the dryer for a short time, the drying temperature used is so high that the non-enzymatic browning reaction is performed at high intensity resulting in the color changes [38]. The speed and intensity of color changes are much higher in drying with MW pretreatment. As microwave heating is non-uniform, the samples may burn during the process, leading to higher color changes in this pretreatment compared to the others. Szadzińska et al. [41] investigated the effect of microwave power and ultrasound on red beetroot drying and they indicated that high volume heating by the microwave cause high internal pressure inside the samples, which enhanced the color changes.
In all of the studied methods, the total color difference of the samples altered over time, although in some methods, the intensity of the changes was very high. The ΔE higher than 5 means the noticeable color change for the non-trained observer [27]. Thus the best case was when the ΔE was very low. The type of drying and pre-treatment can strongly affect the total color difference. According to Figure 2, the lowest color change (14.25), but still higher than 5, is related to CV drying at a temperature of 60 °C and the use of US pretreatment. This is because the process temperature is lower in these methods compared to the infrared methods, resulting in a lower Millard reaction intensity. Therefore, the samples dried by these methods had much better quality in terms of the color [42]. These results were consistent with the reports of Adabi et al. [31].
The total color difference decreased with increasing air temperature from 50 to 60 °C and infrared power from 250 to 500 W. One of the reasons is that low temperatures affect the properties of nutrients due to prolonging the drying time, hence, increasing the color changes of terebinth at low temperatures. Furthermore, with increasing temperature from 60 to 70 °C and infrared power from 500 to 750 W, because of the high temperature decomposes the pigment and enzymatic reactions are inhibited, while non-enzymatic browning reactions increment the color changes [43].

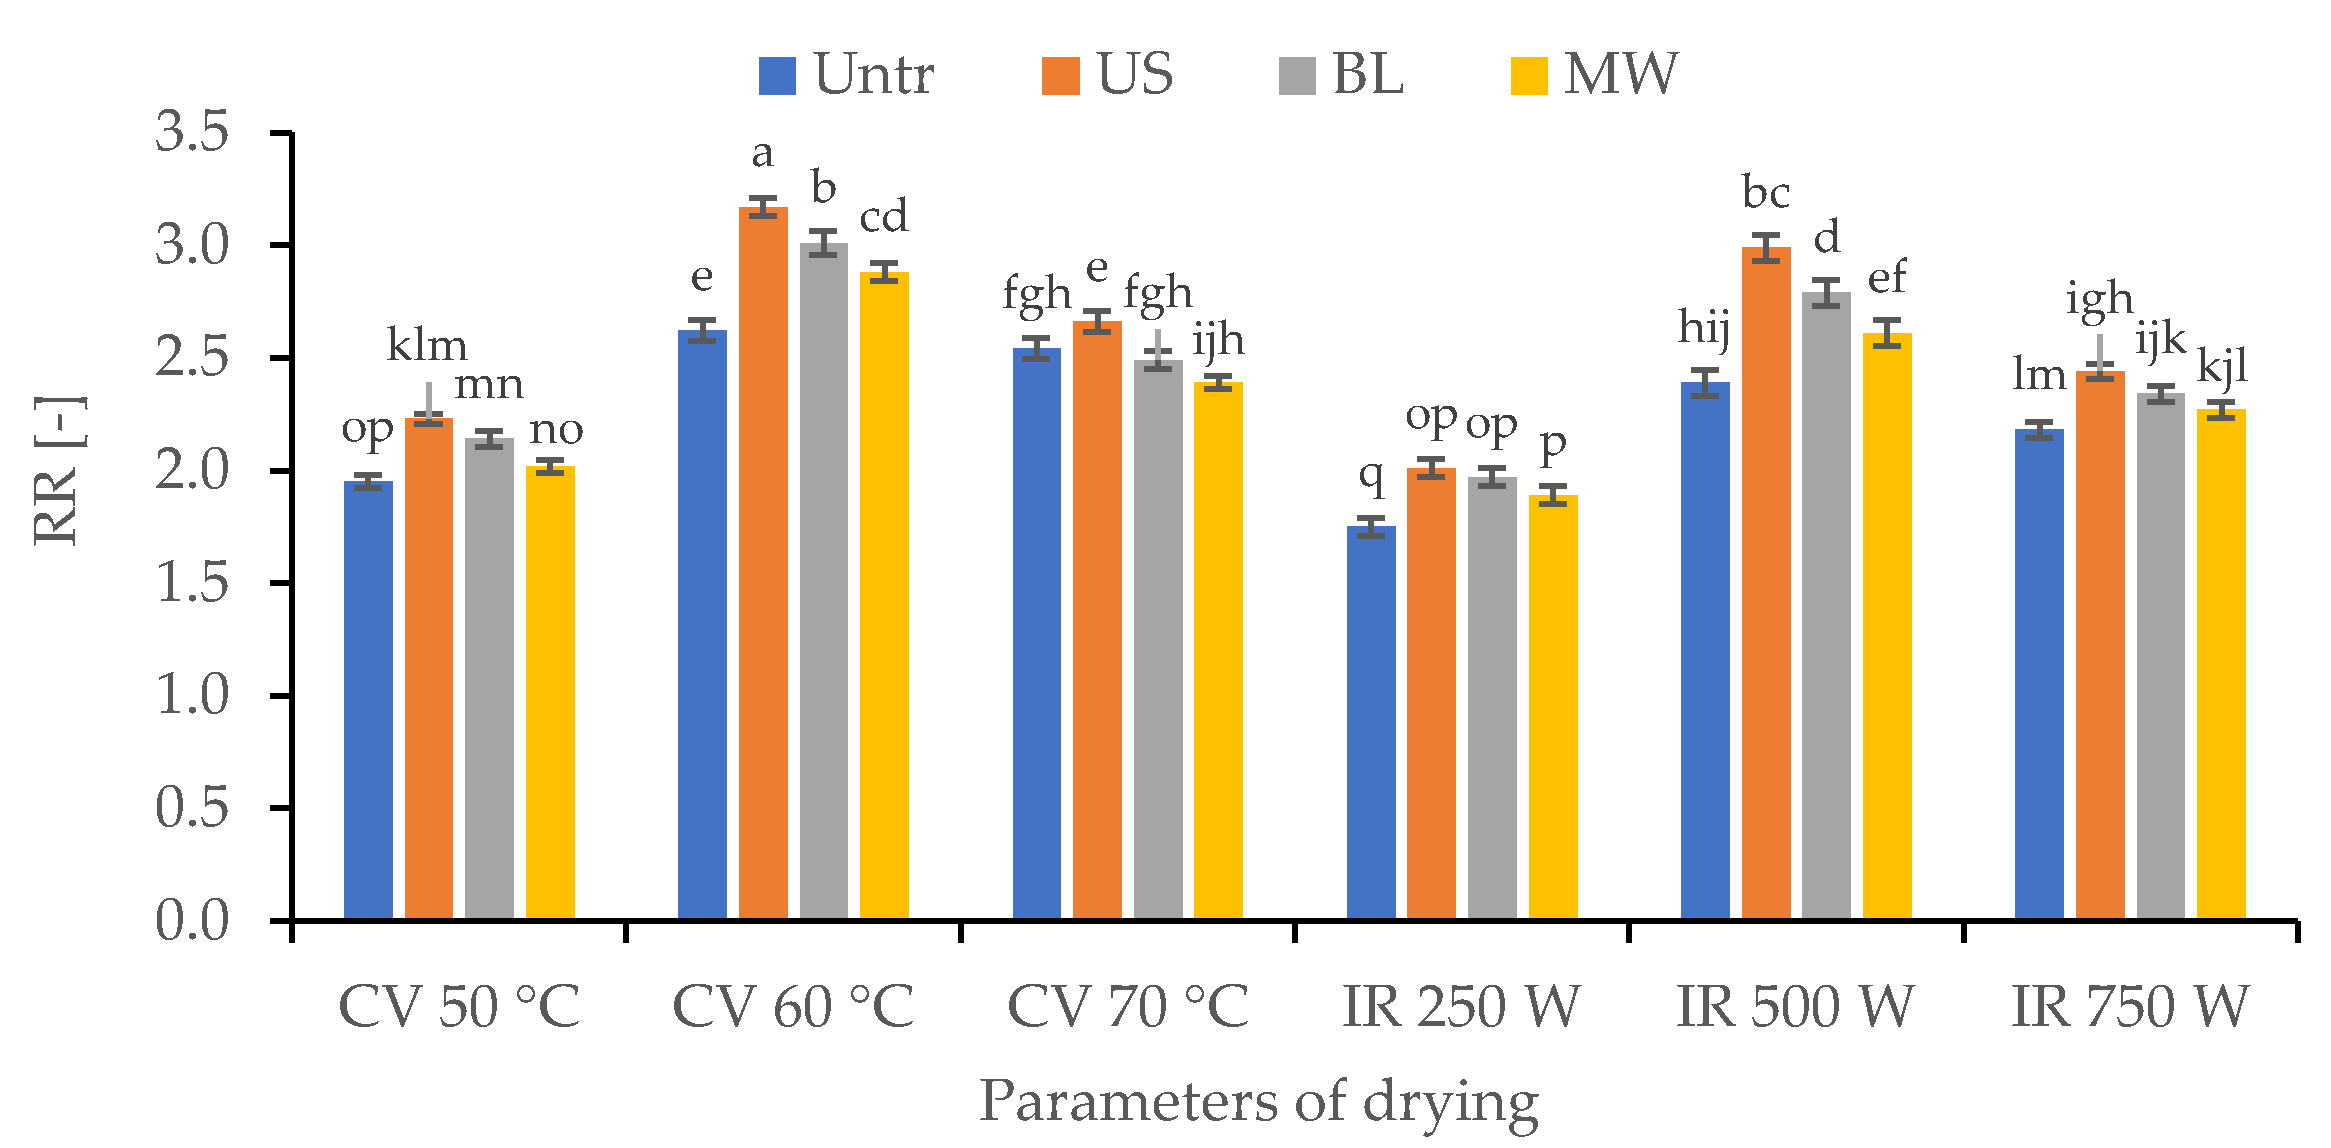
3.2.2. Effect of Pretreatments (US, BL, MW) Applied before Convective and Infrared Drying on Rehydration Rate (RR) of Terebinth

The rehydration properties of the dried material are very important [26]. Based on Table 2, the final rehydration rate of the samples dried by CV and IR with various pretreatments was statistically significant at 5%. According to Figure 3, the highest rehydration rate (3.17) was for the samples dried using a CV dryer at a temperature of 60 °C upon using US pretreatment. In this method, the water capacity was significantly higher at 60 °C when compared with 50 and 70 °C. This implies that the structural changes that destroyed the hydrophilic character of the samples were higher at 50 and 70 °C. These results are in line with the works of Briki et al. [44] on pomegranate arils.
The highest rehydration rate occurred for samples treated with the US, regardless of methods of drying and its parameters. Based on the study by Liu et al. [13], US pretreatment can enlarge the capillaries and loosen the internal structure of the product through cavitation and mechanical effects. Using US results in higher porosity and larger cell of the plant materials [45,46]. This phenomenon is useful to improve the water absorption of the samples. Tao et al. [6] also found that the use of US in drying while cabbage can improve the rehydration rate of the samples which can be due to the microstructural alterations by the application of ultrasound waves. Lagnika et al. [18] also proved that a pretreatment before the drying process can accelerate the rehydration rate process in dried apples. They also expressed that the use of ultrasound pretreatment can lead to higher rehydration rates. Similarly, studies of Fijalkowska et al. [26] confirmed that longer rehydration time of ultrasound treated and CV dried apples results in a higher rehydration rate.
Moreover, it can be observed that the lowest rehydration rate occurred upon using MW pretreatment as the terebinth structure was relatively destroyed. This was linked with the irreversible physical and chemical changes and cellular deformation, which hindered the rehydration rate compared to the other two pretreatments (BL and US).
A comparison of the results indicated that the lowest rehydration rate (1.75) occurred in the infrared method at a power of 250 W with no pretreatment. Thus the main factors in reducing the rehydration rate in this method are shrinkage, loss of cells, and long drying time.

3.2.3. Effect of Pretreatments (US, BL, MW) Applied before Convective and Infrared Drying on pH of Terebinth

According to the results of Table 4, the highest pH value (3.96) was observed at 70 °C without pretreatment whereas the lowest pH (3.77) was obtained in microwave pretreatment and infrared drying at the power of 750 W. Some researchers attribute the higher acidity in dried samples at higher temperatures to less drying time and therefore less involvement of organic acids in the respiration process [47].

3.2.4. Effect of Pretreatments (US, BL, MW) Applied before Convective and Infrared Drying on Total Phenol (TPC) and Flavonoid Contents (TFC) of Terebinth

According to Table 4, among different drying methods and pretreatments, the convective drying at 60 °C with ultrasonic pretreatment led to the highest phenolic and flavonoid contents (153.35 mg GAE/g d.m. and 49.24 mg QE/g d.m., respectively) while the lowest phenolic and flavonoid contents (78.376 mg GAE/g d.m. and 49.24 mg QE/g d.m, respectively) were observed in samples dried by IR dryer at a power of 250 W and without pretreatment. One of the most important factors influencing the variations of total phenol and flavonoid in convective drying could be the activation of enzymes such as polyphenol oxidase at 60 °C, which caused the browning reaction. Drying at high temperatures also destroyed the enzymes faster [48].
In the study of Barani et al. [49], the antioxidant activity of roses with low frequency ultrasonic was higher than that of roses dried by high-frequency ultrasonic pretreatment. Thermal pretreatments, especially at high temperatures, reduced the phenolic content and quality of roses. In another study on the effect of ultrasonic and blanching pretreatments on apple fruit, it was shown that ultrasonic pretreatment increased these compounds in dried apple fruit compared to blanching pretreatment [18]. Similarly, for onion, ultrasonic pretreatment and blanching showed significant effects on phenolic compounds, but ultrasonic pretreatment recorded a higher content [12]. Some researchers have confidence that the reason for the increase in these compounds is the formation of pores in the product which led to more extraction of these compounds [1,2,16]. Furthermore, another reason for the increase in phenolic and flavonoid compounds under the heat process is linked to the destruction of plant cell walls and the release of phenolic and flavonoid compounds by the thermal process [1,46]. However, some researchers have considered microwave pretreatments to be more effective, such as Haya et al. [50], which reported an increment of phenolic compounds upon enhancing MW power and time.

4. Conclusions

The present study investigated the effect of microwave, blanching, and ultrasonic pretreatments on drying time and kinetics, effective moisture diffusion coefficient, specific energy consumption, color, rehydration rate, total phenol content, and total flavonoid content of terebinth dried by infrared (IR) and convective (CV) dryers. Comparing the two drying methods (IR and CV), the IR method had a shorter drying time and lower specific energy consumption (SEC), higher energy efficiency, and diffusion coefficient, while the CV method offered products with higher phenol and flavonoid contents, better color quality, and higher rehydration rate. Different pretreatments had different effects on these parameters. Moreover, ultrasound could better preserve the color, total phenol content, and total flavonoid content, and its rehydration rate was higher than the other pretreatments. The drying time and SEC were the lowest in the microwave pretreatment. The highest rehydration rate, phenol, and flavonoid contents and the lowest color variations were observed in the samples undergoing ultrasonic pretreatment at 60 °C. Meanwhile, the lowest drying time and SEC and the highest drying efficiency and rehydration rate were recorded in the microwave pretreatment upon using an infrared dryer at 750 W. Noteworthy, the ultrasonic pretreatment can provide a unique opportunity to produce high-quality products rich in phenol and flavonoids contents.

Author Contributions

Conceptualization, M.K. and Y.A.-G.; methodology, M.K. and E.K.; software, M.K. and H.F.; validation, M.K. and H.F.; formal analysis, M.K. and E.K.; investigation, M.K.; resources, Y.A.-G.; data curation, M.K. and H.F.; writing—original draft preparation, M.K. and M.N.; writing—review and editing, M.N. and D.W.-R.; visualization, M.K. and M.N.; supervision, D.W.-R. All authors have read and agreed to the published version of the manuscript.

Funding

This research was funded by the office of vice chancellor for research at Mohaghegh Ardabili University (Grant number: 99-D-9-16084).

Institutional Review Board Statement

Not applicable.

Informed Consent Statement

Not applicable.

Data Availability Statement

The data presented in this study are available on request from the corresponding author.

Acknowledgments

The authors are highly thankful to the Department of Agricultural Technology Engineering, Mohaghegh Ardabili University, Ardabil, Iran for providing facilities to conduct this research work.

Conflicts of Interest

The authors declare no conflict of interest.

References

  1. Abbaspour-Gilandeh, Y.; Kaveh, M.; Fatemi, H.; Hernández-Hernández, J.L.; Fuentes-Penna, A.; Hernández-Hernández, M. Evaluation of the changes in thermal, qualitative, and antioxidant properties of terebinth (pistacia atlantica) fruit under different drying methods. Agronomy 2020, 10, 1378. [Google Scholar] [CrossRef]
  2. Kaveh, M.; Abbaspour-Gilandeh, Y.; Taghinezhad, E.; Witrowa-Rajchert, D.; Nowacka, M. The quality of infrared rotary dried terebinth (pistacia atlantica L.)-optimization and prediction approach using response surface methodology. Molecules 2021, 26, 1999. [Google Scholar] [CrossRef]
  3. Vidinamo, F.; Fawzia, S.; Karim, M.A. Effect of drying methods and storage with agro-ecological conditions on phytochemicals and antioxidant activity of fruits: A review. Crit. Rev. Food Sci. Nutr. 2020, 60, 1–9. [Google Scholar] [CrossRef]
  4. Adak, N.; Heybeli, N.; Ertekin, C. Infrared drying of strawberry. Food Chem. 2017, 219, 109–116. [Google Scholar] [CrossRef]
  5. Ghanem, N.; Mihoubi, D.; Bonazzi, C.; Kechaou, N.; Boudhrioua, N. Drying characteristics of lemon by-product (citrus limon. v. lunari): Effects of drying modes on quality attributes kinetics’. Waste Biomass Valoriz. 2020, 11, 303–322. [Google Scholar] [CrossRef]
  6. Tao, Y.; Han, M.; Gao, X.; Han, Y.; Show, P.L.; Liu, C.; Ye, X.; Xie, G. Applications of water blanching, surface contacting ultrasound-assisted air drying, and their combination for dehydration of white cabbage: Drying mechanism, bioactive profile, color and rehydration property. Ultrason. Sonochem. 2019, 53, 192–201. [Google Scholar] [CrossRef] [PubMed]
  7. Doymaz, İ.; Karasu, S.; Baslar, M. Effects of infrared heating on drying kinetics, antioxidant activity, phenolic content, and color of jujube fruit. J. Food Meas. Charact. 2016, 10, 283–291. [Google Scholar] [CrossRef]
  8. Rashid, M.T.; Ma, H.; Jatoi, M.A.; Wali, A.; El-Mesery, H.S.; Ali, Z.; Sarpong, F. Effect of infrared drying with multifrequency ultrasound pretreatments on the stability of phytochemical properties, antioxidant potential, and textural quality of dried sweet potatoes. J. Food Biochem. 2019, 43, e12809. [Google Scholar] [CrossRef] [PubMed]
  9. Kentish, S.; Ashokkumar, M. The physical and chemical effect of ultrasound. In Ultrasound Technologies for Food and Bioprocessing; Feng, H., Barosa-Canovas, G.V., Weiss, J., Eds.; Springer: New York, NY, USA, 2011; pp. 1–12. ISBN 9781441974716. [Google Scholar]
  10. Dadan, M.; Nowacka, M.; Wiktor, A.; Sobczynska, A.; Witrowa-Rajchert, D. Ultrasound to improve drying processes and prevent thermolabile nutrients degradation. In Design and Optimization of Innovative Food Processing Techniques Assisted by Ultrasound; Barba, F.J., Cravotto, G., Chemat, F., Lorenzo Rodriguez, J.M., Munekata, P.E.S., Eds.; Elsevier Academic Press: London, UK, 2021; pp. 55–110. ISBN 978-0-12-818275-8. [Google Scholar]
  11. Nowacka, M.; Dadan, M.; Tylewicz, U. Current applications of ultrasound in fruit and vegetables osmotic dehydration processes. Appl. Sci. 2021, 11, 1269. [Google Scholar] [CrossRef]
  12. Ren, F.; Perussello, C.A.; Zhang, Z.; Kerry, J.P.; Tiwari, B.K. Impact of ultrasound and blanching on functional properties of hot-air dried and freeze dried onions. LWT Food Sci. Technol. 2018, 87, 102–111. [Google Scholar] [CrossRef] [Green Version]
  13. Liu, Y.; Zeng, Y.; Wang, Q.; Sun, C.; Xi, H. Drying characteristics, microstructure, glass transition temperature, and quality of ultrasound-strengthened hot air drying on pear slices. J. Food Process. Preserv. 2019, 43, e13899. [Google Scholar] [CrossRef]
  14. Kaveh, M.; Taghinezhad, E.; Aziz, M. Effects of physical and chemical pretreatments on drying and quality properties of blackberry (Rubus spp.) in hot air dryer. Food Sci. Nutr. 2020, 8, 3843–3856. [Google Scholar] [CrossRef]
  15. Rybak, K.; Parniakov, O.; Samborska, K.; Wiktor, A.; Witrowa-Rajchert, D.; Nowacka, M. Energy and quality aspects of freeze-drying preceded by traditional and novel pre-treatment methods as exemplified by red bell pepper. Sustainability 2021, 13, 2035. [Google Scholar] [CrossRef]
  16. Wiktor, A.; Sledz, M.; Nowacka, M.; Rybak, K.; Witrowa-Rajchert, D. The influence of immersion and contact ultrasound treatment on selected properties of the apple tissue. Appl. Acoust. 2016, 103, 136–142. [Google Scholar] [CrossRef]
  17. Nowacka, M.; Wiktor, A.; Anuszewska, A.; Dadan, M.; Rybak, K.; Witrowa-rajchert, D. The application of unconventional technologies as pulsed electric field, ultrasound and microwave-vacuum drying in the production of dried cranberry snacks. Ultrason. Sonochem. 2019, 56, 1–13. [Google Scholar] [CrossRef]
  18. Lagnika, C.; Amoussa, A.M.O.; Sanni, A.; Lagnika, L. Effect of blanching and ultrasound on drying time, physicochemical and bioactive compounds of dried cashew apple. Am. J. Food Sci. Technol. 2019, 7, 227–233. [Google Scholar] [CrossRef]
  19. Jafarifar, M.; Chayjan, R.A.; Dibagar, N.; Alaei, B. Modeling some engineering properties of walnut kernel undergoing different drying methods with microwave pretreatment. Qual. Assur. Saf. Crop. Foods 2017, 9, 463–478. [Google Scholar] [CrossRef]
  20. Kaveh, M.; Abbaspour-gilandeh, Y.; Nowacka, M. Comparison of different drying techniques and their carbon emissions in green peas. Chem. Eng. Process. Process Intensif. 2021, 160, 108274. [Google Scholar] [CrossRef]
  21. Motevali, A.; Minaei, S.; Banakar, A.; Ghobadian, B.; Khoshtaghaza, M.H. Comparison of energy parameters in various dryers. Energy Convers. Manag. 2014, 87, 711–725. [Google Scholar] [CrossRef]
  22. Kaveh, M.; Abbaspour-Gilandeh, Y.; Chen, G. Drying kinetic, quality, energy and exergy performance of hot air-rotary drum drying of green peas using adaptive neuro-fuzzy inference system. Food Bioprod. Process. 2020, 124, 168–183. [Google Scholar] [CrossRef]
  23. Motevali, A.; Tabatabaee, S.R. A comparison between pollutants and greenhouse gas emissions from operation of different dryers based on energy consumption of power plants. J. Clean. Prod. 2017, 154, 445–461. [Google Scholar] [CrossRef]
  24. Ghanbarian, D.; Torki-Harchegani, M.; Sadeghi, M.; Pirbalouti, A.G. Ultrasonically improved convective drying of peppermint leaves: Influence on the process time and energetic indices. Renew. Energy 2020, 153, 67–73. [Google Scholar] [CrossRef]
  25. Onwude, D.I.; Hashim, N.; Abdan, K.; Janius, R.; Chen, G. Investigating the influence of novel drying methods on sweet potato (Ipomoea batatas L.): Kinetics, energy consumption, color, and microstructure. J. Food Process Eng. 2018, 41, e12686. [Google Scholar] [CrossRef]
  26. Fijalkowska, A.; Nowacka, M.; Witrowa-Rajchert, D. The physical, optical and reconstitution properties of apples subjected to ultrasound before drying. Ital. J. Food Sci. 2017, 29, 343–356. [Google Scholar]
  27. Dadan, M.; Nowacka, M. The assessment of the possibility of using ethanol and ultrasound to design the properties of dried carrot tissue. Appl. Sci. 2021, 11, 689. [Google Scholar] [CrossRef]
  28. Rybak, K.; Wiktor, A.; Witrowa-rajchert, D.; Parniakov, O.; Nowacka, M. The quality of red bell pepper subjected to freeze-drying preceded by traditional and novel pretreatment. Foods 2021, 10, 226. [Google Scholar] [CrossRef]
  29. Tylewicz, U.; Nowacka, M.; Rybak, K.; Drozdzal, K.; Dalla Rosa, M.; Mozzon, M. Design of healthy snack based on kiwifruit. Molecules 2020, 25, 1–13. [Google Scholar] [CrossRef] [PubMed]
  30. Tayyab Rashid, M.; Ahmed Jatoi, M.; Safdar, B.; Wali, A.; Muhammad Aadil, R.; Sarpong, F.; Ma, H. Modeling the drying of ultrasound and glucose pretreated sweet potatoes: The impact on phytochemical and functional groups. Ultrason. Sonochem. 2020, 68, 105226. [Google Scholar] [CrossRef] [PubMed]
  31. Adabi, M.E.; Motevali, A.; Nikbakht, A.M.; Khoshtaghaza, M.H. Investigation of some pretreatments on energy and specific energy consumption drying of black mulberry. Chem. Ind. Chem. Eng. Q. 2013, 19, 89–105. [Google Scholar] [CrossRef]
  32. Jafari, F.; Movagharnejad, K.; Sadeghi, E. Infrared drying effects on the quality of eggplant slices and process optimization using response surface methodology. Food Chem. 2020, 333, 127423. [Google Scholar] [CrossRef]
  33. Taghinezhad, E.; Kaveh, M.; Szumny, A. Optimization and prediction of the drying and quality of turnip slices by convective-infrared dryer under various pretreatments by RSM and ANFIS METHODS. Foods 2021, 10, 284. [Google Scholar] [CrossRef] [PubMed]
  34. Sledz, M.; Wiktor, A.; Rybak, K.; Nowacka, M.; Witrowa-Rajchert, D. The impact of ultrasound and steam blanching pre-treatments on the drying kinetics, energy consumption and selected properties of parsley leaves. Appl. Acoust. 2016, 103, 148–156. [Google Scholar] [CrossRef]
  35. Wang, Y.; Zhao, H.; Deng, H.; Song, X.; Zhang, W.; Wu, S.; Wang, J. Influence of pretreatments on microwave vacuum drying kinetics, physicochemical properties and sensory quality of apple slices. Pol. J. Food Nutr. Sci. 2019, 69, 297–306. [Google Scholar] [CrossRef]
  36. Salehi, F.; Kashaninejad, M.; Jafarianlari, A. Drying kinetics and characteristics of combined infrared-vacuum drying of button mushroom slices. Heat Mass Transf. 2017, 53, 1751–1759. [Google Scholar] [CrossRef]
  37. Witrowa-Rajchert, D.; Rzaca, M. Effect of drying method on the microstructure and physical properties of dried apples. Dry. Technol. 2009, 27, 903–909. [Google Scholar] [CrossRef]
  38. Mierzwa, D.; Szadzińska, J.; Pawłowski, A.; Kharaghani, A. Nonstationary convective drying of raspberries, assisted by microwaves and ultrasound. Dry. Technol. 2019, 37, 988–1001. [Google Scholar] [CrossRef]
  39. Wiktor, A.; Nowacka, M.; Anuszewska, A.; Rybak, K.; Dadan, M.; Witrowa-Rajchert, D. Drying kinetics and quality of dehydrated cranberries pretreated by traditional and innovative techniques. J. Food Sci. 2019, 84, 1820–1828. [Google Scholar] [CrossRef] [PubMed]
  40. Nowacka, M.; Tylewicz, U.; Tappi, S.; Siroli, L.; Lanciotti, R.; Romani, S.; Witrowa-Rajchert, D. Ultrasound assisted osmotic dehydration of organic cranberries (Vaccinium oxycoccus): Study on quality parameters evolution during storage. Food Control 2018, 93, 40–47. [Google Scholar] [CrossRef]
  41. Szadzińska, J.; Mierzwa, D.; Pawłowski, A.; Pashminehazar, R.; Kharaghani, A. Ultrasound- and microwave-assisted intermittent drying of red beetroot. Dry. Technol. 2019, 38, 93–107. [Google Scholar] [CrossRef]
  42. Ahmadi, M.; Reza, G.; Chayjan, A. Modeling engineering characteristics of hazelnut kernel during infrared fluidized bed drying. J. Food Meas. Charact. 2017, 11, 460–478. [Google Scholar] [CrossRef]
  43. Zeng, Y.; Liu, Y.; Zhang, J.; Xi, H.; Duan, X. Effects of far-infrared radiation temperature on drying characteristics, water status, microstructure and quality of kiwifruit slices. J. Food Meas. Charact. 2019, 13, 3086–3096. [Google Scholar] [CrossRef]
  44. Briki, S.; Zitouni, B.; Bechaa, B.; Amiali, M. Comparison of convective and infrared heating as means of drying pomegranate arils (Punica granatum L.). Head Mass Transf. 2019, 55, 3189–3199. [Google Scholar] [CrossRef]
  45. Nowacka, M.; Tappi, S.; Tylewicz, U.; Luo, W.; Rocculi, P.; Wesoły, M.; Ciosek-Skibińska, P.; Dalla Rosa, M.; Witrowa-Rajchert, D. Metabolic and sensory evaluation of ultrasound-assisted osmo-dehydrated kiwifruit. Innov. Food Sci. Emerg. Technol. 2018, 50, 26–33. [Google Scholar] [CrossRef]
  46. Nowacka, M.; Wedzik, M. Effect of ultrasound treatment on microstructure, colour and carotenoid content in fresh and dried carrot tissue. Appl. Acoust. 2016, 103, 163–171. [Google Scholar] [CrossRef]
  47. Valero, D.; Serrano, M. Postharvest Biology and Technology For Preserving Fruit Quality; Valero, D., Valero, D., Eds.; CRC Press Taylor & Francis Group: Boca Raton, FL, USA, 2010; ISBN 9781439802670. [Google Scholar]
  48. Guo, L.; Lan, N.; Li, H.; Xiang, P.; Kan, H. Effect of hot air drying temperature on the quality and antioxidant activity of Boletus edulis Bull.: Fr. J. Food Process. Preserv. 2021, 45, e15540. [Google Scholar] [CrossRef]
  49. Barani, Y.H.; Zhang, M.; Wang, B. Effect of thermal and ultrasonic pretreatment on enzyme inactivation, color, phenolics and flavonoids contents of infrared freeze-dried rose flower. J. Food Meas. Charact. 2021, 15, 995–1004. [Google Scholar] [CrossRef]
  50. Hayat, K.; Zhang, X.; Farooq, U.; Abbas, S.; Xia, S.; Jia, C. Effect of microwave treatment on phenolic content and antioxidant activity of citrus mandarin pomace. Food Chem. 2010, 123, 423–429. [Google Scholar] [CrossRef]
Figure 1. Changes in the moisture ratio of terebinth drying using ultrasound and blanching pretreatments in (a) convective dryer; (b) infrared dryer; (c) using microwave pretreatment in convective and infrared dryers.
Applsci 11 07672 g001
Figure 2. Effect of different pretreatments (Untr: control, US: ultrasonic, BL: blanching, MW: microwave) and different conditions of drying methods temperature (50, 60 and 70 °C) for CV drying and infrared power (250, 500, and 750 W) on the total color difference of dried terebinth. Bars show the differences between the sample with three replicates and the different letters differ significantly from each other at (p < 0.05) as determined by the LSD test.
Applsci 11 07672 g002
Figure 3. Effect of different pretreatments (Untr: control, US: ultrasonic, BL: blanching, MW: microwave) and different conditions of drying methods temperature (50, 60, and 70 °C) for CV drying and infrared power (250, 500, and 750 W) on rehydration rate (RR) of dried terebinth. Bars show the differences between the sample with six replicates and the different letters differ significantly from each other at (p < 0.05) as determined by the LSD test.
Applsci 11 07672 g003
Table 1. Special energy consumption equations in hot and infrared air dryers with different pretreatments.
Pretreatment + DryerEquationsNumber of EquationReference
UNTR + CV   SEC CV = EU m e c   +   t e r / M w (15) [20]
MW + CV SEC M W +   SEC CV =   Equation   6   +   Equation   13 (16) [21]
US + CV SEC US + SEC CV =   Equation   7   +   Equation   13 (17) [24]
BL + CV SEC BL + SEC CV =   Equation   8   +   Equation   13 (18) [14]
UNTR + IR SEC IR = K · t / M w (19) [25]
MW + IR SEC MW + SEC IR =   Equation   6   +   Equation   14 (20) [22]
US + IR SEC US + SEC IR = Equation   7   +   Equation   14 (21) [23]
BL + IR SEC BL + SEC IR = Equation   8   +   Equation   14 (22) [23]
Table 2. Analysis of variance (ANOVA) for the effect of pretreatments and different condition of two drying methods on time, effective moisture diffusivity coefficient (Deff), specific energy consumption SEC, energy efficiency (ήe), the total color difference (ΔE), RR, TPC, TFC, and pH of terebinth.
Source of VariationTimeDeffSECήeΔERRTPCTFCpH
Pretreatments266.63 **2.65 × 10⁻²⁰ **7351.68 **152.36 **167.04 **0.396 **27.78 **353.03 **0.014 **
Condition1326.76 **4.362 × 10⁻¹⁷ **9716.76 **126.80 **26.63 **1.73 **4.35 **1404.9 **0.004 **
P × C11.28 **4.36 × 10⁻¹⁷ **182.9488 **1.2488 **1.400 **0.024 **0.08 **5.05 **0.005 **
Error79.172.65 × 10−20142.840.070.7390.00517.520.890.00
CV5.626.084.334.6004.303.0443.222.940.17
** Significant at 1% probability level. P—Pretreatments; C—Condition, df—Degree of freedom.
Table 3. Results of time, effective moisture diffusivity coefficient (Deff), specific energy consumption (SEC), and energy efficiency (ήe) of terebinth samples under different pretreatments and different conditions of drying methods.
PretreatmentDrying ParametersTime [min]Deff [m2/s]SEC [MJ/kg]ήe [%]
UNTRCV 50 °C345 a ± 8.666.53 × 10−10 n ± 6.3509 × 10−11142.58 a ± 3.290.99 q ± 0.10
CV 60 °C185 f ± 5.771.23 × 10−9 ij ± 5.20 × 10−11103.76 ed ± 2.432.21 p ± 0.10
CV 70 °C90 i ± 2.883.28 × 10−9 e ± 1.2702 × 10−1063.76 j ± 2.064.54 l ± 0.08
IR 250 W275 c ± 8.668.50 × 10−10 lmn ± 8.0829 × 10−11103.12 ed ± 1.402.18 p ± 0.18
IR 500 W160 g ± 5.771.62 × 10−9 gh ± 1.0392 × 10−1080.00 h ± 1.733.76 mh ± 0.17
IR 750 W70 kl ± 2.883.73 × 10−9 d ± 1.5588 × 10−1052.50 l ± 1.078.59 f ± 0.24
USCV 50 °C310 b ± 5.777.40 × 10−10 mn ± 4.0415 × 10−11134.78 b ± 2.821.34 q ± 0.08
CV 60 °C175 f ± 2.881.41 × 10−9 ih ± 6.3527 × 10−11104.81 b ± 2.303.05 o ± 0.10
CV 70 °C80 ijk ± 5.773.73 × 10−9 d ± 9.2376 × 10−1163.34 d ± 1.725.80 ij ± 0.09
IR 250 W265 cd ± 5.779.50 × 10−10 klm ± 9.8148 × 10−1199.37 j ± 1.212.27 p ± 0.15
IR 500 W150 gh ± 2.881.77 × 10−9 lmn ± 9.2376 × 10−1175.00 ef ± 1.665.01 k ± 0.20
IR 750 W60 lm ± 5.224.30 × 10−9 c ± 1.6743 × 10−1045.00 ih ± 1.1410.03 d ± 0.22
BLCV 50 °C300 b ± 778.24 × 10⁻¹⁰ c ± 4.6188 × 10−11127.12 m ± 2.541.84 p ± 0.09
CV 60 °C155 g ± 5.771.62 × 10−9 lmn ± 5.1962 × 10−1190.07 c ± 2.464.12 lm ± 0.09
CV 70 °C75 ± 2.884.47 × 10−9 gh ± 6.3509 × 10−1156.27 g ± 1.886.21 ih ± 0.12
IR 250 W255 d ± 5.771.04 × 10−9 c ± 6.9281 × 10−1195.62 f ± 1.463.54 n ± 0.19
IR 500 W140 h ± 5.772.10 × 10−9 jkl ± 9.815 × 10−1170.00 i ± 1.206.44 h ± 0.22
IR 750 W55 m ± 2.885.13 × 10−9 f ± 1.3856 × 10−1041.25 mn ± 1.2810.94 c ± 0.24
MWCV 50 °C230 e ± 5.771.15 × 10−9 b ± 5.1962 × 10−1178.25 h ± 2.335.44 kj ± 0.09
CV 60 °C90 i ± 2.883.24 × 10−9 ijk ± 6.9282 × 10−1142.59 mn ± 1.879.21 e ± 0.08
CV 70 °C55 m ± 2.885.25 × 10−9 e ± 6.3509 × 10−1133.38 o ± 1.6611.42 b ± 0.12
IR 250 W160 g ± 5.771.61 × 10−9 b ± 8.0829 × 10−1160.0 jk ± 1.217.52 g ± 0.18
IR 500 W85 ij ± 2.883.83 × 10−9 gh ± 1.0392 × 10−1039.25 n ± 1.3410.62 c ± 0.17
IR 750 W35 n ± 2.889.77 × 10−9 a ± 1.2702 × 10−1026.25 p ± 1.4017.19 a ± 0.16
Different letters differ significantly from each other at (p < 0.05) as determined by the LSD test.
Table 4. Results of time, effective moisture diffusivity coefficient (Deff), specific energy consumption (SEC), and energy efficiency (ήe) of terebinth samples under different pretreatments and different conditions of drying methods.
PretreatmentDrying ParameterspH
[-]
TPC
[mg GAE/g d.m.]
TFC
[mg QE/g d.m.]
UNTRCV 50 °C3.83 k ± 0.01124.46 ijk 2.3731.17 g ± 0.51
CV 60 °C3.88 ih ± 0.01142.54 cd ± 1.2937.78 de ± 0.34
CV 70 °C3.96 a ± 0.01136.34 defgh ± 2.9535.39 f ± 0.62
IR 250 W3.91 ef ± 0.01101.07 k ± 2.3710.73 l ± 0.52
IR 500 W3.93 cd ± 0.01118.61 lk ± 2.0723.78 i ± 0.35
IR 750 W3.94 ab ± 0.01110.54 m ± 2.5618.94 j ± 0.57
USCV 50 °C3.94 bc ± 0.01138.54 cdef ± 3.5842.42 c ± 0.64
CV 60 °C3.92 de ± 0.01153.35 a ± 1.7249.24 a ± 0.45
CV 70 °C3.89 gh ± 0.01141.08 cde ± 2.5245.21 b ± 0.51
IR 250 W3.92 de ± 0.01121.12 jkl ± 2.6518.21 j ± 0.60
IR 500 W3.90 fg ± 0.01133.83 fgh ± 1.8737.89 ed ± 0.47
IR 750 W3.88 ih ± 0.01124.21 ijk ± 2.3026.36 h ± 0.45
BLCV 50 °C3.95 ab ± 0.01134.49 efgh ± 2.8039.33 d ± 0.66
CV 60 °C3.90 gf ± 0.01150.34 ab ± 2.3746.68 b ± 0.52
CV 70 °C3.92 de ± 0.01139.99 cdef ± 2.2341.98 c ± 0.77
IR 250 W3.90 fg ± 0.04119.24 jkl ± 2.8918.12 j ± 1.07
IR 500 W3.87 i ± 0.01129.67 ih ± 2.2435.23 p ± 0.88
IR 750 W3.87 i ± 0.01122.22 jk ± 2.3724.24 i ± 0.81
MWCV 50 °C3.90 gf ± 0.01130.08 igh ± 2.9036.65 ef ± 1.21
CV 60 °C3.85 j ± 0.01144.45 bc ± 2.2442.68 c ± 1.05
CV 70 °C3.88 ih ± 0.01136.6 def ± 1.7238.89 d ± 1.01
IR 250 W3.90 gf ± 0.01115.15 lm ± 2.5916.29 k ± 0.99
IR 500 W3.80 l ± 0.01125.66 ij ± 2.3730.19 g ± 0.89
IR 750 W3.77 m ± 0.01120.29 jkl ± 1.8022.94 i ± 0.51
Different letters differ significantly from each other at (p < 0.05) as determined by the LSD test.
Publisher’s Note: MDPI stays neutral with regard to jurisdictional claims in published maps and institutional affiliations.

