
BiOBr Precursor Solutions Modified Cement Paste: The Photocatalytic Performance and Effects
by
Zhi Geng
1, 
Lina Zhang
1,
Jin Wang
2,
Yanfeng Yu
2,
Guoling Zhang
2,
Xin Cheng
1,* and
Dan Wang
1,* 1
Shandong Provincial Key Laboratory of Preparation and Measurement of Building Materials, University of Jinan, Jinan 250022, China
2
Winbond Construction Group Co., Ltd., Qingzhou 262500, China
*
Authors to whom correspondence should be addressed.
Crystals 2021, 11(8), 969; https://doi.org/10.3390/cryst11080969
Submission received: 25 July 2021
/
Revised: 6 August 2021
/
Accepted: 12 August 2021
/
Published: 17 August 2021
(This article belongs to the Special Issue Photocatalytic Performance of Semiconducting Materials)
Abstract
:The potential of photocatalysts modified cement-based materials in degrading environmental pollutants is evident in previous studies, but the application of photocatalytic cement-based materials still appears limited in actual practice due to the dispersion effect. This work seeks to prepare photocatalytic cement paste by mixing cement with BiOBr precursor solutions in terms of the improvement of dispersion efficiency, and additional hydrothermal conditions provided by autoclaved curing period are required to activate the photocatalytic activity of photocatalysts crystals. The presence of BiOBr precursor solutions results in an increase of RhB degradation rate of up to 45.4% and the NOx removal efficiency was up to 4.4%, and the formation of BiOBr photocatalysts crystals is the main reason for photocatalytic performance enhancement. The morphology of photocatalysts and the pore size distribution of cement paste also contribute to the photocatalytic activity enhancement by the exposed surface of photocatalysts, which are supported by the analyses of Scanning Electron Microscope and Mercury Intrusion Porosimetry results. A new mechanism is suggested to explain the synergistic role of crystals and microstructure on the enhancement of photocatalytic activity with the extension of autoclaved curing time. As supports for photocatalysts, the development changes of compressive strength of cement paste are also discussed.
1. Introduction
The challenge to maintain air quality has become ever more pressing and acute in modern cities worldwide, with oxides of nitrogen (mainly NO and NO2) from vehicles or other combustion emissions exceeding the limit values, becoming a global issue [1]. Furthermore, the increasing exposed facades of buildings are at high risk of massive solid pollutants invasion, and these structures must be cleaned periodically for the aesthetic surface; furthermore, these solid pollutants may aggravate the deterioration process of the cement structure [2]. In this context, photocatalytic modification of cement-based materials, as the most widely used construction materials and a photocatalysts support, has been the subject of several feasible strategies to tackle these two important issues.
However, despite the incorporation of photocatalysts particles endowing the cement-based materials with excellent photocatalytic properties in air purification [3,4,5], self-cleaning [6], and self-sterilizing [7], the widespread application of photocatalytic technology in civil engineering practices is still somewhat limited. On the one hand, the homogeneous dispersion of photocatalysts particles in cement is challenging due to the agglomeration. A highly alkaline and calcium-rich cement environment can promote agglomeration, and cement hydrates deposited on the surface may occlude underlying photocatalysts clusters [8,9,10]. On the other hand, the limited visible light absorption and high electron–hole recombination of traditional photocatalysts may hinder value-added photocatalytic function to the cement-based materials [11,12]. The high surface energy of nanoparticles is the main reason for their agglomeration, and some physical and chemical treatments have been addressed, such as ultrasound irradiation [13] and polymer dispersant [14,15,16]. Furthermore, traditional visible light response advantages of photocatalysts are derived from the modification, including ions doping [17], noble metal deposition [18], and semiconductor composite [19]. However, a novel photocatalyst with visible light response and simple hydrothermal synthesis condition is another alternative strategy.
BiOX (X = Cl, Br, I) is a kind of indirect band gap semiconductor with visible light response, the layered structure can efficiently inhibit the electron–hole recombination [20,21], and the photocatalytic performance is also related to the layer changes in structure and morphology [22]. Among these candidate photocatalysts, there is a growing interest in BiOBr photocatalyst due to the desirable band gap and eminent chemical stability [23,24], and the BiOBr crystals can be obtained after hydrothermal treatment of stable precursor solutions. Despite some strategies that have been developed to improve the photocatalytic performance of BiOBr, such as the element doping [25] and the construction of heterojunction [26], multi-step synthesis or elaborate operation must be considered. There is one impressive work reported on doping BiOBr with indium by a simple room temperature synthesis process, but chlorine in raw materials can cause irreparable damage to cement-based materials [27]. In this context, the original one-pot synthesis at room temperature was utilized to prepare BiOBr precursor solution, and redundant ions were excluded as best as possible. The preparation of cement paste is the reaction between cement clinkers and water, and BiOBr precursor particles can well be dispersed in the solutions, which means cement clinkers can react with water from the solutions with the BiOBr precursor particles uniformly incorporated in cement paste matrices. Some studies suggested that BiOBr crystals with different morphology and size were obtained after undergoing a solvothermal process under different temperatures [28,29,30], and concerning the autoclaved curing has been successfully applied in the field of promoting cement hydration reaction, autoclaved curing conditions seem to satisfy the temperature to activate the photocatalytic activity of BiOBr crystals as well. Moreover, because of the potential effects of high pH value induced by the cement hydration and pore structure of hydration products, the formation and photocatalytic activity of BiOBr crystals have not been determined.
In the present work, concerning an applicable temperature for both crystals formation and cement hydration, cement paste mixed with two diverse precursor solutions was cured at 160 °C [31,32]. In fact, although the high temperature can indeed cause detrimental pore structure consequences, the increase in porosity may improve photocatalytic activity [33,34]. This work aims to study the photocatalytic performance of cement paste modified by BiOBr precursor solutions under visible light irradiation, measured at different autoclaved curing times. Moreover, the possible photocatalytic activity enhancement factors of modified cement paste are suggested in the view of the crystallinity and morphology of photocatalysts crystals and the microstructure of cement paste matrices. The synergistic effects of precursor particles and microstructure on the development process of compressive strength of cement paste were also evaluated.
2. Materials and Methods
2.1. Materials and Sample Preparation
2.1.1. Materials
White cement (P.W 52.5) and mains water were used to prepare cement paste. Bismuth nitrate pentahydrate (Bi(NO3)3∙5H2O) and sodium bromide (NaBr), as resource materials of BiOBr precursor solutions, were purchased from China National Pharmaceutical Group Corporation (Sinopharm). As bismuth nitrate pentahydrate is basically insoluble in water, two typical low-carbon organic or inorganic solvents—ethylene glycol (C2H6O2) and nitric acid (HNO3)—were used to dissolve bismuth nitrate pentahydrate.
2.1.2. Mixing BiOBr Precursor Solutions
An ambient temperature mixing process was employed to prepare BiOBr precursor solutions. First, 27 g of Bi(NO3)3∙5H2O (1.5 wt.% of cement mass ratio) was dissolved in ethylene glycol (C2H6O2, 40 mL) or nitric acid (HNO3, 1 mol/L, 250 mL) under the condition of the ultrasonic environment, with stirring until the solutions were completely transparent. Then, the obtained solutions were added dropwise into 630 g water or 380 g water, respectively, which were both dissolved 5.727 g NaBr (ensuring that the consistency of water-to-cement ratio of cement paste as far as possible). Next, the two solutions became opalescent and were exposed to ultrasonic container until they were used to cast cement paste.
2.1.3. Preparation of Photocatalytic Cement Paste
Mains water and two precursor solutions were employed to blend cement paste samples, and the mass ratio of water to cement is 0.35. The measured white cement was put into a mechanical mixer, then water or precursor solution was added. The cement paste was wet mixed for 4 min in an automatic blending program before cast in a 4 cm × 4 cm × 16 cm mold, then the mold was vibrated by a vibrating table to ensure thorough compaction and covered with a plastic sheet.
Cement paste samples were cured in two different curing methods. The samples were allowed to cure in the climate chamber at 95% relative humidity and 20 ± 2 °C for 12 h, then the samples were demolded and were divided into two groups. One group of samples continued to proceed with standard curing in the humid chamber and the other group of samples was placed into an autoclave. Three gradients of the autoclaved curing time were set (160 °C last for 2 h, 4 h, 6 h), after autoclaved curing, samples were cooled to room temperature with a fan. In autoclaved curing, samples cast by cement and mains water are labeled Control-X, where X is the autoclaved curing time (X = 2 h, 4 h, 6 h). Two modified photocatalytic samples are denoted as BiOBr-1-X (ethylene glycol as solvent) and BiOBr-2-X (nitric acid as solvent), where X is the same representation as above. The reference samples with standard curing were named Control, BiOBr-1, and BiOBr-2, respectively. The detailed components and curing methods of cement paste samples are listed in Table 1.
2.2. Characterization of Cement Paste
The mechanical properties of samples were assessed following the autoclaved curing process finished. The compressive strength of paste prism (4 cm × 4 cm × 16 cm) was tested by a universal testing machine (CDT1305-2) with a limit capacity of 300 kN, and the preparation and testing methods were conducted according to the GB/T 17671-1999 standard. The paste prism was processed at a loading speed of 2 mm/min until it was damaged. The residual crashing fragments of the prism were terminated hydration after the compressive strength test, and the following tests were carried out on these collected samples.
XRD analyses were performed on a Bruker D8 Advance diffractometer, equipped with a Cu Kα X-ray radiation source. The acquisition of diffraction patterns was performed in the 5–60° 2θ range, and the continuous scan speed was 2°/min. Phase identifications were executed using MDI jade software, supported by the Powder Diffraction File (PDF) database of the International Center for Diffraction Data (ICDD). XRD was used to evaluate the elemental mineralogical composition and photocatalysts crystallinity in samples.
2.3. Photocatalytic Performance
2.3.1. RhB Degradation
Before the color measurement, the paste prisms were cut into thick slices (with dimensions of 4 cm long, 4 cm wide, and 2 cm high) and then ground, and the test surface was cleaned with 100 mesh sandpaper. The self-cleaning capability of modified samples was evaluated by monitoring the discoloration of organic dye (Rhodamine B (RhB)), even though the photodegrading process had been reported [35]. RhB solution of 80 mg/L concentration was used in this study and spraying on the entire surface of samples, spraying once (about 1 mL) to obtain a homogeneous distribution contaminated surface.
The dye degradation process was conducted in a WFH-203B UV–Vis analyzer, equipped with a simulated natural lamp (3W, λ > 420 nm). The intensity of light irradiation in the analyzer was 18.5–18.7 W/m2, tested by an optical power meter (CEL-NP 2000). Color degradation was measured directly on the surface of each sample after irradiation with a portable spherical spectrophotometer (RM200QC, X-Rite). For each surface, we calculated the average colorimetric value change of the three sampling points. For detailed data processing and RhB degradation rate calculation methods refer to the works in [32,36].
2.3.2. NOx Removal
The efficiency of photocatalytic samples to remove NOx was analyzed using a photochemical reaction apparatus, which was equipped with a Xenon lamp with a maximum power of 500 W. The real optical power density of light in the NOx abatement experiment was 187.3–187.6 W/m2. NO gas was diluted to normalized air with an initial concentration of 400 ppb by a dynamic gas calibrator (146i, Thermo Fisher Scientific, Franklin, MA, USA), and the gas flow rate was set to 8000 SCCM. After that, the calibrated NO gas was fed into the photochemical reactor apparatus, and the resulting gas concentration was recorded in real-time by a NO-NO2-NOx analyzer (42i, Thermo Fisher Scientific, Franklin, MA, USA).
The sample disposal was the same as RhB degradation test. The test sample was placed in the reaction chamber for gas adsorption and desorption in a dark environment, and when the NO concentration in the reactor reached equilibrium, the lamp was turned on. The test sample was irradiated for 40 min to ensure the concentration can reach a constant value during photocatalysis process, and the value changes of NO and NO2 were continuously recorded. The maximum concentration value changes of NO and NO2 were used to calculate the amount of NOx (NO + NO2) removal, and the NOx removal efficiency (η%) was calculated according to the Equation (1). NOx0 is the initial concentration, and NOx is the concentration after irradiation.
η%NOx = (NOx0 − NOx)/NOx0 × 100%
2.4. Microstructure
Samples were characterized through mercury intrusion porosimetry (AutoPoreIV 9510, Micromeritics, Norcross, GA, USA) and scanning electron microscopy (EVO LS15, ZEISS, Germany) to estimate their microstructure. Porosity and pore size distributions were determined by calculating the MIP test results, and morphology and element composition were obtained by SEM images and an equipped energy-dispersive spectrometer (X-MaxN 20, Oxford, UK).
3. Results and Discussion
3.1. Photocatalytic Degradation of RhB
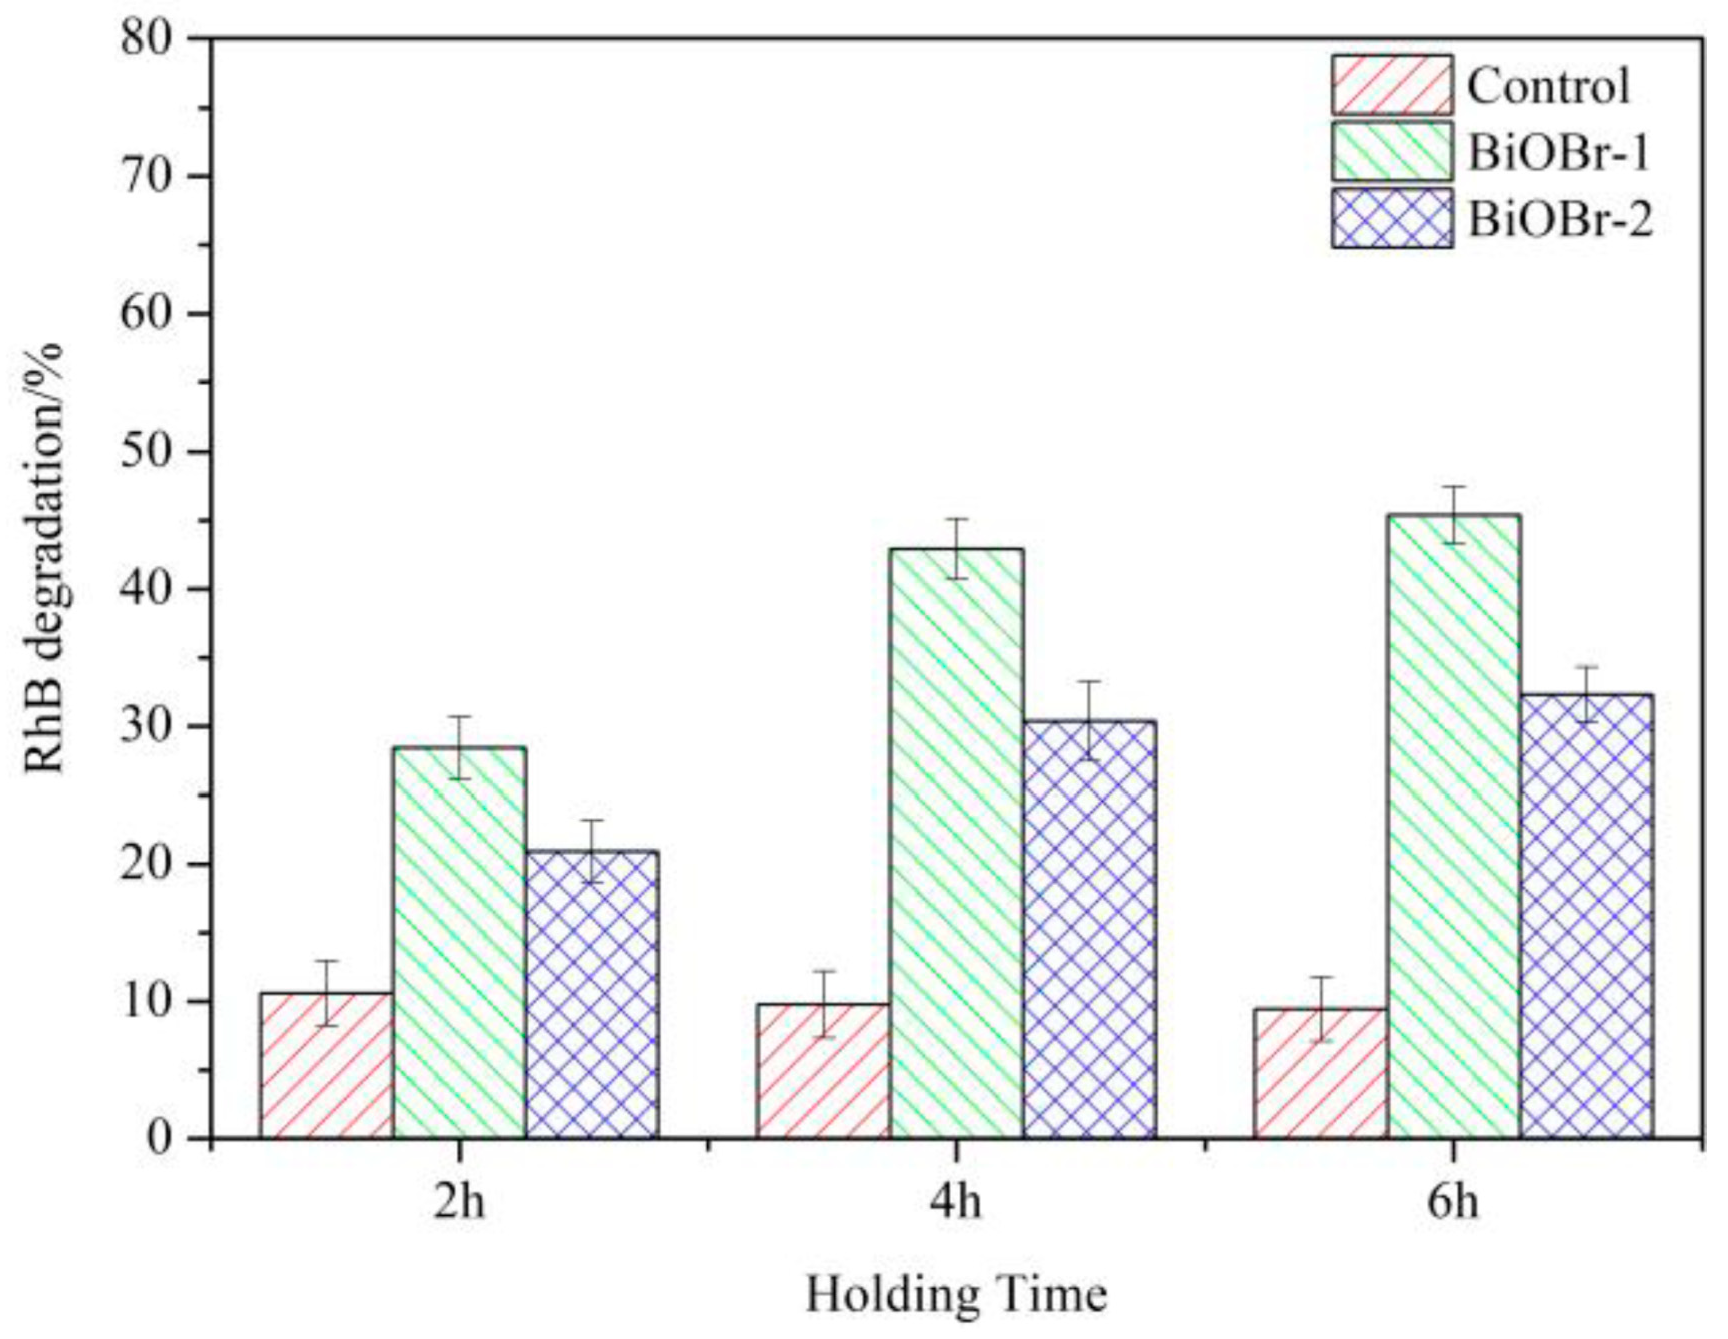
The samples were irradiated in the analyzer for 20 h after the light turned on, and the RhB degradation rates of different samples were shown in Figure 1. As can be seen from the figure, the modified samples by BiOBr achieve larger photocatalytic RhB degradation efficiency than reference samples. Approximately 10% discoloration is also detectable for reference samples because the RhB photobleaching process occurs under the irradiation of visible light [35]. This result indicates that RhB can undergo a synergistic decolorization process of photobleaching and photocatalytic degradation, which means the improved RhB fading rate of the modified samples is due to the photocatalytic degradation process. After 2 h of autoclaved curing, the RhB degradation efficiency of sample Control-2h is significantly lower than that of sample BiOBr-1-2h and sample BiOBr-2-2h, and real values are 10.6%, 28.4%, and 20.9%, respectively. It is understandable because the crystallinity and photocatalytic activity of photocatalysts increases after high-temperature treatment; however, photocatalysts mounted on the hydration products are also affected by the exposure to the dye and photons. In fact, two precursor solutions may lead to different cement stone structure, and then the photocatalytic activity is different. As the autoclaved curing proceeded, when the holding time was set to 4 h, the RhB degradation efficiencies of two modified samples are further improved (BiOBr-1-4h = 42.9% and BiOBr-2-4h = 30.4%), and the RhB degradation efficiency of sample Control-4h is 9.7%. Apparently, the intermixed photocatalysts show a higher photocatalytic activity after 4 h of autoclaved curing; this may be due to the improvement of crystallinity of photocatalysts and their good compatibility with cement-based materials. The photocatalytic degradation of RhB does not increase much with the autoclaved curing time prolonging from 4 h to 6 h, and the RhB degradation efficiencies of sample Control-6h, sample BiOBr-1-6h, and sample BiOBr-2-6h are 9.4%, 45.4%, and 32.3%, respectively. The photocatalytic improvement of photocatalysts particles may come to a threshold, and as the hydration reactions proceed, some hydration products can occlude partial active surface of photocatalysts [37].
3.2. Photocatalytic NOx Removal of Modified Samples
In order to further evaluate the photocatalytic performance of the modified samples, additional NOx removal experiment was carried out (the NOx removal rate of sample Control was zero in the preliminary test). Figure 2 depicts the maximum concentration change rate of NO, NO2, and NOx of different modified samples in the photocatalytic reaction process. In Figure 2, it can be seen that sample BiOBr-1-X presents higher NOx (NO + NO2) removal efficiency (up to 4.4%) than sample BiOBr-2-X for every autoclaved curing time. This is consistent with the above experimental results of RhB degradation, and the sample BiOBr-1-X has entirely better photocatalytic activity. Additionally, as expected, the NOx removal efficiency of modified samples increased with the extension of autoclaved curing time.
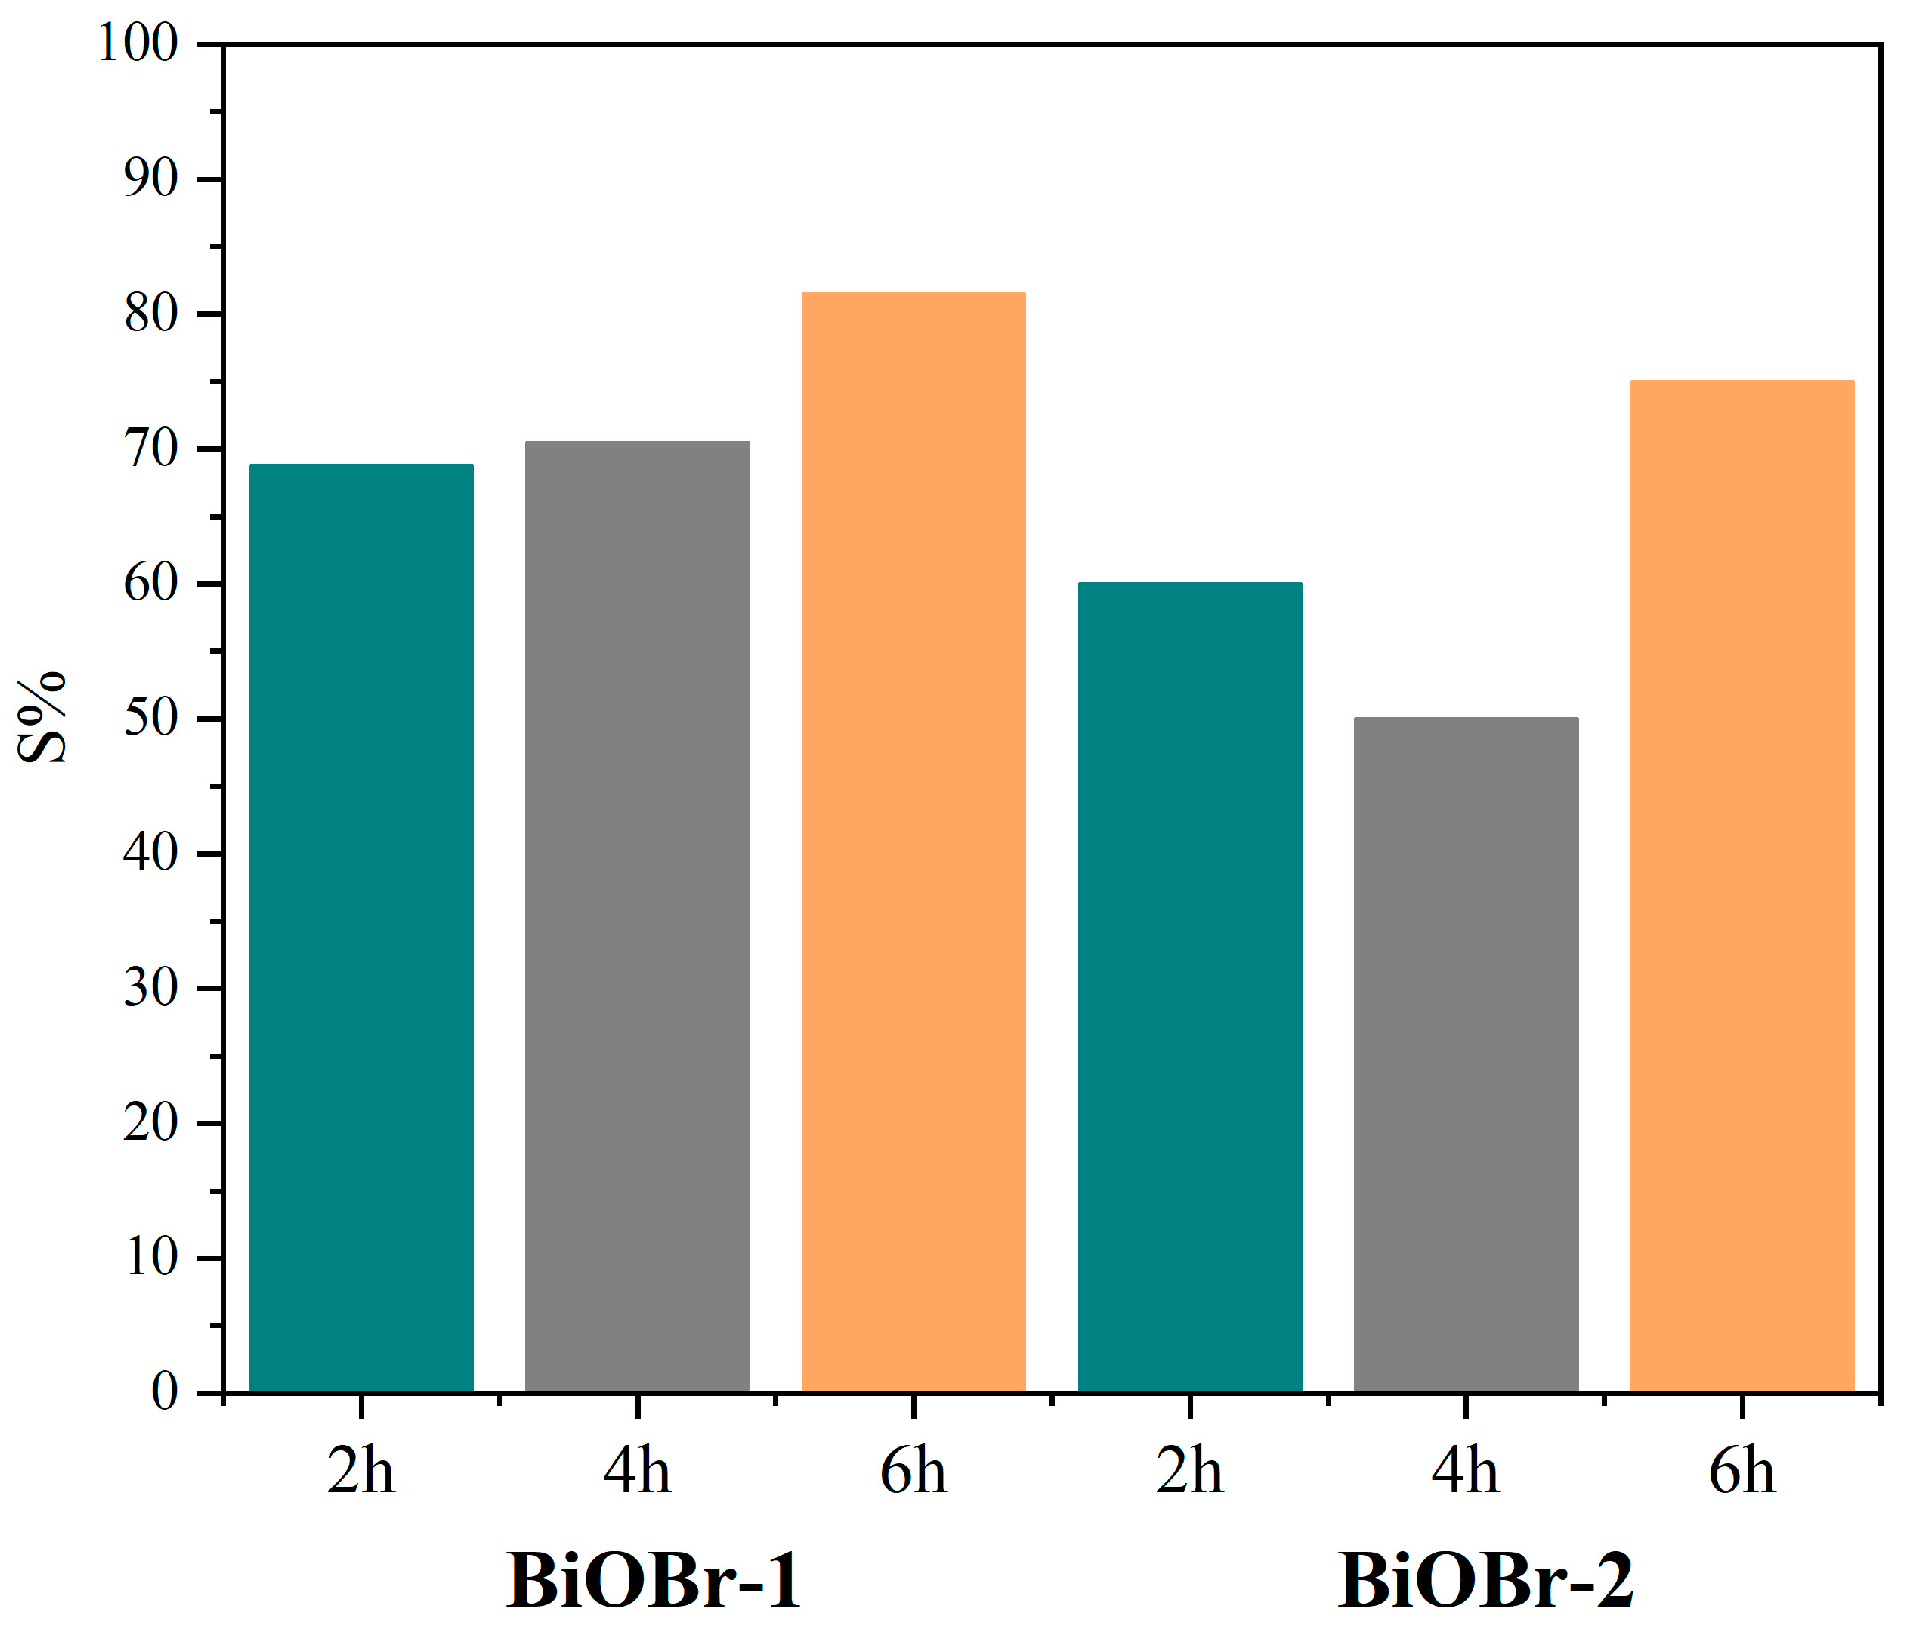
The degradation of NOx is a series of chemical reactions that can be described by the following equations (Equations (2)–(4)) [38], and this also means that intermediates formed in either reaction process may be released into the atmosphere. However, it is problematic as the toxicity of NO2 is apparently greater than that of NO, and sufficient oxidation produces nitrate (NO3−) is preferable with respect to air purification. Consequently, the photocatalysts selectivity for nitrate (S%) was used to evaluate the NO2 production rate, and S% was calculated according to Equation (5) [39]. As can be seen in Figure 3, the nitrate selectivity of two modified samples with the same autoclaved curing time shows a consistent result, that is, sample BiOBr-1-X presents a higher S% value than that of sample BiOBr-2-X. In fact, a higher nitrate selectivity dives a corresponding lower NO2 release, which is the desired NOx removal process.
NO + HO∙ → HNO2
HNO2 + HO∙ → NO2 + H2O
NO2 + HO∙ → NO3− + H+
S% = ξNOx/ξNO × 100%
3.3. The Determination of Phase and Crystallinity
Figure 4 shows the XRD results obtained for the reference sample and modified samples as a function of autoclaved curing conditions. As expected, the major phase compositions of all the samples were Ca3SiO5 (C3S), Ca2SiO4 (C2S), Ca(OH)2 (CH), and carbonate formed in the hydration process. Typical characteristic peaks of ettringite (AFt) observed in sample control were trace disappeared due to the high-temperature treatment process for the samples with autoclaved curing. The intensity of characteristic peaks of C3S and C2S varied in degrees of reduction for the promoted hydration reaction. Interestingly, it seems that the intensity of characteristic peaks of CH in the sample BiOBr-1-X was distinctive from that of the other samples. Although the high-temperature treatment did promote the hydration reaction process, the intensity of typical CH peaks did not recover to an ordinary level. By analyzing the TG curves of all the samples in previous work [40], the proportion of mass loss caused by CH decomposition was almost the same; therefore, it was inferred that the addition of ethylene glycol hinders the crystallization of the crystals.
There are two new diffraction peaks that emerged in both modified samples, and two peaks are at 2θ of 31.7 and 2θ of 10.9, respectively, which correspond to the strongest peak and the third peak of BiOBr PDF from the ICDD database. The second peak at 2θ of 32.2 of BiOBr is not discernible due to the overlapped diffraction peaks in the 2θ region of 32–33. Obviously, after 2 h of autoclaved curing, the intensity of BiOBr in XRD patterns of sample BiOBr-2-2h was higher than that of sample BiOBr-1-2h, which indicated that the crystallinity of BiOBr crystals in sample BiOBr-2-2h was better. With the extension of holding time of autoclaved curing, the crystallinity of BiOBr crystals in sample BiOBr-1-X was further improved, and up until 6 h of autoclaved curing later, two modified samples were at a similar degree of crystallinity. Although the addition of ethylene glycol impeded the crystallization of BiOBr crystals in sample BiOBr-1-X, the photocatalytic performance of sample BiOBr-1-X was better than that of sample BiOBr-2-X. The results suggest that the crystallinity of BiOBr crystals in different modified samples is not the most dominating factor for photocatalytic performance under the experimental conditions of this study, and the effect of other parameters, such as microstructure, need to be further investigated.
3.4. Pore Structure
Table 2 shows the results from mercury intrusion porosimetry, where cumulative porosity (percentage in volume) and three different pore volume ranges are given. Although some authors have demonstrated that a higher porosity does not necessarily lead to a higher photoactivity [41], they are in agreement that the photocatalytic activity was favored by an increased porosity, provided that large pores (>0.1 mm) are predominantly occupied [34]. Therefore, in this study, 1 μm and 0.1 mm are used as the basis for pores division, and they are used to estimate whether there is a correlation between pore distribution and photoactivity.
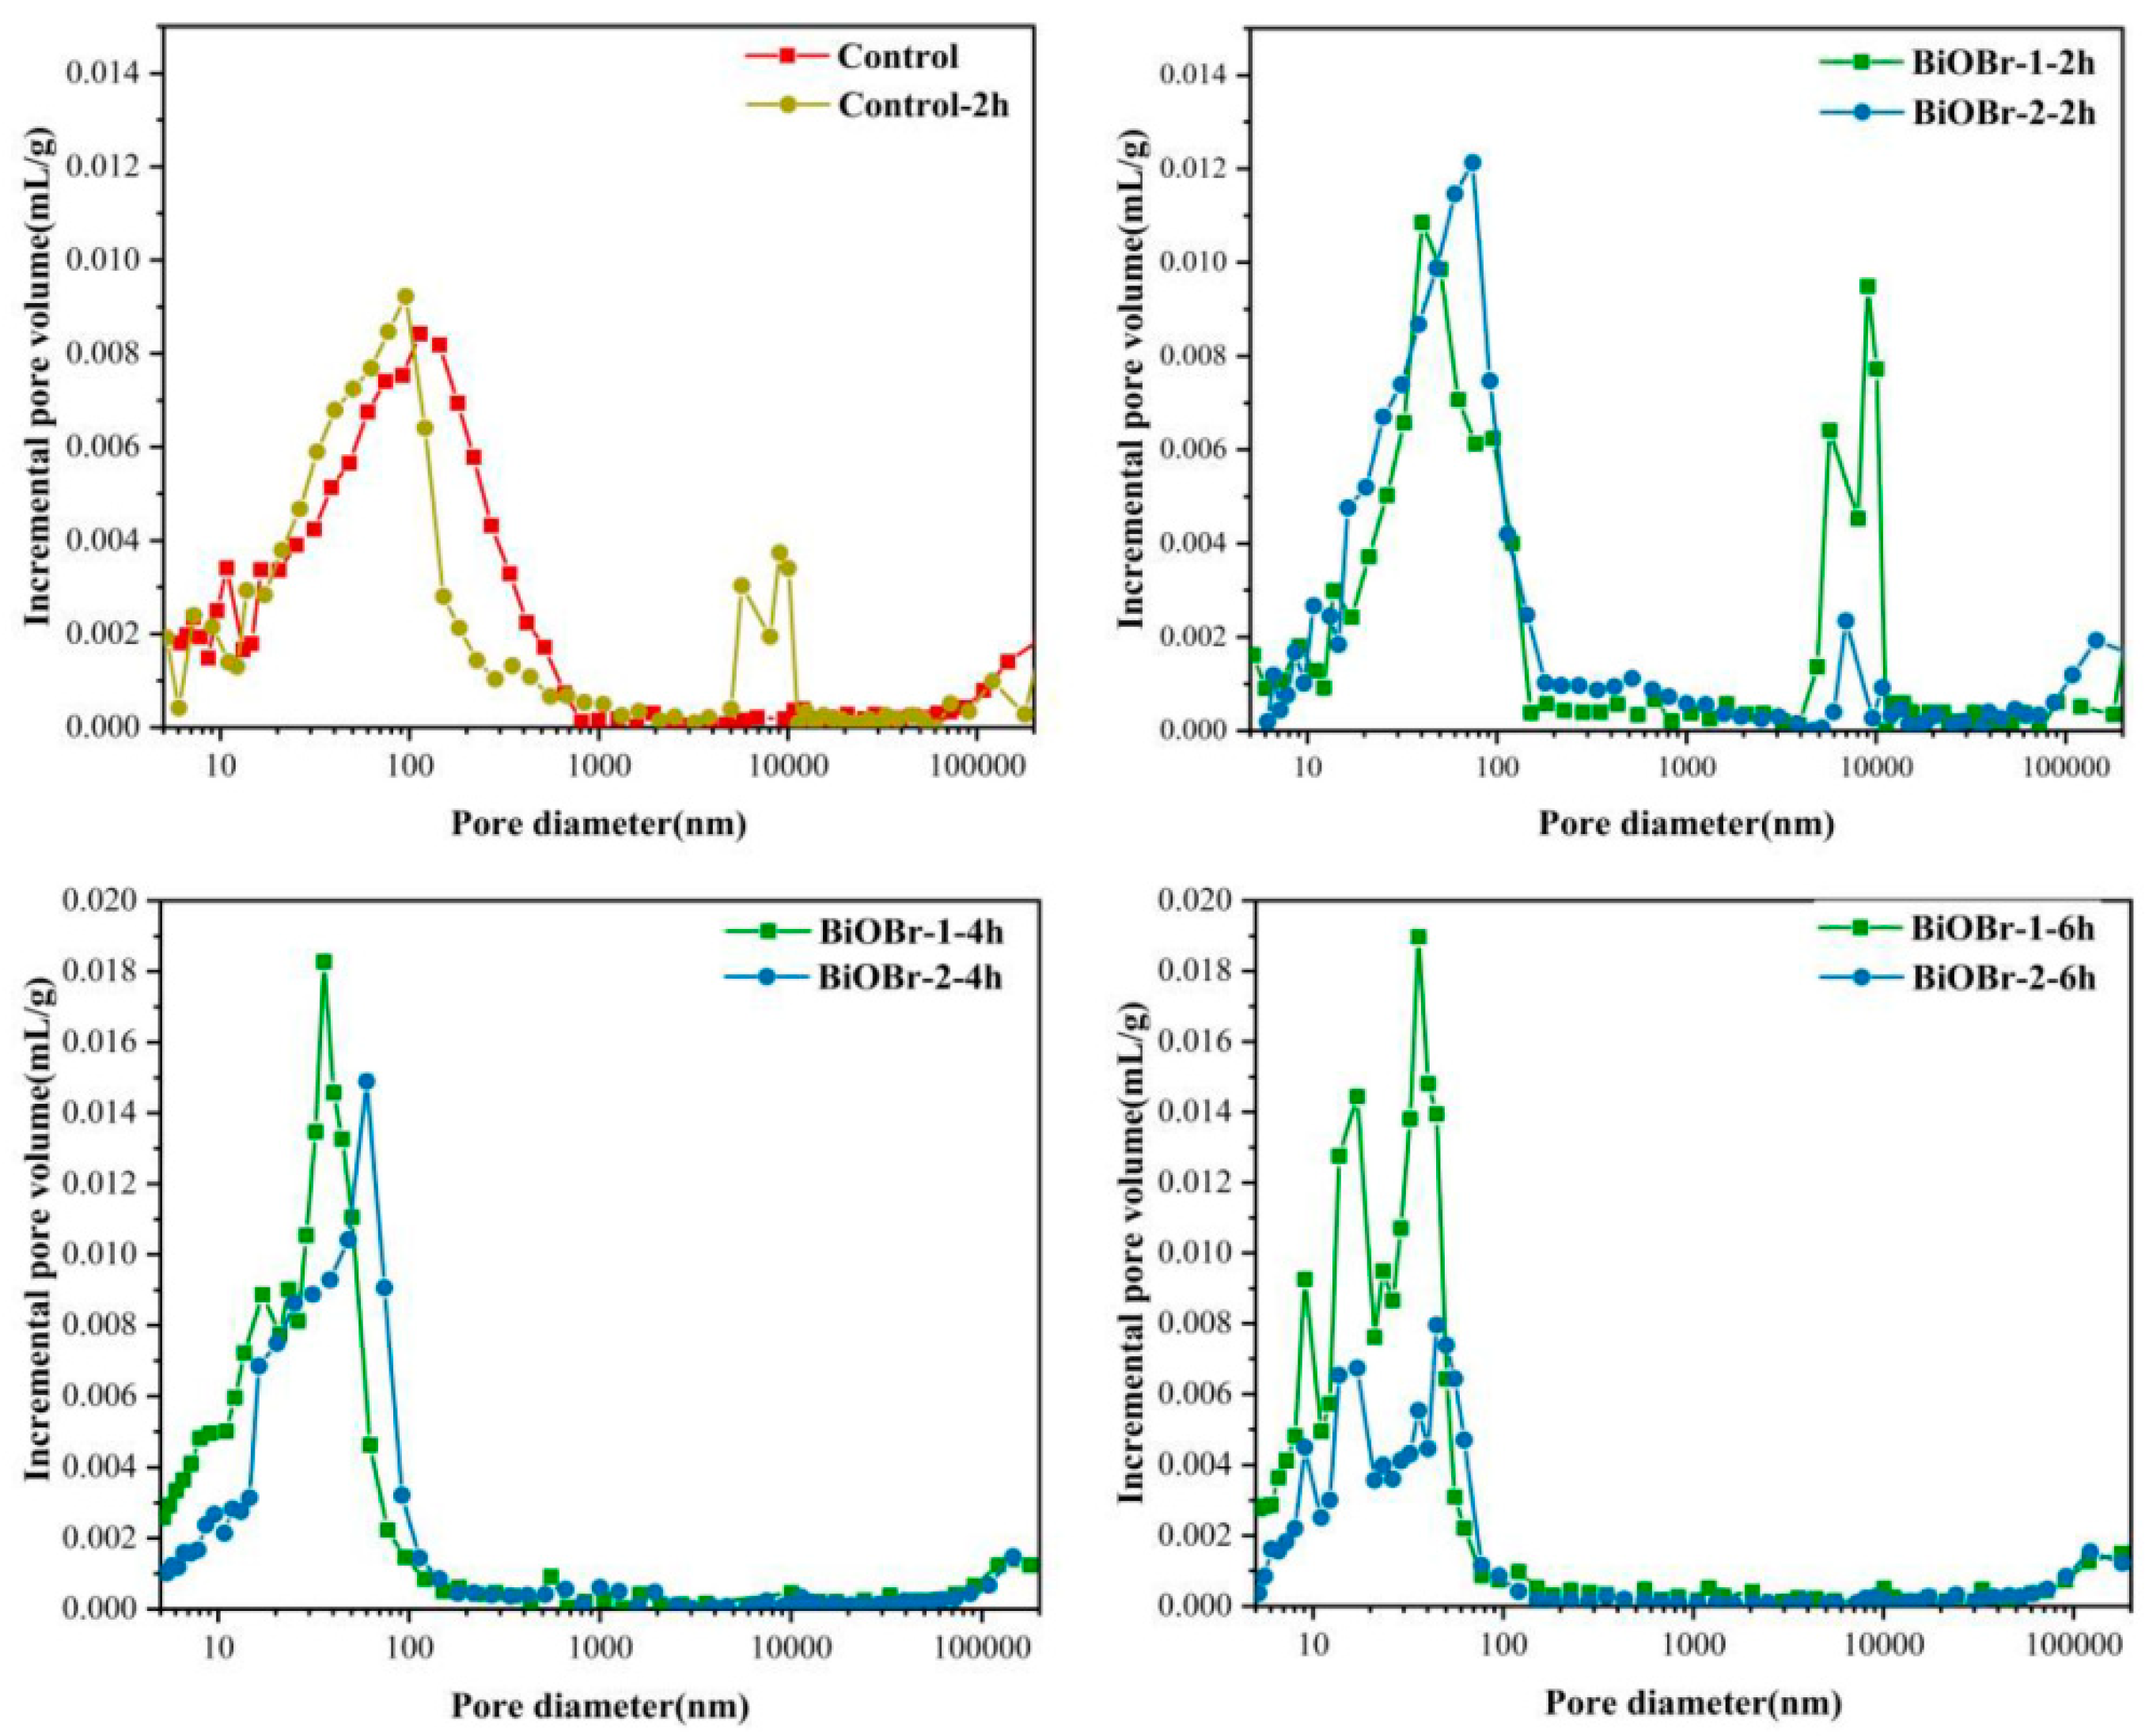
From the results in Table 2, it can be observed that the autoclaved curing method induces noticeable increases in the cumulative porosity of the reference sample and sample BiOBr-1-X. However, there is no cumulative porosity change in sample BiOBr-2-X, which may be attributed to the effect of remained products formed in the reaction between nitric acid and alkaline substance in cement. Compared to the cumulative porosity of sample BiOBr-2-X, the higher cumulative porosity of sample BiOBr-1-X indeed corresponds to the enhanced photocatalytic efficiency, and this trend is consistent with general conclusions of previous studies [33,34]. Additionally, apart from the porosity, the improvement of crystals crystallinity can result in an improvement in the photocatalytic efficiency, which may be the reason why the photocatalytic efficiency can be improved even when the porosity of sample BiOBr-2-X is basically unchanged or even slightly reduced. The extension of autoclaved curing time caused additional hydration products as effective filler of voids leading to a refinement of the porosity, with a shift of the large pores towards smaller pores, and then the pore volume concentrated at sizes smaller than 1 μm. In accordance with [42], when the pores larger than 1 μm and smaller than 0.05 μm, the photocatalytic efficiency of samples shows a decreasing trend in both dyes’ degradation and NOx removal process. Therefore, a more detailed pore size distribution curves were shown in Figure 5.
In Figure 5, it can be seen that for samples after 2 h of autoclaved curing, new pore volume peaks were generated in the range of 4 to 10 μm, which can be ascribed to the formation of heat-induced micro-cracks. The pore volume of sample BiOBr-1-2h shows the most dramatic increase, while sample Control-2h and sample BiOBr-2-2h display a predictable mild increase. The reason for this result may be that the excess liquid for sample BiOBr-1-2h exacerbates the motion of vapor molecules and the loosely packed cement stone structure is insufficient to resist. Additionally, the pore volume increases for modified samples in the pore diameter range of 100 nm are particularly prominent can be due to the hydration products formed on the added scattered nucleation sites. As a matter of fact, the pores smaller than 80 nm in diameter are usually gel and capillary pores of C-S-H structure [33], and it is debated whether the pores can improve the photocatalytic activity. In this study, the results of sample BiOBr-1-X are in agreement with the trend that an increase in these pores improved the photocatalytic activity, but that is not the case with sample BiOBr-2-X. Therefore, considering that the effect of pore structure is not the unique parameter affecting the photocatalytic efficiency, in accordance with the results presented in XRD analysis, pore structure and crystals crystallinity play a different dominant role for photocatalytic activity in different modified samples.
3.5. The Morphology Analysis of Compositions
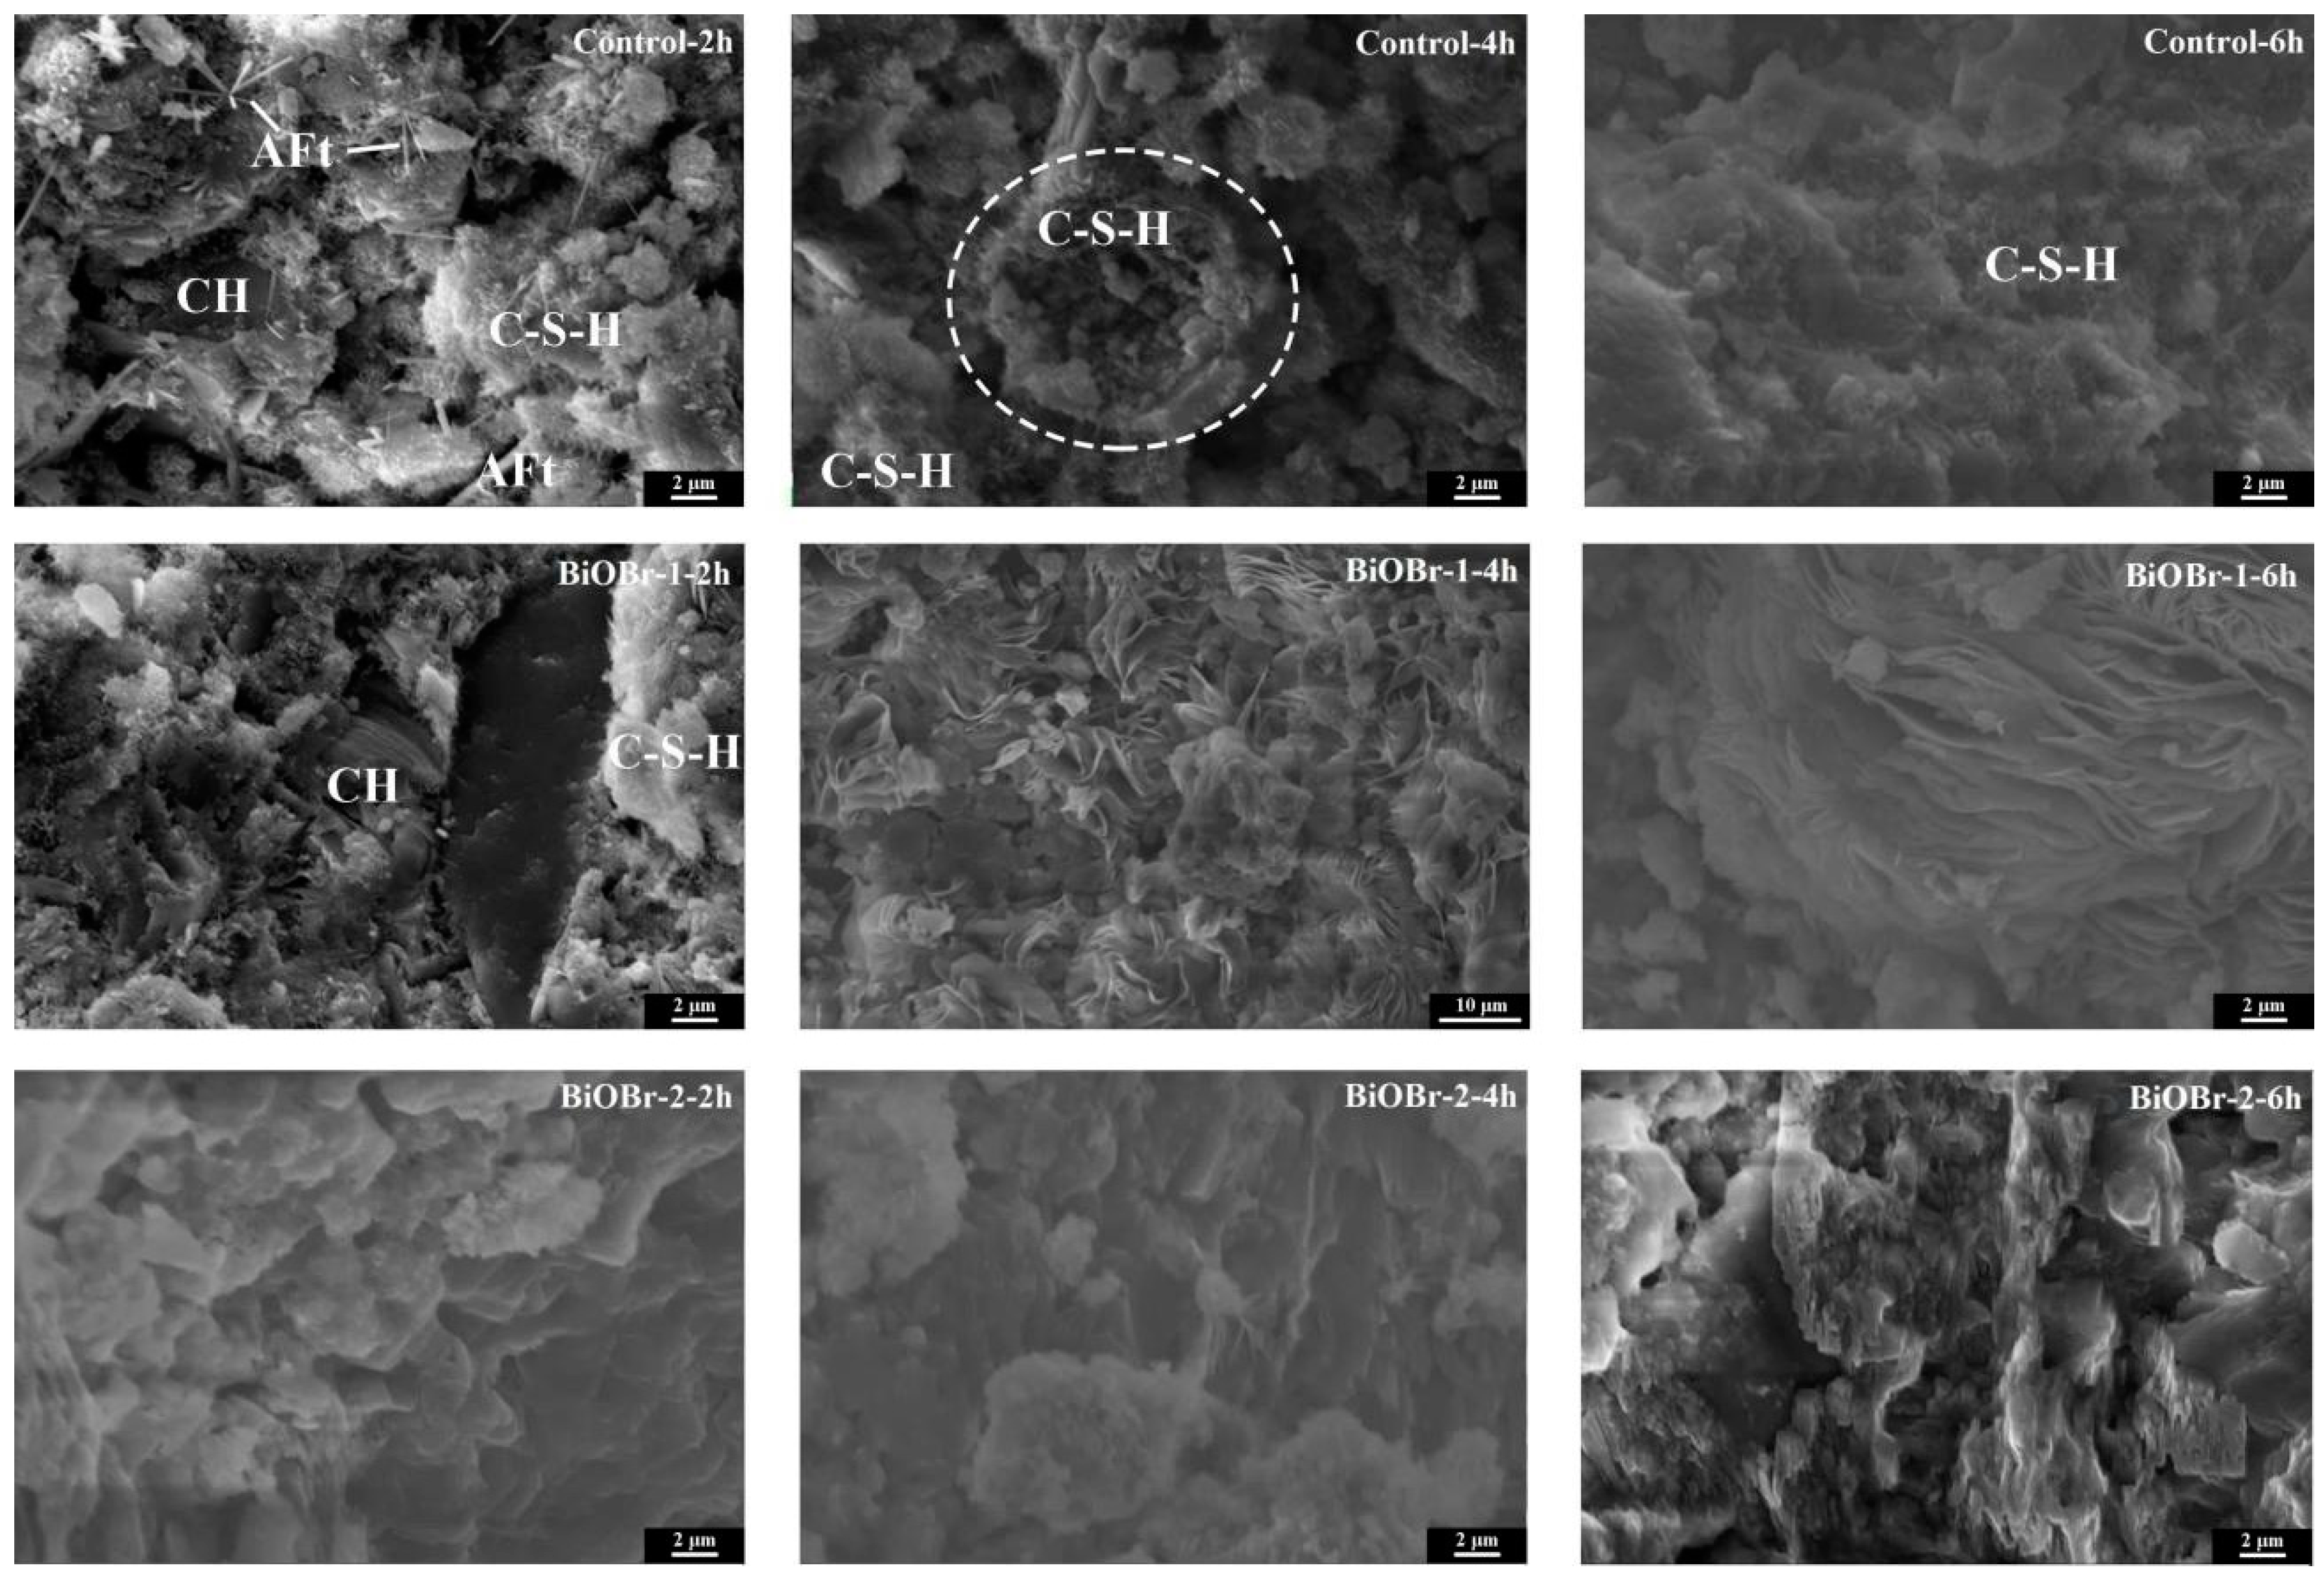
The morphologies of compositions of different hardened cement paste samples are presented in Figure 6. After 2 h of autoclaved curing, it still can be seen that the typical needle-like hydration product ettringite (Aft) in sample Control-2h, and the gelatinous cluster hydration product C-S-H is wrapped around the cement particles. The reason for this result is that the Aft thermal decomposition can be divided into four endothermic events, at a temperature below 450 K, the decomposition process is continuous proceeding and controlled by mass transport [43]. There is no trace of Aft in sample Control-4h and the pores of sample Control-6h is reduced due to the further hydration.
Stacked layered crystals appeared on the fracture surface of sample BiOBr-1-4h and in the pores of sample BiOBr-1-6h, indicating that a new product (may be the BiOBr crystals) was formed during the autoclaved curing process. Some studies have found that the morphology of BiOBr is controlled by the pH of precursor solutions, the BiOBr crystals are composed of microplates at low pH and then further mixed and self-assembled to form flower spherical products with the increase of pH, which are broken into thin nanosheets in the end at high pH [31,44]. The pore solution of cement can provide a highly alkaline environment, indicating that lamellar crystals may be BiOBr crystals formed by precursors during the high-temperature treatment process. Different from the morphologic characteristics of sample Control-X and sample BiOBr-1-X, sample BiOBr-2-X had denser morphology, fewer pores, and the hydration products were mixed. This trend may be ascribed to the reaction of nitric acid and cement alkaline substance to produce products, and there are no lamellar products with good crystallinity were observed in sample BiOBr-2-X.
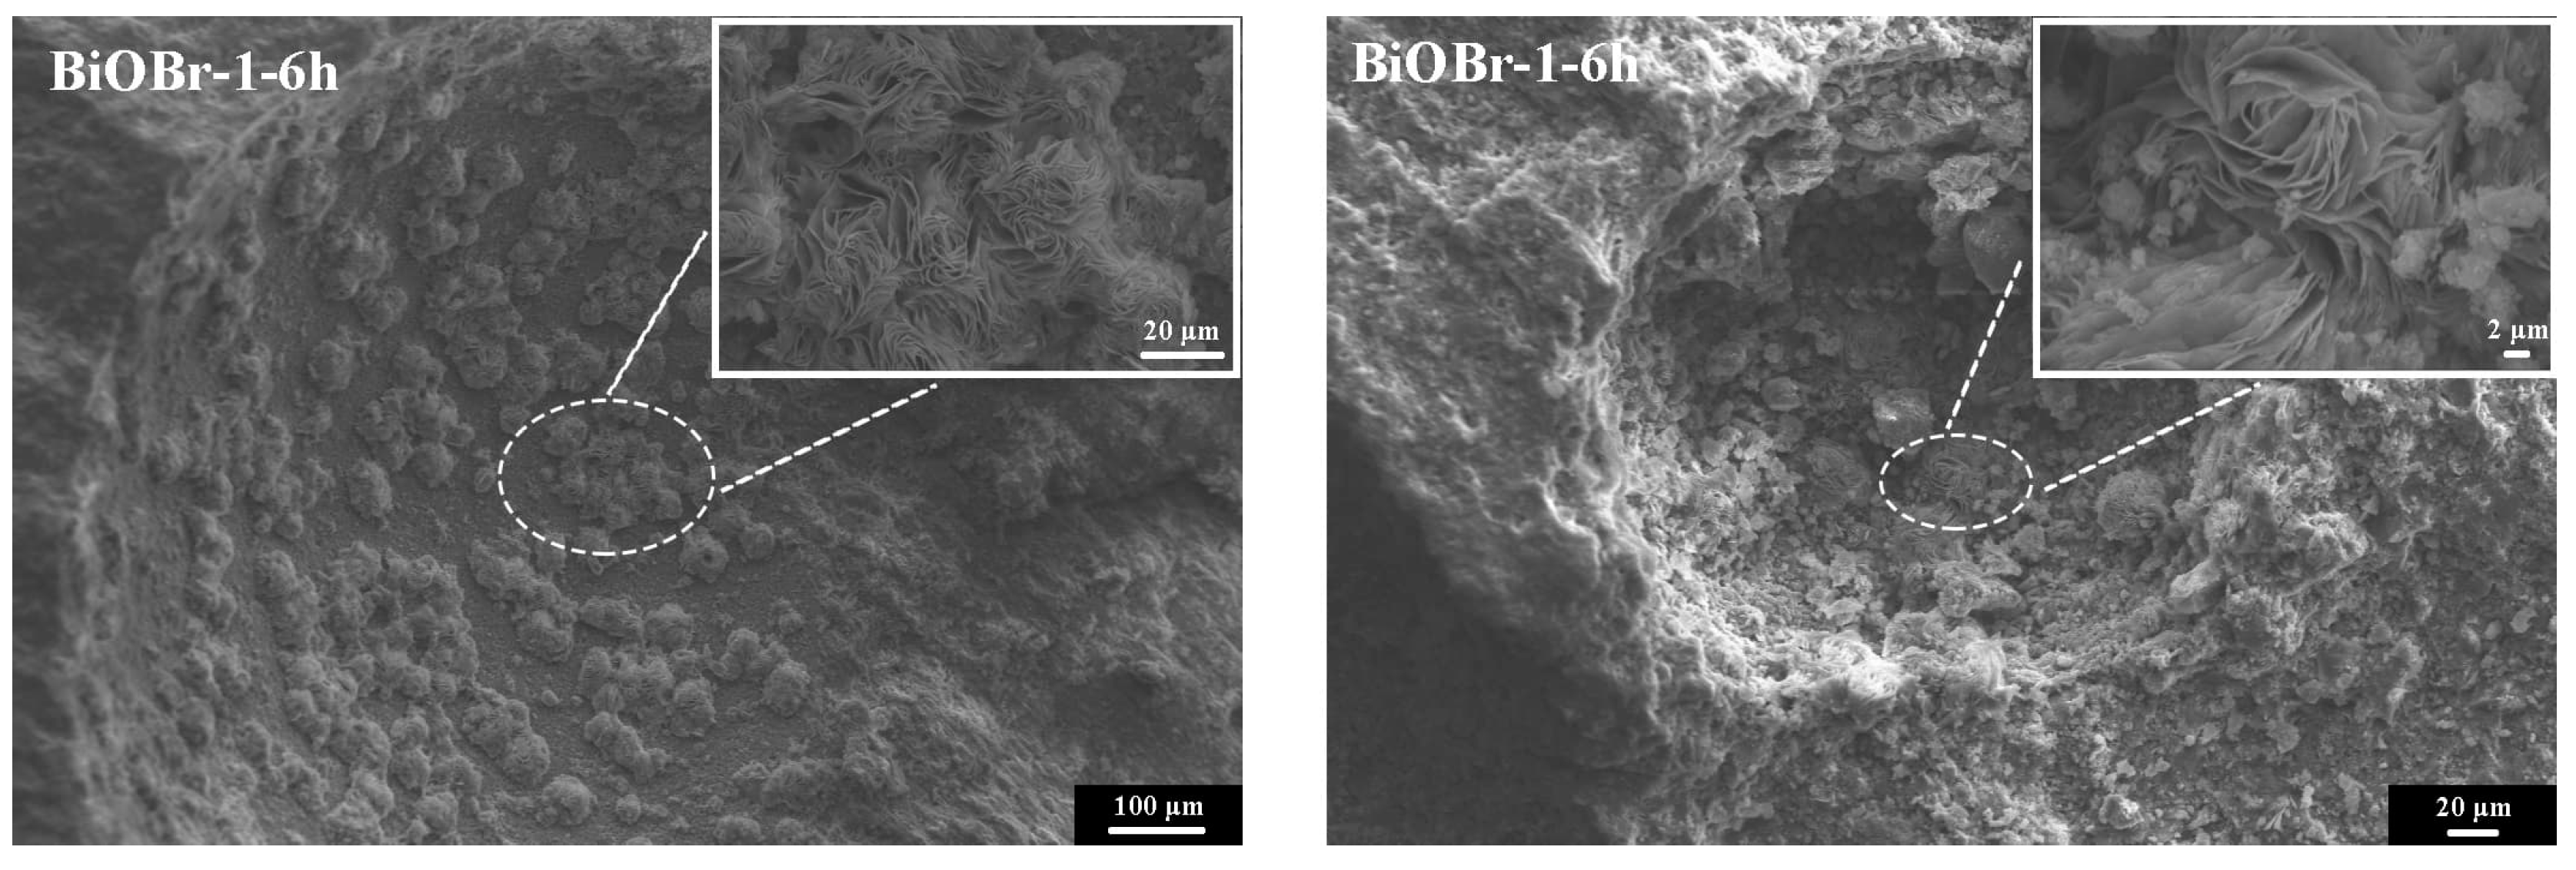
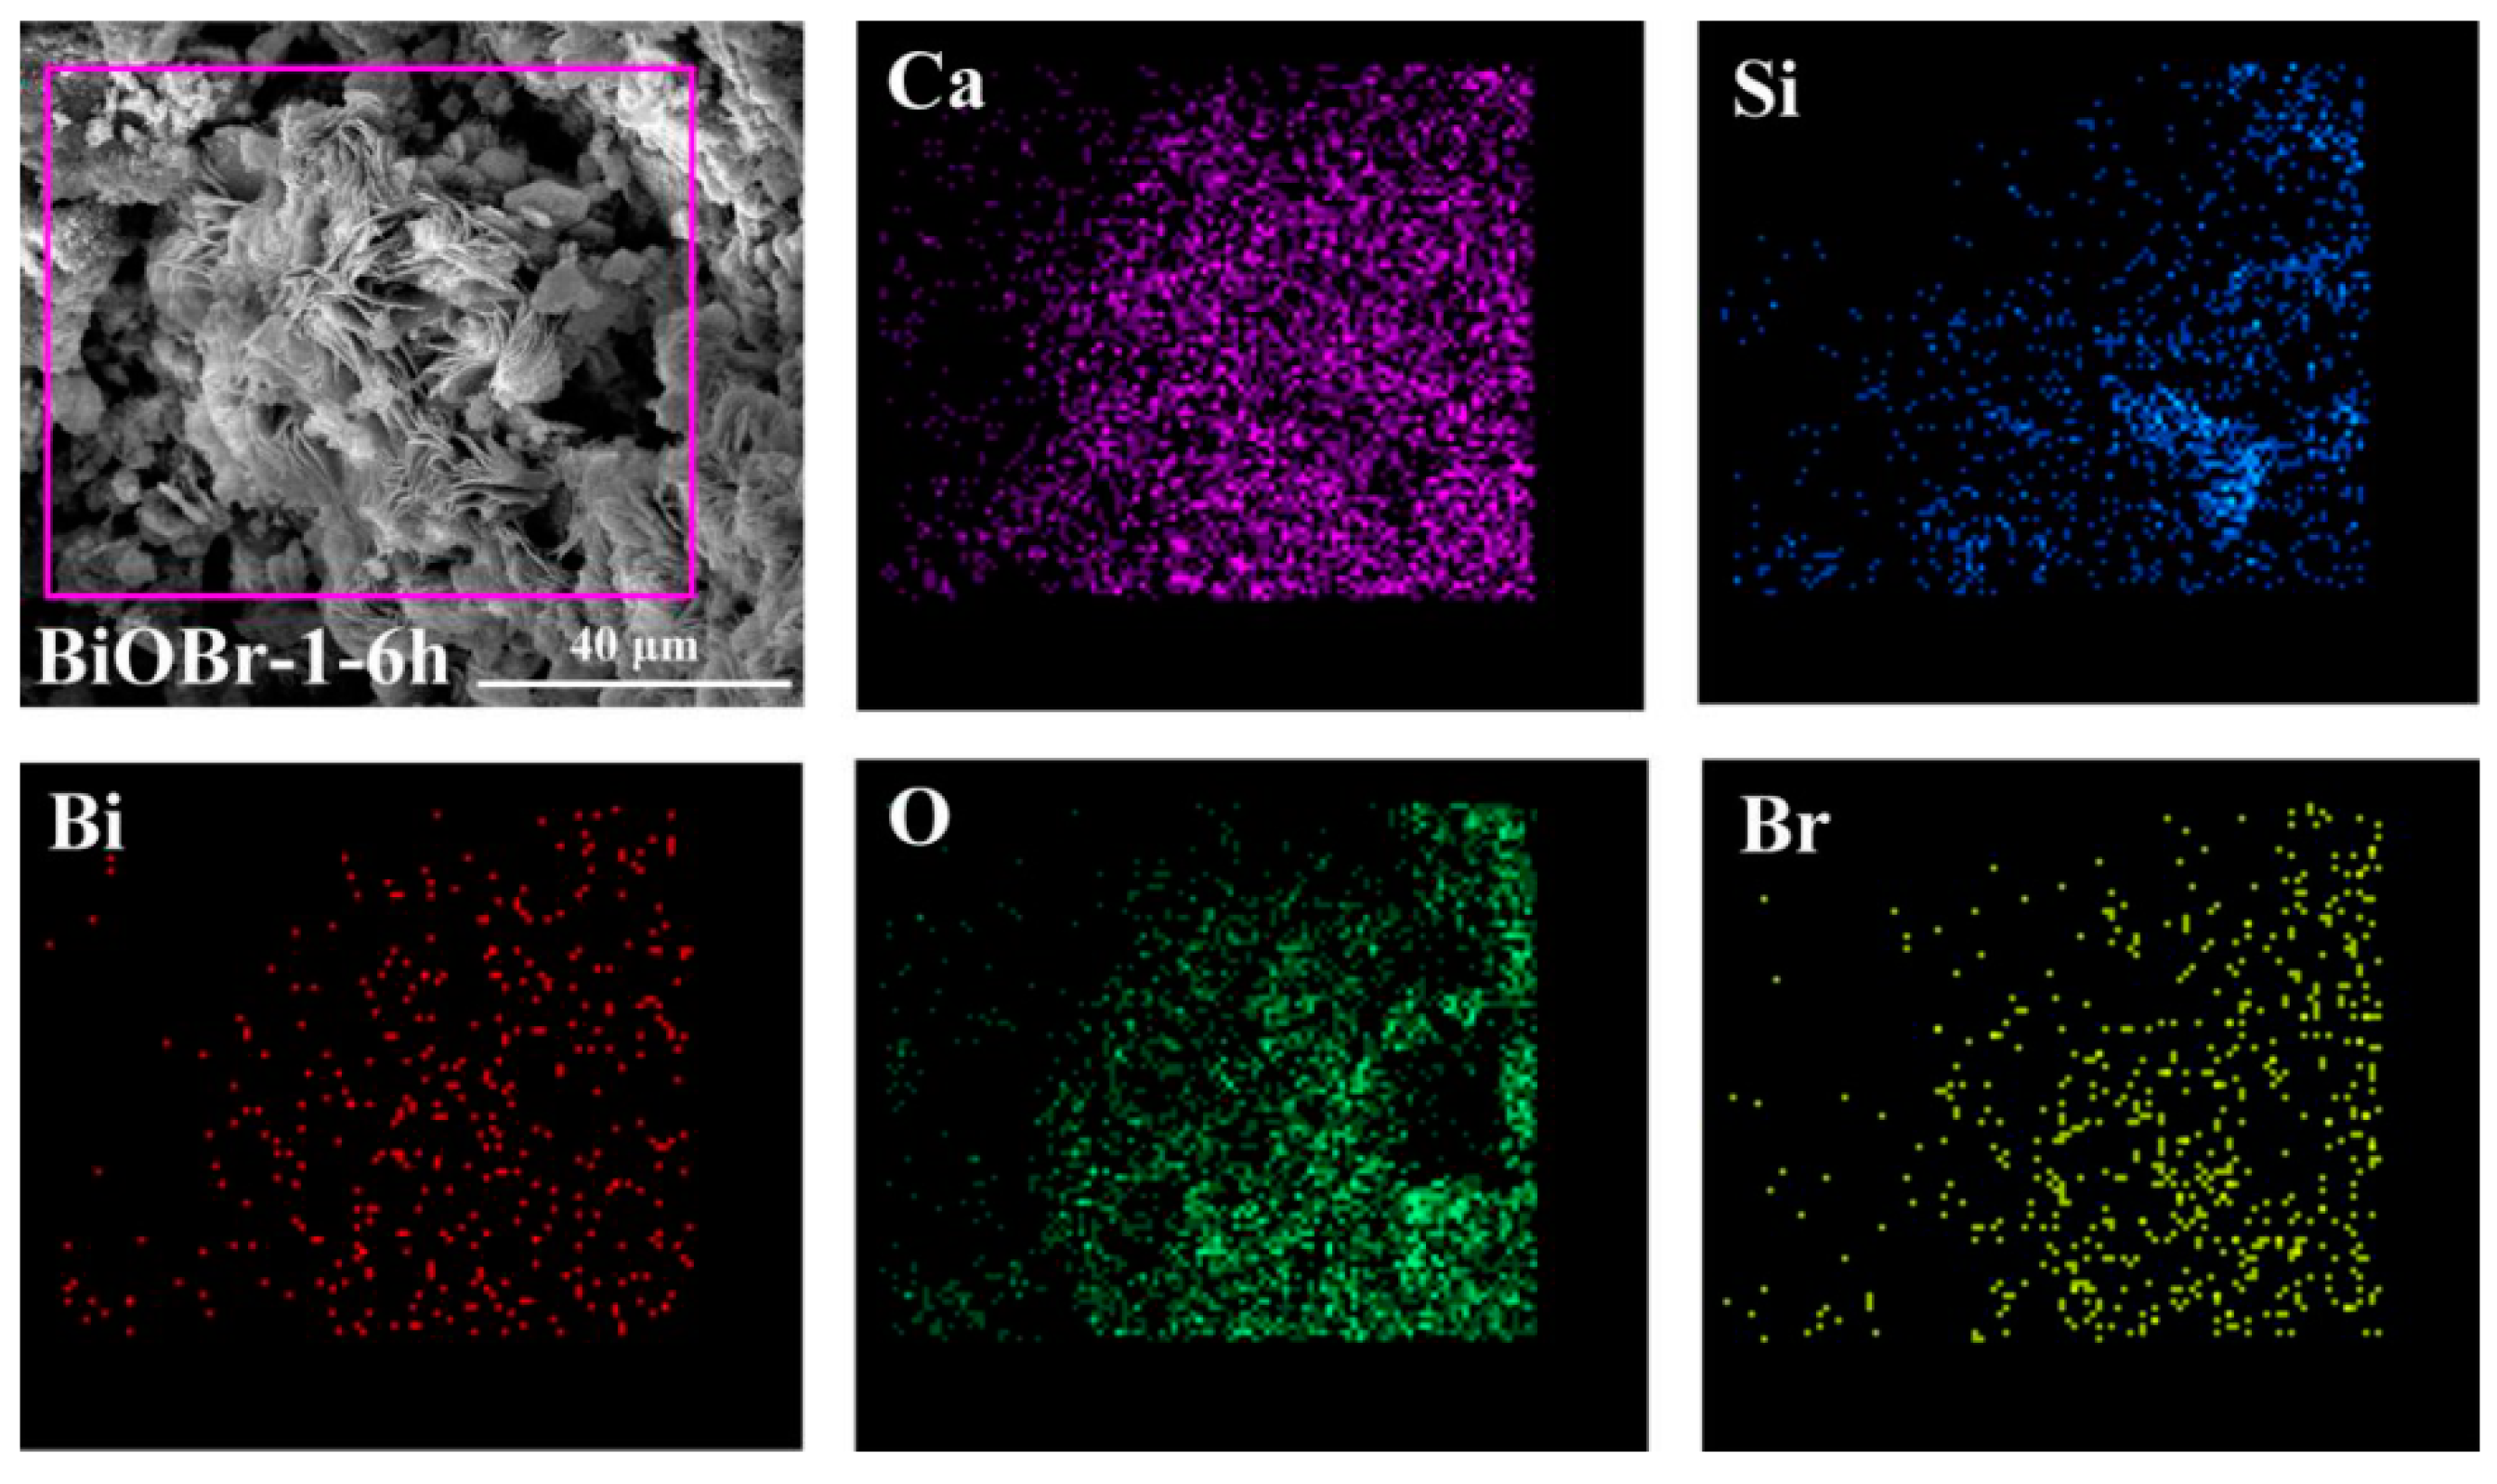
In this context, in order to verify that the voids provide space for the growth of crystals, the SEM images of sample BiOBr-1-6h are further observed. In other words, if the conditions of high temperature and voids can be met at the same time, the crystals with good crystallinity can be formed inside the pores of sample BiOBr-1-6h with the highest porosity under the condition that the precursor particles are uniformly dispersed. In Figure 7, it can be seen that a large number of lamellar crystals with good crystallinity and complete morphology exist on the surface of the exposed pores. In addition, Figure 8 shows the EDS mapping images of the lamellar products region, and it can be noted that the signal intensity of different morphological elements has obvious contrast. Finally, the concentrated distribution of element Bi and element Br in the region of lamellar products confirms again that the lamellar crystals are BiOBr crystals.
3.6. Effect of the Microstructure on the Compressive Strength
The compressive strength of samples with or without autoclaved curing was tested, and the experimental results are presented in Figure 9. In each bar chart, the left samples and the right samples underwent the same total curing time, which means that the increase in compressive strength during the autoclaved curing process can be intuitively compared, and the increased value of compressive strength was expressed by Equation (6). Under the condition of ambient temperature curing, the compressive strength of the samples was mainly affected by the precursor solutions, and the compressive strength of the modified samples was lower than that of the reference sample. This result may be attributed to that ethylene glycol and nitric acid are detrimental to cement hydration, and the nucleation of particles is insufficient to offset this effect.
Strength ratio = CSac/CSAT × 100%
CSac: Compressive strength of autoclaved curing samples;
CSAT: Compressive strength of ambient temperature curing samples.
In accordance with the results of strength ratio, for sample Control-X, the maximum value change in strength improvement came from 2 h of autoclaved curing. Even for the modified samples, although the strength ratio continued to increase, the growth rate showed a significant decrease. The strength trend curves of samples are also indicating that the improvement of compressive strength cannot increase linearly as a function of the autoclaved curing holding time. Anyway, the compressive strength of modified samples exhibited better mechanical property than that of the reference sample finally.
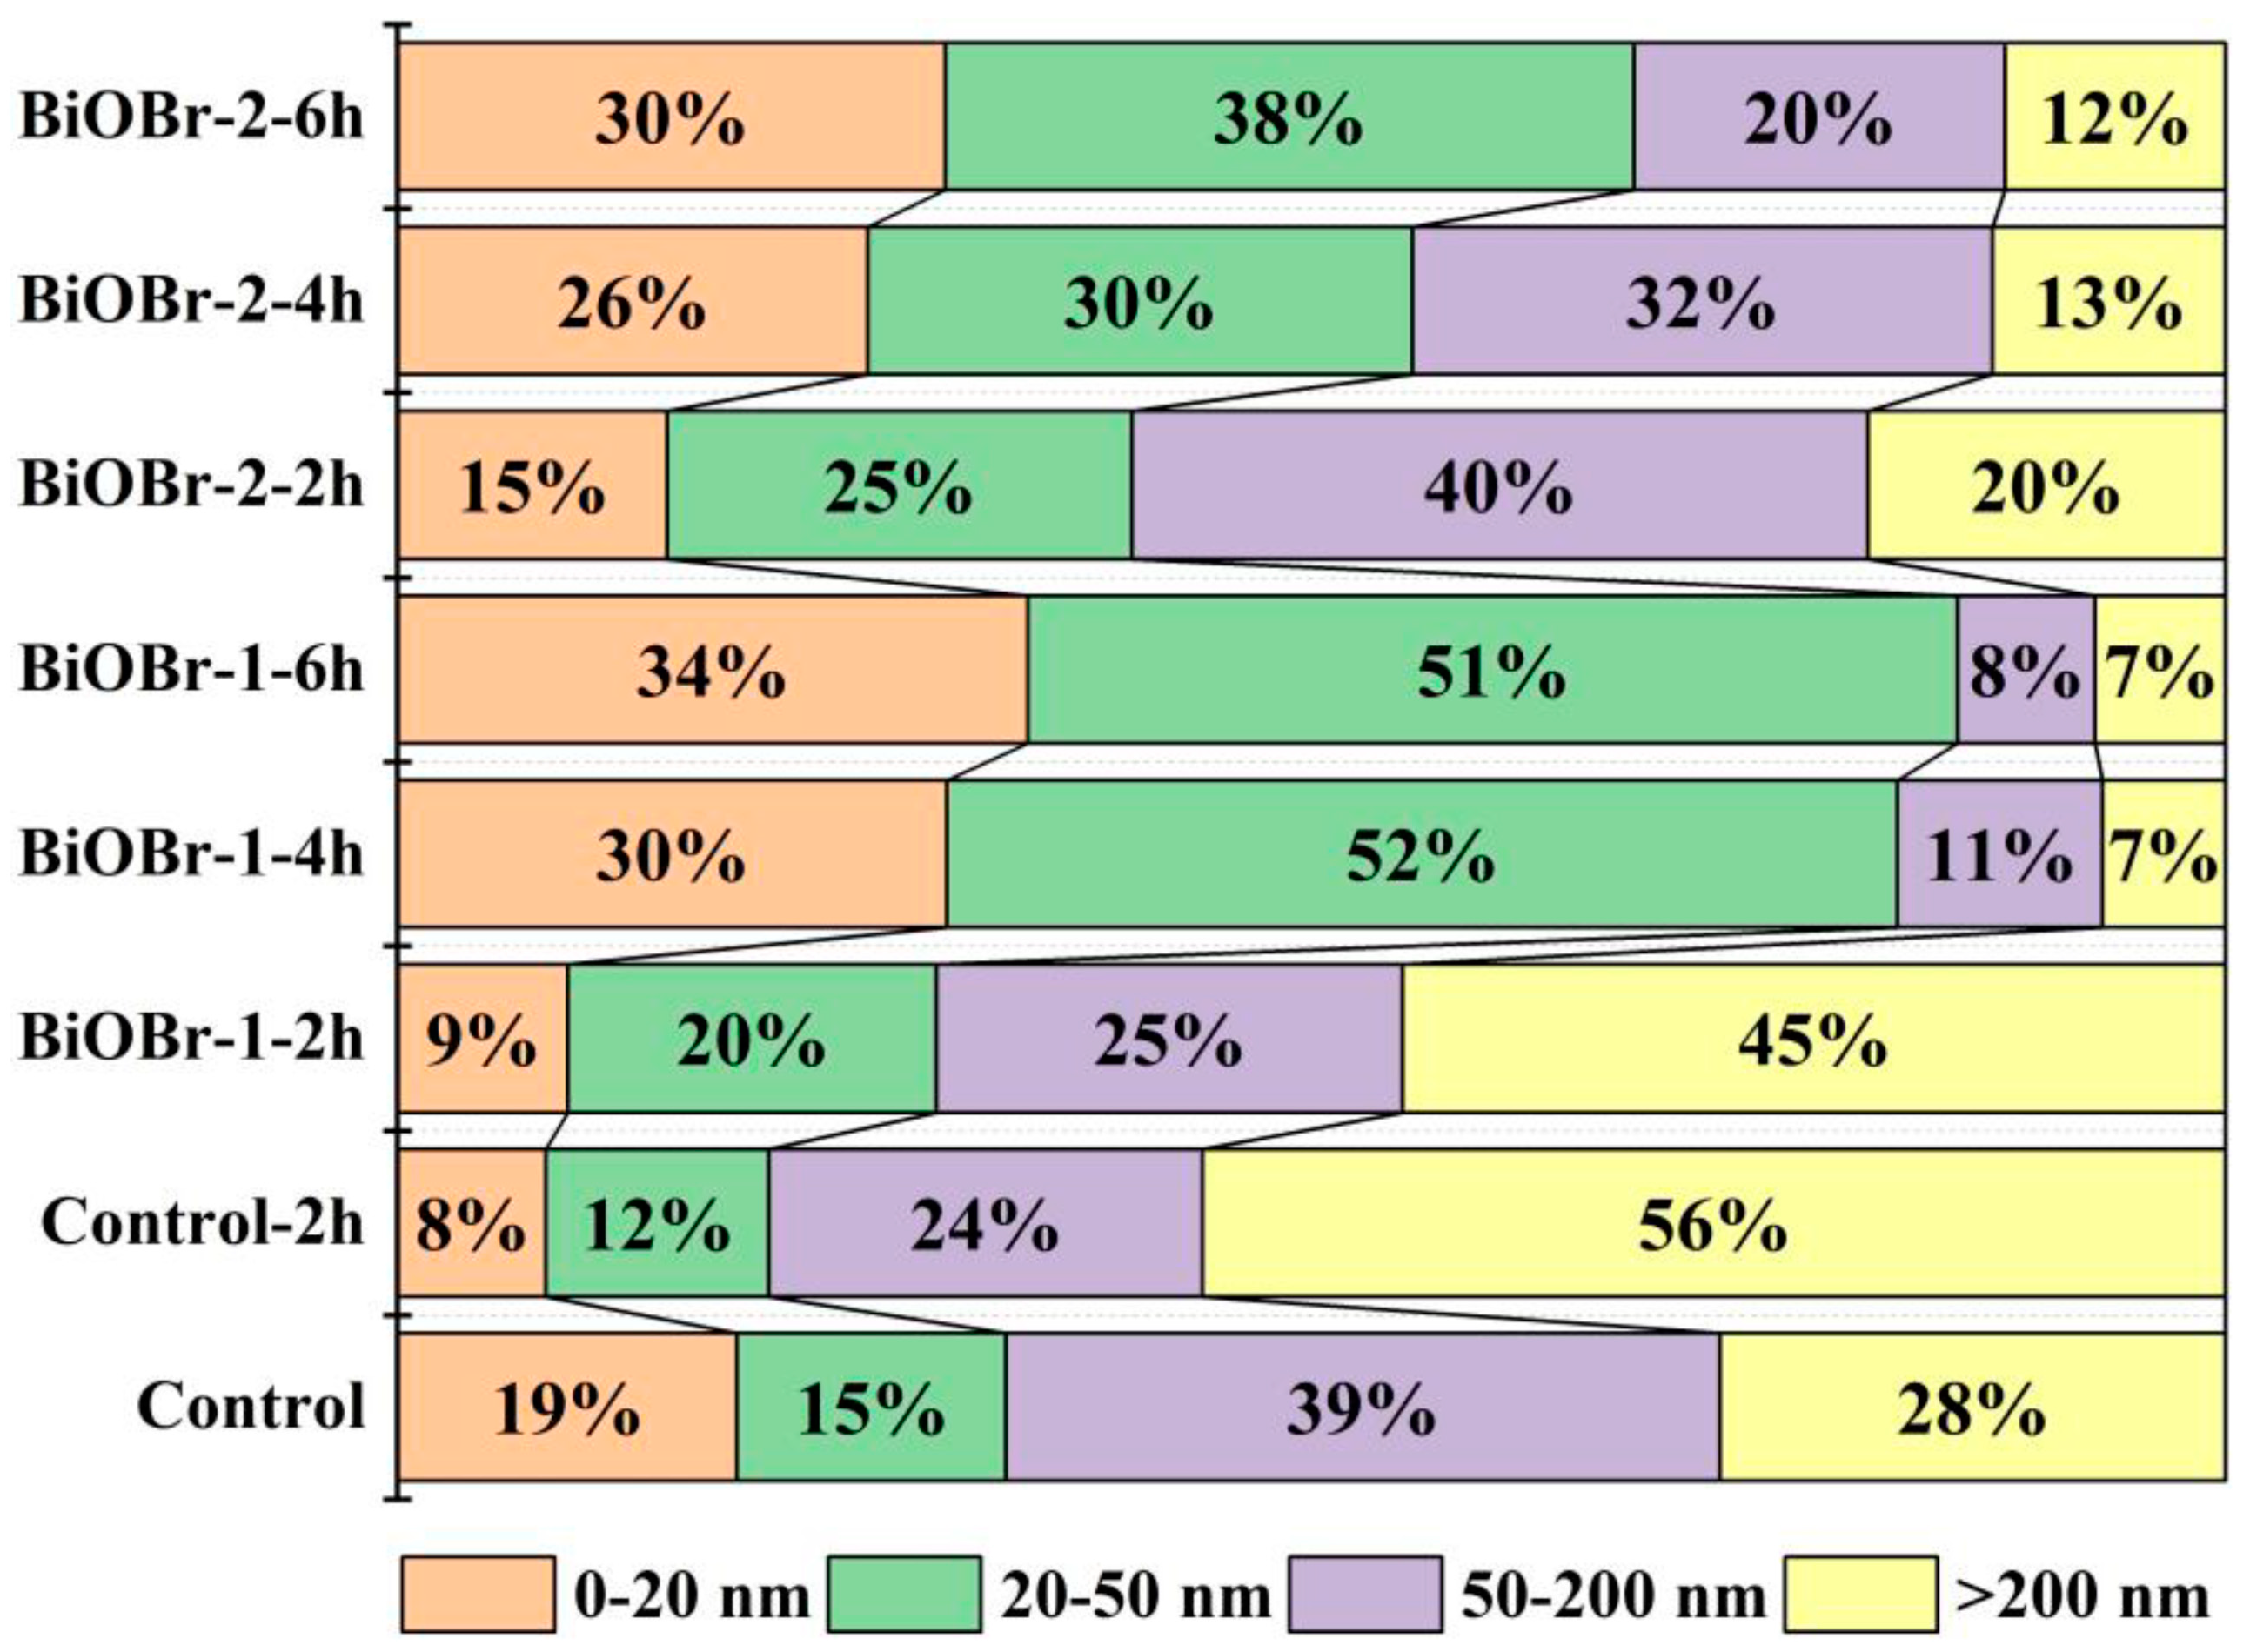
According to the work in [45], on the basis of the influence of the pore diameter on the properties of cement-based materials, pore size can be divided into four grades: harmless pores (<20 nm), less harmful pores (20–50 nm), harmful pores (50–200 nm), and greatly harmful pores (>200 nm). The volume proportion of different types of pores of samples are presented in Figure 10, and some conclusions drawn from the figure are as follows: (1) For the autoclaved curing samples, the pore deterioration process inevitably occurred in cement-based materials, and the sample BiOBr-2-X was barely affected. With the extension of autoclaved curing time, large diameter pores shifted to smaller diameter pores due to further hydration, and the addition of precursors accelerated this trend. (2) Both modified samples had higher compressive strength than the reference sample after autoclaved curing, indicating that, apart from the total porosity, the allocation proportion of different types of pores has a greater impact on the compressive strength. (3) Macropores favor the formation of BiOBr crystals with fine crystallinity, which may be undesired for the mechanical property. Therefore, optimizing the allocation proportion of pore distribution and increasing the total porosity may be a promising strategy to meet the requirements of two properties.
4. Conclusions
In this study, the influences of BiOBr precursor solutions on the RhB degradation and NOx removal of hardened photocatalytic cement paste were investigated, and the photocatalytic performance was also dependent on some effects, such as photocatalysts crystallinity and cement paste microstructure. The following conclusions are drawn:
- The photocatalytic performance of modified samples in RhB degradation (up to 45.4%) and NOx removal (up to 4.4%) is obviously improved, and the photodegradation rate is increased with the extension of autoclaved curing time, but the increment is not proportional to autoclaved curing time. The prolonged high-temperature treatment time can improve the crystallinity of photocatalysts, but the additional hydration products may occlude the exposed surface of photocatalysts.
- The voids in the cement paste matrices can provide space for crystal growth and reduce the chance of the exposed surface being blocked by hydration products. The modified samples with higher cumulative porosity favor a better photocatalytic activity, and this trend is adapted for both RhB degradation and NOx removal.
- Although the crystallinity of photocatalysts and the microstructure of cement paste can affect photocatalytic performance, the microstructure dominates the enhancement of photocatalytic performance of modified samples. Under the visible-light irradiation, sample BiOBr-1-X has better photocatalytic activity at each autoclaved curing time because the photocatalysts can better contact the light passing through the pores.
- The correlation between porosity and compressive strength of cement paste is established. The influence of different types of porosity distribution on the compressive strength of cement paste is greater than the porosity. It is feasible to develop optimal photocatalytic paste, on the premise of guaranteeing the compressive strength, by increasing the porosity and regulating the distribution of the pores.
Author Contributions
Conceptualization, Z.G. and X.C.; methodology, Z.G., L.Z., X.C., and D.W.; investigation, Z.G., J.W., Y.Y., and G.Z.; writing—original draft presentation, Z.G.; writing—review and editing, L.Z., X.C., and D.W.; visualization, J.W., Y.Y. and G.Z.; supervision, Z.G., L.Z., X.C., and D.W. All authors have read and agreed to the published version of the manuscript.
Funding
This research was funded by the National Natural Science Foundation of China (51902129, 51872121 and 51632003), Taishan Scholars Program, Case-by-Case Project for Top Outstanding Talents of Jinan, the Youth Innovation Support Program of Shandong Colleges and Universities (2019KJA017) and the 111 Project of International Corporation on Advanced Cement-based Materials (No. D17001).
Acknowledgments
The authors would like to acknowledge the financial support from the National Natural Science Foundation of China (51902129, 51872121 and 51632003), Taishan Scholars Program, Case-by-Case Project for Top Outstanding Talents of Jinan, the Youth Innovation Support Program of Shandong Colleges and Universities (2019KJA017) and the 111 Project of International Corporation on Advanced Cement-based Materials (No. D17001).
Conflicts of Interest
The authors declare no conflict of interest.
References
- Mills, A.; Hepburn, J.; Hazafy, D.; O’Rourke, C.; Krýsa, J.; Baudys, M.; Zlamal, M.; Bartkova, H.; Hill, C.E.; Winn, K.R.; et al. A simple, inexpensive method for the rapid testing of the photocatalytic activity of self-cleaning surfaces. J. Photochem. Photobiol. A Chem. 2013, 272, 18–20. [Google Scholar] [CrossRef] [Green Version]
- Sleiman, M.; Ban-Weiss, G.; Gilbert, H.E.; François, D.; Berdahl, P.; Kirchstetter, T.W.; Destaillats, H.; Levinson, R. Soiling of building envelope surfaces and its effect on solar reflectance—Part II: Development of an accelerate aging method for roofing materials. Sol. Energy Mater. Sol. Cells 2014, 122, 271–281. [Google Scholar] [CrossRef]
- Jiménez-Relinque, E.; Hingorani, R.; Rubiano, F.; Grande, M.; Castillo, Á.; Castellote, M. In situ evaluation of the NOx removal efficiency of photocatalytic pavements: Statistical analysis of the relevance of exposure time and environmental variables. Environ. Sci. Pollut. Res. 2019, 26, 36088–36095. [Google Scholar] [CrossRef]
- Bengtsson, N.; Castellote, M.J.A.C.C. Heterogeneous photocatalysis on construction materials: Effect of catalyst properties on the efficiency for degrading NOx and self cleaning. Acute Card. Care 1988, 16, 57–62. [Google Scholar] [CrossRef] [Green Version]
- Yang, L.; Hakki, A.; Zheng, L.; Jones, R.; Wang, F.; Macphee, D.E. Photocatalytic concrete for NOx abatement: Supported TiO2 efficiencies and impacts. Cem. Concr. Res. 2019, 116, 57–64. [Google Scholar] [CrossRef] [Green Version]
- Folli, A.; Jakobsen, U.H.; Guerrini, G.L.; Macphee, D. Rhodamine B Discolouration on TiO2 in the Cement Environment: A Look at Fundamental Aspects of the Self-cleaning Effect in Concretes. J. Adv. Oxid. Technol. 2009, 12, 126–133. [Google Scholar] [CrossRef]
- Goswami, D.Y.; Trivedi, D.M.; Block, S.S. Photocatalytic Disinfection of Indoor Air. J. Sol. Energy Eng. 1997, 119, 92–96. [Google Scholar] [CrossRef]
- Macphee, D.; Folli, A. Photocatalytic concretes—The interface between photocatalysis and cement chemistry. Cem. Concr. Res. 2016, 85, 48–54. [Google Scholar] [CrossRef]
- Folli, A.; Pade, C.; Hansen, T.B.; De Marco, T.; Macphee, D.E. TiO2 Photocatalysis in Cementitious Systems: Insights Into Self-Cleaning and Depollution Chemistry. Cem. Concr. Res. 2012, 42, 539–548. [Google Scholar] [CrossRef]
- Folli, A.; Pochard, I.; Nonat, A.; Jakobsen, U.H.; Shepherd, A.M.; Macphee, D. Engineering Photocatalytic Cements: Understanding TiO2 Surface Chemistry to Control and Modulate Photocatalytic Performances. J. Am. Ceram. Soc. 2010, 93, 3360–3369. [Google Scholar] [CrossRef]
- Ai, Z.; Ho, W.; Lee, S.; Zhang, L. Efficient Photocatalytic Removal of NO in Indoor Air with Hierarchical Bismuth Oxybromide Nanoplate Microspheres under Visible Light. Environ. Sci. Technol. 2009, 43, 4143–4150. [Google Scholar] [CrossRef]
- Dong, F.; Zhao, Z.; Sun, Y.; Zhang, Y.; Yan, S.; Wu, Z. An Advanced Semimetal-Organic Bi Spheres-g-C3N4 Nanohybrid with SPR-Enhanced Visible-Light Photocatalytic Performance for NO Purification. Environ. Sci. Technol. 2015, 49, 12432–12440. [Google Scholar] [CrossRef]
- Pol, V.G.; Palchik, O.; Gedanken, A.; Felner, I. Synthesis of Europium Oxide Nanorods by Ultrasound Irradiation. J. Phys. Chem. B 2002, 106, 9737–9743. [Google Scholar] [CrossRef]
- Yoshikawa, J.; Lewis, J.A.; Chun, B.-W. Comb Polymer Architecture, Ionic Strength, and Particle Size Effects on the BaTiO3 Suspension Stability. J. Am. Ceram. Soc. 2009, 92, S42–S49. [Google Scholar] [CrossRef]
- Sato, K. Influence of Solid Fraction on the Optimum Molecular Weight of Polymer Dispersants in Aqueous TiO2 Nanoparticle Suspensions. J. Am. Ceram. Soc. 2007, 90, 3401–3406. [Google Scholar] [CrossRef]
- Lyckfeldt, O.; Palmqvist, L.; Carlström, E. Stabilization of alumina with polyelectrolyte and comb copolymer in solvent mixtures of water and alcohols. J. Eur. Ceram. Soc. 2009, 29, 1069–1076. [Google Scholar] [CrossRef]
- Vu, T.A.; Dao, C.D.; Hoang, T.T.; Le, G.H.; Nguyen, K.T.; Dang, P.T.; Tran, H.T.; Nguyen, T.V. Study on photocatalytic activity of TiO2 and non-metal doped TiO2 in Rhodamine B degradation under visible light irradiation. Int. J. Nanotechnol. 2013, 10, 235–246. [Google Scholar] [CrossRef]
- Lee, M.S.; Hong, S.-S.; Mohseni, M. Synthesis of photocatalytic nanosized TiO2-Ag particles with sol-gel method using reduction agent. J. Mol. Catal. A Chem. 2005, 242, 135–140. [Google Scholar] [CrossRef]
- Li, K.; Chai, B.; Peng, T.; Mao, J.; Zan, L. Preparation of AgIn5S8/TiO2 Heterojunction Nanocomposite and Its Enhanced Photocatalytic H2 Production Property under Visible Light. ACS Catal. 2013, 3, 170–177. [Google Scholar] [CrossRef]
- Huang, W.L.; Zhu, Q. Electronic structures of relaxed BiOX (X = F, Cl, Br, I) photocatalysts. Comput. Mater. Sci. 2008, 43, 1101–1108. [Google Scholar] [CrossRef]
- Wang, Y.; Shi, Z.; Fan, C.; Wang, X.; Hao, X.; Chi, Y. Synthesis, characterization, and photocatalytic properties of BiOBr catalyst. J. Solid State Chem. 2013, 199, 224–229. [Google Scholar] [CrossRef]
- Dudita, M.; Bogatu, C.; Enesca, A.; Duta, A. The influence of the additives composition and concentration on the properties of SnOx thin films used in photocatalysis. Mater. Lett. 2011, 65, 2185–2189. [Google Scholar] [CrossRef]
- Ji, M.; Zhang, Z.; Xia, J.; Di, J.; Liu, Y.; Chen, R.; Yin, S.; Zhang, S.; Li, H. Enhanced photocatalytic performance of carbon quantum dots/BiOBr composite and mechanism investigation. Chin. Chem. Lett. 2018, 29, 805–810. [Google Scholar] [CrossRef]
- Wang, H.T.; Shi, M.S.; Yang, H.F.; Chang, N.; Zhang, H.; Liu, Y.P.; Lu, M.C.; Ao, D.; Chu, D.Q. Template-Free Synthesis of Nanosliced BiOBr Hollow Microspheres with High Surface Area and Efficient Photocatalytic Activity. Mater. Lett. 2018, 222, 164–167. [Google Scholar] [CrossRef]
- Wang, Y.; He, J.; Zhu, Y.; Zhang, H.; Yang, C.; Wang, K.; Wu, S.-C.; Chueh, Y.-L.; Jiang, W. Hierarchical Bi-doped BiOBr microspheres assembled from nanosheets with (001) facet exposed via crystal facet engineering toward highly efficient visible light photocatalysis. Appl. Surf. Sci. 2020, 514, 145927. [Google Scholar] [CrossRef]
- Ni, J.; Liu, D.; Wang, W.; Wang, A.; Jia, J.; Tian, J.; Xing, Z. Hierarchical Defect-Rich Flower-like BiOBr/Ag Nanoparticles/Ultrathin g-C3N4 with Transfer Channels Plasmonic Z-scheme Heterojunction Photocatalyst for Accelerated Visible-light-driven Photothermal-Photocatalytic Oxytetracycline Degradation. Chem. Eng. J. 2021, 419, 129969. [Google Scholar] [CrossRef]
- Duresa, L.W.; Kuo, D.-H.; Bekena, F.T.; Kebede, W.L. Simple room temperature synthesis of oxygen vacancy-rich and In-doped BiOBr nanosheet and its highly enhanced photocatalytic activity under visible-light irradiation. J. Phys. Chem. Solids 2021, 156, 110132. [Google Scholar] [CrossRef]
- Bárdos, E.; Márta, V.; Baia, L.; Todea, M.; Kovács, G.; Baán, K.; Garg, S.; Pap, Z.; Hernadi, K. Hydrothermal crystallization of bismuth oxybromide (BiOBr) in the presence of different shape controlling agentst. Appl. Surf. Sci. 2020, 518, 146184. [Google Scholar] [CrossRef]
- Xia, J.; Yin, S.; Li, H.; Xu, H.; Xu, L.; Xu, Y. Improved visible light photocatalytic activity of sphere-like BiOBr hollow and porous structures synthesized via a reactable ionic liquid. Dalton Trans. 2011, 40, 5249–5258. [Google Scholar] [CrossRef]
- Dong, X.; Zhang, W.; Sun, Y.; Li, J.; Cen, W.; Cui, Z.; Huang, H.; Dong, F. Visible-light-induced charge transfer pathway and photocatalysis mechanism on Bi semimetal@defective BiOBr hierarchical microspheres. J. Catal. 2018, 357, 41–50. [Google Scholar] [CrossRef]
- Lu, L.; Zhou, M.-Y.; Yin, L.; Zhou, G.-W.; Jiang, T.; Wan, X.-K.; Shi, H.-X. Tuning the physicochemical property of BiOBr via pH adjustment: Towards an efficient photocatalyst for degradation of bisphenol A. J. Mol. Catal. A Chem. 2016, 423, 379–385. [Google Scholar] [CrossRef]
- Wang, D.; Hou, P.; Yang, P.; Cheng, X. BiOBr@SiO2 flower-like nanospheres chemically-bonded on cement-based materials for photocatalysis. Appl. Surf. Sci. 2018, 430, 539–548. [Google Scholar] [CrossRef]
- Sugrañez, R.; Álvarez, J.; Cruz-Yusta, M.; Mármol, I.; Morales, J.; Vila, J.; Sánchez, L. Enhanced photocatalytic degradation of NOx gases by regulating the microstructure of mortar cement modified with titanium dioxide. Build. Environ. 2013, 69, 55–63. [Google Scholar] [CrossRef]
- Lucas, S.; Ferreira, V.; de Aguiar, J.B. Incorporation of titanium dioxide nanoparticles in mortars—Influence of microstructure in the hardened state properties and photocatalytic activity. Cem. Concr. Res. 2013, 43, 112–120. [Google Scholar] [CrossRef] [Green Version]
- Qu, P.; Zhao, J.; Shen, T.; Hidaka, H. TiO2-assisted photodegradation of dyes: A study of two competitive primary processes in the degradation of RB in an aqueous TiO2 colloidal solution. J. Mol. Catal. A Chem. 1998, 129, 257–268. [Google Scholar] [CrossRef]
- Guo, M.-Z.; Maury-Ramirez, A.; Poon, C.S. Self-cleaning ability of titanium dioxide clear paint coated architectural mortar and its potential in field application. J. Clean. Prod. 2016, 112, 3583–3588. [Google Scholar] [CrossRef]
- Chen, J.; Kou, S.-C.; Poon, C.S. Photocatalytic cement-based materials: Comparison of nitrogen oxides and toluene removal potentials and evaluation of self-cleaning performance. Build. Environ. 2011, 46, 1827–1833. [Google Scholar] [CrossRef]
- Xie, X.; Hao, C.; Huang, Y.; Huang, Z. Influence of TiO2-based photocatalytic coating road on traffic-related NOx pollutants in urban street canyon by CFD modeling. Sci. Total Environ. 2020, 724, 138059. [Google Scholar] [CrossRef]
- Yang, L.; Hakki, A.; Wang, F.; Macphee, D.E. Photocatalyst efficiencies in concrete technology: The effect of photocatalyst placement. Appl. Catal. B Environ. 2018, 222, 200–208. [Google Scholar] [CrossRef] [Green Version]
- Geng, Z.; Xin, M.; Zhu, X.; Xu, H.; Cheng, X.; Wang, D. A new method for preparing photocatalytic cement-based materials and the investigation on properties and mechanism. J. Build. Eng. 2021, 35, 102080. [Google Scholar] [CrossRef]
- Strini, A.; Cassese, S.; Schiavi, L. Measurement of benzene, toluene, ethylbenzene and o-xylene gas phase photodegradation by titanium dioxide dispersed in cementitious materials using a mixed flow reactor. Appl. Catal. B Environ. 2005, 61, 90–97. [Google Scholar] [CrossRef]
- Jimenez-Relinque, E.; Rodriguez-Garcia, J.; Castillo, A.; Castellote, M. Characteristics and efficiency of photocatalytic cementitious materials: Type of binder, roughness and microstructure-ScienceDirect. Cem. Concr. Res. 2015, 71, 124–131. [Google Scholar] [CrossRef]
- Guimarães, D.; Oliveira, V.D.A.; Leão, V.A. Kinetic and thermal decomposition of ettringite synthesized from aqueous solutions. J. Therm. Anal. Calorim. 2016, 124, 1679–1689. [Google Scholar] [CrossRef]
- Intaphong, P.; Phuruangrat, A.; Karthik, K.; Dumrongrojthanath, P.; Thongtem, T.; Thongtem, S. Effect of pH on Phase, Morphology and Photocatalytic Properties of BiOBr Synthesized by Hydrothermal Method. J. Inorg. Organomet. Polym. Mater. 2019, 30, 714–721. [Google Scholar] [CrossRef]
- Wu, Z. An approach to the recent trends of concrete science and technology. J. Chin. Ceram. Soc. 1979, 7, 262–270. [Google Scholar] [CrossRef]
Figure 1.
RhB degradation rate of different samples as a function of autoclaved curing time.

Figure 2.
NO-NOx removed and NO2 formed efficiency of modified samples with different autoclaved curing time.
Figure 2.
NO-NOx removed and NO2 formed efficiency of modified samples with different autoclaved curing time.

Figure 3.
The nitrate selectivity of modified samples with different autoclaved curing time.

Figure 4.
XRD patterns of different samples with different curing conditions.

Figure 5.
Differential pore size distributions of samples.

Figure 6.
SEM images of hardened samples after autoclaved curing for different time.

Figure 7.
BiOBr crystals inside the pores of sample BiOBr-1-6h.

Figure 8.
SEM image and EDS-mapping images of BiOBr crystals.

Figure 9.
Compressive strength evolution of samples. (AT: ambient temperature. AT curing samples represent standard curing for different time, and Autoclaved curing samples represent autoclaved curing for different time after standard curing for 12 h).
Figure 9.
Compressive strength evolution of samples. (AT: ambient temperature. AT curing samples represent standard curing for different time, and Autoclaved curing samples represent autoclaved curing for different time after standard curing for 12 h).

Figure 10.
The proportion of different types of pores in samples.


Table 1.
Components and curing methods of cement paste samples.
| Sample | Cement | Water | Precursor Solution | Autoclaved Curing | |||
|---|---|---|---|---|---|---|---|
| Bi(NO3)3∙5H2O | NaBr | C2H6O2 | HNO3 | ||||
| Control | 1800 g | 630 g | 0 h | ||||
| BiOBr-1 | 1800 g | 630 g | 27 g | 5.727 g | 40 mL | ||
| BiOBr-2 | 1800 g | 380 g | 27 g | 5.727 g | 250 mL | ||
| Control-2h | 1800 g | 630 g | 2 h | ||||
| BiOBr-1-2h | 1800 g | 630 g | 27 g | 5.727 g | 40 mL | ||
| BiOBr-2-2h | 1800 g | 380 g | 27 g | 5.727 g | 250 mL | ||
| Control-4h | 1800 g | 630 g | 4 h | ||||
| BiOBr-1-4h | 1800 g | 630 g | 27 g | 5.727 g | 40 mL | ||
| BiOBr-2-4h | 1800 g | 380 g | 27 g | 5.727 g | 250 mL | ||
| Control-6h | 1800 g | 630 g | 6 h | ||||
| BiOBr-1-6h | 1800 g | 630 g | 27 g | 5.727 g | 40 mL | ||
| BiOBr-2-6h | 1800 g | 380 g | 27 g | 5.727 g | 250 mL | ||
Table 2.
Microstructure characteristics of samples.
| Sample | Cumulative Porosity (%) | d ≤ 1 μm (mL/g) | 1 < d < 100 μm (mL/g) | d ≥ 100 μm (mL/g) |
|---|---|---|---|---|
| Control | 21.4 | 0.1080 | 0.0055 | 0.0061 |
| Control-2h | 26.0 | 0.0871 | 0.0176 | 0.0750 |
| BiOBr-1-2h | 29.3 | 0.0763 | 0.0371 | 0.0195 |
| BiOBr-1-4h | 32.4 | 0.1771 | 0.0012 | 0.0086 |
| BiOBr-1-6h | 36.4 | 0.1879 | 0.0064 | 0.0055 |
| BiOBr-2-2h | 21.7 | 0.1000 | 0.0105 | 0.0054 |
| BiOBr-2-4h | 22.7 | 0.1083 | 0.0062 | 0.0063 |
| BiOBr-2-6h | 22.3 | 0.093 | 0.0050 | 0.0064 |
Publisher’s Note: MDPI stays neutral with regard to jurisdictional claims in published maps and institutional affiliations. |
© 2021 by the authors. Licensee MDPI, Basel, Switzerland. This article is an open access article distributed under the terms and conditions of the Creative Commons Attribution (CC BY) license (https://creativecommons.org/licenses/by/4.0/).
Share and Cite
MDPI and ACS Style
Geng, Z.; Zhang, L.; Wang, J.; Yu, Y.; Zhang, G.; Cheng, X.; Wang, D. BiOBr Precursor Solutions Modified Cement Paste: The Photocatalytic Performance and Effects. Crystals 2021, 11, 969. https://doi.org/10.3390/cryst11080969
AMA Style
Geng Z, Zhang L, Wang J, Yu Y, Zhang G, Cheng X, Wang D. BiOBr Precursor Solutions Modified Cement Paste: The Photocatalytic Performance and Effects. Crystals. 2021; 11(8):969. https://doi.org/10.3390/cryst11080969
Chicago/Turabian StyleGeng, Zhi, Lina Zhang, Jin Wang, Yanfeng Yu, Guoling Zhang, Xin Cheng, and Dan Wang. 2021. "BiOBr Precursor Solutions Modified Cement Paste: The Photocatalytic Performance and Effects" Crystals 11, no. 8: 969. https://doi.org/10.3390/cryst11080969
Note that from the first issue of 2016, this journal uses article numbers instead of page numbers. See further details here.