


The significant global rise in diet-related non-communicable diseases indicates that there are serious nutritional issues in both developed and developing countries( 1 ). According to WHO, CVD were responsible for the largest number of deaths in 2015( 2 ). Many diseases exist not only as a result of increasing rates of obesity and overweight among children, but also because of the unhealthy diets of children( 3 ). Poor diet, particularly due to intake of foods high in sugar and fat, is one of the major threats to health and well-being( 4 ). The many different causes of childhood and adulthood obesity such as socio-economic inequalities also include factors related to deprivation, education level and ethnicity. In the UK, observational studies report that lower socio-economic groups consume less oily fish, fruits and vegetables, but more red and processed meats and foods and drinks high in free sugars compared with higher socio-economic groups( 5 ). In addition, the food environment also plays a crucial role in individual behaviours and food choices. For example, the availability, accessibility, portion size and cost of different food types both at home and in surrounding food outlets are all influential( 6 ).
The main driver of overweight and obesity is believed to be the imbalance between energy intake and energy expenditure, mainly due to the overconsumption of energy-dense foods that are known to be high in fat and sugars as well as an increase in sedentary lifestyles( 7 ). Overconsumption of energy-dense foods derived from fast and convenience food outlets is believed to be an important contributor to the increased risk of obesity and type 2 diabetes among young generations( Reference Anderson and Butcher 8 , 9 ). Two longitudinal prospective studies including young adults aged 18–30 years, with 3 to 15 years follow-up, found that increased frequency of fast-food restaurant visits( Reference Bowman, Gortmaker and Ebbeling 10 ) and consumption of fast food( Reference Woodruff and Hanning 11 ) can lead to increased body weight (follow-up v. baseline). In fact, higher fat and total energy intakes are linked with consumption of takeaway and fast foods which offer a variety of ready-to-eat meals and energy-dense foods( Reference Lachat, Nago and Verstraeten 12 ). Consumption of fast food remains positively and significantly associated with total energy intake as well as intakes of total fat, saturated fat, carbohydrates, sugar and sugar-sweetened beverages( Reference Bowman, Gortmaker and Ebbeling 10 ). Consumption of takeaway meals and food purchased outside the home (rather than food prepared at home) is found to be negatively associated with diet quality( Reference Woodruff and Hanning 11 , Reference Moore, Roux and Nettleton 13 ). In England, schoolchildren were observed to purchase foods from surrounding food outlets not only during lunch break but also during the journey going to and from school. Young people are specifically targeted for price promotion and many of those food outlets provide discounts on items such as sugar-sweetened drinks, hot food takeaways and confectionery( 14 ). A recent cross-sectional study based in three cities in England (London, Birmingham and Leicester) found that 28 % of children aged 9–11 years from eighty-five primary schools consumed takeaway meals at least once per week. LDL-cholesterol, fat mass index and total cholesterol were all observed to be higher among students who consumed takeaway meals (at least once per week) than among those who never or hardly consumed takeaway meals( Reference Donin, Nightingale and Owen 15 ).
Previous research has assessed individual macro- and/or micronutrients; however, the need for higher-quality data to strengthen the evidence for overall diet is required. A simple, easy-to-interpret tool to indicate the quality of a diet without requiring intensive analysis of foods to nutrients in this age group has resulted in the development of the Diet Quality Index for Adolescents (DQI-A)( Reference Ballard 16 , Reference Vyncke, Fernandez and Fajo-Pascual 17 ). The DQI-A is based on the intake of food groups without including the intake of nutrients and it was adapted from a validated index called the Diet Quality Index for Preschool Children. The validated DQI for pre-schoolers was derived from the original DQI. The DQI-A was developed mainly to assess the degree of adherence of adolescents’ diet with food-based dietary guidelines (FBDG)( Reference Huybrechts, Vereecken and De Bacquer 18 ). FBDG, also known as dietary guidelines, are used to provide sufficient information for different governmental sectors to implement interventions towards healthy eating and lifestyles. Such interventions can focus on food and nutrition, polices regarding health and agriculture, and educational programmes. Therefore, the primary role of FBDG is to provide advice to the general public, thereby enabling individuals to meet their daily dietary requirements of both nutrients and food groups; this will help in preventing chronic diseases and promoting healthy lifestyles( 19 ). The aim of the present study was to evaluate the association of the frequency of consuming takeaway meals and meals out with diet quality of UK adolescents aged 11–18 years.
Methods
The data used in the present study were from the National Diet and Nutrition Survey (NDNS), an annual rolling programme aiming to assess nutritional intake and status of people living in private households in the UK aged 1·5 years or above. In each year of the survey, a sample of 500 adults (aged 19 years or over) and 500 children (aged 1·5–18 years) was randomly recruited based on postcode. Randomly selected addresses were posted information leaflets describing the purpose of the NDNS and a consent form. These were followed up by a face-to-face visit by an interviewer. For children aged under 16 years, consent was sought from both the child and their parents for the interview, blood and urine sampling. For adults aged 16 years or above, parental consent was obtained for the blood and urine sampling. Ethical approval for the NDNS was obtained from the Oxfordshire A Research Ethics Committee( 20 ). In the present study, all participants aged 11–18 years from the NDNS data sets for 2008 to 2014 were included (Years 1–6).
Variables of interest
Takeaway meals and meals out
The interviewers asked the participants two questions on fast food to collect data relating to their eating habits. In both questions, the interviewers provided further clarification for the terms ‘meals out’ and ‘takeaway meals at home’. These questions were: ‘On average, how often do you/does your child eat meals out in a restaurant or cafe?’, where the meals mean more than a beverage or bag of chips; and ‘On average, how often do you/does your child eat takeaway meals at home?’, where the meals mean more than a beverage or bag of chips including pizza, fish and chips, burgers, etc. Using frequency of consuming takeaway meals at home and consuming meals outside the home, respondents were categorised as low consumers (including rarely/never), moderate consumers (including once per month) and frequent consumers (including once or twice per week, three or four times per week, and five or more times per week). Participants with ‘do not know’ answers were excluded from the analysis. This method of categorisation has been used previously, as it has been reported that the risk of developing health-related diseases is linked with consuming fast food more than once weekly( Reference Adams, Goffe and Brown 21 , Reference Fraser, Edwards and Cade 22 ).
Food intake
The intake of food was obtained from 4d diary records. The diet quality score was calculated for each day, then the mean value of the four days was calculated and used to assess the diet quality index of the adolescent participants. Some food items were excluded from the analysis, including commercial toddler drinks and foods. Those food items were excluded because the current study only involved adolescents aged 11–18 years and toddler foods and drinks are not typically consumed by older children.
DQI-A
The latest version of the FBDG in the UK is the Eatwell Guide, which was published in 2016 by Public Health England and consists of seven main food groups as follows: (i) potatoes, bread, rice, pasta and other starchy carbohydrates; (ii) dairy and alternatives; (iii) beans, pulses, fish, eggs, meat and other proteins; (iv) fruit and vegetables; (v) oil and spreads; (vi) water; and (vii) confectionery and high-fat and high-sugar snacks( 19 , 23 ). The Flemish FBDG, which was used to validate the DQI-A, includes mostly the same recommended food groups mentioned in the Eatwell Guide. Like FBDG, the DQI-A relies on three main components, namely the quality, diversity and equilibrium of the diet compared with the governmental dietary guidelines. Each component has its own definition and technique for the scoring criteria( Reference Vyncke, Fernandez and Fajo-Pascual 17 ).
Diet quality component
The diet quality component (DQc) assesses diet based on the quality of the foods consumed within nine recommended food groups: (i) water; (ii) bread and cereal; (iii) potatoes and grains; (iv) vegetable; (v) fruits; (vi) milk products; (vii) cheese; (viii) meat, fish and substitutes; and (ix) fat and oils. To calculate the score, the amount of food consumed (m) from each food group is multiplied by a weighting factor. The weighting factor is divided into three groups, namely the preference, intermediate and low-nutrient/energy-dense groups. Each weighting factor has an associated digit, as follows: ‘+1’ for the preference group, including cereal/brown bread, fish and fresh fruit; ‘0’ for the intermediate group, including white bread and minced meat; and ‘−1’ for the low-nutrient/energy-dense group, including soft drinks, sweet snacks and chicken nuggets. First, the diet quality was calculated for each of the nine food groups and then the final score of this component was calculated using the equation: ∑(DQ)/∑m × 100 %. More details and examples on the classification of food items and the scoring criteria of weighting factors can be found elsewhere( Reference Vyncke, Fernandez and Fajo-Pascual 17 ).
Diet diversity component
The diet diversity component (DDc) assesses the degree of variation in an adolescent’s diet, where the scoring range is from 0 to 9 points. Consuming at least one serving from each of the nine recommended food groups adds 1 point to the total score. For example, if an adolescent’s mean consumption for the fruit group is more than 80 g, then s/he gains a score of 1; otherwise, the score will be 0. The final score for this component can be calculated using the equation: ∑(DD)/9×100 % (sum of DD points for all nine food groups for each adolescent). In terms of serving size, because the Eatwell Guide does not provide information regarding portion and/or serving size for all the recommended food groups, the portion size recommended by the British Dietetic Association was used as follows: (i) water, 200 ml; (ii) bread and cereal, 35 g; (iii) potatoes and grains, 175 g; (iv) vegetables, 80 g; (v) fruits, 80 g; (vi) milk products, 200 ml; (vii) cheese, 30 g; (viii) meat, fish and substitutes, 100 g; and (ix) fat and oils, 4 g. To gain a better and more accurate measurement of recommended portion sizes of these food groups among children and adolescents, other reference sources were used, such as those of the Food Standards Agency, especially for starchy food groups( 24 , 25 ).
Diet equilibrium component
The diet equilibrium component (DEc) consists of two sub-components, namely the adequacy component (diet adequacy, DAx) and the excess component (diet excess, DEx). These two sub-components express the degree of adherence of an adolescent’s diet to the minimum and maximum intakes of each of the nine recommended food groups. The adequacy component represents the percentage of the minimum recommended intake of each of the nine food groups, converted to ‘1’, whereas the excess component represents the percentage of the intake exceeding the upper limit of the recommendation (eleven food groups, nine recommended and two non-recommended), converted to ‘1’ if larger than 1 and converted to ‘0’ if below 0. Then, the dietary equilibrium is calculated by subtracting DEx from DAx (i.e. DE=DAx–DEx). Finally, the total diet equilibrium score can be calculated by dividing the sum of diet equilibrium scores by 11 and multiplying by 100: ∑(DE)/11×100 %. The recommended daily intake of all food groups is based on the Flemish FBDG, where the minimum and maximum intakes of each of food group are provided. More details on how to calculate each of these sub-components can be found in published documents( Reference Vyncke, Fernandez and Fajo-Pascual 17 ).
Total DQI-A score
All three main components – diet quality, diet diversity and diet equilibrium – are presented in percentages. The percentage ranges for both DDc and DEc are 0–100 %, whereas the DQc percentage range is −100 to 100 %. Therefore, the mean percentage of the three main components results in a DQI-A score ranging from –33 to 100 %. A higher DQI-A percentage score reflects a better quality of diet.
Statistical analysis
All statistical analyses were carried out using the statistical software package Stata version 15.0. Different NDNS data sets were merged before analysis. The dietary data set was merged with either household or individual using ISERIAL as the unique identifier for individuals. In addition, the data sets for Years 1–4 and 5–6 were combined, as each of these was provided individually by NDNS. Applying weight analyses to a data set is required to adjust for non-responses, for example, in the NDNS for individual and/or household data sets. The weighting variable provided in the NDNS guideline report was used, allowing generation of an equal distribution of the selected population across the four parts of the UK; thus, the results obtained from the Year 1 to Year 6 surveys can be used together.
In addition, the distribution of variables was checked before any statistical test was performed, including comparison of means with the t test, ANOVA comparison test and multiple or linear regression analysis. Simple summary description was conducted to provide general information related to the study such as response rate, the proportion of participating males and females, ethnicity and survey year distribution. Mean scores and confidence intervals of DQI-A and its components were assessed. A comparison test was also carried out to examine the differences between dietary quality score and its components between each day of the diary records.
Linear regression was then applied, taking into consideration the clustering effect of the adolescents by their unique identifier number, to estimate the association of the overall diet quality score or its components (outcome variables) with takeaway meals or meals consumed out of home (exposure variables). The results for the linear regression are presented as unadjusted values applied alone or as adjusted values after controlling for age, sex and equivalised household income. Equivalised household income is a standard methodology, required to adjust the differences in financial resources for differences in household type such as size( 26 ). P values of less than 0·05 were considered statistically significant for all tests and 95 % CI are presented with results.
Results
Background description
In total, 2045 adolescents were recruited into the NDNS and completed a minimum 3d of diary records; 98 % of these participants had 4 d diary records. The proportion of females was slightly higher than that of males, at 51·5 % (n 1033) and 49·5 % (n 1012), respectively; the mean age of both genders was 14·6 years. In terms of ethnicity, 90·8 % of adolescents were reported to be white, while 9·2 % were from non-white ethnic backgrounds. The weight measurement was valid for only 1981 participants and females had a significantly lower weight than males, by 2·3 kg (95 % CI –3·7, –1·0 kg; P<0·01). Males had significantly higher food energy intake than females, with a mean intake of 8138·9 kJ/d (95 % CI 8005·4, 8272·5 kJ/d; P<0·01; Table 1). The response rate for information on physical activity level was less than 50 %, representing all age groups from both genders (data not shown).
Table 1 Summary description of age, weight and food energy intake among British adolescents aged 11–18 years from the National Diet and Nutrition Survey (NDNS) rolling programme, Years 1–6 (2008–2014)

The overall DQI-A% score was broadly similar across the days with no statistically significant differences between the days (Table 2). However, there were small but significant differences in the percentage scores for the different components and sub-components, with significant differences in scores observed between the days for DDc, DEc, DAx and DEx, although not for DQc. Furthermore, participants who completed 4 d diary records had higher overall DQI-A% score by 4·6 % (95 % CI 0·9, 0·8 %; P=0·014) than participants who had 3 d diary records. Evaluation of the mean DQI-A% score and its components and sub-components among all three takeaway and meals-out consumer groups can be seen in Tables 3 and 4. The UK adolescents had a mean diet quality score of 20·4 % out of 100 % (ranging from –24·2 to 67·2 %).
Table 2 Mean scores of overall diet quality index and its components and sub-components (expressed as percentage) across the three or four days of diary records among British adolescents aged 11–18 years (n 2045) from the National Diet and Nutrition Survey (NDNS) rolling programme, Years 1–6 (2008–2014)
DQI-A, Diet Quality Index for Adolescents; DQc, diet quality component; DDc, diet diversity component, DEc, diet equilibrium component; DAx, diet adequacy sub-component; DEx, diet excess sub-component.
Table 3 Summary description of overall diet quality index and its component and sub-component scores (expressed as percentage), age and food energy intake according to frequencyFootnote * of takeaway consumption among British adolescents aged 11–18 years (n 2045) from the National Diet and Nutrition Survey (NDNS) rolling programme, Years 1–6 (2008–2014)
DQI-A, Diet Quality Index for Adolescents; DQc, diet quality component; DDc, diet diversity component, DEc, diet equilibrium component; DAx, diet adequacy sub-component; DEx, diet excess sub-component.
* Low consumption defined as rarely/never; moderate consumption defined as once per month; and frequent consumption defined as once or twice per week or more.
Table 4 Summary description of overall diet quality index and its component and sub-component scores (expressed as percentage), age and energy intake according to frequencyFootnote * of consuming meals out among British adolescents aged 11–18 years (n 2045) from the National Diet and Nutrition Survey (NDNS) rolling programme, Years 1–6 (2008–2014)

DQI-A, Diet Quality Index for Adolescents; DQc, diet quality component; DDc, diet diversity component, DEc, diet equilibrium component; DAx, diet adequacy sub-component; DEx, diet excess sub-component.
* Low consumption defined as rarely/never; moderate consumption defined as once per month; and frequent consumption defined as once or twice per week or more.
Consumption of takeaways and meals out
The frequent consumption of takeaways (once or twice per week or more) was reported by 29·8 % (n 589) of participants, whereas 24·3 % (n 496) of them reported to be frequent consumers of meals out. The majority of participants were moderate consumers (once per month) of takeaways (44·3 %) and meals out (46·8 %). Those who reported to rarely or never consume takeaway meals or meals out represented 26·9 and 29·0 % of the total number of participants, respectively. The percentage of adolescents reporting frequent takeaway consumption was 37 and 28 % for those who completed 3 d and 4 d diaries, respectively. Similarly, the percentage of adolescents reporting frequently consuming meals out was 31 and 24 % for those who completed 3 d and 4 d diaries, respectively. The proportion of participants who consumed takeaway meals once or twice per week or more was found to be higher among participants with the lowest equivalised household income compared with those with highest income. However, this was not true for the consumption of meals outside the home. As can be seen in Fig. 1, 13 % (n 68) of the frequent meals-out consumers were from lowest-income households, whereas 17 % (n 85) of them came from the highest-income households.
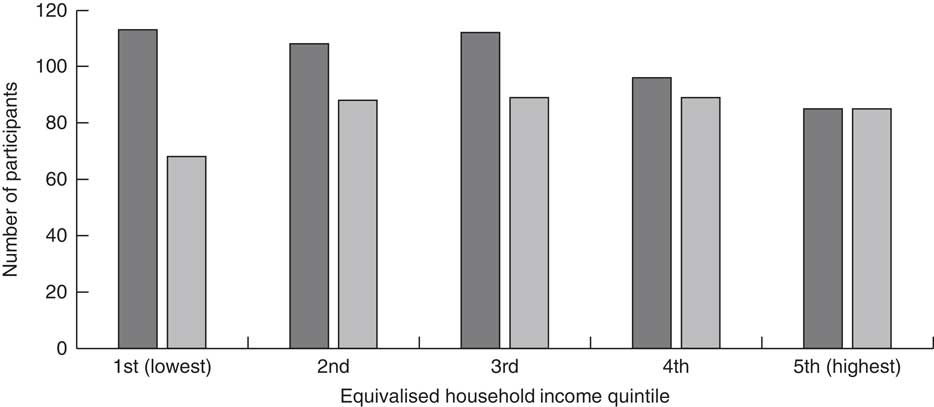
Fig. 1 Number of frequent* takeaway (![]() ) and meals-out (
) and meals-out (![]() ) consumers by equivalised household income quintile among British adolescents aged 11–18 years (n 2045) from the National Diet and Nutrition Survey (NDNS) rolling programme, Years 1–6 (2008–2014). *Frequent consumption defined as once or twice per week or more
) consumers by equivalised household income quintile among British adolescents aged 11–18 years (n 2045) from the National Diet and Nutrition Survey (NDNS) rolling programme, Years 1–6 (2008–2014). *Frequent consumption defined as once or twice per week or more
In addition, it was observed that the mean intake of vegetables was 134 g/d among low takeaway consumers compared with 102 g/d among frequent takeaway consumers. This difference was greatly attenuated among consumers of meals out, where the mean intake of vegetables was 117 and 112 g/d among frequent and low consumers, respectively. The scores for the overall DQI-A and its components and sub-components were recalculated after increasing the intake of vegetables by one portion (80 g) to demonstrate the effect of this typical change in diet on different components. It was observed that component scores for DQc, DDc, DEc and DAx increased on average by 2·9, 3·9, 1·8 and 2·1 %, respectively. A mean increase of 2·9 % in the overall DQI-A score was seen (data not shown).
Associations between diet quality and takeaway consumption
The results from the regression analysis indicated an association between the frequency of takeaway consumption and diet quality of UK adolescents. Significant differences were observed between low, moderate and frequent (the reference group) takeaway consumers in their DQI-A scores (Table 5). Low and moderate takeaway consumers had a higher overall DQI-A% score by 7·4 % (95 % CI 5·6, 9·2 %; P<0·01) and 3·7 % (95 % CI 2·2, 5·2 %; P<0·01) than frequent consumers, respectively. The results remained essentially unaltered after adjusting for age, gender and equivalised household income, and the overall DQI-A% score remained higher for low and moderate consumers compared with frequent takeaway consumers (Table 5). In addition, significant differences were observed between low, moderate and frequent takeaway consumers for most of the DQI-A components and sub-components (Table 5). For instance, low and moderate takeaway consumers had significantly higher DQc scores than frequent takeaway consumers by 14·2 % (95 % CI 10·5, 17·9 %; P<0·01) and 6·7 % (95 % CI 3·6, 9·9 %; P<0·01) respectively, before adjusting for confounders. This difference remained significant after adjusting for age, gender and equivalised household income. As indicated, not all diet quality components and sub-components were significantly affected by the frequency of takeaway consumption before and after adjusting for confounders (Table 5).
Table 5 Regression (clustered) analysis between takeaway consumption* and overall diet quality index and its component and sub-component scores (expressed as percentage) among British adolescents aged 11–18 years (n 2045) from the National Diet and Nutrition Survey (NDNS) rolling programme, Years 1–6 (2008–2014)

DQI-A, Diet Quality Index for Adolescents; DQc, diet quality component; DDc, diet diversity component, DEc, diet equilibrium component; DAx, diet adequacy sub-component; DEx, diet excess sub-component.
*Low consumption defined as rarely/never; moderate consumption defined as once per month; and frequent consumption defined as once or twice per week or more.
†Adjusted model controlled for age, food energy and household income.
Associations between diet quality and consumption of meals out
The results for frequent consumption of meals out were similar but attenuated and not statistically significant for individual components, including DDc and Dax, before adjusting for confounders (Table 6). As was found with frequent takeaway consumers, the overall DQI-A% score was significantly higher among low and moderate consumers compared with frequent consumers of meals out (the reference group), by 2·8 % (95 % CI 1·0, 4·6 %; P<0·01) and 3·4 % (95 % CI 1·7, 5·0 %; P<0·01), respectively. Moreover, after adjusting for confounders including age, gender and equivalised household income, statistically significant differences in overall DQI-A% score were observed for low, moderate and frequent consumption of meals outside of home (Table 6). Although there were significant differences between low, moderate and frequent consumers of meals out among some of the diet quality components, after adjusting for confounders those differences were observed to be bigger among some diet quality components (Table 6).
Table 6 Regression (clustered) analysis between consumption of meals out* and overall diet quality index and its component and sub-component scores (expressed as percentage) among British adolescents aged 11–18 years (n 2045) from the National Diet and Nutrition Survey (NDNS) rolling programme, Years 1–6 (2008–2014)
DQI-A, Diet Quality Index for Adolescents; DQc, diet quality component; DDc, diet diversity component, DEc, diet equilibrium component; DAx, diet adequacy sub-component; DEx, diet excess sub-component.
*Low consumption defined as rarely/never; moderate consumption defined as once per month; and frequent consumption defined as once or twice per week or more.
†Adjusted model controlled for age, food energy and household income.
Discussion
The present study is the first to assess the relationships between the consumption of takeaway foods and meals out of home and diet quality in adolescents using an overall diet quality index and representative national data from the UK. The DQI-A was used to assess the adherence of British adolescents to dietary recommendations and healthy eating patterns. The results from the current cross-sectional study suggest that frequent consumption of takeaways in particular is negatively associated with overall diet quality and its components. A weaker but nevertheless significant association was seen with consumption of meals out.
The mean diet quality score was 20·4 % for all adolescents, lower than the score obtained from a previous study using the NDNS (data from Years 1–4, but excluding Years 5–6) which reported a score of 31·1 % overall and also differences in some sub-components( Reference Llaurado, Albar and Giralt 27 ). This may be due to the slightly different methodology used for the categorisation and classification of main food groups and subgroups, including portion sizes, which influence each of the diet quality components and sub-components. For example, previous research excluded non-milk-based ice cream and beverages dry weight items from the analysis( Reference Llaurado, Albar and Giralt 27 ). In the present study, both these food items were categorised within the low-nutrient weighting factor group. Alternatively, it may reflect a further worsening of diet quality in British adolescents which is already worse than in other European countries. According to previous European surveys, the mean diet quality of adolescents (DQI-A) from mainland Europe was considerably higher than for UK adolescents, with scores between 50 and 60 %( Reference Vyncke, Fernandez and Fajo-Pascual 17 , Reference Ortega, Ruiz and Labayen 28 ).
The UK population enjoys consuming food that is already prepared and currently has the highest rate of ready-meal consumption in Europe, double that of France and six times more than in Spain( Reference Jackson and Viehoff 29 ). This trend is not showing any sign of abating. There has been a dramatic increase of 43 % in the number of takeaway and fast-food outlets in the UK since 1990( Reference Maguire, Burgoine and Monsivais 30 , Reference Burgoine, Forouhi and Griffin 31 ). Typically, out-of-home meals from restaurants, cafés, takeaways, fast-food restaurants and sandwich shops are higher in saturated fat, sugar and total energy( 32 ). A cross-sectional study in England which included 332 secondary-school students aged 13–17 years showed that about 23 % of the recommended energy intake of these students was obtained from foods purchased from fringe shops near schools. The nutritional quality of the purchased food items was found to comprise 38 % saturated fat, 22 % sugar and 15 % non-milk extrinsic sugar( Reference Sinclair and Winkler 33 ). Observational evidence from neighbouring Scotland carried out in five secondary schools showed that although the number of food outlets located within a 10 min walk varies from one school to another, during lunch break the majority of the students purchased unhealthy convenience foods from local shops such as fish and chips, pizzerias, kebab shops, cafes and supermarkets( Reference Crawford, Mackison and Mooney 34 ). In the USA, a national representative survey that recruited children and adolescents aged 4–19 years stated that fast-food consumers had higher intakes of total fat, saturated fat, total carbohydrate and sugar-sweetened beverages. Moreover, lower intakes of fluid milk, fruits and non-starchy vegetables were observed among fast-food consumers( Reference Bowman, Gortmaker and Ebbeling 35 ). The methodology used in the present study to calculate DQI-A score means that foods high in fat and sugar and sweetened beverages are more likely to be classified within low-nutrient food items (non-recommended food products) that have a negative impact not only on overall DQI-A% score but also on its component scores. Conversely, food items such as liquid milk and fruit and vegetables enhance the overall DQI-A and its component scores.
The effects of frequent takeaway consumption on diet quality were larger than the effects of frequent meals-out consumption both before and after adjusting for confounders. Different studies have used different definitions for the terms ‘out of home eating’( Reference Bezerra, Curioni and Sichieri 36 ) and fast food( Reference Fraser and Edwards 37 ) which may result in comparisons of effects on diet quality being difficult. However, despite the difficulties with defining fast food, studies have consistently found that fast food is of poor quality compared with other types of food purchased outside the home( Reference Prentice and Jebb 38 ). Results from a systematic review confirmed that eating out at a fast-food outlet had a larger impact on energy intake among both US adolescents( Reference Lachat, Nago and Verstraeten 12 ) and Irish children( Reference Burke, McCarthy and O’Neill 39 ) compared with eating out at a restaurant. A cross-sectional analysis of data from eleven different European countries (including the UK) showed similar findings. Although the participants were adults aged 35 years or above, findings from that study confirmed that location of eating out of home (including work and restaurants) affected not only energy intake but also intakes of other macronutrients such as carbohydrates, protein and fat( Reference Naska, Orfanos and Trichopoulou 40 ). Two further cross-sectional studies that analysed data among adult participants from ten European countries (including the UK) showed that eating location such as restaurants, home or work had an impact on energy intake and its contribution to the total daily energy intake( Reference Orfanos, Naska and Trichopoulos 41 , Reference Nielsen and Popkin 42 ). The place where the food was consumed out of home was clearly reported in these studies. This may have helped the researchers in exploring the source of this impact whereas the NDNS has incomplete information regarding the source of food consumed for either takeaways or meals out. Most of the UK studies included in the systematic review( Reference Lachat, Nago and Verstraeten 12 ) did not report the sources where the food was consumed. In the present study eating takeaway-style food at home, such as fish and chips, is likely to have come from a takeaway/fast-food outlet (delivery services). Although both fast-food outlets and restaurants are associated with higher energy intake and poor dietary patterns, portion sizes for foods such as soft drinks and French fries are larger in fast-food outlets compared with restaurants and foods prepared at home. Restaurants were found to have smaller portions of foods including burgers and desserts( Reference Nielsen and Popkin 42 , 43 ). This may explain the differences observed in the present study for the effect of takeaways and meals out on overall diet quality and its components. Another UK study examined the effect of takeaway consumption and/or eating out on individual food groups and/or nutrients( Reference Fraser, Edwards and Cade 22 ), whereas assessing individual dietary intake overall can be achieved through examining the dietary quality and variety of an individual daily diet( Reference Vyncke, Fernandez and Fajo-Pascual 17 , 44 ). Overall diet quality may be a stronger predictor of health outcomes than individual food groups and nutrients. In addition, higher numbers of frequent takeaway consumers were from families with a low household income. A cross-sectional study showed that exposure to fast food seems to increase as the deprivation rate increases and this indicates that people living in areas with higher social and economic deprivation are more likely to select cheaper sources of food( Reference Fraser, Edwards and Cade 22 ). The higher price of healthy foods is one of the greatest barriers affecting low-income households’ food choices( 45 ). Moreover, for people with lower household incomes who completed the Low Income Diet and Nutrition Survey 2005( 46 ), the most frequently reported barrier to healthy eating was the price of healthy foods.
Strengths and limitations
There were notable strengths to the current analysis. First, the data analyses presented herein were generated in duplicate by two independent researchers. Second, the NDNS is a national UK survey and is considered high quality, representative and containing up-to-date information on eating behaviour in the UK population. However, it does have some limitations. In Year 1, more weekend days were included than in other survey years, which is considered to have an impact on estimates of nutrient and food intakes. In the NDNS data, it was possible to identify the participants who did actually consume takeaway foods at home and outside the home during the 4 d diary records. However, foods such as burgers and kebabs, fried chicken, fried coated fish and others were labelled as prepared using home recipes, whereas foods such as pizza were not labelled as takeaway food or having been prepared at home, except for chips where participants indicated if they were purchased from a takeaway. This could have assisted in examining the effect of consuming takeaway foods on the DQI-A% score and its components for each of the four days by comparing days when takeaway food was consumed with days where no takeaway food had been consumed. Instead, the analysis of the DQI-A% score relied on the information on frequency of consuming takeaway food by participants, to categorise them as a frequent, moderate or low takeaway consumers. It is not possible to rely solely on the information collected with 4 d diaries to assess intake of takeaways as many people consume takeaway food less than once every 4 d. Two per cent of the participants collected data for only 3 d and these participants had lower mean diet quality and higher reported intake of takeaway food. Participants who eat out more frequently may be more likely to find completing a 4 d diary difficult and therefore may be more likely to drop out of the study, introducing bias.
In addition, eating out of home can be defined differently, such as only food purchased and consumed outside the home or also including food consumed out of home but prepared at home. Additionally, there is no clear difference between restaurants and fast-food outlets as some fast-food outlets also have seating areas where customers can eat in( Reference Naska, Orfanos and Trichopoulou 40 ). Orfanos et al. ( Reference Orfanos, Naska and Rodrigues 47 ) confirmed the ambiguous area in the definition of eating out of home while at work, which may lead to having inconsistent results. Only a brief general description of the difference was provided to participants in the NDNS leading to incomplete information being provided regarding takeaway meals at home such as pizza, fish and chips and burgers, which could have been prepared at home or delivered from a takeaway outlet. Similarly with consumption of meals out, as the question focused on general examples such as restaurants or cafés, the importance of obtaining information regarding the source of food being purchased and consumed was ignored( 48 ). In addition, in the NDNS, school meals are excluded from being defined as a meal out.
The UK and other European countries, including Austria, Belgium, France, Italy and Germany, are following a similar approach to food group classification and have similar dietary recommendations such as the Eatwell Guide, food pyramids and recommended portion sizes. However, further recommendations on the maximum and minimum intakes from each food group are more common in non-UK dietary guidelines (such as the Flemish dietary guidelines). The language barrier (lack of availability of European guidelines in English) was another obstacle to understanding the way in which other European countries implement their dietary recommendations and guidelines( Reference Montagnese, Santarpia and Buonifacio 49 ). Although studies have been conducted using diet quality indices in the UK population( Reference Golley, Smithers and Mittinty 50 , Reference Emond, Emmett and Steer 51 ), the types of indices used and the ages of the targeted groups were different, which made the findings obtained from the present study and the other UK-based studies difficult to compare. Also, those challenges made the calculation of UK adolescents’ DQI-A and its component scores more difficult.
In addition, physical activity is an essential confounder to be included in the regression model, especially when weight (or BMI) is a health outcome of interest. However, because less than 50 % of the total participants provided a valid measurement regarding their physical activity level, the analysis was carried out without the inclusion of the physical activity variable in the model.
Policy and recommendations
Consumption of takeaway food is common in adolescence and therefore policies to reduce availability and accessibility of fast food are needed in this age group. This is particularly important as a recent report from the Organisation for Economic Co-operation and Development noted that British adolescents have some of the worst diets in the world( 52 ). Reducing the density of fast-food outlets near schools may be one method of achieving this as recommended by Public Health England, although the impact on health has not been evaluated to date( 53 – Reference Ross 55 ). The food environment in schools and retail outlets such as supermarkets has improved in the last 10 years with new school meal standards and food reformulation to reduce trans-fats, salt and sugar( 56 ); however, the fast-food environment has worsened. Of particular concern is the higher density of fast-food outlets in areas of social and economic deprivation and larger portion sizes of fast food( Reference Maguire, Burgoine and Monsivais 30 , 53 ). However, with no universally accepted portion sizes of healthy and unhealthy foods it is difficult to make recommendations. This would help in designing more widely acceptable FBDG and more robust diet quality assessment methods( Reference Kearney, Hulshof and Gibney 57 ).
Conclusion
In conclusion, UK adolescents have a poor-quality diet, particularly those who report frequent consumption of takeaway meals and to a lesser extent frequent consumption of meals out. The negative effects of takeaway food on the diet quality of UK adolescents may lead to long-term health impacts on young people in the UK, although we did not include research to confirm this here. Further interventions such as actions to improve the fast-food environment near schools are needed to improve dietary behaviour in young people.
Acknowledgements
Acknowledgements: The authors would like to express their grateful appreciation to Jayne Hutchinson and Holly Rippin for assistance with NDNS food group classifications. Financial support: This research received no specific grant from any funding agency in the public, commercial or not-for-profit sectors. Conflict of interest: The authors declare there are no conflicts of interest. Authorship: A.K.T. designed the research question and methods of the study, carried out statistical and data analysis, wrote the first draft of the manuscript and revised subsequent drafts. N.E. carried out statistical and data analysis and revised drafts of the manuscript. C.E.L.E. designed the research question, assisted with statistical analysis methods and revised all versions of the manuscript. Ethics of human subject participation: Ethical approval for the NDNS study was obtained from the Oxfordshire A Research Ethics Committee. Approval for all participating National Health Service laboratories was obtained by the Research and Development (R&D) Committee. A consent form from all parents or carers and participating adults was also obtained.


