Analysis of the Sensitivity of Algorithms for Assessing the Harmful Information Indicators in the Interests of Cyber-Physical Security


1
Laboratory of Computer Security Problems, The Saint-Petersburg Institute for Informatics and Automation of the Russian Academy of Sciences (SPIIRAS), 39, 14 Liniya, 199178 St. Petersburg, Russia
2
International Laboratory of Information Security of Cyber-physical Systems, The Saint-Petersburg National Research University of Information Technologies, Mechanics and Optics (ITMO University), 49, Kronverksky Prospect, 197101 St. Petersburg, Russia
*
Author to whom correspondence should be addressed.
Electronics 2019, 8(3), 284; https://doi.org/10.3390/electronics8030284
Submission received: 31 January 2019
/
Revised: 20 February 2019
/
Accepted: 27 February 2019
/
Published: 4 March 2019
(This article belongs to the Special Issue Cyber-Physical Systems)
Abstract
:The secure functioning of cyber-physical systems depends on the presence and amount of harmful (unwanted and malicious) information in its digital network content. The functioning of cyber-physical systems is carried out in non-stationary conditions and in conditions of continuous exposures. This leads to the uncertainty of indicators (parameters, features) of harmful information that must be assessed in the analytical processing of digital network content. The paper proposes an approach to analyse the sensitivity of algorithms for estimating the status of indicators of harmful information observed in noise. This approach allows one to consider possible errors in the estimation accuracy. It gives the possibility to identify the allowable range of changes in the parameters of the digital network content of cyber-physical systems, within which the requirements for the assessment reliability are met. This, in turn, makes a significant contribution to the effectiveness of harmful information detection and counteraction against it. Accounting for a priori uncertainty of the indicators under various influences is advisable to carry out on the basis of expressions for the sensitivity coefficients (functions) described in the paper.
1. Introduction
Harmful (unwanted and malicious) information in the context of information security of cyber-physical systems (CPS) acquires an important role. For CPS it is much more dangerous than for traditional computer systems. Harmful information is capable of comprehensively affecting all (human, cybernetic, physical) elements of CPS. Therefore, it is a question of protecting against harmful information not only of people but also of the systems and processes associated with CPS. Taking into account the fact that a person is, as a rule, “embedded” in a modern CPS, it is a question of protecting against information that can harm not only the mental and physical health of people but also (either directly or indirectly) may disrupt the information and management links inside CPS and the CPS management processes.
It is known about the influence of harmful information on humans but there are also technical aspects of the influence of such information on CPS. This may be due to filling the CPS data warehouses with too much extra information (glut, filling CPS resources with “information stuff”). This could be the introduction of malicious software and arrays of harmful information (spam, computer viruses, logical bombs, etc.) into the digital CPS content. This can manifest itself as automatic reproduction and distribution of data which are critical (dangerous) for the functioning of CPS. In other words, the strong interrelationships of the elements (people, cybernetic and physical subsystems) within CPS, determine the likelihood of increasing the potential damage from harmful information for CPS as a whole. All this predetermines the need to develop and implement effective technologies for assessing the semantic content of information objects (content filtering of harmful information) in digital network content.
The problems of searching for, detecting and counteracting harmful information in the digital network content of modern CPS continue to be relevant [1,2,3,4,5]. At the same time, the solution of a multitude of problems (such as optimization of content analysis and monitoring of CPS security, synthesis of optimal algorithms for detecting and evaluating the indicators of harmful information) is impossible without considering the sensitivity of the estimation algorithms, where sensitivity is interpreted as a property of algorithms for evaluating different indicators not to change the state of the evaluation criterion in a small range.
This is due to the fact that for modern CPS there is objectively a priori uncertainty about the presence in the digital network content of harmful (unwanted and malicious) information. In addition, there is a priori uncertainty regarding the values of the indicators (parameters, features) of harmful information. There is uncertainty about the source and environment of the dissemination of harmful information, the uncertainty of the parameters of various external, most often destructive (antagonistic) effects on content analysis systems. The systems for analysing digital network content are designed to detect and counteract against harmful information. They implement procedures for the optimal assessment of the semantic content of information objects. Moreover, such estimation procedures are often traditionally focused on well-known Kalman filtering algorithms [6,7] and form the basis of the digital network content monitoring. But the presence of various types of uncertainty makes such algorithms and procedures suboptimal under real conditions of CPS operation.
In addition, when implementing such algorithms in systems for analysing digital network content, errors can also be made. These errors can lead to deviations of the real values of the parameters for external and internal effects (types of distribution of impact parameters). They can lead, ultimately, to incorrect decisions on the management of detection and counteraction of harmful information, and, therefore, to a decrease in the overall security and safety of the CPS operation. That is why there is an objective need to assess the damage (inaccuracy) in the values of indicators (parameters, features) of harmful information in the CPS digital network content.
The paper proposes a new approach to analyse the sensitivity of algorithms for estimating the status of indicators of harmful information observed in noise. An analysis of current works aimed at the sensitivity of complex processes and systems, for example [8,9,10,11,12], from the point of view of the technical aspects of novelty, emphasizes the motivation of the paper and confirms most of the statements made in this paper.
The proposed approach not only differs from the traditional approach but also expands the area of application of sensitivity analysis algorithms to a wider and non-trivial range of objects and processes. In the course of the classical sensitivity analysis, a sequential single influence of only one variable parameter (attribute, factor, variable) on the final result of the process (its effectiveness) is considered. This single, quantified parameter is checked for reaching the limits of sensitivity while maintaining all other parameters unchanged. In contrast to the traditional, the proposed approach is multi-criteria. It comprehensively takes into account various types of uncertainty and at the same time considers the values of the sensitivity functions of the algorithms for estimating several parameters of harmful information. In other words, the paper implements the problem of multi-criteria estimation of the semantic content of information objects, which is not yet solved with the traditional approaches, taking into account the uncertainty of the initial data and the sensitivity of the estimation algorithms themselves.
This approach allows one to consider possible errors in the estimation accuracy. It gives the possibility to identify the allowable range of changes in the parameters of the digital network content of CPS, within which the requirements for the assessment reliability are met.
The rest of the paper is organized as follows. Section 2 lists some relevant papers. Section 3 presents the suggested approach to analyse the sensitivity of algorithms for estimating the status of harmful information indicators. Section 4 outlines the results of a computational experiment on determining the sensitivity of the algorithm for the filtering (evaluation) of harmful information indicators. Section 5 analyses these results and contains the discussion. Section 6 summarizes the main results and reveals the direction of further research.
2. Related Work
The main decisions on optimizing the algorithms for detecting and countering harmful information in digital network content are considered in many papers. But they are mainly aimed at algorithms for evaluating the features of harmful information in stationary or in quasi-stationary mode.
In Reference [1], these approaches are aimed at classifying of content with harmful information solely on the basis of analysing URLs over a stationary time interval, without taking into account the dynamics. To evaluate the characteristics of content with harmful information, various simple heuristic algorithms are proposed which are based on statistics for a certain stationary period of time. In Reference [2], it is proposed to use procedures and measures based on the reliability theory for qualitative content analysis. However, the reliability theory, as applied to the problems of synthesis of optimal algorithms for evaluating the indicators of harmful information, does not guarantee high accuracy of estimation. An approach based on the integrated application of the content analysis and thematic analysis techniques was proposed in Reference [3]. However, it requires taking into account auxiliary parameters characterizing a statistical sample, which is not always possible.
The papers [8,9] contain solutions aimed at analysing the sensitivity of stochastic dynamical and periodic systems. But the tasks of estimating the parameters of harmful information are often carried out not cyclically, in conditions of local stationarity and in statics. The paper [10] is interesting from the point of view of mathematical approaches (the least squares method) but is only suitable for analysing the sensitivity of differential equations. The papers [11,12], published in 2018 and 2016, respectively, are directly oriented to the problems of assessing sensitivity but only for chaotic systems.
In Reference [13], an approach to estimating the parameters of complex systems and processes, considering the sensitivity coefficients (functions), is presented. But the methods outlined in this paper are applicable only to the analysis of the global sensitivity, which narrows the scope of their application.
The paper [14] is devoted to methods that, using the sensitivity functions, allow one to reduce the set of estimated parameters. But these approaches are complex for mathematical specification and time consuming to implement. In Reference [15], the sensitivity equations for structured models of the processes assessed are presented. However, structuring principles may not be applicable for the models of harmful information detection. Reference [16] is devoted to the analysis of the sensitivity of dynamic systems to the parameters of a Banach space. However, the parameters (features) of harmful information may not fit the limitations of this normalized vector space (including Euclidean spaces and the space of continuous functions).
The papers [17,18] are aimed at sensitivity analysis algorithms in dynamic systems, taking into account the adaptability of such complex systems. In Reference [19,20], the sensitivity analysis and the uncertainty analysis are interrelated and the results are taken into account in a comprehensive assessment of the effectiveness and quality of processes. This justifies the need to analyse the sensitivity of algorithms for evaluating the status indicators of harmful information observed in noise. At the same time, it is possible to analyse possible errors in the accuracy of estimation. This approach is developed in our paper. It is the basis to formulate the problem and it is considered when defining expressions for the sensitivity coefficients (functions). The admissibility of using such sensitivity coefficients (functions) for estimating the parameters of complex systems was proved in Reference [21,22].
Analysis of relevant works [1,2,3,8,9,10,11,12,13,14,15,16,17,18,19,20,21,22] shows that the direct application of the results obtained in most of these works is impossible for the task of a reliable assessment of indicators of harmful information. The reason is that the actual analysis of the features of harmful information in the CPS digital network content occurs under conditions of a priori uncertainty. This is due to the large number of different factors, including the emergence of new algorithms for the introduction of harmful information (new types of attacks), implemented by various categories of intruders [23]. Thus, the unified approach proposed in the paper to analyse the sensitivity of algorithms for evaluating indicators (features) of harmful information is relevant and useful and can be used to monitor the CPS digital network content.
3. The Suggested Approach and Used Methods
Analysis of the works [21,22] suggests that this problem can be solved using the methods of the sensitivity theory.
Sensitivity is a property of algorithms for evaluating indicators not to change the state of the evaluation criterion in a small range, that is, its ability to return to the saddle point of the same state with small external influences.
The sensitivity analysis of algorithms for evaluating indicators of harmful information is an important element of the assessment process, which characterizes its stability and reliability. It determines the relationship of the final estimated indicator of harmful information and variations in the values of the indicators included in its definition.
The sensitivity analysis of algorithms for evaluating the indicators of harmful information provides an answer to an important question: what will happen to the resulting value—the estimate of the indicator of harmful information, if the values of certain initial indicators change.
The sensitivity analysis algorithm usually consists of a number of stages:
- the relationship between the resultant and initial values of the indicators is given in the form of a mathematical equation or an inequality;
- the most probable values for the initial indicators and possible ranges of their changes are determined;
- on the basis of changes in the values of the source data, their effect on the final result is examined—the estimated values of the indicators of harmful information.
Indicators (parameters, features) of harmful information that are subject to analysis, accounting and control at each k-th step of the analytical processing of digital network content of CPS are divided into three main groups (classes) of indicators:
- indicators of harmful information that have a negative impact on people;
- indicators of harmful information that adversely affect the cybernetic subsystems of CPS;
- indicators of harmful information that have a destructive impact on the physical subsystems of CPS (storage and access systems).
Let us give examples of harmful information indicators, classified by these three groups.
A group of indicators of harmful information that has a negative impact on people includes, for example, the following indicators:
- —anomalous (exceeding the permissible limits) deviation of the average amount of information detrimental to the health, moral and spiritual development of people (especially children);
- —anomalous deviation of the average amount of information that promotes de-socialization and reinforcement of illegal and unacceptable behaviour;
- —anomalous deviation of the average amount of information containing public calls for terrorist and extremist activities;
- —anomalous deviation of the average amount of information aimed at promoting pornography;
- —abnormal deviation of the average amount of information containing data on methods of development, production and use of prohibited narcotic drugs and committing suicide, as well as obscene language;
- —anomalous deviation of the average number of direct calls for violence and cruelty (for example, to war), ethnic and religious hatred or enmity;
- —anomalous deviation of the average amount of information containing a biased assessment of the state policy of the country, forcing interethnic and social tensions, undermining the sovereignty, political and social stability, territorial integrity of the country and its allies.
The group of indicators of harmful information that has a negative impact on the cybernetic subsystems of CPS includes, for example, the following indicators:
- —anomalous deviation of the average amount of information containing scenarios that use vulnerabilities of CPS computer subsystems (exploits);
- —abnormal deviation of the average amount of information identified as spam;
- —anomalous deviation of the average amount of information that can (secretly) contain computer viruses, logical bombs and so forth.
The group of indicators of harmful information that has a destructive effect on the physical subsystems of CPS contains, for example, the following indicators:
- —anomalous deviation of the average amount of information containing scenarios for automatic copying and distribution of data which is critical (dangerous) for the CPS functioning, such as identifiers of personal access systems;
- —anomalous deviation of the average amount of information identified as “informational junk” and capable of overflowing the CPS data stores and so forth.
It should be noted that the concept of sustainability of the evaluation of harmful information indicators is inseparably linked with the concept of sensitivity. This is a property of the estimation algorithms to keep unchanged the value of the quality criterion for evaluating these indicators under the conditions of disturbances or uncertainty of some parameters of the CPS digital network content and/or its model [24,25]. In other words, the concept of sustainability in a broad sense characterizes the transition of a quality criterion for evaluating the indicators of harmful information from state to state.
The methods considered in Reference [21,22] allow us to conduct a sensitivity analysis of the filtering algorithms for harmful information indicators in the digital network content of CPS based on finding the sensitivity equations and functions for the algorithms in question.
For general discrete systems:
where —m-dimensional CPS security state vector (in terms of availability and quantity of harmful information in its digital network content); —r-dimensional vector of constant security parameters—indicators of harmful information.
The following difference sensitivity equation is defined [21]:
where —the vector of sensitivity of the CPS security state (in terms of availability and quantity of digital network content) to various components of the vector of harmful information indicators, defined as:
The sensitivity functions of the individual m-th components of the state vector can be determined on the basis of Equation (2) in the form:
Using the sensitivity vectors (2), one can get the first approximation for the “additional motion” of the state of harmful information indicator in the digital network content of CPS:
In the assumption that the process of the CPS functioning from the point of view of its security control (detection of harmful information and reaction on it) is described by the equations of state and observation [24].
let us analyse the sensitivity of algorithms for estimation of indicators for a linear case (a case of a linear system).
For the model of the CPS security state transition (i.e., transition of the values of the elements of the vector of harmful information indicators) in the form of Equation (6) and Equation (7), the estimate, which is the optimal in the sense of minimum standard deviation, is given by the Kalman filtering algorithm [6,7]:
where —the vector of estimated values of harmful information indicators at (k+1)-th step of analytical processing of the CPS digital network content;
the Kalman filter gain;
the matrix of a priori variances of estimation errors of harmful information ;
the matrix of supposed a posteriori variances of estimation errors of the states of the harmful information indicator by doing the initial conditions
where all variables in the right-hand side of the equations have the generally accepted meaning [25].
There are cases when specifying the source data, required to implement the filtering algorithm, errors are made. There are errors , and instead of the true (real) values, the intended data is used. In these cases, the sensitivity function can be represented in accordance with the expression:
where —deviation from the “ideal” of the r-th vector of constant security parameters—the harmful information indicators, specified by the model (, ); —the matrix of the real a posteriori estimation errors of states of the harmful information indicator , defined according to the expression
where
the matrix of the real a priori estimation errors of states of the harmful information indicator ;
a posteriori real mutual covariance matrix;
a priori real mutual covariance matrix;
the matrix of a posteriori real process dispersions , and
Moreover, Equation (12) and Equation (19) are the initial conditions for the implementation of the sensitivity analysis algorithm. Analysis of the works [21,22,25] shows that dynamic assessment of harmful information indicators, which changes are nonlinear, is advisable to carry out using an extended linearized Kalman filter. Linearization in the extended linearized Kalman filter of nonlinear processes of changing the state of indicators determines the use of filtering equations similar to Equations (8)–(12), describing the Kalman filtering process [6,7]. The similarity of filtering algorithms makes it possible to talk about the similarity of algorithms for analysing the sensitivity of processes of linear and non-linear estimation of indicators, moreover, taking into account the peculiarities of the linearization implemented in the extended linearized Kalman filter. We use the traditional proposition of calculating the accuracy of estimating the state of a complex controlled system as a hypothesis testing process. Then, in our case, the hypothesis is an indicator of the status of the indicator (parameter, feature) of harmful information in the CPS digital network content = 1 or 0. Therefore, it is fair to consider the estimation error as zero or one.
An analytical expression for determining the estimation error, when working with the simulation model, was proposed in the well-known work of A. Segall [26] and applied in Reference [20]. By analogy with this work, the covariance matrix of errors in estimating indicators of harmful information in the CPS digital network content can be represented as:
and the initial estimation error is
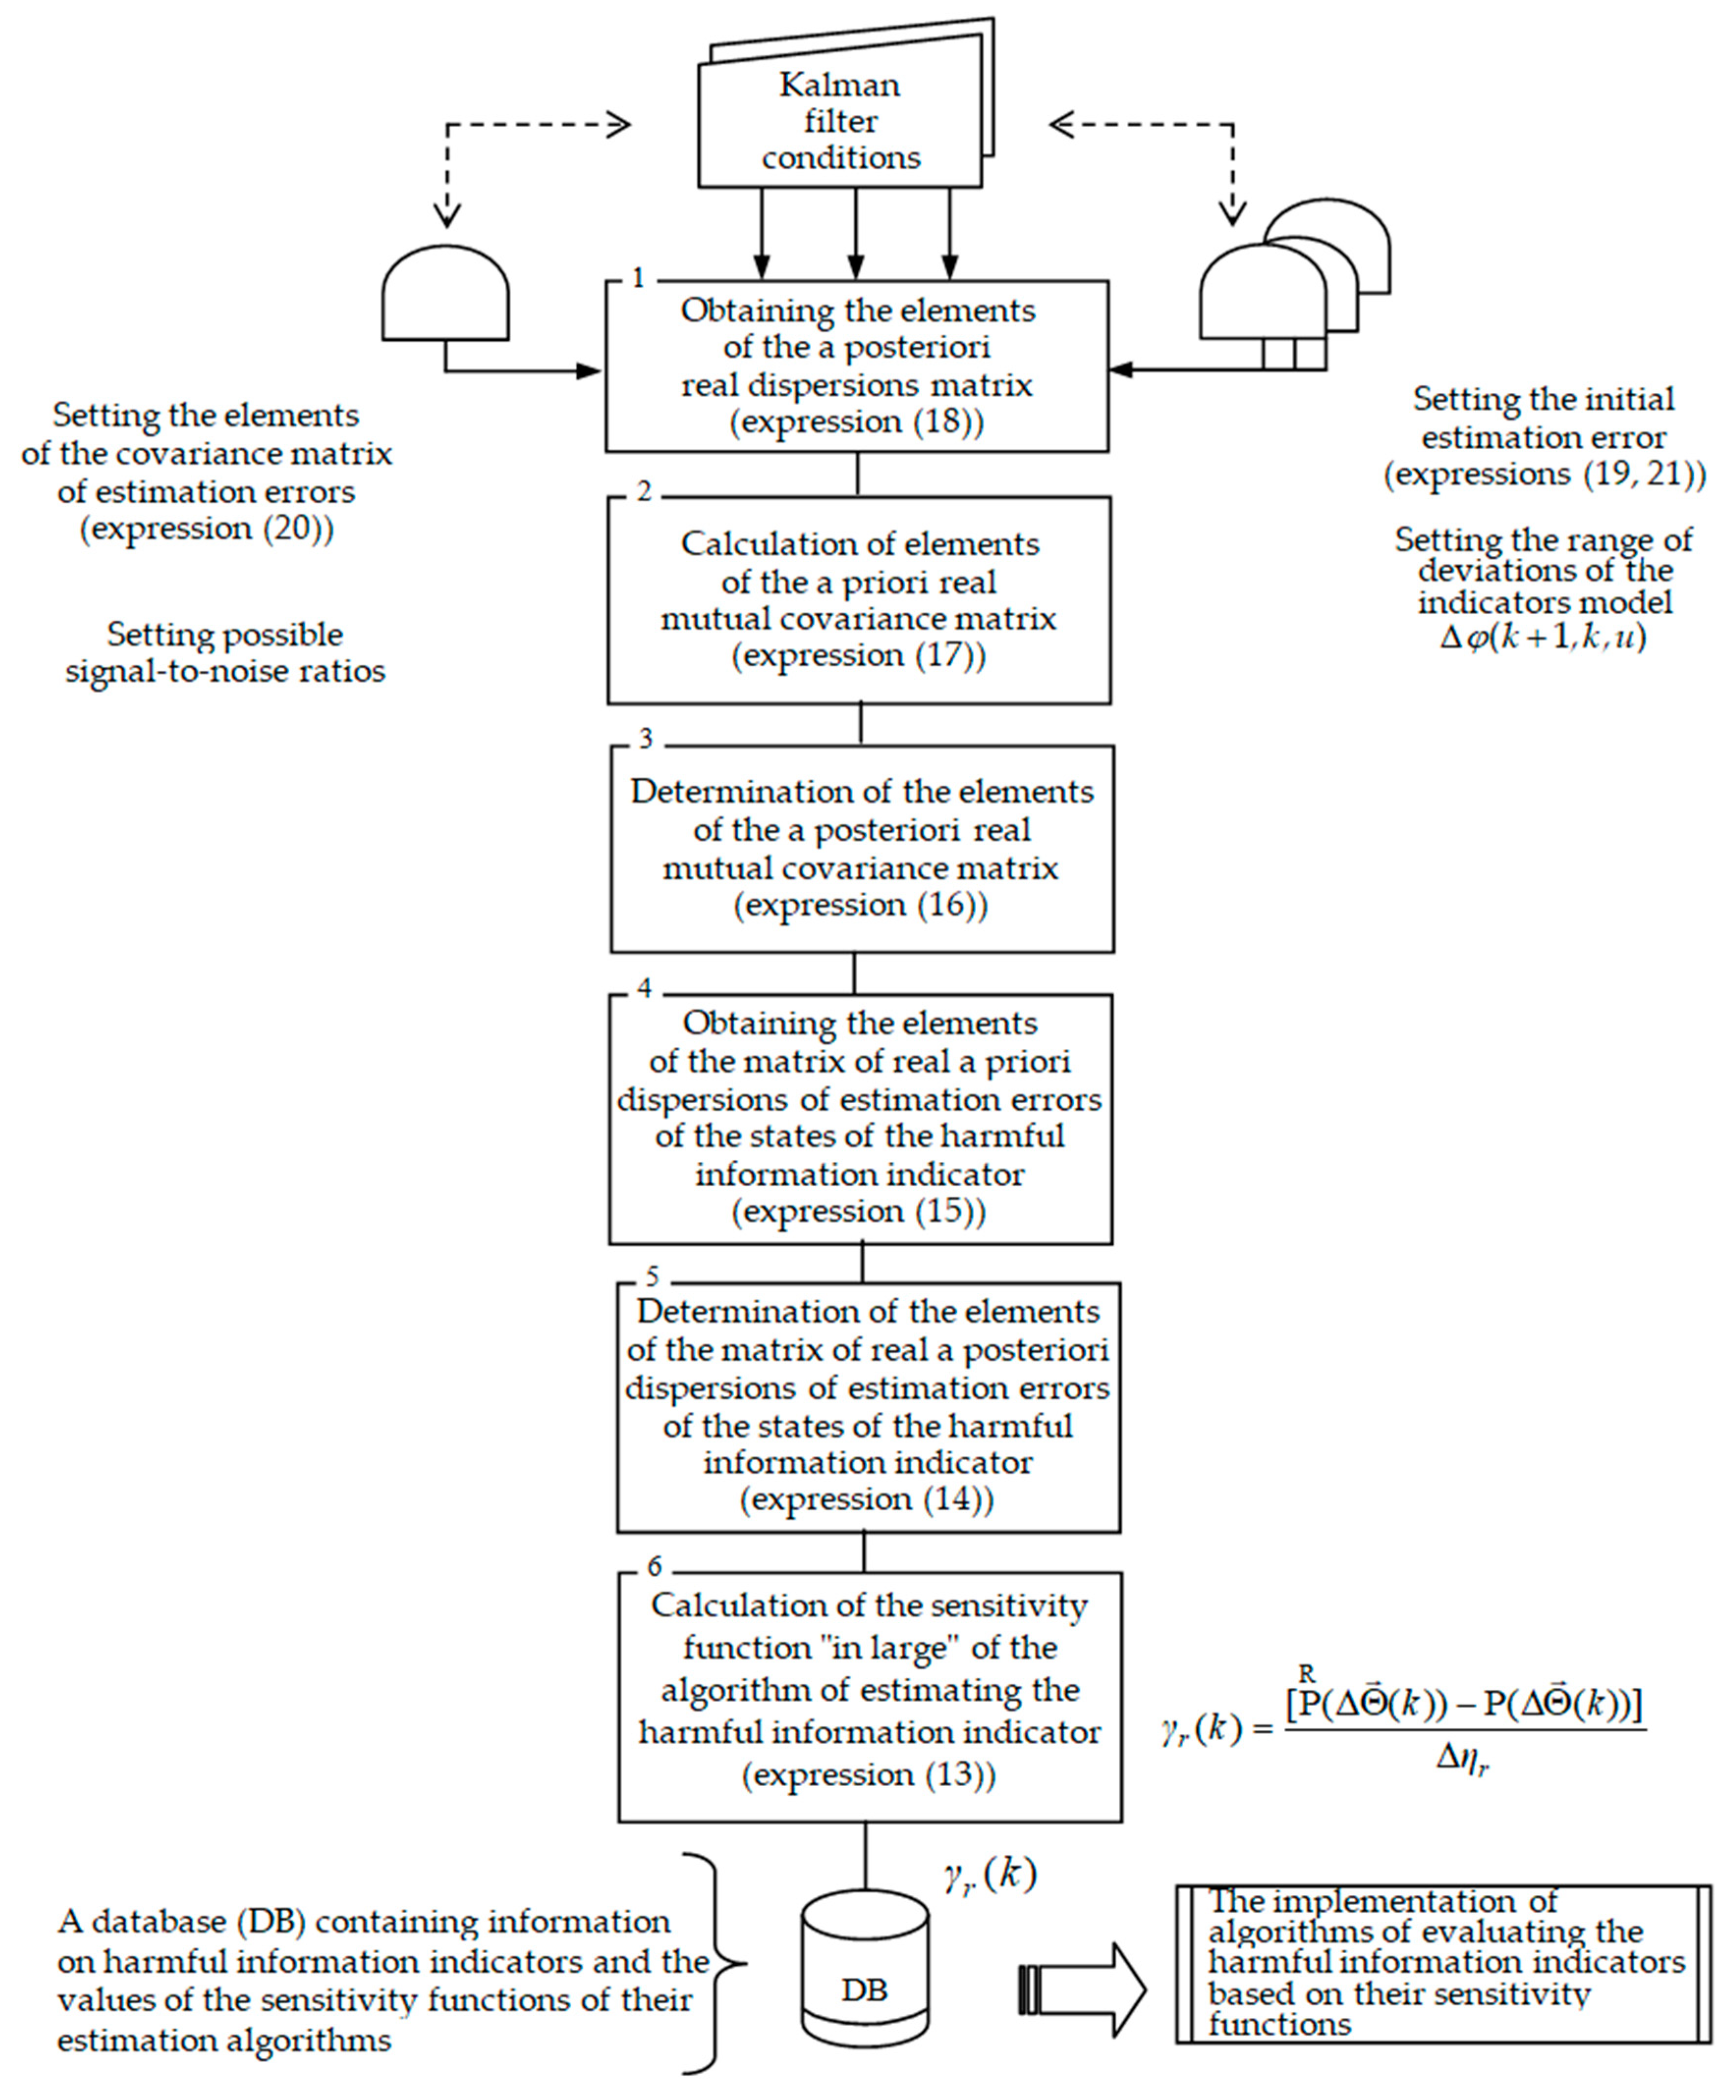
For a better understanding of the essence of the proposed approach, we present a conditional block diagram of the generalized step-by-step calculation of the sensitivity function “in large” for the algorithm of evaluating of harmful information indicators.
This diagram is shown in Figure 1. It illustrates the steps of the proposed approach to sensitivity analysis and contains references to the expressions described earlier.
At the same time, the variable in Equation (13) has the physical meaning of the deviation from the “ideal” of the values of a particular indicator of harmful information. The symbol in Equations (15), (17) and (18) characterizes the deviation of the elements of the probability matrix of the transition of any particular indicator of harmful information from state to state. The type variables referred to in Equations (9)–(15), (19)–(21) have the physical meaning of auxiliary indicators, traditional for Kalman’s filtering but in our case these are the indicators of the transition of any particular indicator of harmful information from state to state.
It should be noted that the analysis of the error of evaluating the harmful information indicators in the CPS digital network content should be carried out not in the first filtering step but only in the steady state mode of the filter, which simulates the dynamics of changing the state of the CPS security indicators when probabilities of states reach their final values at the k-th filtering step.
All this allows one to avoid unnecessary computational costs when implementing the procedures of content analysis and security monitoring of modern CPS, as well as the procedures for the synthesis of optimal algorithms for detecting and evaluating the harmful information indicators in the digital network content of systems of this class.
4. Computational Experiment Results
Let us conduct a computational experiment for traditional algorithms of optimal linear filtering using the discrete over states and over time values of the harmful information indicators. The main difficulty in implementing the proposed optimal linear filtering algorithms, as part of the content analysis of the digital network content of CPS which operate under different levels of a priori uncertainty regarding the statistics of the processes occurring in it, is the identification of the parameters of the probability-time mechanism for changing the state of indicators of harmful information of a different kind. These parameters are the elements of one-step transition probability matrices The accuracy requirements for finding elements of these matrices can be formulated based on the analysis of the filtering process sensitivity to errors in determining the parameters of the mathematical model for changing the state of the harmful information indicators. The data necessary for analysing the sensitivity of the estimation process can be obtained by analysing the dependences of the values of the vector of the estimation errors dispersions on the errors in determining the values of the elements of the one-step transition probability matrix characterizing the course of the process being studied.
In conformity with the proposed basic technique of sensitivity analysis, the values of harmful information and the estimated a posteriori variance of the process state estimation errors are calculated in accordance with the Equations (10) and (11). Expressions for calculating the elements of the matrix of real a posteriori variances of process state estimation errors can be obtained on the basis of recurrent relations Equations (13)–(17). For example, for the harmful information indicator , characterizing the anomalous deviation of the average amount of information containing scenarios that use vulnerabilities of CPS computer subsystems (exploits), can be calculated as follows:
Elements of a real a priori matrix of error dispersions for estimating the auxiliary indicators of the process of changing the states of the harmful information indicator can be calculated as
and the elements of the real a priori mutual covariance matrix are based on the expression
where
the element of the real a posteriori mutual covariance matrix;
the element of the real matrix of variances of the indicator state change process .
The initial conditions for calculating the values of the real a posteriori variances of estimation errors are:
Thus, according to the proposed sensitivity analysis technique, the sensitivity function “in large” for the algorithm of evaluating the harmful information indicator can be defined as follows:
where tr—the sign of the operation of calculating the matrix trace; —the deviation from real values of the elements of the matrix of probabilities of transition from state to state. It is analysed the sensitivity of evaluating the harmful information indicator to the deviation of the elements of the matrix of dimension l × m of probabilities of transition from state to state.
The proposed technique for analysing the sensitivity of the filtering algorithm for the discrete time and state process of changing the state of the harmful information parameters, modelled by the controlled Markov chain, is supported by calculations in the MathCad computing environment.
As initial data for computation of the sensitivity function (28) of the algorithm of evaluating the harmful information indicator , there were used the pre-formed (as an example, to check the effectiveness) rows and columns of transition probability deviation values of harmful information indicators from state to state.
These values of the matrix elements were calculated considering the normalization rules for the process models of this class.
The calculations were carried out taking into account the fact that the elements of the real a priori and covariance matrices of error dispersions for estimating the auxiliary indicators of the process of changing the values of useful information indicators are integers and can take the values 0 or 1.
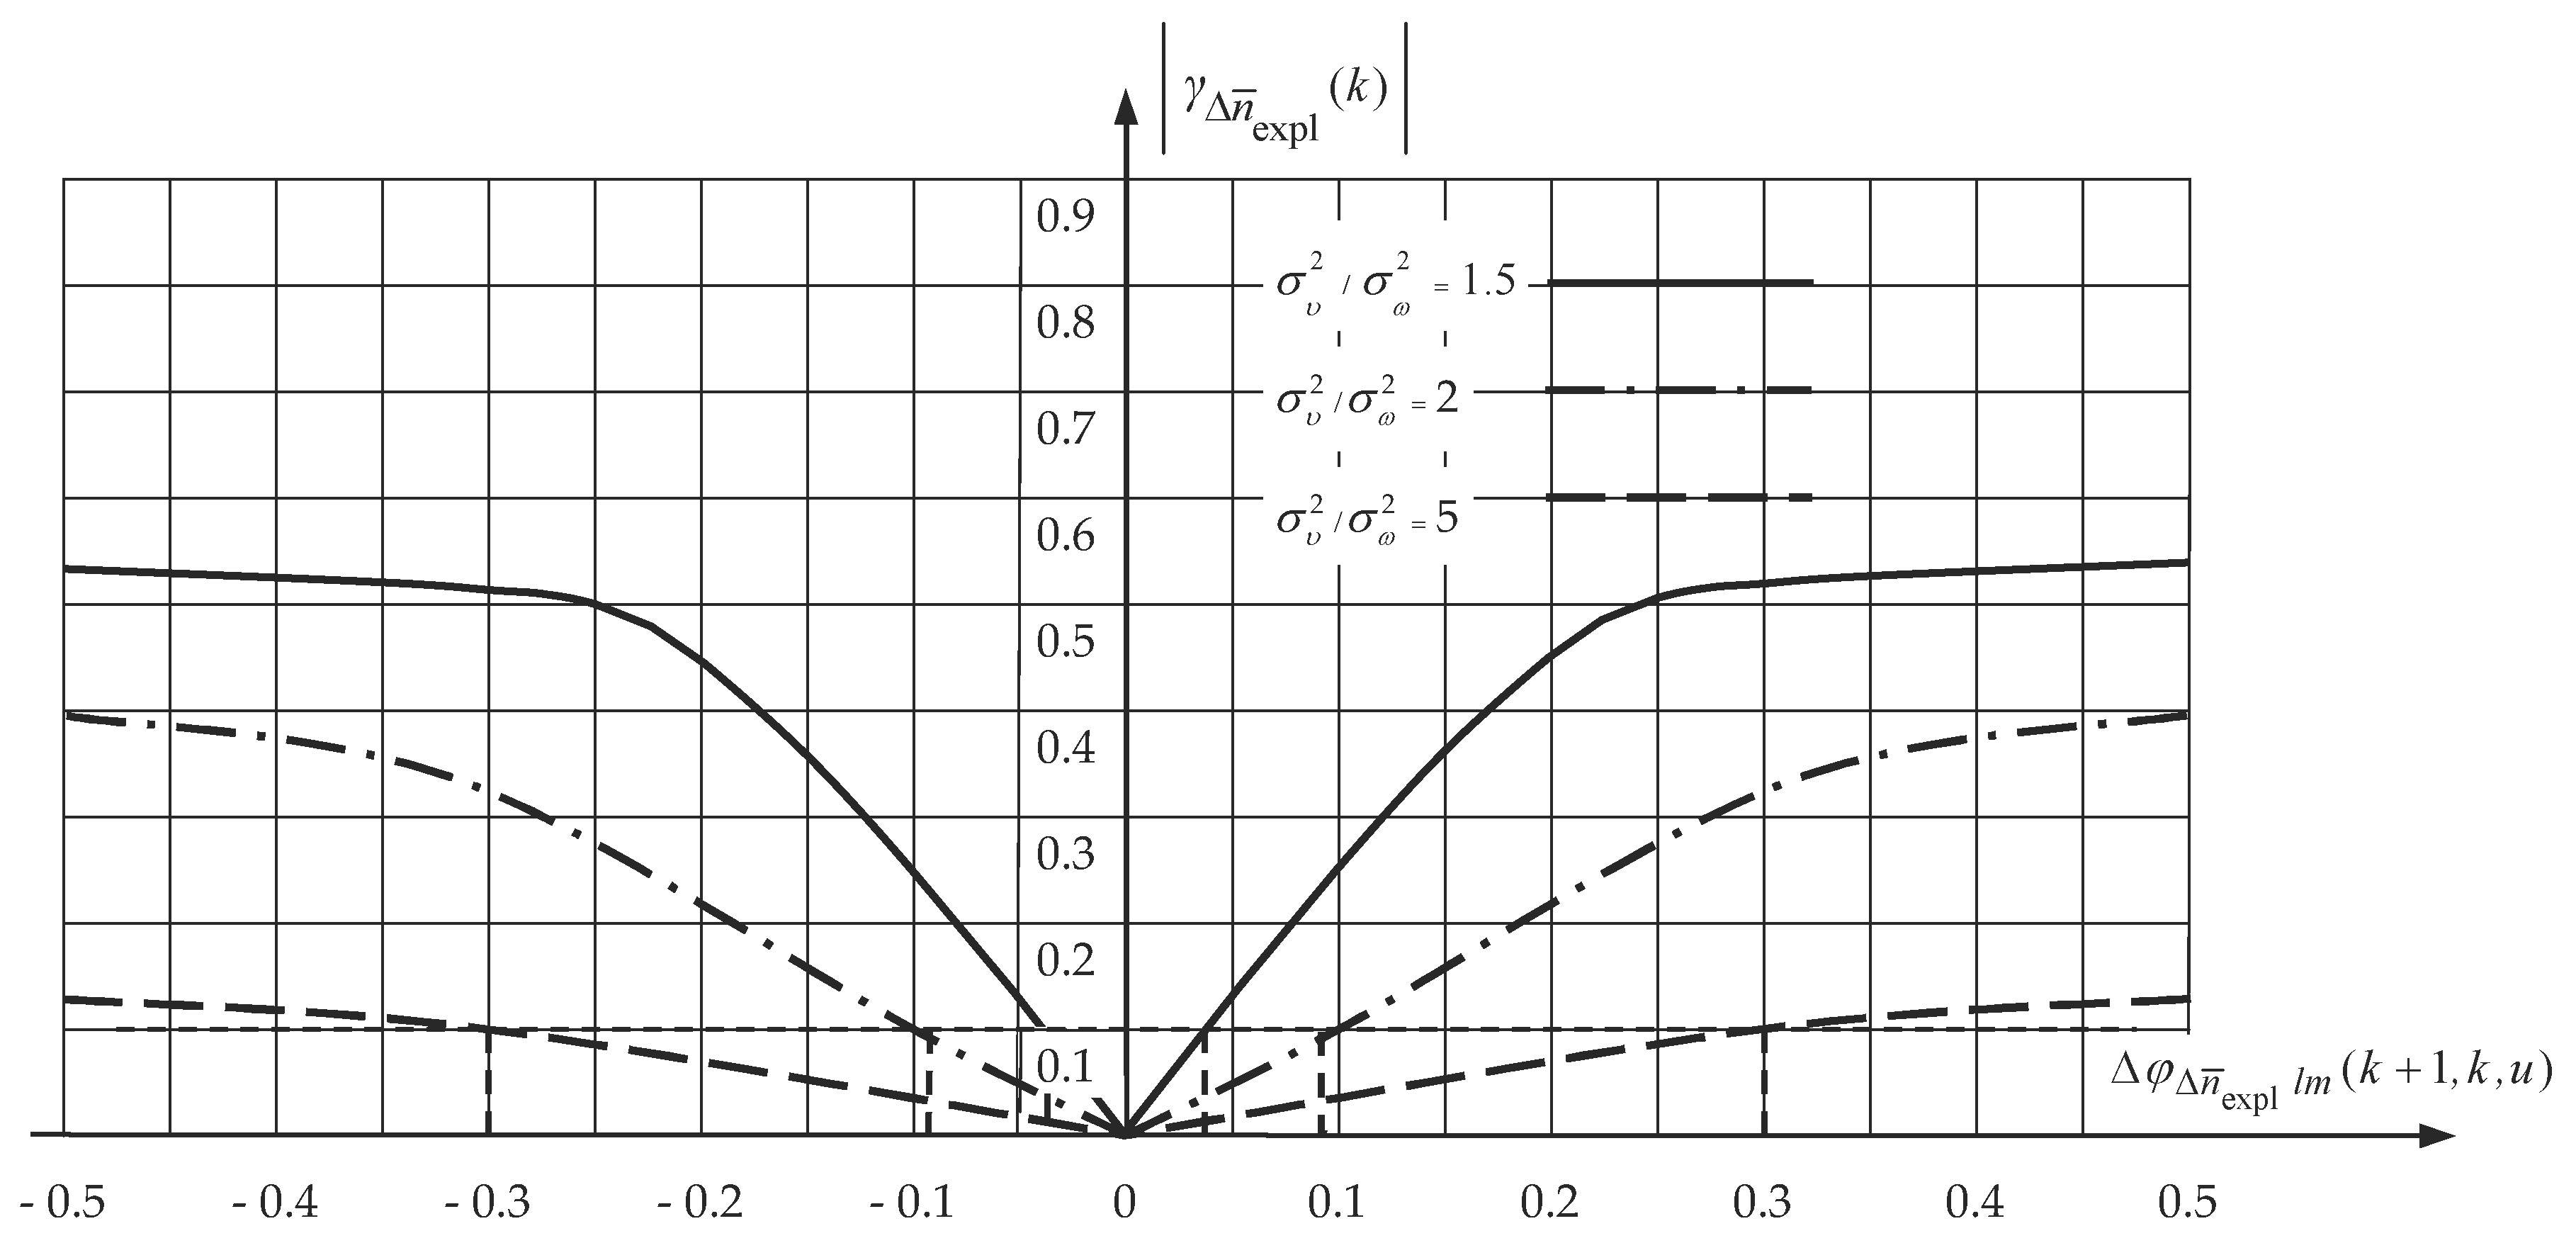
Figure 2 represents the results of one of the computational experiments.
The results are reflected in the form of the chart of the sensitivity function for the algorithm of filtering (estimating) the harmful information indicator . These results are calculated for different values of the ratio of the dispersions of the excitation and observation noise taking into account the deviations from the real values of elements of the matrix of probabilities of this indicator transition from state to state.
The analysis was obtained for the steady-state values of the elements of the real and estimated matrices of a posteriori dispersions of estimation errors.
This analysis allows us to conclude that with increasing values of the excitation and observation noise ratio , the algorithm of filtering (estimating) of the harmful information indicator becomes more sensitive to deviations of elements of the matrix of probabilities of this indicator transition from state to state unlike real values.
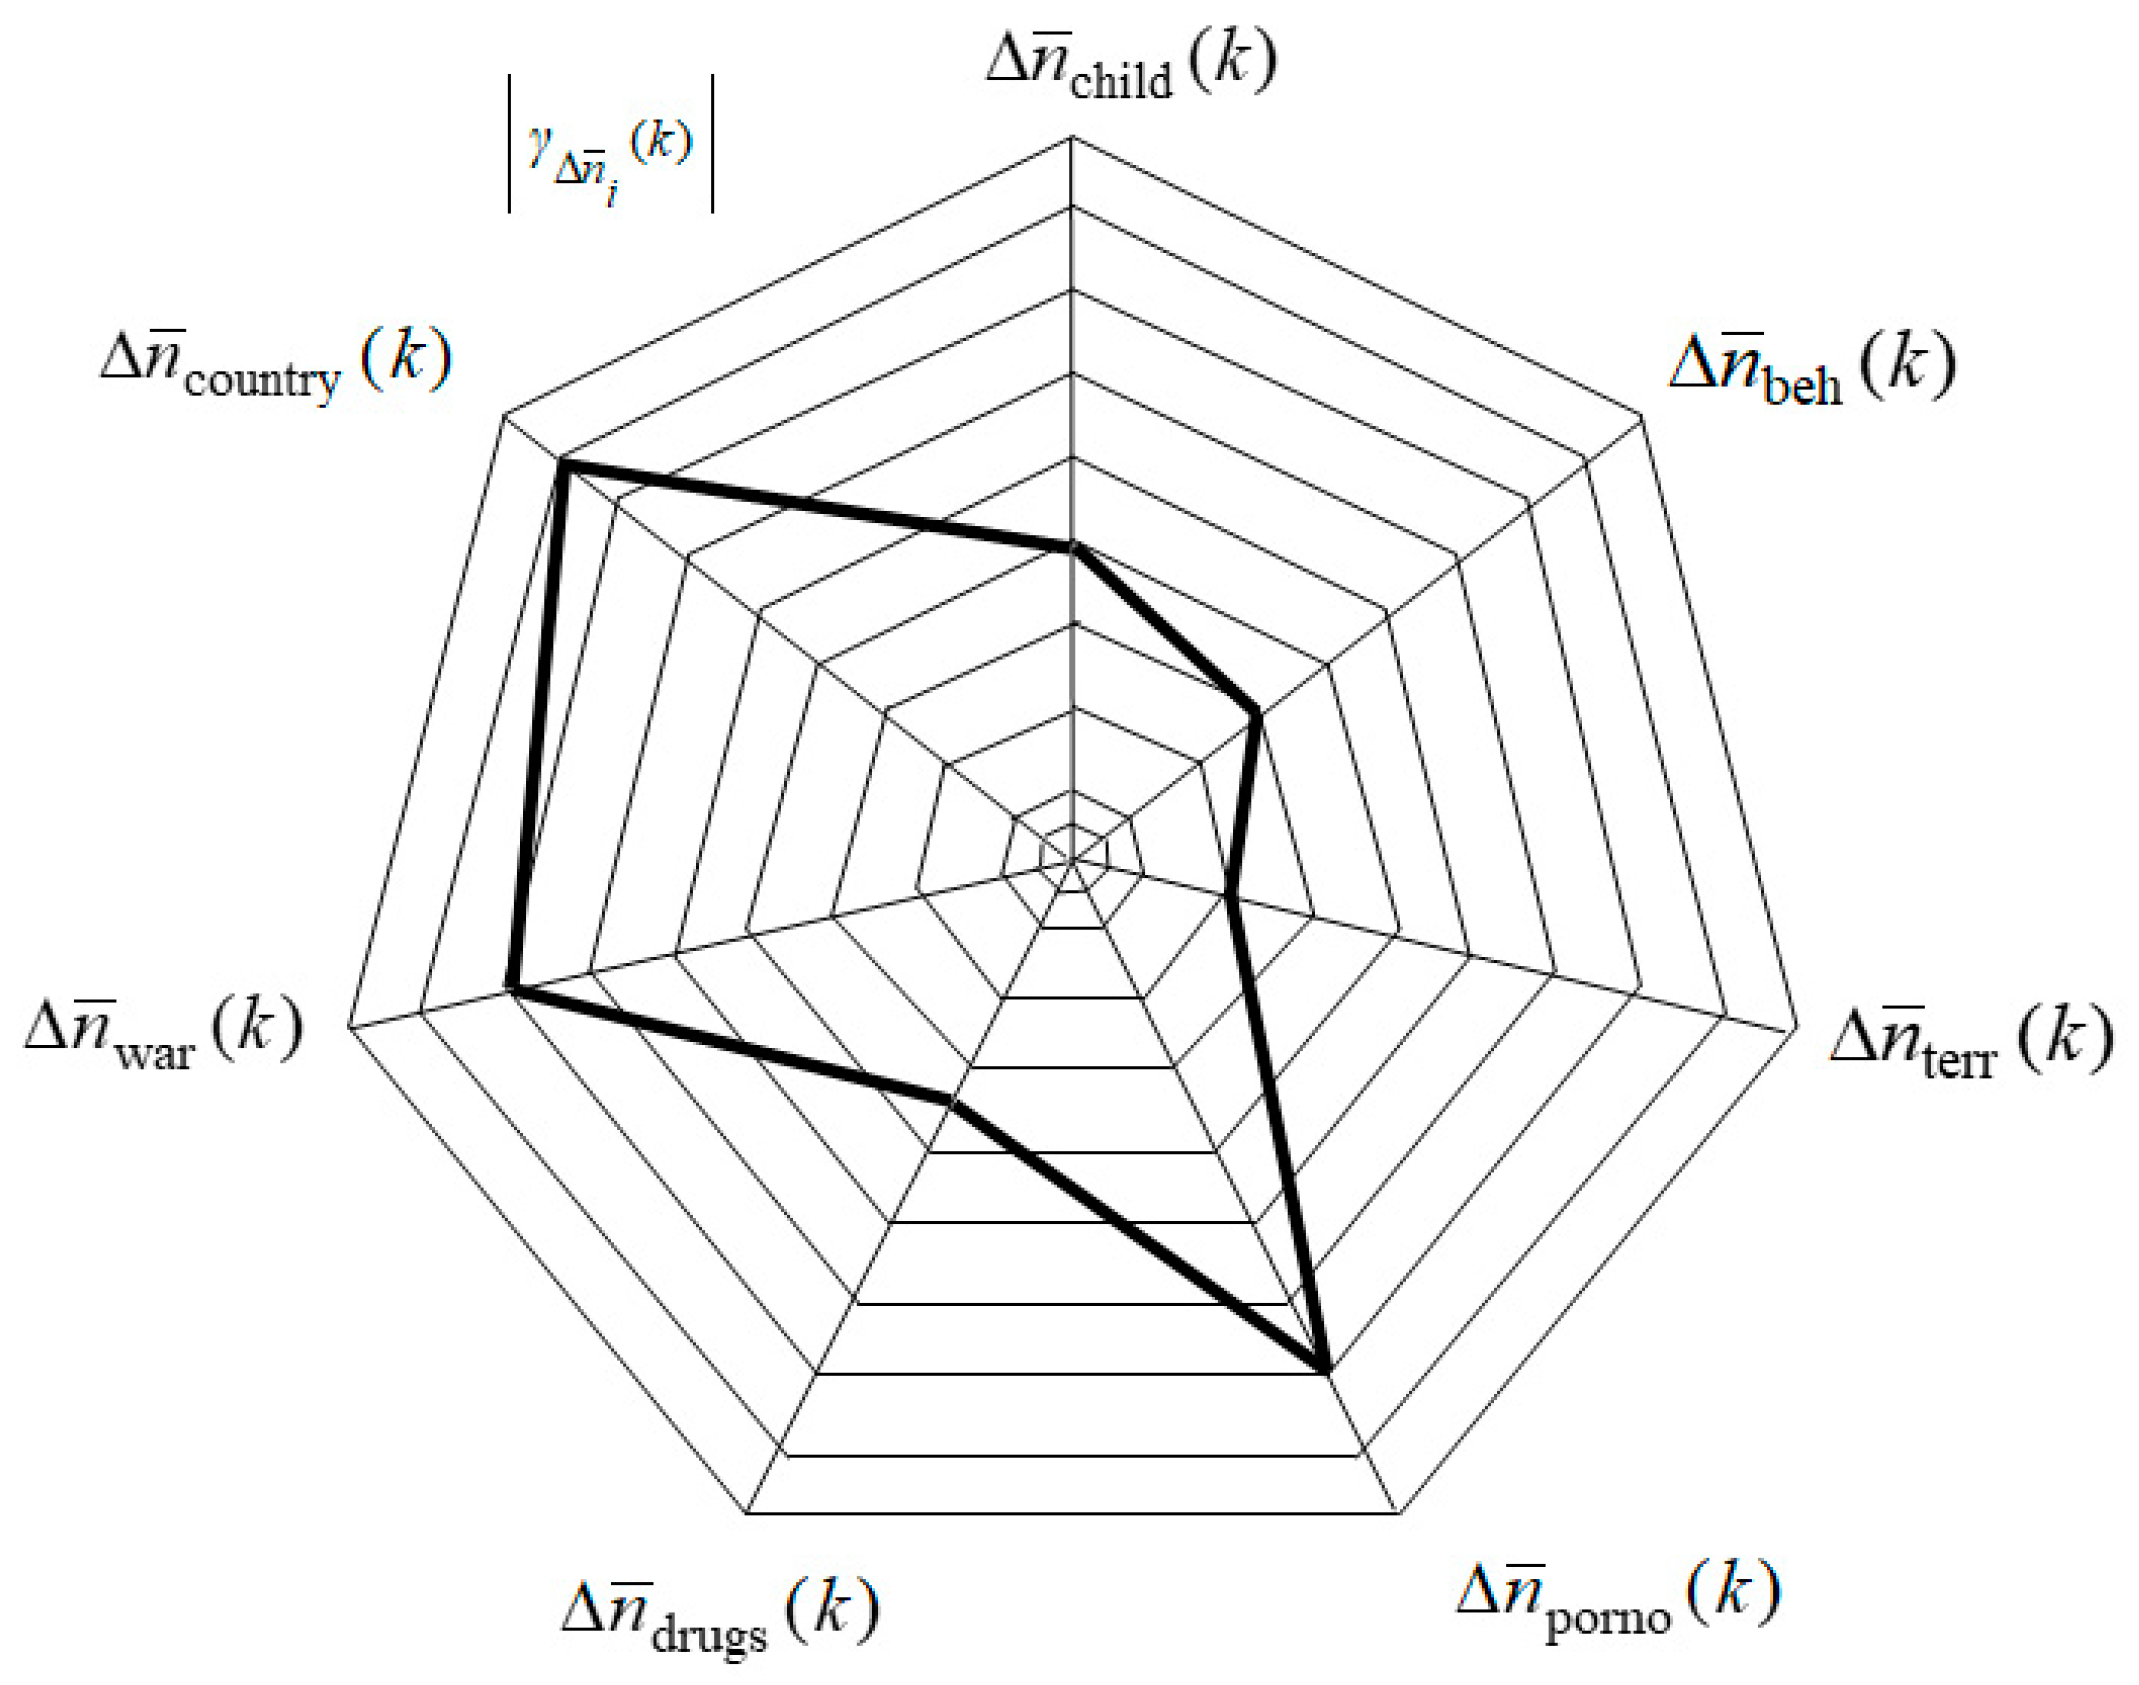
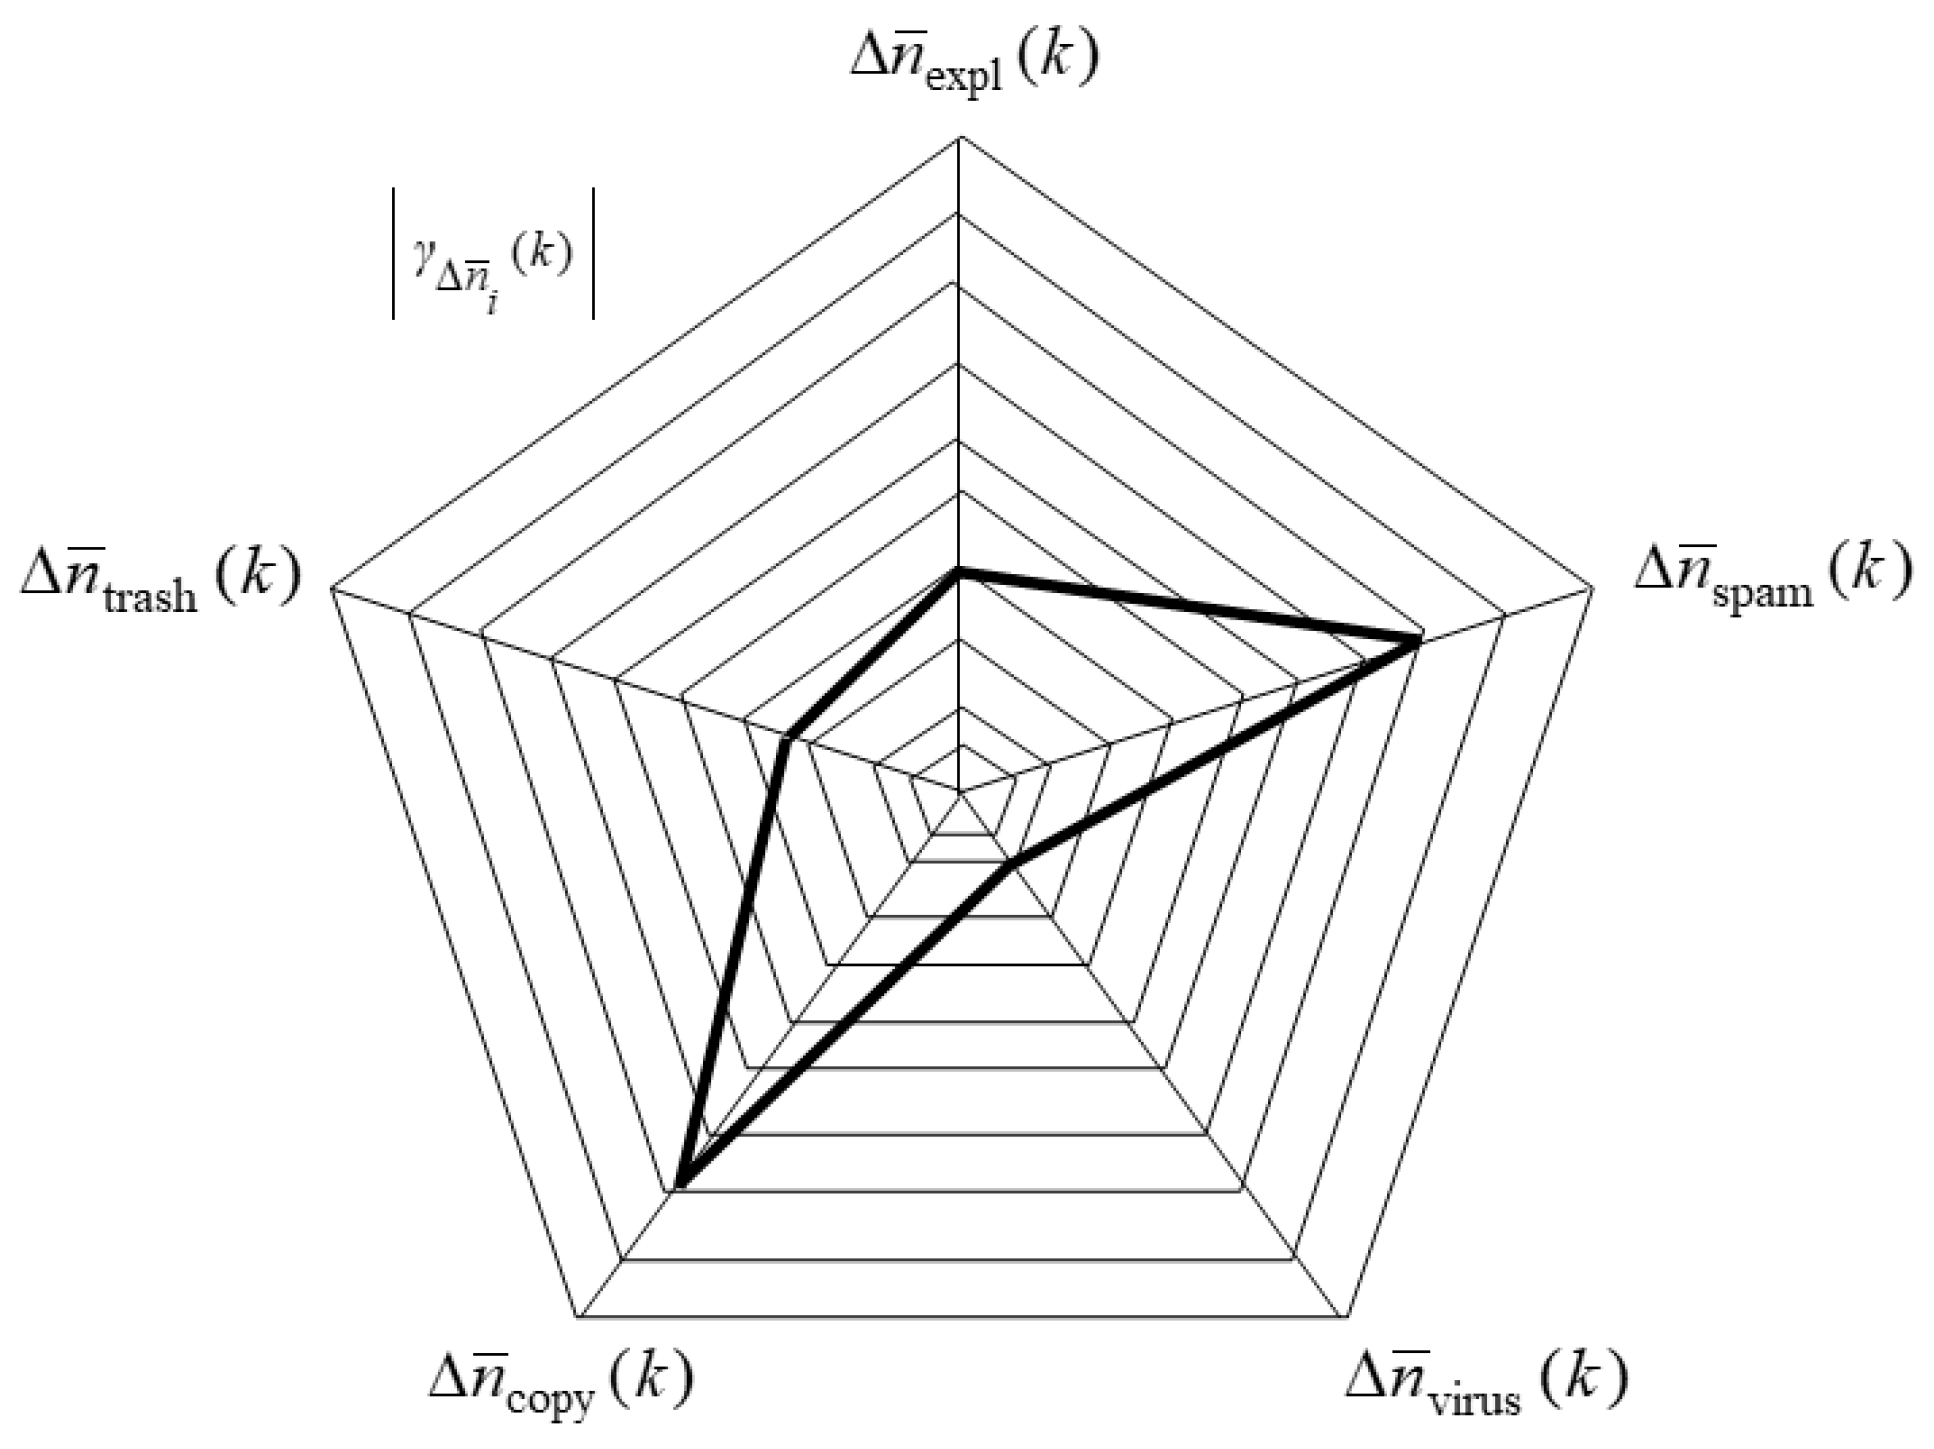
In addition, for the same values of the ratio of the excitation and observation noise , the experimental calculations were carried out. These calculations allowed, considering the empirical (taken as an example) data, to correlate the obtained values of the sensitivity functions of algorithms for filtering (estimation) of various harmful information indicators (Figure 3 and Figure 4).
The calculation results are summarized in “wind roses,” depicted by the circular radar charts. For the calculation, we have defined the indicators of harmful information, which have a negative impact on people (7 indicators, see Figure 3) and the indicators of harmful information, which have a negative impact on cybernetic and physical subsystems of CPS (5 indicators, see Figure 4). The sensitivity functions of algorithms for filtering (estimation) of different harmful information indicators were obtained taking into account the deviations from the real values of the elements of the matrix of transition probabilities for a specific i-th indicator .
5. Discussion
As shown in Reference [6,7,20,24], a sufficient condition for stopping the Kalman filter is when a steady-state value of the estimation error variance achieves the level, equal to 0.1. It can be argued that the requirements for the permissible deviations of the quality indicator of the algorithm for estimating indicators of harmful information in digital network content of CPS (under disturbances with respect to model parameters) can be formulated in a similar way.
Therefore, the required value of the sensitivity function “in large” for filtering (estimation) algorithms of a harmful information indicator to deviations of elements of the matrix of probabilities of this indicator transition from state to state it is advisable to consider .
Then, using the chart (in Figure 2.), it is easy to determine the allowable range of deviations of elements of the matrix . Within this range, the particular evaluation algorithms of the harmful information indicator in the interest of detecting and counteracting such information in the CPS digital network content, weakly sensitive to changes in a particular parameter of the model.
Moreover, if at the values of the ratio of the excitation and observation noise = 5, this range reaches the values ≤ 0.3, then with increasing the variance of the observation noise, in order to maintain the specified quality of the filter and the given reliability of assessment of the harmful information indicators, there are increasingly stringent requirements for the allowable range of deviations .
So, for the ratio of the excitation and observation noise = 2 and ≤ 0.1. It leads to the need to introduce additional procedures of identifying elements of the matrix of one-step transition probabilities for describing the process of changing the states of the harmful information indicator.
Thus, we obtained different values of the sensitivity function for estimating specific i-th (by groups) indicators of harmful information regarding the deviation of the values of the elements of the l × m matrix of the transition probability from state to state. These values indicate that for the same values of the ratio of the excitation and observation noise = 2, the sensitivity of the algorithms for filtering of various useful information indicators is different. For example, the sensitivity of filtering algorithms for the harmful information indicator does not exceed the value of 0.3 (is normal, not high) but for the indicator the sensitivity is unacceptable (see Figure 3). The results of calculations for harmful information indicators and are similar (see Figure 4).
6. Conclusions
Thus, summing up, we note that the secure operation of CPS (in terms of the availability and quantity of digital network content) is carried out in non-stationary conditions and under conditions of continuous exposure. This causes uncertainty of harmful information indicators to be assessed as part of analytical processing of the digital network content.
It is advisable, in our opinion, to take into account the a priori uncertainty about various effects on the basis of the expressions for the coefficients (functions) of sensitivity presented in this paper. This will allow analysing the limits of application of procedures for identifying the parameters of the CPS security model, as well as the limits of uncertainty of the CPS security state estimates obtained when monitoring digital network content.
In addition, understanding the accuracy of evaluating a random process (in our case, the process of changing the values of the harmful information indicator) as the measure of estimation error variance, it should be noted that in the existing techniques (without the use of filtering methods) the estimation error variance remains at the level of the a priori variance of the process itself, that is, the relative variance remains at the level of unity. At the same time, as shown by the research results and the simulation experiment, the use of filtering methods in the interests of evaluating the harmful information indicators will allow improving the quality of evaluating the security indicators of CPS of this class to 10% of the a priori one.
The proposed approach to analysing the sensitivity of the procedure for evaluating the state of the harmful information indicators observed in noise made it possible to investigate possible errors in the accuracy of estimating the availability and quantity of harmful information in the CPS digital network content.
This approach allowed us to identify the allowable range of changes in the model parameters for different ratios , within which the requirements for the quality of the filter and the reliability of estimating the indicators of this class are met. In addition, this approach made it possible to determine the application range of the procedure for identifying the elements of the matrix of transition probabilities for harmful information indicators from state to state.
In future research we will analyse the sensitivity of algorithms for evaluating the harmful information indicators in several specific implementations of CPS.
Author Contributions
I.K. conceived and designed the experiment; I.P. performed the experiment; I.K. and I.P. analysed the data; all authors wrote the paper.
Funding
This research is being partially supported by the grants of the RFBR (projects No. 16-29-09482, 18-37-20047, 18-07-01488, 18-07-01369 and 18-29-22034), by the budget (the project No. 0073-2019-0002) and by Government of the Russian Federation (Grant 08-08).
Conflicts of Interest
The authors declare no conflict of interest.
References
- Baykan, E.; Henzinger, M.; Marian, L.; Веber, I. Purely URL-based topic classification. In Proceedings of the 18th International Conference on World Wide Web (WWW’09), Madrid, Spain, 20–24 April 2009; pp. 1109–1110. [Google Scholar]
- Graneheim, U.H.; Lundman, B. Qualitative content analysis in nursing research: concepts, procedures and measures to achieve trustworthiness. Nurse Educ. Today 2004, 24, 105–112. [Google Scholar] [CrossRef] [PubMed]
- Vaismoradi, M.; Turunen, H.; Bondas, T. Content analysis and thematic analysis: Implications for conducting a qualitative descriptive study. Nurs. Health Sci. 2013, 15, 398–405. [Google Scholar] [CrossRef] [PubMed] [Green Version]
- Kotenko, I.; Chechulin, A.; Komashinsky, D. Categorisation of web pages for protection against inappropriate content in the Internet. Int. J. Int. Protoc. Technol. (IJIPT) 2017, 10, 61–71. [Google Scholar] [CrossRef]
- Kotenko, I.V.; Parashchuk, I.B.; Omar, T.K. Neuro-Fuzzy Models in Tasks of Intelligent Data Processing for Detection and Counteraction of Inappropriate, Dubious and Harmful Information. In Proceedings of the II International Scientific and Practical Conference «Fuzzy Technologies in the Industry» (FTI 2018), Ulyanovsk, Russia, 23–25 October 2018; Volume 2258, pp. 116–125. [Google Scholar]
- Kalman, R.E.; Bucy, R. New Results in linear filtering and prediction theory. Trans. ASME Basic Eng. 1961, 83, 95–108. [Google Scholar] [CrossRef]
- Kalman, R.E.; Falb, P.L.; Arbib, M.A. Topics in Mathematical System Theory; McGraw-Hill Book Company: New York, NY, USA, 1969; 353p. [Google Scholar]
- Yuksel, S. Control of Stochastic Systems; Queen’s University Mathematics and Engineering and Mathematics and Statistics: Kingston, ON, Canada, 2017; 167p. [Google Scholar]
- Bashkirtseva, I.A. Stochastic sensitivity of cycles in periodic dynamical systems. Eur. Phys. J. B 2018, 91, 283–300. [Google Scholar] [CrossRef]
- Chater, M.; Ni, A.; Blonigan, P.J.; Wang, Q. Least Squares Shadowing Method for Sensitivity Analysis of Diferential Equations. SIAM J. Numer. Anal. 2017, 55, 3030–3046. [Google Scholar] [CrossRef]
- Lasagna, D. Sensitivity analysis of chaotic systems using unstable periodic orbits. SIAM J. Appl. Dyn. Syst. 2018, 17, 547–580. [Google Scholar] [CrossRef]
- Liao, H. Efficient sensitivity analysis method for chaotic dynamical systems. J. Comput. Phys. 2016, 313, 57–75. [Google Scholar] [CrossRef]
- Saltelli, A.; Ratto, M.; Andres, T.; Campolongo, F.; Cariboni, J.; Gatelli, D.; Saisana, M.; Tarantola, S. Global Sensitivity Analysis. The Primer; John Wiley & Sons Ltd.: Chichester, UK, 2008; 305p. [Google Scholar]
- Chan, K.; Tarantola, S.; Saltelli, A.; Sobol, I.M. Sensitivity Analysis; Chan, K., Scott, M., Eds.; John Wiley & Sons: Chichester, UK, 2000; 167p. [Google Scholar]
- Banks, H.T.; Ernstberger, S.L.; Hu, S. Sensitivity equations for a size-structured population model. Q. J. Mech. Appl. Math. 2009, 67, 627–660. [Google Scholar] [CrossRef] [Green Version]
- Banks, H.T.; Nguyen, H.K. Sensitivity of dynamical systems to Banach space parameters. J. Math. Anal. Appl. 2006, 323, 146–161. [Google Scholar] [CrossRef] [Green Version]
- Eslami, M. Theory of Sensitivity in Dynamic Systems: An Introduction; Springer Science & Business Media: Luxembourg, 2013; 601p. [Google Scholar]
- Ye, Z.-C.; Fan, Q.-D.; He, Q.-B.; Liu, Z.-R. Adaptability and Sensitivity of Complex Systems. Int. J Bifurcation Chaos 2013, 23, 28–52. [Google Scholar] [CrossRef]
- Cacuci, D.G. Sensitivity and Uncertainty Analysis. Volume 1: Theory; Chapman & Hall: London, UK, 2003; 285p. [Google Scholar]
- Parashchuk, I.B. Decision Support at the Phase of Estimation of Telecommunication Network Functioning Efficiency. In Proceedings of the International Conference on Communications IEEE/ICC2001 St.-Petersburg, St.-Petersburg, Russia, 11–15 June 2001; pp. 2–6. [Google Scholar]
- Rozenwasser, E.N.; Yusupov, R.M. Sensitivity of Automatic Control Systems (Control Series); CRC Press LCC, N.W. Corporate Blvd.: Boca Raton, FL, USA, 2000; 435p. [Google Scholar]
- Dorf, R.C.; Bishop, R.H. Modern Control Systems, 12th ed.; Pearson: Prentice Hall, NJ, USA, 2014; 1111p. [Google Scholar]
- Kotenko, I.V. Active Vulnerability Assessment of Computer Networks by Simulation of Complex Remote Attacks. In Proceedings of the International Conference on Computer Networks and Mobile Computing. ICCNMC-03 (IEEE Computer Society), Shanghai, China, 20–23 October 2003; pp. 40–47. [Google Scholar]
- Sage, A.P.; Melsa, J.L. Estimation Theory with Applications to Communications and Control; McGraw-Hill: New York, NY, USA, 1971; 529p. [Google Scholar]
- Sage, A.P.; White, C.C. Optimum Systems Control, 2nd ed.; Prentice-Hall, Inc.: Englewood Cliffs, NJ, USA, 1977; 428p. [Google Scholar]
- Segall, A. Optimal control of noise finite-state Markov process. IEEE Trans. Autom. Control 1977, 22, 179–186. [Google Scholar] [CrossRef]
Figure 1.
Block diagram of the step-by-step calculation of the sensitivity function for the algorithm of evaluating of harmful information indicators.
Figure 1.
Block diagram of the step-by-step calculation of the sensitivity function for the algorithm of evaluating of harmful information indicators.

Figure 2.
The dependence of the sensitivity function values on the value of the model parameters deviation for different ratios of the excitation noise and observation dispersions.
Figure 2.
The dependence of the sensitivity function values on the value of the model parameters deviation for different ratios of the excitation noise and observation dispersions.

Figure 3.
The circular radar chart of the results of experimental calculations of the sensitivity functions values for filtering algorithms for a group of harmful information indicators, which has a negative impact on people.
Figure 3.
The circular radar chart of the results of experimental calculations of the sensitivity functions values for filtering algorithms for a group of harmful information indicators, which has a negative impact on people.

Figure 4.
The circular radar chart of the results of experimental calculations of the sensitivity functions values for filtering algorithms for a group of harmful information indicators, which has a negative impact on cybernetic and physical subsystems of cyber physical systems (CPS).
Figure 4.
The circular radar chart of the results of experimental calculations of the sensitivity functions values for filtering algorithms for a group of harmful information indicators, which has a negative impact on cybernetic and physical subsystems of cyber physical systems (CPS).

© 2019 by the authors. Licensee MDPI, Basel, Switzerland. This article is an open access article distributed under the terms and conditions of the Creative Commons Attribution (CC BY) license (http://creativecommons.org/licenses/by/4.0/).
Share and Cite
MDPI and ACS Style
Kotenko, I.; Parashchuk, I. Analysis of the Sensitivity of Algorithms for Assessing the Harmful Information Indicators in the Interests of Cyber-Physical Security. Electronics 2019, 8, 284. https://doi.org/10.3390/electronics8030284
AMA Style
Kotenko I, Parashchuk I. Analysis of the Sensitivity of Algorithms for Assessing the Harmful Information Indicators in the Interests of Cyber-Physical Security. Electronics. 2019; 8(3):284. https://doi.org/10.3390/electronics8030284
Chicago/Turabian StyleKotenko, Igor, and Igor Parashchuk. 2019. "Analysis of the Sensitivity of Algorithms for Assessing the Harmful Information Indicators in the Interests of Cyber-Physical Security" Electronics 8, no. 3: 284. https://doi.org/10.3390/electronics8030284
Note that from the first issue of 2016, this journal uses article numbers instead of page numbers. See further details here.