 Lavida R. K. Brooks
 George I. Mias
- 1Microbiology and Molecular Genetics, Institute for Quantitative Health Science and Engineering, Michigan State University, East Lansing, MI, United States
- 2Biochemistry and Molecular Biology, Institute for Quantitative Health Science and Engineering, Michigan State University, East Lansing, MI, United States
Alzheimer's disease (AD) has been categorized by the Centers for Disease Control and Prevention (CDC) as the 6th leading cause of death in the United States. AD is a significant health-care burden because of its increased occurrence (specifically in the elderly population), and the lack of effective treatments and preventive methods. With an increase in life expectancy, the CDC expects AD cases to rise to 15 million by 2060. Aging has been previously associated with susceptibility to AD, and there are ongoing efforts to effectively differentiate between normal and AD age-related brain degeneration and memory loss. AD targets neuronal function and can cause neuronal loss due to the buildup of amyloid-beta plaques and intracellular neurofibrillary tangles. Our study aims to identify temporal changes within gene expression profiles of healthy controls and AD subjects. We conducted a meta-analysis using publicly available microarray expression data from AD and healthy cohorts. For our meta-analysis, we selected datasets that reported donor age and gender, and used Affymetrix and Illumina microarray platforms (8 datasets, 2,088 samples). Raw microarray expression data were re-analyzed, and normalized across arrays. We then performed an analysis of variance, using a linear model that incorporated age, tissue type, sex, and disease state as effects, as well as study to account for batch effects, and included binary interactions between factors. Our results identified 3,735 statistically significant (Bonferroni adjusted p < 0.05) gene expression differences between AD and healthy controls, which we filtered for biological effect (10% two-tailed quantiles of mean differences between groups) to obtain 352 genes. Interesting pathways identified as enriched comprised of neurodegenerative diseases pathways (including AD), and also mitochondrial translation and dysfunction, synaptic vesicle cycle and GABAergic synapse, and gene ontology terms enrichment in neuronal system, transmission across chemical synapses and mitochondrial translation. Overall our approach allowed us to effectively combine multiple available microarray datasets and identify gene expression differences between AD and healthy individuals including full age and tissue type considerations. Our findings provide potential gene and pathway associations that can be targeted to improve AD diagnostics and potentially treatment or prevention.
1. Introduction
Aging refers to the physiological changes that occur within the body overtime (Lopez-Otin et al., 2013). These changes are accompanied by deteriorating cell and organ function due to cellular and immune senescence and DNA and protein damage (Lopez-Otin et al., 2013; Van Deursen, 2014; Childs et al., 2015). Aging causes an increased risk for diseases. Age-related diseases are becoming a public health concern due to an overall increase in the older population and the average human life span in developed countries (Black et al., 2015; Rowe et al., 2016). It is predicted that by the year 2050, the number of Americans over 85 years of age will triple from 2015 (United Nations Department of Economic and Social Affairs, 2015; Jaul and Barron, 2017). Larger percentages of the elderly and their increased risk for diseases can affect the economy, and social and health care costs (Dallmeyer et al., 2017). For instance, immune system dysfunction and cognitive decline due to aging increases the risk of neurodegenerative diseases, such as Alzheimer's disease (AD) (Jevtic et al., 2017; Mattson and Arumugam, 2018). Previous research explored brain aging and found notable changes in brain size, brain structure and function (Drayer, 1988). Changes in the brain as we age are also known as hallmarks of brain aging. These hallmarks include: mitochondrial dysfunction, damage to proteins and DNA due to oxidation, neuroinflammation due to immune system dysfunction, reduction in brain volume size and gray and white matter, and impaired regulation of neuronal Ca2+ (Drayer, 1988; Mattson and Arumugam, 2018). These alterations render the aging brain vulnerable to neurodegenerative diseases, such as AD.
AD, the most common form of dementia, is currently the 6th leading cause of death (Taylor et al., 2017) in the United States (US). In 2010, an estimate of 4.7 million people in the US had AD, and the number of AD patients is expected to increase to 13.8 million in 2050 and to 15 million by 2060 (Hebert et al., 2013; Brookmeyer et al., 2018; Matthews et al., 2018). As with other age-related diseases, the risk of AD increases with age. AD is currently characterized by the accumulation of amyloid-beta (Aβ) plaques and neurofibrillary tangles due to tau protein modifications (Masters et al., 2015). These two protein changes are the main pathological changes in AD (Masters et al., 2015). Aβ is formed when the amyloid precursor protein (APP) is cleaved by γ-secretases and β-secretases. Cleavage of APP forms fragments of Aβ which aggregate and deposit on neurons as plaques, which causes neuronal death in conjunction with neurofibrillary tangles (Masters et al., 2015).
While AD's prevalence is on the rise due to increased life expectancy, there is still no treatment available and diagnosis of AD is challenging. How AD progresses is still not completely understood (De Jager et al., 2018). New technologies are available, such as positron-emission tomography (PET) imaging and monitoring levels of Aβ and tau in cerebrospinal fluid (Masters et al., 2015). Co-morbidities that can exist due to aging, such as hippocampal sclerosis further complicate AD diagnosis (Toepper, 2017). Furthermore, questions have been raised regarding whether or not AD is simply an accelerated form of aging due to them both being associated with changes in cognition (Toepper, 2017). However, studies have identified clear neurocognitive differences in cognition, brain size and function in AD compared to healthy aged subjects. For example, AD patients have more gray matter loss compared to white matter, impaired verbal and semantic abilities and more intense memory dysfunction compared to healthy seniors (Toepper, 2017).
Pathological changes within the brain are observed prior to clinical diagnosis of AD. In most cases AD cannot be confirmed until postmortem examination of the brain. Researchers are investigating novel biomarkers to detect for earlier diagnosis before diseased individuals become functionally impaired. Meta-analysis of microarray datasets is becoming more popular for it provides stronger power to studies due to larger sample sizes obtained through statistically combining multiple datasets. Microarray data are also available in large quantities on public online data repositories. In the case of AD, Winkler and Fox performed a meta-analysis that compared neurons within the hippocampus of AD patients and healthy controls. They identified that processes, such as apoptosis, and protein synthesis, were affected by AD and were regulated by androgen and estrogen receptors (Winkler and Fox, 2013). Researchers have also explored differences in gene expression in Parkinson's and AD subjects via a meta-analysis approach (Wang et al., 2017), and identified functionally enriched genes and pathways that showed overlap between the two diseases (Wang et al., 2017). Most recently, Moradifard et al. identified differentially expressed microRNAs and genes when comparing AD to healthy controls via a meta-analysis approach. They also identified two key microRNAs that act as regulators in the AD gene network (Moradifard et al., 2018).
In our investigation, our goal was to identify age, sex, and tissue effects on gene expression variability in AD by comparing age-matched healthy controls to AD subjects via a meta-analysis approach. In this data-driven approach, we explored global gene expression changes in 2,088 total samples (771 healthy, 868 AD, and 449 possible AD, curated from eight studies) from 26 different tissues, to identify genes and pathways of interest in AD that can be affected by factors, such as age, sex, and tissue. Our findings provide potential gene and pathway associations that can be targeted to improve AD diagnostics and potentially treatment or prevention.
2. Methods
We conducted a meta-analysis using eight publicly available microarray expression datasets (Table 1) from varying tissues and microarray platforms on AD. We developed a thorough computational pipeline (Figure 1A) that involved curating and downloading raw microarray expression data, pre-processing the raw expression data and conducting a linear model analysis of the gene expression profiles. Statistically different genes based on disease state were identified following analysis of variance (ANOVA) on the linear model which compared gene expression changes due to disease state, sex, age, and tissue. These genes were further analyzed using a Tukey Honest Significant Difference (TukeyHSD) test to determine their biological significance (Tukey, 1949). In addition to the p-values, we also obtained the mean differences between binary comparisons of groups (also generated by the TukeyHSD), as a measure of biological effect size. We examined the TukeyHSD results by filtering by each factor, and identified up and down regulated genes. We then selected genes that showed statistically significant pairwise interactions between disease status and sex, age and tissue. Using these genes, we used R packages ReactomePA (Yu and He, 2016) and clusterProfiler (Yu et al., 2012) to conduct gene enrichment and pathway analyses of the differentially expressed genes (DEG). We used BINGO in Cytoscape v.3.7.0 for gene ontology (GO) analysis on each gene set for each factor (Shannon et al., 2003; Maere et al., 2005).
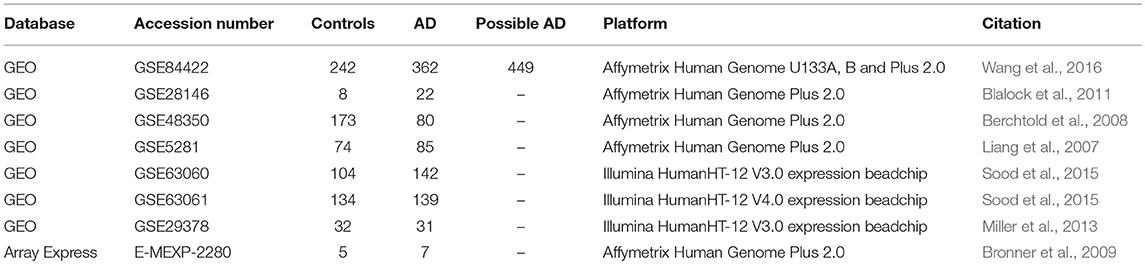
Table 1. Curated microarray datasets and the study description.
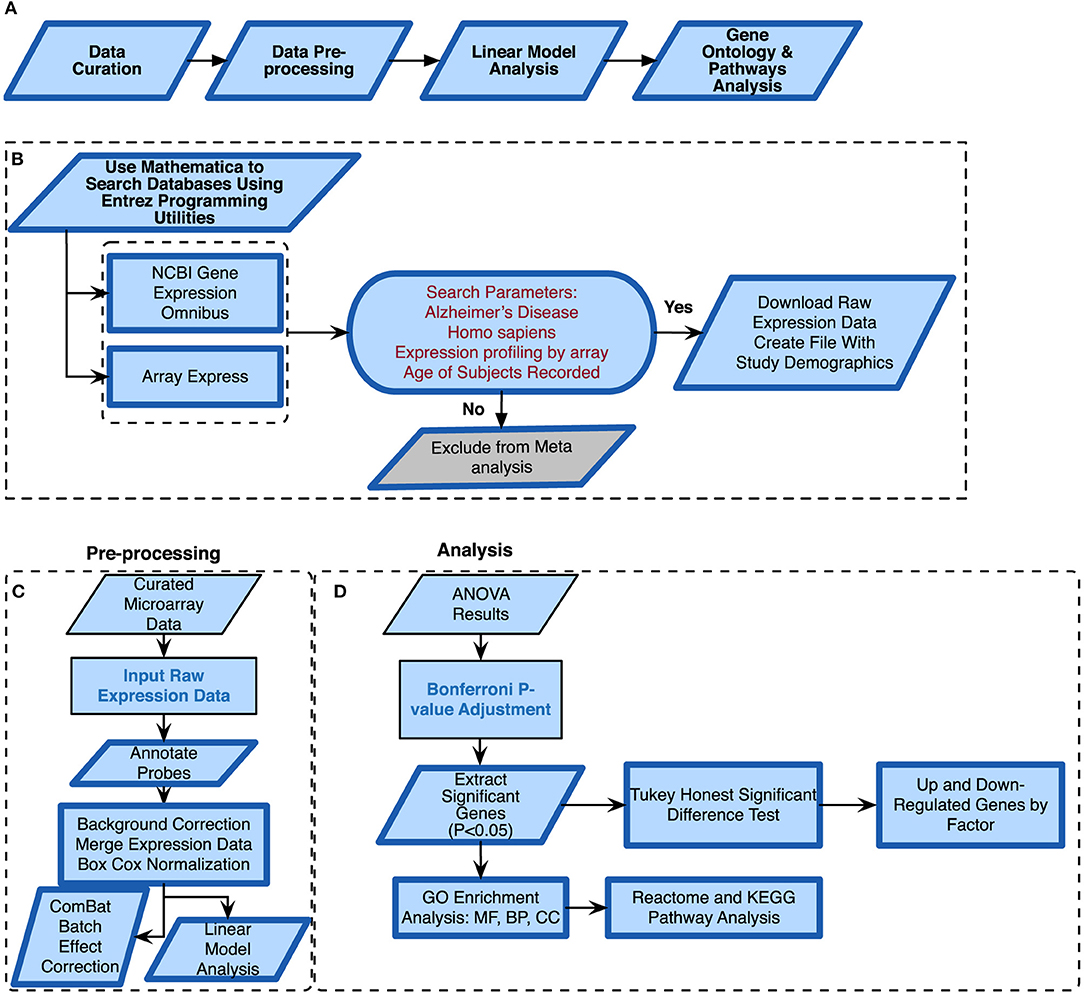
Figure 1. Alzheimer's disease meta-analysis framework. (A) Simplified workflow used for the meta-analysis, (B) pipeline for curating microarray data, (C) pipeline for pre-processing the microarray data, (D) methods used for meta-analysis of raw expression microarray data.
2.1. Microarray Data Curation
We curated microarray expression data from two data repositories: National Center for Biotechnology Information (NCBI) Gene Expression Omnibus (GEO) (Edgar et al., 2002) and Array Express (Brazma et al., 2003) (Figure 1B). We searched these repositories by using entrez programming utilities in Mathematica (Mias, 2018b; Wolfram Research, Inc., 2017). In this search, we used the following keywords: Homo sapiens, Alzheimer's Disease and expression profiling by array (Figure 1B). This search resulted in 105 datasets from GEO and 8 from Array Express. We further filtered the search results by excluding data from cell lines, selecting for expression data from Illumina and Affymetrix microarray platforms, and focusing on datasets that provided the ages and sex of their samples (Figure 1B). After filtering through the databases, we found seven datasets from GEO (GSE84422, GSE28146, GSE48350, GSE5281, GSE63060, GSE63061, GSE29378) and one dataset from Array Express (E-MEXP-2280) to conduct our meta-analysis of expression profiling to assess differences in gene expression due to disease state, sex, age, and tissue (Table 1). The majority of samples from AD subjects were collected post-mortem, from a variety of brain banks, while the subjects from GSE63060 and GSE63061 voluntarily gave blood samples (Table S1). The criteria and guidelines followed for diagnosis and sampling varied across datasets (Table S1). Additionally, we downloaded the raw expression data from each dataset, and created a demographics file per study, which included characteristics about the samples (Table 2). Our demographics file included information about the subjects that was reported in all datasets. For example, some studies reported the type of AD diagnosis for their respective subjects, as well as the Braak stage and APOE genotype, whereas others did not (Table S1). Therefore, to ensure uniform annotation of the subjects, we re-annotated subject information provided from the databases: For GSE28146, we grouped the sub-types of AD, incipient, moderate and severe, as AD because we did not have such classification information for our other AD samples. We changed all the GSE29378 tissue types to hippocampus, relabeled the “probable AD” disease state to “possible AD” in GSE84422, only used AD and control subjects from the E-MEXP-2280 and GSM238944 with an age of >90 (not a definite age) was removed from GSE5281. We should note also that the 1,053 samples from the GSE84422 dataset included different tissues from the same subjects, which were treated independently—a paired-design was not incorporated in our downstream analysis.
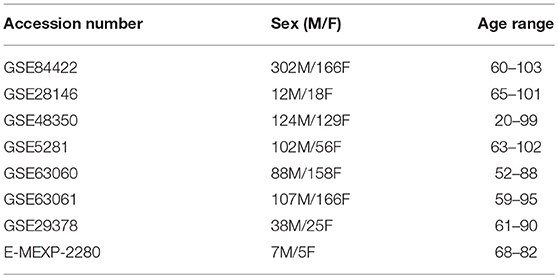
Table 2. Patient characteristics for curated datasets.
2.2. Pre-processing and Data Normalization
We downloaded the raw expression data from the data repositories in Mathematica (Wolfram Research, Inc., 2017) and pre-processed each file in R (R Core Team, 2018) using the appropriate R packages based on the microarray platform. The affy package was used to pre-process all the .CEL data files from Affymetrix (Gautier et al., 2004), and the limma package for Illumina summary data files (Ritchie et al., 2015). We performed background correction, normalization and annotated and summarized all probes (Figure 1C). For the Affymetrix expression data files, we used the expresso function with the following parameters: robust multi-array analysis (RMA) for background correction, perfect-match (PM) adjustment to correct the perfect match probes, and ‘avdiff’ for the summary method to compute expression values (Gautier et al., 2004). We also used the avereps function from limma to summarize probes and remove replicates (Ritchie et al., 2015). For the Illumina expression data, we corrected the background using the NormExp Background Correction (nec) function from the limma package for datasets where the detection p-values were reported, we annotated and used the aggregate function from the stats package in base R to summarize probes (Ritchie et al., 2015; R Core Team, 2018). We merged all 8 datasets into one large matrix file via common gene symbols. After merging the datasets, we performed a BoxCox power transformation (Sakia, 1992) using the ApplyBoxCoxTransform function and data standardization using the StandardizeExtended function from the MathIOmica package (Mias et al., 2016; Mias, 2018b) (Figure 1C and also see ST2 of online Supplementary Datasheet).
2.3. Visualizing Variation Due to Batch Effects
Merging expression data from different studies, array platforms and tissues can introduce confounding factors and manipulate interpretation of results. To address this, and assess whether batch effects were evident and could be accounted for, we used the ComBat function in the sva package in R (Johnson et al., 2007; Nygaard et al., 2016) to adjust data for known batch effects. In this study, the batch effect was the study (i.e. different experiments/research groups), and we also found that there was a one-to-one correspondence between study and platform. Using expression data from prior to and post ComBat corrections, we used principal component analysis (PCA) plots to visualize the variability in the data and the effectiveness of possible batch effect removal (Irizarry and Love, 2015).
2.4. Analysis of Variance
We modeled the merged expression data (see model breakdown below) prior to running ANOVA (using the anova and aov functions from the stats package in base R) to analyze differences among the different study factors (Figure 1D) (Pavlidis, 2003). We defined age group, sex, disease state, study and tissue as factors.
where xi ∈ {age group, sex, tissue, disease status} and the factors have the following levels:
• disease status = {control, possible AD, AD}
• sex = {male, female}
• age group = {under 60, 60–65, 65–70, 70–75, 75–80, 80–85, 85–90, 90–95, over 95}
• tissue = {amygdala, anterior cingulate, blood, caudate nucleus, dorsolateral prefrontal cortex, entorhinal cortex, frontal pole, hippocampus, inferior frontal gyrus, inferior temporal gyrus, medial temporal lobe, middle temporal gyrus, nucleus accumbens, occipital visual cortex, parahippocampal gyrus, posterior cingulate cortex, precentral gyrus, prefrontal cortex, primary visual cortex, putamen, superior frontal gyrus, superior parietal lobule, superior temporal gyrus, temporal pole}
• study = {GSE84422, GSE28146, GSE48350, GSE5281, GSE63060, GSE63061, GSE29378, E-MEXP-2280}
The p-values following the ANOVA were adjusted using Bonferroni correction for multiple hypothesis testing (Pavlidis, 2003). Genes with p-values < 0.05 were considered statistically significant. We found statistically significant disease genes by filtering on the disease status for p < 0.05. Additionally, we used the enrichKEGG function in the clusterprofiler package in R for Kyoto Encyclopedia of Genes and Genomes (KEGG) enrichment analysis on these genes (Kanehisa and Goto, 2000; Yu et al., 2012). We also performed Reactome pathway analysis with the enrichPathway function in the ReactomePA package in R (Yu and He, 2016). These packages adjust p-values using the Benjamini Hochberg method for False Discovery Rate (FDR) control. Enriched pathways with adjusted p < 0.05 were considered statistically significant (Yu et al., 2012; Yu and He, 2016) (see ST5 and ST6 of online Supplementary Datasheet).
2.5. Identifying Up and Down Regulated Genes by Factor
To identify which of the 3,735 genes that show biologically significant differences, we conducted a TukeyHSD (using the TukeyHSD function from the stats package in base R) to determine statistically significant up and down-regulated genes using the difference in the means of pairwise comparisons between the levels within each factor (Tukey, 1949; Mias, 2018a). We carried out TukeyHSD testing on the statistically significant disease genes we obtained from the ANOVA. To account for multiple hypothesis testing in the TukeyHSD results, we used <0.00013 (0.05/number of genes ran through TukeyHSD) as a Bonferroni adjusted cutoff for statistical significance.
We selected the TukeyHSD results from the disease status factor, and focused on the “Control-AD” pairwise comparison to assess statistically significant gene expression differences. To assess biological effect, and select an appropriate fold-change-like cutoff (as our results had already been transformed using a Box-Cox transformation), we calculated the quantiles based on the TukeyHSD difference of mean difference values (Table S2). We used a two-tailed 10 and 90% quantile to identify significantly up and down regulated genes (Table S2).
The DEG by disease status factor were subsequently used to determine whether or not there was a sex, age, or tissue effect on them. For sex, we used the DEG to filter the TukeyHSD results for sex factor differences, identified statistically significant sex-relevant genes based on p-value cutoff, and the computed 10 and 90% quantiles based on the difference of means between male and female groups. We repeated the above steps for age group, but focused only on the binary comparisons where all age groups were compared to the <60 age group, which was used as a baseline (i.e. computed the mean gene expression differences per group comparison, i- <60, where i stands for any age group). This was carried out to enable us to compare the progression with age, relative to a common reference across all age groups. As for tissue, we carried out the same steps as above to determined DEG based on comparisons both a hippocampus-based baseline, as well a blood-based baseline.
Following the identification of the DEG by disease status and sex, we visualized the raw expression data for these genes in heatmaps. In addition to this, we generated heatmaps using the difference of means values (TukeyHSD) for the identified DEG by age group (<60 baseline) and tissue (hippocampus and blood as baseline).
To further investigate the significance of pairwise interactions with disease status and the factors sex, age and tissue, we used the identified statistically significant (p < 0.00013, two-tailed 10 and 90% quantile) genes from our post-hoc analysis for each factor, and filtered our ANOVA results for statistically significant interactions (Bonferroni corrected p < 0.05, see also ST4 of online Supplementary Datasheet).
2.6. Gene Ontology and Reactome Pathway Analysis
For the disease and sex DEG sets, we used the R package ReactomePA to find enriched pathways (Yu and He, 2016). We also built networks to determine if genes overlapped across pathways. Additionally, we used BINGO in Cytoscape for GO analysis to determine the biological processes the genes were enriched in Maere et al. (2005). Results were considered statistically significant based on Benjamini-Hochberg adjusted p-value < 0.05.
3. Results
With our data selection criteria outlined in Figure 1B we identified 8 datasets from GEO and Array Express to conduct our meta-analysis to assess differences in gene expression due to disease state, sex, age, and tissue (Table 1). We merged the processed expression data by common gene names, which gave us a total of 2,088 samples and 16,257 genes. The 2,088 samples consisted of 771 healthy controls, 868 AD subjects, 449 subjects reported as possibly having AD, 1308 females, and 780 males.
3.1. ComBat Batch Effect Visualization
Combining data from different platforms, tissues and different laboratories introduces batch effects. Batch effects are sources of non-biological variations that can affect conclusions. We used the ComBat algorithm in R which works by adjusting the data based on a known batch effect. For our analysis we classified the study variable as our batch (the study and type of platform are directly related). We used PCA to visualize variation in the merged expression data before and after ComBat (Figures 2, 3; Figures S1–S3). In Figure 2 before correcting for batch effects, the datasets separate into four main clusters with a variance of 54.3% in PC1 and 13% in PC2. Following ComBat, those main clusters appear to be removed, with an overall reduction in variation for both principal components. We also looked at how the data separated by factor. In Figure 2B, there are two clear groups and this separation is accounted for when we look at the separation in the data by tissue (Figure 3). In Figure 3, before correction the four groups observed in Figure 2 are still evident. Following ComBat, the tissues: amygdala and nucleus accumbens cluster together in one group while all other tissues are in another. Batch effect correction with ComBat was solely used for visualizing how the expression data separates before and after ComBat correction—i.e., the batch corrected expression data were not used in the downstream analysis. We instead used a linear model to account for confounding study effects. Visualizing and understanding the variation within the expression data following the merge confirmed the need to include the study as a factor in the linear model analysis.
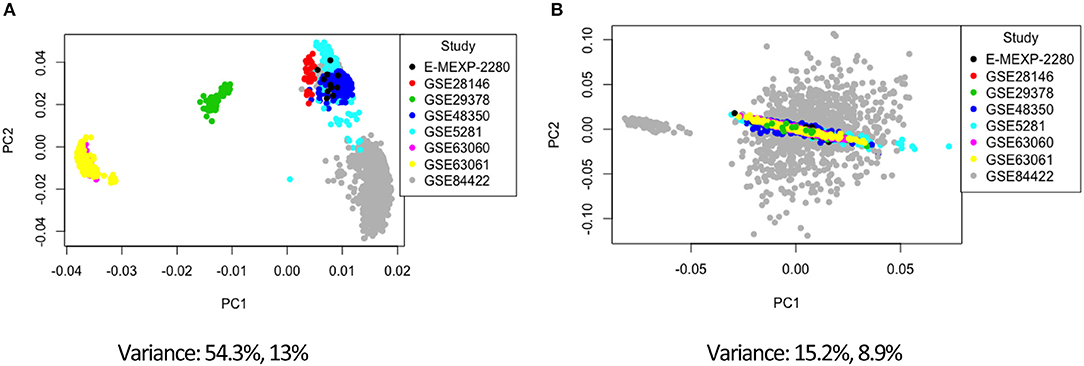
Figure 2. Principal component analysis of the study factor before (A) and after (B) batch correction with ComBat.
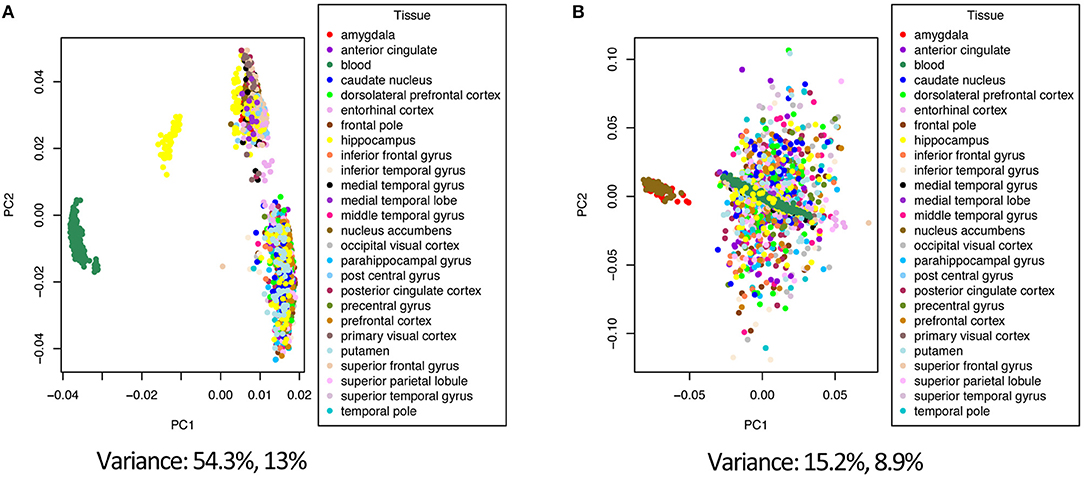
Figure 3. Principal component analysis of the tissue factor before (A) and after (B) batch correction with ComBat.
3.2. Analysis of Variance on Gene Expression by Disease State
Using ANOVA we assessed the variance in gene expression across the different factors in our linear model by including the following factors and their pairwise interactions: age group, study, tissue, sex and disease state (Pavlidis, 2003). Statistically significant gene expression differences were determined using a Bonferroni (Bland and Altman, 1995 adjusted p < 0.05) (Pavlidis, 2003; Mias, 2018a). With our focus on differences by disease status, we filtered genes based on the ANOVA adjusted p-values for the disease factor. Selecting for statistical significance by disease status we found 3,735 genes (see ST4 of online Supplementary Datasheet). We conducted GO and pathway analysis on these genes. The KEGG pathway analysis results are displayed in Table 3 (see ST5 of online Supplementary Datasheet for full table). The analysis showed that the genes are involved in Reactome pathways, such as the Mitochondrial Translation Initiation (55 gene hits), Signaling by the B Cell Receptor (61 gene hits), Activation of NF-kappaβ in B cells (40 gene hits), Transmission across Chemical Synapses (83 gene hits) and Neuronal System (119 gene hits) (see ST6 of online Supplementary Datasheet). The KEGG pathways that were enriched for this gene set included neurodegenerative disease pathways, such as Alzheimer's (31 gene hits), Huntington's (76 gene hits) and Parkinson's (53 gene hits) (Table 3) Pathways. We also had genes enriched in synaptic pathways including Synaptic vesicle cycle (30 gene hits), Dopaminergic synapse (48 gene hits) and GABAergic synapse (34 gene hits) (Table 3). In addition to synapses and neurodegeneration, the long term potentiation (23 gene hits) pathway was associated with these genes (see ST5 of online Supplementary Datasheet for full KEGG pathway analysis results). To further explore the enriched genes in the KEGG AD pathway, we used the TukeyHSD results to determine whether genes were up- or down-regulated (see ST7 of online Supplementary Datasheet). To further assess the 73 gene hits identified in the enriched AD pathway we computed their mean differences between AD and control subjects, and used MathIOmica (Mias et al., 2016) tools to highlight them in the AD pathway (Figure 4) (Kanehisa and Goto, 2000; Kanehisa et al., 2016, 2017; Mias, 2018b) (see ST7 of online Supplementary Datasheet for full table with difference of means). For instance, the APOE and LRP gene were both found to be up-regulated in AD subjects compared to healthy controls, and in the KEGG AD pathway these genes are involved in Aβ aggregation (Figure 4).
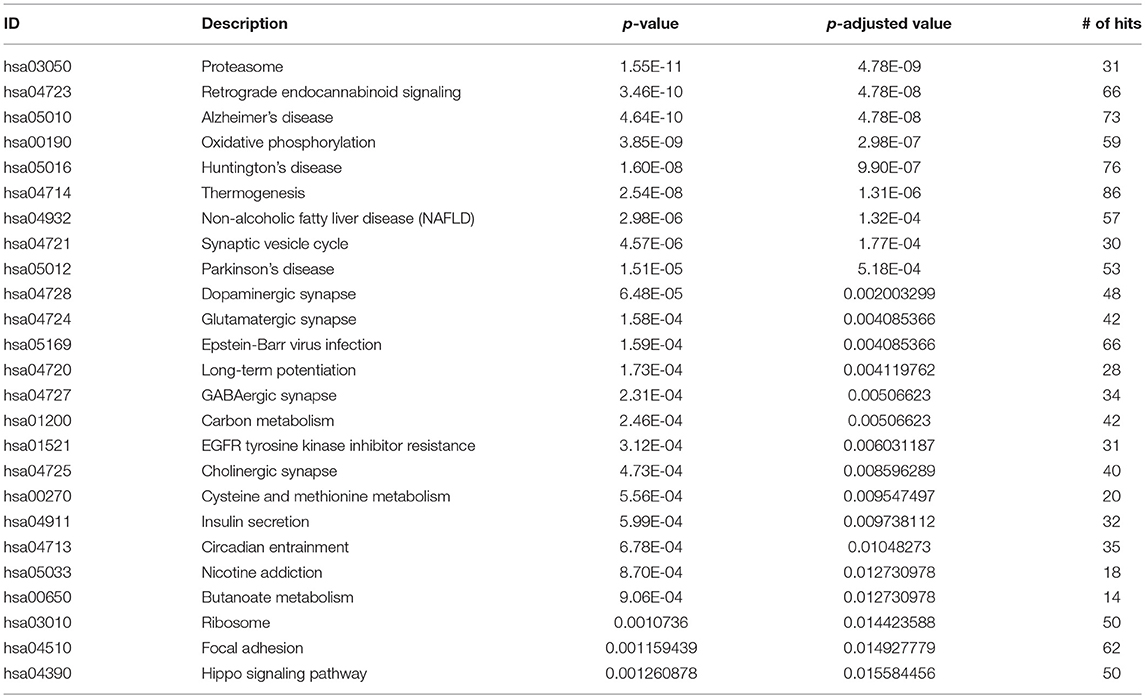
Table 3. Top 25 KEGG Pathways using differentially expressed genes.
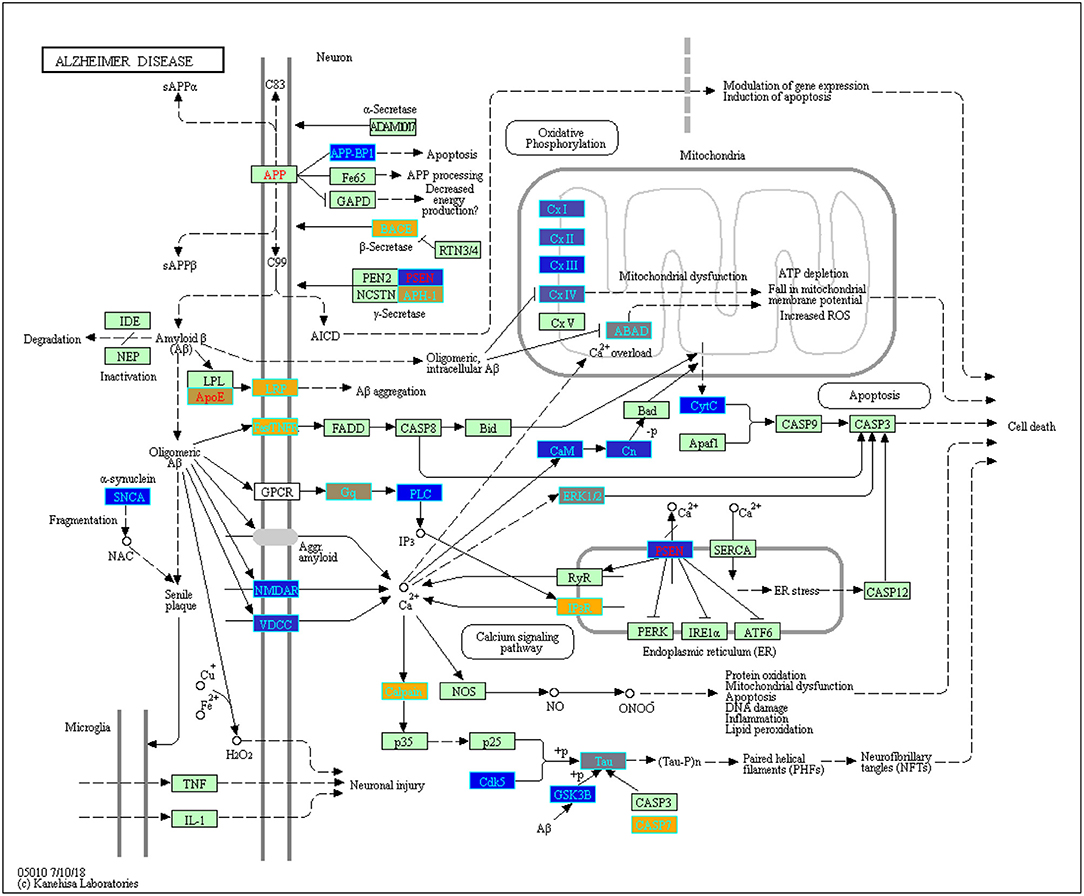
Figure 4. Enriched genes from the ANOVA statistically significant disease status gene list (p-value < 0.05) found in the KEGG Alzheimer's disease pathway (hsa05010) [Kanehisa and Goto, 2000; Kanehisa et al., 2016, 2017]. The yellow shading represents up-regulated and the blue shading represents down-regulated in AD samples. These genes were not yet filtered for biological significance.
3.3. Up and Down- Regulated Gene Expression in AD and Sex Specific Differences
We conducted a post-hoc analysis (TukeyHSD) on the 3,735 statistically significant disease genes to identify factorial differences and explore up- and down- regulation of genes. We were particularly interested in the control compared to AD gene expression differences, and how these could be further sub-categorized to explore effects by sex, age and tissue. We used a Bonferroni adjusted p-value cut off for significance (<0.000013) and the 10% two-tailed quantile to determine significantly up and down regulated genes (Table S2). In the Control-AD TukeyHSD comparisons, we found 352 statistically significant genes that we classified as up-regulated (176 DEG) and down-regulated (176 DEG) in AD subjects (or correspondingly up or down- regulated in controls) if their mean differences were ≤ −0.0945 and ≥ 0.1196, respectively (Table S2, see also ST8 of online Supplementary Datasheet). The top 25 up- and down- regulated genes sorted by the TukeyHSD adjusted p-values are outlined in Table 4 (Figure S4 and see ST8 of online Supplementary Datasheet). After performing gene enrichment and pathway analysis with the ReactomePA R package (Yu and He, 2016) on the 352 genes we built pathway-gene networks for the statistically significant Reactome pathways (Benjamini-Hochberg adjusted p < 0.05) (see ST13 and ST14 of online Supplementary Datasheet). Some of the top 10 enriched Reactome pathways from DEG down-regulated in AD include: Mitochondrial translation elongation, Mitochondrial translation, Transmission across chemical synapses, neuronal system (Figure 5 and Figure S5). The network in Figure 5 illustrates that some genes overlap across pathways—the difference of means from the TukeyHSD results of these genes are indicated by the color scale. The up-regulated genes in AD were enriched in pathways, such as Extracellular matrix (ECM) organization and ECM proteoglycans, Non-integrin membrane-ECM interactions and potassium channel activation (Figure 6 and Figure S6). Additionally, we used BINGO for GO analysis on the 352 disease DEG to determine the biological processes they are involved in Figure S7. Some examples of significant terms: Cell signaling development, nervous system development, neuron differentiation, cell proliferation, response to chemical stimulus, cell communication and brain and nervous system development (Figure S7).
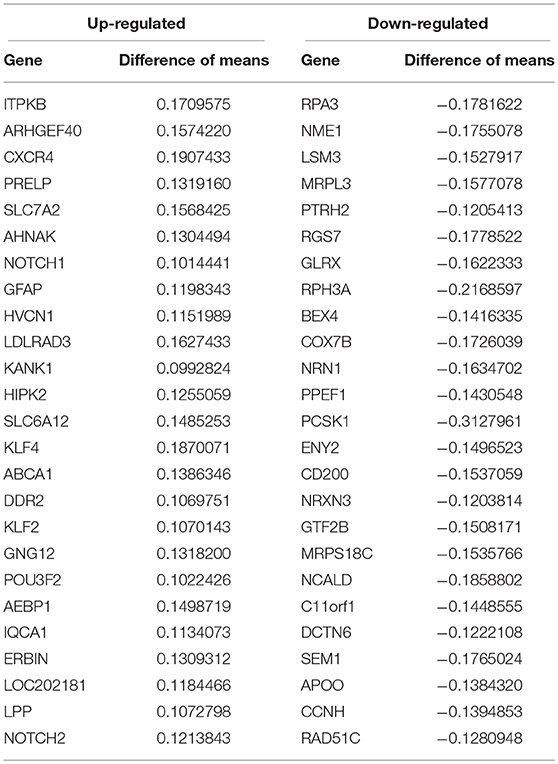
Table 4. Top 25 up- and down-regulated genes in Alzheimer's disease compared to healthy controls.
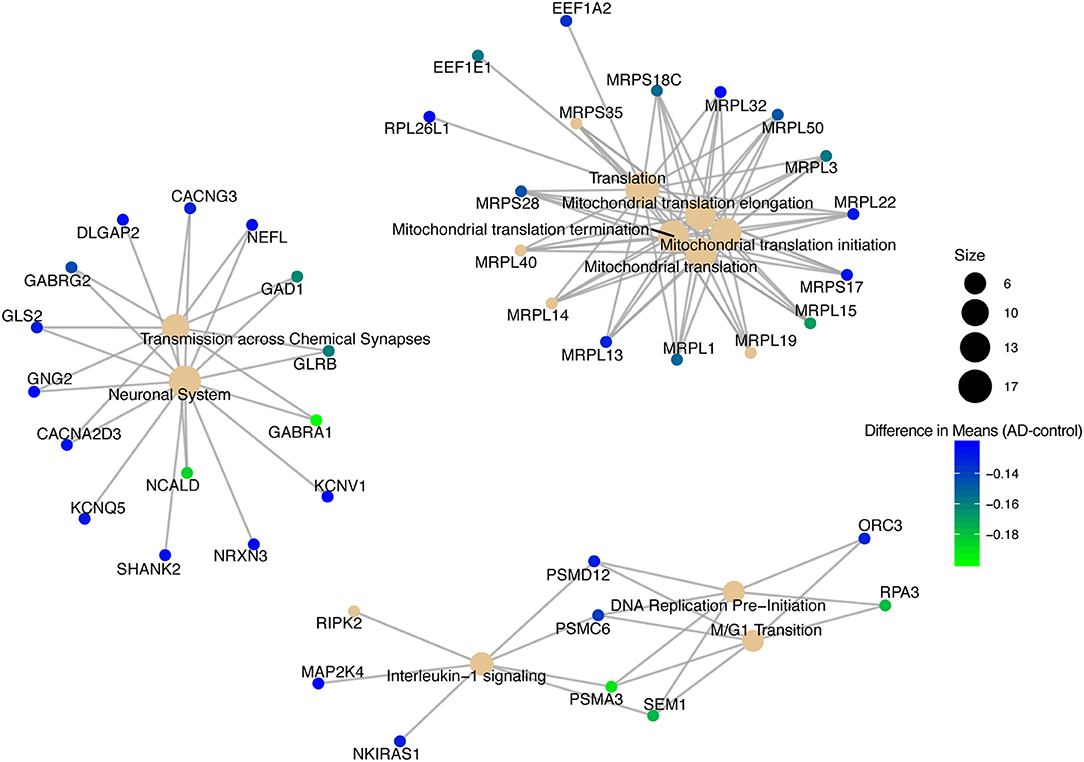
Figure 5. Pathway-gene network of top 10 enriched Reactome pathways from down-regulated genes in Alzheimer's disease patients.
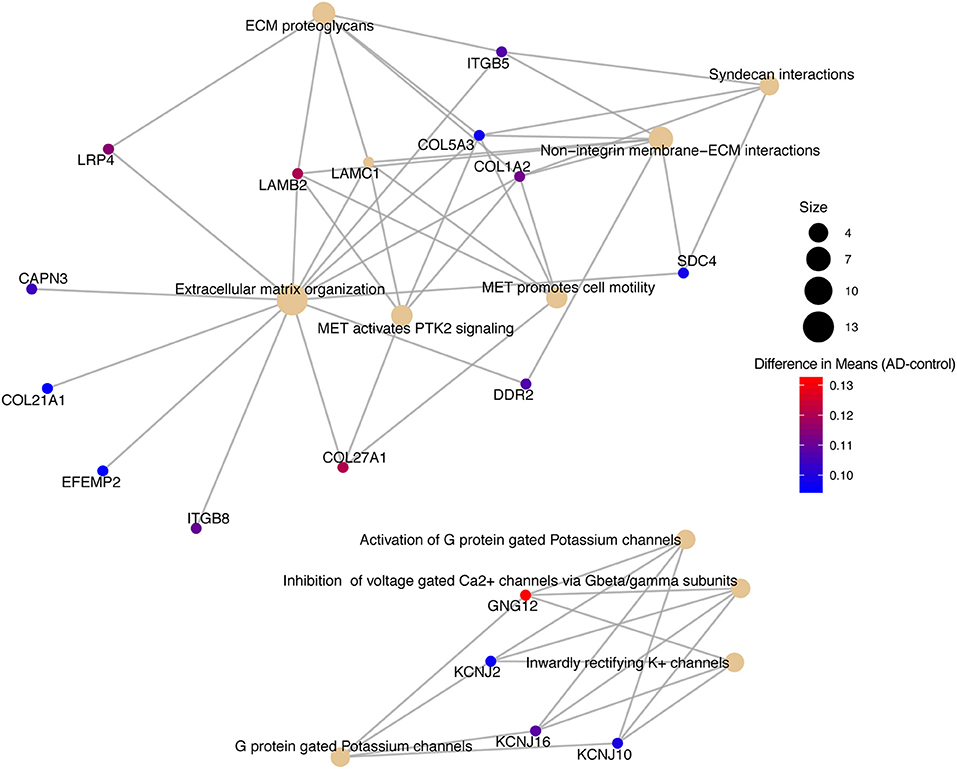
Figure 6. Pathway-gene network of top 10 enriched Reactome pathways from up-regulated genes in Alzheimer's disease patients.
Of the 352 DEG in the above disease analysis, 46 genes were differentially expressed by sex: 23 down- and 23 up-regulated in males compared to females (Table S2) based on mean differences (≤ −0.0864 and ≥ 0.2502 respectively) (Table S1). We used the ReactomePA package to build a network of enriched genes and pathways with sex differences (Figure S8) (Yu and He, 2016). We found 6 pathways that were enriched with the up-regulated gene list in males: Neuronal System, Transmission across chemical synapses, neurotransmitter receptors, and post-synaptic signal transmission, and GABA A receptor activation (Figure S8 and also see ST9 of online Supplementary Datasheet). Of these 46 genes that were differentially expressed by sex (Figure S9), we further filtered the ANOVA results to identify which of these genes showed statistically significant interactions with disease (sex:disease, Bonferroni corrected p < 0.05). We found one gene, chemokine receptor type 4 (CXCR4), to have a statistically significant pairwise interaction between disease status and sex (see ST4 of online Supplementary Datasheet).
3.4. Aging and Tissue Differences in AD Gene Expression
To determine if age or tissue had an effect on the DEG by disease status, we filtered the 352 DEG in disease results discussed above for age group and tissue comparisons. For age effects, we used our TukeyHSD results that compared age groups to <60 (served as the baseline). This allowed us to explore if genes associated with AD change with age by using a common reference group. We used the 352 DEG genes from disease status TukeyHSD results to find sizable age effects in this gene set by selecting for statistical significance and using the two-tailed 10% quantile filter (≤ −1.0477827 and ≥ 0.330869) to find significant DEG per age-group pair comparison (Table S2). We found 396 significant comparisons of age differences in 141 genes (see ST10 of online Supplementary Datasheet). The 141 genes were plotted across all age comparisons where <60 was the baseline to visualize expression changes and how the genes clustered (Figure S10), indicative of distinct differences in expression profiles due to aging. There is a cluster of genes down-regulated in older age groups, specifically ages 65–80 compared to those <60. There also appears to be an overall trend of genes associated with disease being up-regulated compared to <60. Of the 141 DEG by age group (Figure S10), we found 114 DEG that had a statistically significant interaction (Bonferroni corrected p < 0.05) between disease status and age (Figure 7). Changes in expression across each age group comparison (<60 baseline) in the interacting genes were visualized, and the genes clustered into 3 clear groups based on similarities in expression patterns (Figure S10).
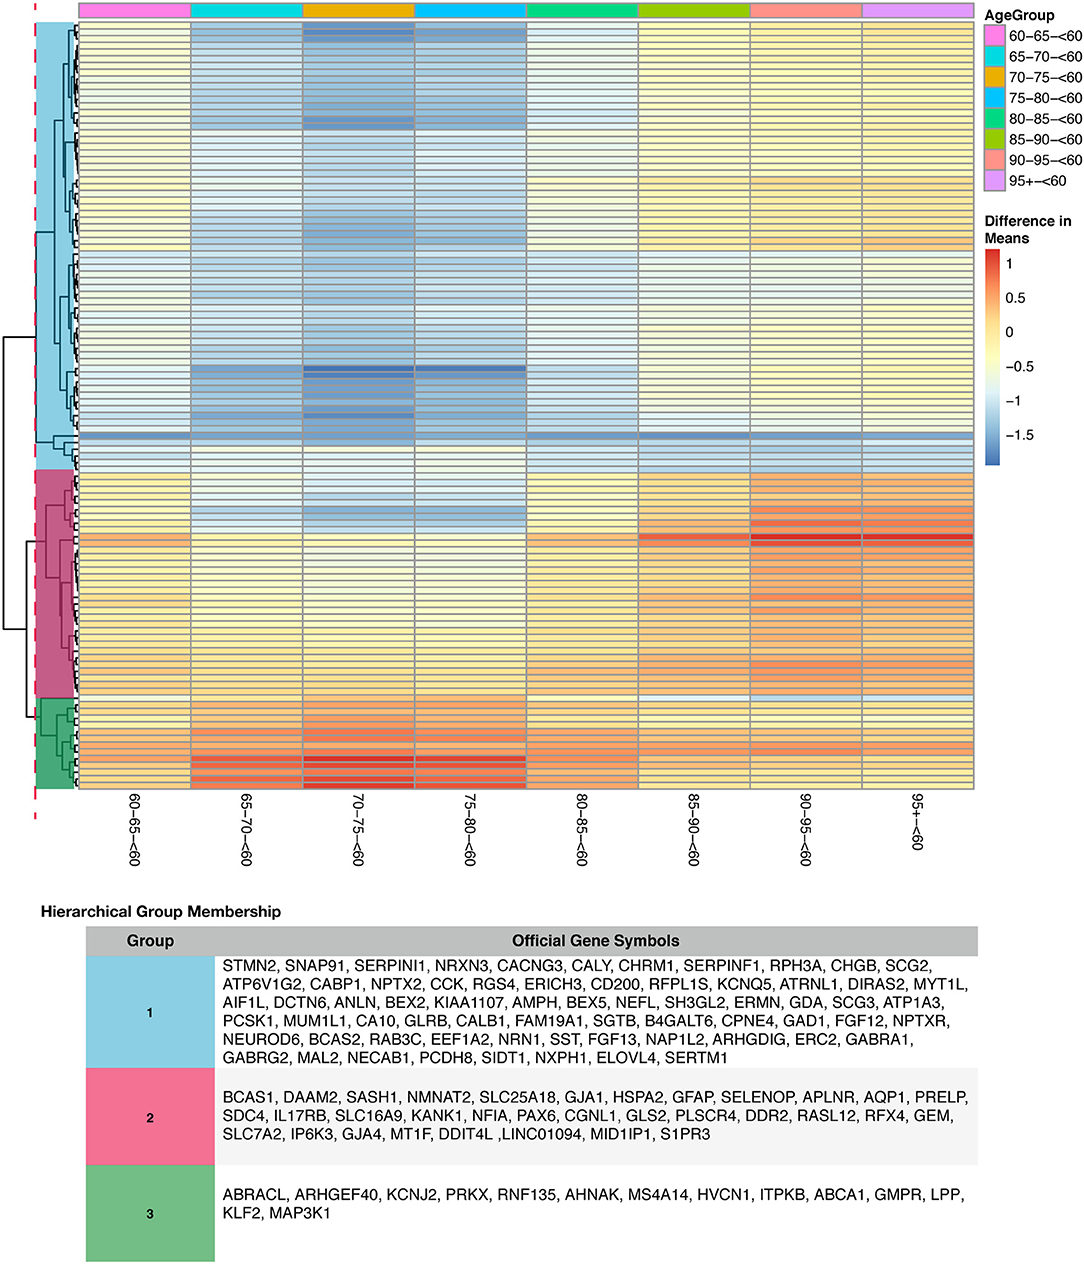
Figure 7. Heatmap with gene clustering to visualize age group effect (difference in means) on the differentially expressed disease (control-AD) gene list that have agegroup:disease status interaction.
For tissue effects, we used hippocampus as our baseline due to it being a known target of AD. In addition to filtering for significance, we used again a two-tailed 10% quantile filter ≤ −0.6359497 and ≥ 0.7932871 from the tissue-specific means differences between tissue types (Table S2). We found 167 comparisons with tissue differences (see ST11 of online Supplementary Datasheet) from 125 genes. Our heatmap of these genes show that differences do exist across tissues when compared to hippocampus (Figure S11). For example, nucleus accumbens has higher expression of genes compared to the hippocampus, and putamen has genes that are down-regulated compared to hippocampus (Figure S11). The majority of the expression differences appear to be found in nucleus accumbens and putamen (Figure S11, see also ST11 of online Supplementary Datasheet). From these 125 tissue specific (hippocampus) genes, we found 13 to have a statistically significant (Bonferroni corrected p < 0.05) interaction between disease and tissue (Figure 8A).
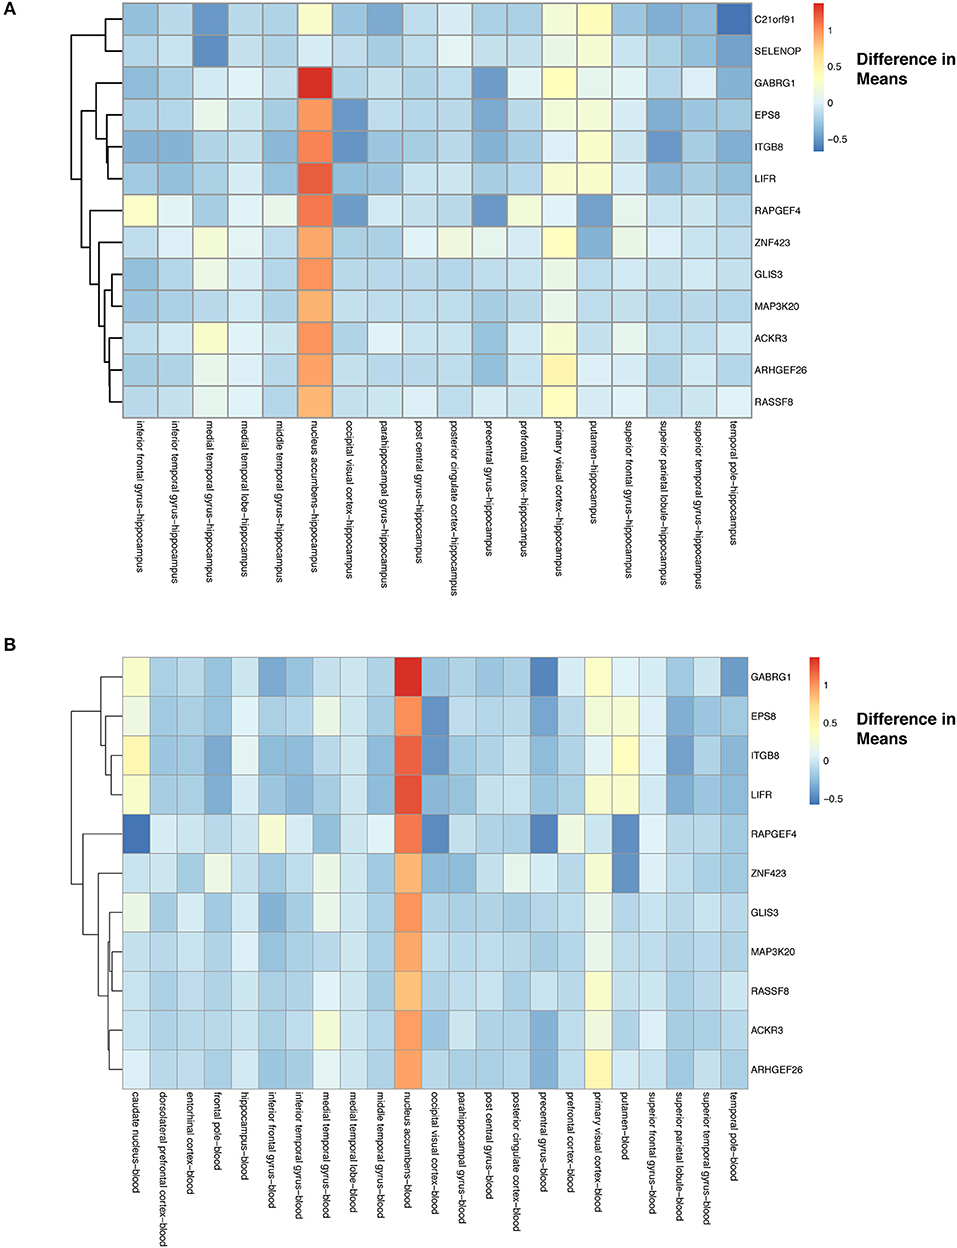
Figure 8. Heatmap with gene clustering to visualize tissue effect (difference in means) on the differentially expressed disease (control-AD) gene list that have tissue:disease status interaction. (A) Difference in means using hippocampus as the baseline. (B) Difference in means using blood as the baseline.
We also assessed how gene expression changes in a given tissue compared to blood (10 %quantile filter: ≤ −0.6359497 and ≥ 0.7932871) (Table S2), identifying 152 significant tissue comparisons in 115 genes (see ST12 of online Supplementary Datasheet). These 115 gene expression profiles across tissues are visualized using the differences of means in Figure S11. We again noticed similar trends in the blood comparisons as had in the hippocampus comparisons, with nucleus accumbens showing higher gene expression and putamen lowered expression compared to blood (Figure S12). Finally, we found that 11 of these genes had a statistically significant (Bonferroni corrected p-value < 0.05) interaction between disease and tissue (Figure 8B).
4. Discussion
As debilitating as Alzheimer's disease (AD) is, there is still no cure available, and diagnosis is not confidently confirmed until death. There are ongoing research efforts to find biomarkers and gene targets for early detection and intervention in AD. In our study, we investigated changes at the transcript level by conducting a meta-analysis to analyze eight microarray expression datasets for temporal changes in gene expression due to disease status. In addition to this, we determined if sex, age, or tissue type had an effect on gene expression changes in Alzheimer's associated disease genes. We pre-processed the eight datasets by background correction, data normalization, and probe annotation. Following this, the datasets were merged into a single dataset (by common gene name) for the meta-analysis. This is the first meta-analysis to explore over 20 different tissues and use a linear model to identify linear and binary effects on gene expression. Our linear model also adjusted batch effects by modeling for the study effect and included age in the model as a linear time series. Modeling with the study factor to account for batch effects was shown to be necessary after exploratory visualization of the expression data before and after combat batch effect correction using principal component analysis to remove variation within the data that was introduced due to different studies (Figures 2, 3).
4.1. Significant Gene Expression Differences Due to Disease Status and Biological Significance
We first identified statistically significant disease genes (p < 0.05; factor: disease status) from ANOVA (see ST4 of online Supplementary Datasheet), and these genes included: APOE, PSEN2, APOD, TREM2, CLU which all have been previously associated with AD. APOE and APOD are members of the apolipoprotein family that transport and metabolize lipids in the central nervous system and play a role in healthy brain function (Elliott et al., 2010). APOE is a strong, well documented, genetic risk factor for AD, and polymorphisms in APOE have been shown to affect age of AD onset (Masters et al., 2015). APOD's mechanism is still not completely understood (Elliott et al., 2010), PSEN2 encodes presenilin-2, an enzyme that cleaves APP, regulates production of Aβ, and mutations are associated with early onset (Masters et al., 2015). Mutations in CLU lead to lower white matter and increases AD risk (Braskie et al., 2011; Masters et al., 2015) and TREM2 was identified by a genome-wide association study (GWAS) as a disease variant and risk factor for AD (Masters et al., 2015). Our enrichment results of the 3,735 genes (from ANOVA) were interesting due to them having already been associated with AD in the literature (Table 3 and also see ST5, ST6 of online Supplementary Datasheet). For instance, mitochondrial dysfunction has been previously associated with AD and characterized to cause Aβ deposition, higher production of reactive oxygen species and lowered ATP production (Moreira et al., 2010; Onyango et al., 2016; Swerdlow, 2018). Researchers have also suggested that the immune system plays a role in AD (Heppner et al., 2015; Van Eldik et al., 2016). As for adaptive immune cells, their role in AD is still not clear, however, adaptive immune cells have been shown to reduce AD pathology (Marsh et al., 2016). The loss of B cell production can exacerbate the disease (Marsh et al., 2016). Neurodenegenerative diseases have also been described as having genes that overlap (Wang et al., 2017; Moradifard et al., 2018). Neurodegeneration is closely related to synaptic dysfunction and long term potentiation becomes impaired with age and synaptic dysfunction (Prieto et al., 2017). These results suggest that our meta-analysis is producing disease-related results (Table 3 and also see ST5, ST6 of online Supplementary Datasheet).
We also identified the KEGG AD pathway as one of our enriched pathways based on the 3,735 statistically significant disease genes. To explore how these genes are regulated in the AD pathway, we used the difference of means (using the TukeyHSD) to create (Figure 4) which highlights 73 of the 3,735 genes from our ANOVA analysis and their role in the KEGG AD pathway (see ST7 of online Supplementary Datasheet). NAE1, also known as amyloid precursor protein-binding protein 1 (APP-BP1), was down-regulated in AD subjects and is involved in neuronal apoptosis (Figure 4). The literature indicates that APP-BP1 is necessary for cell cycle progression and activates the neddylation pathway that drives apoptosis (Chen et al., 2000, 2003, 2007, 2012; Laifenfeld et al., 2007; Zhang et al., 2015). Down-regulation of APP-BP1 has been associated with increased APP while over expression of APP-BP1 leads to APP degradation (Chen et al., 2000, 2003, 2007, 2012; Laifenfeld et al., 2007; Zhang et al., 2015). TNFRSF6 was up-regulated in AD subjects (Figure 4, and this gene produces the Fas antigen which plays a role in mediating apoptosis (Feuk et al., 2000).
The KEGG AD pathway also highlights genes from our analysis that are involved in APP processing and cleavage (Figure 4). Specifically, BACE, PSEN, and APH-1 are all involved in APP processing by coding for γ-secretase and β-secretase (Figure 4). BACE is a β-secretase, that we found to be up-regulated in AD subjects compared to controls (Figure 4). This finding also supports previous reports that BACE is over-expressed in AD brains, and plays a role in forming Aβ (Vassar, 2004; Das and Yan, 2017). APH-1A and PSEN2 are a part of the γ-secretase complex that finalizes cleavage and release of APP to produce Aβ (Serneels et al., 2005; De Strooper and Annaert, 2010; Jurisch-Yaksi et al., 2013). As shown in Figure 4, in AD subjects there was a high production of APH-1 while PSEN2 was down-regulated. This indicates that while in a complex, the two genes may function differently. For example, mutations in PSEN2 can lead to memory loss and loss of synaptic plasticity (Saura et al., 2004). A better understanding of the mechanistic behavior of the γ-secretase complex genes can aid in the potential development of targeted therapeutics for γ-secretase. Also in the AD pathway we found up-regulated expression of APOE and LRP1 in AD subjects compared to control subjects (Figure 4). These genes are both involved in Aβ aggregation. LRP1 a known receptor of APOE and promotes Aβ aggregation and migration across blood-brain barriers (O'Callaghan et al., 2014).
As discussed above, mitochondrial dysfunction is a key hallmark of AD. Genes from our meta-analysis that are in the AD pathway are involved in the respiratory electron chain transport complexes. For example, NDUFC2 (in CxI on Figure 4), SDHA (in CxII on Figure 4), and COX5B, COX6A1, COX6C (in CxIV) are all necessary for electron transport, but were down-regulated in AD (Figure 4). In Figure 4, complexes I-IV of the electron chain transport were all down-regulated in AD. Previous work observed lower expression of 70% of genes that code for subunits of the electron transport chain (Liang et al., 2007). Reduced mitochondrial translation and lowered mRNA levels for genes, such as cytochrome oxidase (COX), can lead to increased oxidative stress, irregular calcium levels and decreased oxidative phosphorylation (OXPHOS) (Chandrasekaran et al., 1994, 1997; Parker et al., 1994; Markesbery, 1997; Liang et al., 2007; Bi et al., 2018). Hence, changes due to mitochondrial dysfunction may affect the pathology of neurodegenerative diseases, such as AD.
We also found ITPR3, a gene involved in the calcium signaling pathway, was up-regulated in AD (Figure 4). ITPR3 is necessary for the release of Ca2+ from the endoplasmic reticulum (Berridge, 2016). Increased expression of this gene and calcium concentrations can cause memory loss and neuron cell death (Figure 4) (Berridge, 2016). Additionally, we found genes involved in tau phosphorylation to be up-regulated in AD (Figure 4). Calpain (CAPN1, CAPN2) which is activated by elevated levels of cytostolic calcium is up-regulated as well as CASP7 (Ferreira, 2012). Together these genes regulate tau phosphorylation and the formation of neurofibrillary tangles, which eventually leads to neuronal cell death (Figure 4).
In addition to enrichment in the AD pathway, our KEGG results on the 3,735 genes included enrichment in Parkinson's disease and Huntington's disease pathways. Because of this we investigated if the three neurodegenerative disease signaling pathways had any common genes in our gene list (Table 3). We determined that AD had 49 genes that overlapped with Huntington's and 47 with Parkinson's pathways respectively. We also found that GNAQ, GRIN1, and PLCB1 are in both Huntington's and AD but not in Parkinson's pathways, and SNCA is in both Parkinson's and AD but not Huntington's pathways. In filtering the statistically significant disease genes for biological effect size (post-hoc analysis), PSEN2, APOE, TREM, CLU, and other apolipoproteins did not make the cutoff (based on their difference in means between the compared AD/healthy groups).
Focusing on the 352 DEG that had a sizable biological effect, the down-regulated genes in AD connect with the pathology of the disease (Figure 5). Specifically, genes in the Mitochondrial translation pathway that were down-regulated in AD included MRPL15, MPRL13, and MRPL1, which are all mitochondrial ribosomal proteins necessary for protein synthesis (Pearce et al., 2013; Stelzer et al., 2016; Fabregat et al., 2017). These genes may also be related to down-regulation of the mitochondrial electron transport chain complexes (Bonilla et al., 1999) in the KEGG AD pathway (Figure 4). Translational elongation factors (EEF1E1 and EEF1A2) were also down-regulated (Figure 5). Previous findings have indicated a reduction in EEF1A expression in AD patients specifically in the hippocampus (Beckelman et al., 2016). Genes down-regulated in the Neuronal System pathway and Transmission across Chemical Synapses included GABRA1, GABRG2, NCALD, GAD1, and NEFL (Figure 5). GABRA1 and GABRG2 are receptors in the gamma-aminobutyric acid (GABA) signaling system that bind to GABA (inhibitory neurotransmitter) and regulate chloride levels in the brain (Padgett and Slesinger, 2010; Calvo-Flores Guzmán et al., 2018). In AD, the GABA signaling system is dysregulated with changes in GABA expression in the hippocampus (Calvo-Flores Guzmán et al., 2018). NCALD is a calcium sensor that is involved in neuronal calcium signaling (Stelzer et al., 2016; Upadhyay et al., 2019). NEFL makes the protein neurofilament light chain (Nfl), which has recently been investigated as a fluid biomarker for monitoring AD disease progression (Preische et al., 2019). Our results also included down-regulated genes PSMA3, PSMC6, and SEM1 that are part of the proteasome complex (cell cycle progression and DNA damage repair) (Tanaka, 2009; Stelzer et al., 2016; Kolog Gulko et al., 2018) and replication factor protein, RPA3 (needed to stabilize single stranded DNA during DNA replication) (Lin et al., 1996; Stelzer et al., 2016), which are down-regulated in the DNA Replication Pre-Initiation and M/G1 Transition pathways. It has been reported that incomplete DNA replication and irregular cell cycle events, such as abnormal cell cycle reentry by neurons have been observed in AD brains and lead to cell death (Yurov et al., 2011). Additionally, dysregulation of the proteasome complex in AD is supported by the literature (Checler et al., 2000; Salon et al., 2003; Oh et al., 2005; Bonet-Costa et al., 2016). However, the role of the proteasome complex in AD and how it is regulated is still not clearly understood (Bonet-Costa et al., 2016), and merits further consideration.
Reactome pathway analysis on the up-regulated genes resulted in some interesting pathways, such as Extracellular Matrix (ECM) Organization, ECM proteoglycans, Mesenchymal Epithelial Transition (MET) activates PTK2 signaling, MET promotes cell motility, Non-integrin Membrane-ECM interactions and Syndecan Interactions, which all had overlapping genes (Figure 5). CAPN3, COL21A1, EFEMP2, and ITGB8 were only in the ECM organization pathway (Figure 6). COL21A1 has been described as being necessary for maintaining the integrity of the ECM, and has been previously found to be up-regulated in severe AD (Kong et al., 2009). Additionally, changes in the ECM components and degradation with proteases have previously been found to be associated with plaque formation, which causes brain dysfunction (Dauth et al., 2016; Sethi and Zaia, 2017; Sonbol, 2018). The up-regulated genes in the potassium and Ca2+ channel pathways included GNG12, KCNJ2, KCNJ16, and KCNJ10. In general, as potassium channels open to increase potassium in the cells, calcium is decreased by inhibiting the Ca2+ gated channels (Padgett and Slesinger, 2010). Increased activity of the potassium channels, especially the voltage-gated channels have been associated with regulating microglia function and priming which in turn leads to increased ROS production in AD (Rangaraju et al., 2015; Thei et al., 2018).
We compared the 352 genes identified as differentially expressed and exhibiting a biological effect with respect to disease status to a recently published meta-analysis in which 1400 differentially expressed disease genes were identified (Moradifard et al., 2018). We determined that 136 DEG from our gene list overlapped with Moradifard et al.'s findings., and 216 of our DEG were not in their list (Moradifard et al., 2018). Genes that were unique to our DEG list included GMPR, ABCA1, NOTCH1 and 2, GABRG1, HVCN1, CXCR4, HIP1, MRPS28, FOS.
The top up-regulated gene in AD from our meta-analysis, ITPKB (Table 4) has previously been observed to have over-expression in AD subjects. In a mouse model, the gene was found to be over-expressed and connected to apoptosis, increased (Aβ) production and tau phosphorylation (Stygelbout et al., 2014). Additional DEG included CXCR4 (brain development and neuronal cell survival in the hippocampus) (Stelzer et al., 2016; Li and Wang, 2017), AHNAK (may have a role in development of neuronal cells) (Gentil et al., 2005; Stelzer et al., 2016), NOTCH1,and NOTCH2 (signaling pathway may be involved in brain development) (Ables et al., 2011; Stelzer et al., 2016) which were all up-regulated in AD subjects (Table 4). On the other hand, RPA3 (DNA replication), NME1 (neural development) (Owlanj et al., 2012; Stelzer et al., 2016), and mitochondrial proteins MRPL3, MRPS18C (associated with mitochondrial dysfunction observed in AD) were down-regulated in AD samples (Table 4).
4.2. Sex, Age, and Tissue Effect on Disease Status Biologically Significant Genes
For the sex factor, we determined that 46 of our DEG (23 up- and down-regulated in males compared to females) had a sex effect, with 1 of them (CXCR4) showing a statistically significant (p-value < 0.05) interaction between disease status and sex. The enriched pathways from the up-regulated genes (prior to selecting for interacting genes) in males are highlighted in Figure S8. Furthermore, these genes involved in pathways, such as Clathrin-mediated endocytosis (SNAP91, SH3GL2, and AMPH), Neuronal System, Neurotransmitter receptors postsynaptic transmission and Transmission across Chemical Synapses (GABRG2, GABRA1, GAD1, and NEFL) were down-regulated in females (Figure S8 and Table S3). Down-regulation in genes, such as GABRG2, GABRA1, GAD1, and NEFL) was previously discussed as being down-regulated in AD from our DEG list for disease status (Figure 5).
Additionally, the current literature indicates that women are at higher risk for AD (Seshadri et al., 1997; Vina and Lloret, 2010; Podcasy and Epperson, 2016). This increased risk by sex is due to the loss of estrogen protection (due to menopause) against (Aβ)'s toxicity on the mitochondria (Vina and Lloret, 2010; Podcasy and Epperson, 2016). Older women produce more reactive oxygen species with the decline in estrogen levels (Vina and Lloret, 2010; Podcasy and Epperson, 2016). Estrogen replacement therapy is a treatment for AD, and it is being determined that estrogen works by increasing the expression of antioxidant genes (Vina and Lloret, 2010; Podcasy and Epperson, 2016). A recently published meta-analysis also explored sex effects on AD gene expression (Moradifard et al., 2018). Moradifard et al., found male and female specific AD associated genes and genes that overlapped in both sexes (Moradifard et al., 2018). Of the 46 disease associated genes we found to be affected by sex, 22 were found in both males and females, 9 only in males, and 5 only in females in Moradifard et al gene list. Ten of our sex impacted disease genes (CYBRD1, DIRAS2, FAM107B, FOS, GMPR, HVCN1, ITIH5, MAPK, RNF135, SLC40A1) did not overlap with their findings, and these genes have been previously associated with oxidative stress, cell signaling and transport, apoptosis and AD. For instance, GMPR was found to gradually increase as AD progressed (Liu et al., 2018). It produces GMPR1 which is associated with the phosphorylation of tau (Liu et al., 2018).
Focusing on the statistically significant pairwise interaction between disease status and sex, we identified CXCR4 which was up-regulated in females (Table S3). CXCR4 was also up-regulated in AD (Table 4). CXCR4 has been previously investigated for its role in AD and other neurodegenerative diseases (Bezzi et al., 2001; Li and Wang, 2017; Bonham et al., 2018). CXCR4 is a chemokine receptor that binds to CXCL12, and together they are involved in signaling pathways for inflammation and neuronal system function (Bezzi et al., 2001; Li and Wang, 2017; Bonham et al., 2018). CXCR4/CXCL12 together regulate synaptic plasticity, apoptosis, calcium levels, microglia to neuron communication, neuronal signaling and neuroinflammation (Bezzi et al., 2001; Li and Wang, 2017; Bonham et al., 2018). Dysregulation of CXCR4 has been associated with neurodegenerative diseases (Li and Wang, 2017; Bonham et al., 2018). More specifically, up-regulation of CXCR4 in in a mouse model led to abnormal signaling in microglia and tauopathy (Bonham et al., 2018).
Aging trends on the differentially expressed disease genes were visualized in Figure S10 and Figure 7. Subjects grouped as <60 were used as a baseline because on average, AD symptoms start at ages 65 and older (Masters et al., 2015). We observed clear age-related patterns when looking at the difference of means between age cohorts (prior to selecting for interacting genes) for the disease gene list (Figure S10 and see ST10 of online Supplementary Datasheet). Highlighting a few of the changes: SNAP91 which is involved in synaptic transmission and associated with late onset (Zhang et al., 2013), STMN2 which is necessary for microtubule dynamics and neuronal growth (Antonsson et al., 1998; Chiellini et al., 2008), and SST, a neuropeptide that interacts with (Aβ) and can influence how it aggregates (Hama and Saido, 2005; Solarski et al., 2018) were all up-regulated in <60 age group (Figure S10 and see ST8 of online Supplementary Datasheet). Also, STMN2 and SST have both previously been associated with expression reduction due to age(Stelzer et al., 2016; Solarski et al., 2018). ABCA1, GMPR, HVCN1, ITPKB, NOTCH1 all had higher expression in older age groups compared to the baseline.
Furthermore, visualizing the genes with a statistically significant interaction (p-value < 0.05) between disease and age group, we observed three distinct groups of genes with similar patterns (Figure 7). Genes identified in group 1 in Figure 7 were down-regulated in ages 65–80 compared to the baseline (<60 years old). Group 1 genes also displayed a slight increase in relative expression from ages 85 and higher (Figure 7). Reactome pathway analysis on the group 1 genes identified 3 enriched pathways that were statistically significant (FDR < 0.05): (i) MECP2 regulates transcription of genes involved in GABA signaling (GAD1) (He et al., 2014; Fabregat et al., 2017), (ii) Muscarinic acetylcholine receptors (CHRM1) (Ishii and Kurachi, 2006; Fabregat et al., 2017) and (iii) Neuronal System (CACNG3, GAD1, NEFL, GABRA1, GLRB, NRXN3, GABRG2, and KCNQ2) (Purves D, 2001; Fabregat et al., 2017). Changes in GABA signaling in AD was previously characterized as age-dependent (Limon et al., 2012). The ionic response to GABA, also reported as GABA currents, were reduced in AD, especially in younger subjects with AD (Limon et al., 2012). We observe a similar pattern in our meta-analysis for the GABA receptor genes in group 1 (Figure 7). Genes within group 2 displayed a gradual increase in expression with age (Figure 7). Reactome pathway analysis did not identify statistically significant enrichment for these genes. However, genes in group 2 include DDR2 (regulates TREM2, microglia and neurotoxic proteins) (Hebron et al., 2017), IP6K3 (Inositol phosphate metabolism) (Crocco et al., 2016), and GJA1 (regulates known AD risk factor genes) (Kajiwara et al., 2018). Additionally, genes in group 3 exhibited significant up-regulation in gene expression for subjects 65–80 years with a gradual decrease in expression from ages 85 and older (Figure 7). These genes are associated with the statistically significant enriched pathway (FDR < 0.05), TRAF6 mediated NF-kB activation (MAP3K1) (Yoshida et al., 2008; Fabregat et al., 2017). Our findings highlight genes previously associated with AD and their temporal trends, and also some additional genes that experience age-effects (Figure 7 and Figure S10, and see ST10 of online Supplementary Datasheet).
To investigate tissue-specific effects (prior to selecting for statistically significant pairwise interactions between tissue and disease status), we used hippocampus (232 samples) as a baseline due to it being identified as one of the first regions to be affected by AD (Masters et al., 2015). We also used blood (519 samples) as a baseline to explore an underdeveloped non-invasive approach to monitoring AD. In both analyses, we saw similar trends with the nucleus accumbens (51 samples) and putamen (52 samples) showing greater differences in expression (Figures S11, 12). Focusing on the genes that showed a statistically significant interaction between disease and tissue, we observed lower expression of genes in tissues compared to the hippocampus and blood with a slight increase in the primary visual cortex and the putamen (Figure 8). As for the nucleus accumbens we observed significantly higher expression for these interacting genes for both hippocampus and blood baseline comparisons (Figure 8). The statistically significant (p-value < 0.05) interacting genes in Figure 8 include genes that are involved in development of dendritic spines (C21orf91), normal brain function (SELENOP), GABA signaling (GABRG1), and structure of actin cytoskeleton (EPS8) (Menna et al., 2015; Pitts et al., 2015; Li et al., 2016; Stelzer et al., 2016; Calvo-Flores Guzmán et al., 2018). In addition to the shrinking of the hippocampus, decreases in volumes for nucleus accumbens and the putamen have also been reported (de Jong et al., 2008; Nie et al., 2017). The nucleus accumbens is important for reward processing, and in AD has been associated to impaired decision making and reduction in performance of rewarding behaviors (Nobili et al., 2017). AD is also associated with reduced dopamine levels and GABA signaling (Martorana and Koch, 2014). Finally, the putamen (motor behaviors) and primary visual cortex (visual processing) both have impaired functions in AD (Halabi et al., 2013; Brewer and Barton, 2014).
The distribution of samples per tissue type was inconsistent with hippocampus and blood having larger number of samples compared to an average of around 55 samples per tissue in other categories. These results show the potential of blood and other tissues for monitoring gene expression changes in AD, but also the need for further focused mechanistic studies in different tissues.
4.3. Limitations of the Study
Using publicly available data introduced limitations to our research design. Lack of uniform annotation and missing information across datasets can make conducting a meta-analysis on multiple datasets challenging. For example the subclass of AD, details on cognitive status and APOE genotype were not uniformly reported across the datasets used (Table S1). The brain samples were from a variety of brain banks with varying institutional review boards and standards, protocols and criteria for AD diagnosis requirements (Table S1). Additionally, the number of datasets used in our meta-analysis was limited by poor annotations that could not meet our selection criteria, and this in turn placed bounds to our sample size and power of the study. Our analysis was also unbalanced: 2,088 samples made up of 771 healthy controls, 868 AD subjects, 449 subjects reported as possibly having AD, 1308 females and 780 males, and the breakdown of age groups is also somewhat uneven. One of our datasets (GSE84422) consisted of paired samples. However, as the the other datasets did not include paired samples, we did not incorporate a paired-sample analysis in our study. The available public data used for our meta-analysis also lacked diversity in samples, because in most datasets race and ethnicity are not reported. This information would be helpful particularly since AD has been reported by the CDC to be more prevalent in African Americans (Steenland et al., 2016; Centers for Disease Control and Prevention, 2018). In addition, the use of micro-array expression data for meta-analysis is a limitation in terms of not being able to query the entire transcriptome or query novel genes. Also, in our merged dataset, large variability was introduced in data due to the large number of tissues (26) and methods used for extractions (study effect), which we attempted to correct for by utilizing both as factors in our model, and including binary interaction terms as well. An additional limitation of our study is that we included datasets that investigated gene expression changes in bulk tissue rather than on the cell-type-specific level. Cell-type-specific expression data that matched our inclusion criteria were not available to include in this meta-analysis. Furthermore, single-cell data is also only recently becoming available. A meta-analysis including single-cell analysis expression data from specific cell types, such as neurons, astrocytes and microglia would allow an improved understanding of gene expression differences between AD and healthy controls (Wang and Bodovitz, 2010; Stuart and Satija, 2019). Finally, to our knowledge, there were also a limited number of RNA-sequencing (RNA-seq) datasets on GEO and Array Express (23), and only one that matched our selection criteria. Thus, we elected to carry out the analysis using the gene expression array data. We anticipate that more RNA-seq data, which can provide a more global view of the transcriptome, will become available in the future.
4.4. Future Directions and Recommendations
Our study provides gene lists by factor (disease status, sex, age, and tissue) of differentially expressed genes. Our study is largely descriptive, but also yields new gene candidates which we may be studied further for their role in AD, including underlying mechanisms using model systems. To expand on this research, the use of RNA-seq data can reveal novel differentially expressed genes, biomarkers and gene targets for AD. As more RNA-seq data becomes available, a similar meta-analysis approach may be applied, if such data are annotated to include the necessary factors' metadata for the analysis. In addition to RNA-seq, implementing other omics technologies, such as proteomics and metabolomics can help to fully describe the pathology of AD, and identify additional biomarkers for early detection. To promote more meta-analyses, we recommend that future studies include more extensive, and structured standardized metadata in their submissions, that will enable use of data. Including data with racial diversity is also necessary. AD has higher prevalence in African Americans (Steenland et al., 2016). Due to reports of racial differences in AD, with an AD prevalence breakdown of: 14% of African American population compared to 12% in Hispanics and 10% in whites (Centers for Disease Control and Prevention, 2018), including racial diversity in future studies would help identify this potential variability in susceptibility and identify if certain treatments might be better suited in some races than others. Improving the representation of races in clinical trials and molecular reports of AD can help with health disparities within the field. Exploring the use of easily accessible tissues, such as blood, to monitor changes in target genes/biomarkers might also prove helpful for early detection and provide a more systems-level understanding of AD. Determining the best or novel biomarkers to track for AD requires exploring also mechanistic aspects of the disease. For example, monitoring exosomes and autoantibodies which can be connected to the dysfunction of the immune system is one mode of action that is being associated with AD (O'Bryant, 2016). Lastly, as omics technologies advance, implementing personalized omics for early detection and treatment may prove useful in improving individual AD outcomes with the increase in the aging population.
Author Contributions
All authors listed have made a substantial, direct and intellectual contribution to the work, and approved it for publication.
Funding
LB is funded through a Bertina Wentworth Endowed Summer Fellowship and the University Enrichment Fellowship at Michigan State University. GM is funded by Jean P. Schultz Endowed Biomedical Research Fund and previously R00 HG007065.
Conflict of Interest Statement
GM has consulted for Colgate-Palmolive. LB declares the absence of any commercial or financial relationships that could be construed as a potential conflict of interest.
Acknowledgments
An early version of this work was presented at the 2018 American Society of Human Genetics Annual Conference in San Diego abstract # 1369T.
Supplementary Material
The Supplementary Material for this article can be found online at: https://www.frontiersin.org/articles/10.3389/fnins.2019.00392/full#supplementary-material
Supplementary Datasheet. Our supplemental figures and tables are provided in the accompanying supplementary data pdf file. All of our datasets/results from our meta-analysis pipeline have been uploaded to FigShare as online supplemental data, as described below (the corresponding online file names begin with a prefix “ST” and are enumerated as also referred to in the manuscript). The datasets generated and analyzed for this study can be found in Figshare's online digital repository at https://doi.org/10.6084/m9.figshare.7435469.
References
Ables, J. L., Breunig, J. J., Eisch, A. J., and Rakic, P. (2011). Not(ch) just development: notch signalling in the adult brain. Nat. Rev. Neurosci. 12, 269–283. doi: 10.1038/nrn3024
Antonsson, B., Kassel, D. B., Di Paolo, G., Lutjens, R., Riederer, B. M., and Grenningloh, G. (1998). Identification of in vitro phosphorylation sites in the growth cone protein scg10. effect of phosphorylation site mutants on microtubule-destabilizing activity. J. Biol. Chem. 273, 8439–46. Available online at: https://www.ncbi.nlm.nih.gov/pubmed/9525956 (accessed November 10, 2018).
Beckelman, B. C., Zhou, X., Keene, C. D., and Ma, T. (2016). Impaired eukaryotic elongation factor 1a expression in alzheimer's disease. Neurodegen. Dis. 16, 39–43. doi: 10.1159/000438925
Berchtold, N. C., Cribbs, D. H., Coleman, P. D., Rogers, J., Head, E., Kim, R., et al. (2008). Gene expression changes in the course of normal brain aging are sexually dimorphic. Proc. Natl. Acad. Sci. U.S.A. 105, 15605–15610. doi: 10.1073/pnas.0806883105
Berridge, M. J. (2016). The inositol trisphosphate/calcium signaling pathway in health and disease. Physiol. Rev. 96, 1261–1296. doi: 10.1152/physrev.00006.2016
Bezzi, P., Domercq, M., Brambilla, L., Galli, R., Schols, D., De Clercq, E., et al. (2001). Cxcr4-activated astrocyte glutamate release via tnf: amplification by microglia triggers neurotoxicity. Nat. Neurosci. 4, 702–710. doi: 10.1038/89490
Bi, R., Zhang, W., Zhang, D.-F., Xu, M., Fan, Y., Hu, Q.-X., et al. (2018). Genetic association of the cytochrome c oxidase-related genes with Alzheimer's disease in han chinese. Neuropsychopharmacology. 43:2264. doi: 10.1038/s41386-018-0144-3
Black, S., De Gregorio, E., and Rappuoli, R. (2015). Developing vaccines for an aging population. Sci. Transl. Med. 7, 281ps8. doi: 10.1126/scitranslmed.aaa0722
Blalock, E. M., Buechel, H. M., Popovic, J., Geddes, J. W., and Landfield, P. W. (2011). Microarray analyses of laser-captured hippocampus reveal distinct gray and white matter signatures associated with incipient Alzheimer's disease. J. Chem. Neuroanat. 42, 118–126. doi: 10.1016/j.jchemneu.2011.06.007
Bland, J. M., and Altman, D. G. (1995). Multiple significance tests: the bonferroni method. BMJ. 310:170.
Bonet-Costa, V., Pomatto, L. C.-D., and Davies, K. J. A. (2016). The proteasome and oxidative stress in alzheimer's disease. Antioxid. Redox Signal. 25, 886–901. doi: 10.1089/ars.2016.6802
Bonham, L. W., Karch, C. M., Fan, C. C., Tan, C., Geier, E. G., Wang, Y., et al. (2018). Cxcr4 involvement in neurodegenerative diseases. Transl. Psychiatry. 8:73. doi: 10.1038/s41398-017-0049-7
Bonilla, E., Tanji, K., Hirano, M., Vu, T. H., DiMauro, S., and Schon, E. A. (1999). Mitochondrial involvement in alzheimer's disease. Biochim. Biophys. Acta. 1410, 171–182. doi: 10.1016/S0005-2728(98)00165-0
Braskie, M. N., Jahanshad, N., Stein, J. L., Barysheva, M., McMahon, K. L., de Zubicaray, G. I., et al. (2011). Common Alzheimer's disease risk variant within the clu gene affects white matter microstructure in young adults. J. Neurosci. 31, 6764–6770. doi: 10.1523/JNEUROSCI.5794-10.2011
Brazma, A., Parkinson, H., Sarkans, U., Shojatalab, M., Vilo, J., Abeygunawardena, N., et al. (2003). Arrayexpressa public repository for microarray gene expression data at the ebi. Nucleic Acids Res. 31, 68–71. doi: 10.1093/nar/gkg091
Brewer, A. A., and Barton, B. (2014). Visual cortex in aging and Alzheimer's disease: changes in visual field maps and population receptive fields. Front. Psychol. 5:74. doi: 10.3389/fpsyg.2014.00074
Bronner, I. F., Bochdanovits, Z., Rizzu, P., Kamphorst, W., Ravid, R., van Swieten, J. C., et al. (2009). Comprehensive mrna expression profiling distinguishes tauopathies and identifies shared molecular pathways. PLoS ONE. 4:e6826. doi: 10.1371/journal.pone.0006826
Brookmeyer, R., Abdalla, N., Kawas, C. H., and Corrada, M. M. (2018). Forecasting the prevalence of preclinical and clinical Alzheimer's disease in the United States. Alzheimers Dement. 14, 121–129. doi: 10.1016/j.jalz.2017.10.009
Calvo-Flores Guzmán, B., Vinnakota, C., Govindpani, K., Waldvogel, H. J., Faull, R. L., and Kwakowsky, A. (2018). The gabaergic system as a therapeutic target for Alzheimer's disease. J. Neurochem. 146, 649–669. doi: 10.1111/jnc.14345
Centers for Disease Control and Prevention (2018). U.S. burden of Alzheimer's disease, related dementias to double by 2060. Available online at: https://www.cdc.gov/media/releases/2018/p0920-alzheimers-burden-double-2060.html (accessed December 01, 2018).
Chandrasekaran, K., Giordano, T., Brady, D. R., Stoll, J., Martin, L. J., and Rapoport, S. I. (1994). Impairment in mitochondrial cytochrome oxidase gene expression in alzheimer disease. Mol. Brain Res. 24, 336–340.
Chandrasekaran, K., Hatanpää, K., Rapoport, S. I., and Brady, D. R. (1997). Decreased expression of nuclear and mitochondrial dna-encoded genes of oxidative phosphorylation in association neocortex in alzheimer disease. Mol. Brain Res. 44, 99–104.
Checler, F., da Costa, C. A., Ancolio, K., Chevallier, N., Lopez-Perez, E., and Marambaud, P. (2000). Role of the proteasome in Alzheimer's disease. Biochim. Biophys. Acta. 1502, 133–138.
Chen, Y., Bodles, A. M., McPhie, D. L., Neve, R. L., Mrak, R. E., and Griffin, W. S. T. (2007). App-bp1 inhibits aβ42 levels by interacting with presenilin-1. Mol. Neurodegen. 2:3. doi: 10.1186/1750-1326-2-3
Chen, Y., Liu, W., McPhie, D. L., Hassinger, L., and Neve, R. L. (2003). App-bp1 mediates app-induced apoptosis and DNA synthesis and is increased in Alzheimer's disease brain. J. Cell. Biol. 163, 27–33. doi: 10.1083/jcb.200304003
Chen, Y., McPhie, D. L., Hirschberg, J., and Neve, R. L. (2000). The amyloid precursor protein-binding protein app-bp1 drives the cell cycle through the sm checkpoint and causes apoptosis in neurons. J. Biol. Chem. 275, 8929–8935. doi: 10.1074/jbc.275.12.8929
Chen, Y., Neve, R. L., and Liu, H. (2012). Neddylation dysfunction in alzheimer's disease. J. Cell. Mol. Med. 16, 2583–2591. doi: 10.1111/j.1582-4934.2012.01604.x
Chiellini, C., Grenningloh, G., Cochet, O., Scheideler, M., Trajanoski, Z., Ailhaud, G., et al. (2008). Stathmin-like 2, a developmentally-associated neuronal marker, is expressed and modulated during osteogenesis of human mesenchymal stem cells. Biochem. Biophys. Res. Commun. 374, 64–8. doi: 10.1016/j.bbrc.2008.06.121
Childs, B. G., Durik, M., Baker, D. J., and Van Deursen, J. M. (2015). Cellular senescence in aging and age-related disease: from mechanisms to therapy. Nat. Med. 21:1424. doi: 10.1038/nm.4000
Crocco, P., Saiardi, A., Wilson, M. S., Maletta, R., Bruni, A. C., Passarino, G., et al. (2016). Contribution of polymorphic variation of inositol hexakisphosphate kinase 3 (ip6k3) gene promoter to the susceptibility to late onset Alzheimer's disease. Biochim. Biophys. Acta. 1862, 1766–1773. doi: 10.1016/j.bbadis.2016.06.014
Dallmeyer, S., Wicker, P., and Breuer, C. (2017). How an aging society affects the economic costs of inactivity in germany: empirical evidence and projections. Eur. Rev. Aging Phys. Activity. 14:18. doi: 10.1186/s11556-017-0187-1
Das, B., and Yan, R. (2017). Role of bace1 in Alzheimer's synaptic function. Transl. Neurodegen. 6:23. doi: 10.1186/s40035-017-0093-5
Dauth, S., Grevesse, T., Pantazopoulos, H., Campbell, P. H., Maoz, B. M., Berretta, S., et al. (2016). Extracellular matrix protein expression is brain region dependent. J. Comp. Neurol. 524, 1309–1336. doi: 10.1002/cne.23965
De Jager, P. L., Ma, Y., McCabe, C., Xu, J., Vardarajan, B. N., Felsky, D., et al. (2018). A multi-omic atlas of the human frontal cortex for aging and Alzheimer's disease research. Sci. Data. 5:180142. doi: 10.1038/sdata.2018.142
de Jong, L. W., van der Hiele, K., Veer, I. M., Houwing, J. J., Westendorp, R. G. J., Bollen, E. L. E. M., et al. (2008). Strongly reduced volumes of putamen and thalamus in alzheimer's disease: an mri study. Brain. 131, 3277–3285. doi: 10.1093/brain/awn278
De Strooper, B., and Annaert, W. (2010). Novel research horizons for presenilins and γ-secretases in cell biology and disease. Annu. Rev. Cell Dev. Biol. 26, 235–260. doi: 10.1146/annurev-cellbio-100109-104117
Drayer, B. P. (1988). Imaging of the aging brain. Radiology. 166, 785–796. doi: 10.1148/radiology.166.3.3277247
Edgar, R., Domrachev, M., and Lash, A. E. (2002). Gene expression omnibus: Ncbi gene expression and hybridization array data repository. Nucleic Acids Res. 30, 207–210. doi: 10.1093/nar/30.1.207
Elliott, D. A., Weickert, C. S., and Garner, B. (2010). Apolipoproteins in the brain: implications for neurological and psychiatric disorders. Clin. Lipidol. 51, 555–573. doi: 10.2217/clp.10.37
Fabregat, A., Jupe, S., Matthews, L., Sidiropoulos, K., Gillespie, M., Garapati, P., et al. (2017). The reactome pathway knowledgebase. Nucleic Acids Res. 46, D649–D655. doi: 10.1093/nar/gkx1132
Ferreira, A. (2012). Calpain dysregulation in Alzheimer's disease. ISRN Biochem. 2012:728571. doi: 10.5402/2012/728571
Feuk, L., Prince, J., Breen, G., Emahazion, T., Carothers, A., St Clair, D., and Brookes, A. (2000). Apolipoprotein-e dependent role for the fas receptor in early onset Alzheimer's disease: finding of a positive association for a polymorphism in the tnfrsf6 gene. Hum. Genet. 107, 391–396. doi: 10.1007/s004390000383
Gautier, L., Cope, L., Bolstad, B. M., and Irizarry, R. A. (2004). Affy analysis of affymetrix genechip data at the probe level. Bioinformatics. 20, 307–315. doi: 10.1093/bioinformatics/btg405
Gentil, B. J., Benaud, C., Delphin, C., Remy, C., Berezowski, V., Cecchelli, R., et al. (2005). Specific ahnak expression in brain endothelial cells with barrier properties. J. Cell. Physiol. 203, 362–371. doi: 10.1002/jcp.20232
Halabi, C., Halabi, A., Dean, D. L., Wang, P.-N., Boxer, A. L., Trojanowski, J. Q., et al. (2013). Patterns of striatal degeneration in frontotemporal dementia. Alzheimer Dis. Assoc. Disord. 27:74. doi: 10.1097/WAD.0b013e31824a7df4
Hama, E., and Saido, T. C. (2005). Etiology of sporadic Alzheimer's disease: somatostatin, neprilysin, and amyloid beta peptide. Med Hypotheses. 65, 498–500. doi: 10.1016/j.mehy.2005.02.045
He, L.-J., Liu, N., Cheng, T.-L., Chen, X.-J., Li, Y.-D., Shu, Y.-S., et al. (2014). Conditional deletion of mecp2 in parvalbumin-expressing gabaergic cells results in the absence of critical period plasticity. Nat. Commun. 5:5036. doi: 10.1038/ncomms6036
Hebert, L. E., Weuve, J., Scherr, P. A., and Evans, D. A. (2013). Alzheimer disease in the united states (2010–2050) estimated using the 2010 census. Neurology. 80, 1778–1783. doi: 10.1212/WNL.0b013e31828726f5
Hebron, M., Peyton, M., Liu, X., Gao, X., Wang, R., Lonskaya, I., et al. (2017). Discoidin domain receptor inhibition reduces neuropathology and attenuates inflammation in neurodegeneration models. J. Neuroimmunol. 311, 1–9. doi: 10.1016/j.jneuroim.2017.07.009
Heppner, F. L., Ransohoff, R. M., and Becher, B. (2015). Immune attack: the role of inflammation in alzheimer disease. Nat. Rev. Neurosci. 16, 358–72. doi: 10.1038/nrn3880
Irizarry, R., and Love, M. (2015). Ph525x series - biomedical data science. Available online at: http://genomicsclass.github.io/book (accessed January 18, 2018).
Ishii, M., and Kurachi, Y. (2006). Muscarinic acetylcholine receptors. Curr. Pharmaceut. Design. 12, 3573–3581. doi: 10.2174/138161206778522056
Jaul, E., and Barron, J. (2017). Age-related diseases and clinical and public health implications for the 85 years old and over population. Front Public Health. 5:335. doi: 10.3389/fpubh.2017.00335
Jevtic, S., Sengar, A. S., Salter, M. W., and McLaurin, J. (2017). The role of the immune system in alzheimer disease: Etiology and treatment. Ageing Res. Rev. 40, 84–94. doi: 10.1016/j.arr.2017.08.005
Johnson, W. E., Li, C., and Rabinovic, A. (2007). Adjusting batch effects in microarray expression data using empirical bayes methods. Biostatistics. 8, 118–127. doi: 10.1093/biostatistics/kxj037
Jurisch-Yaksi, N., Sannerud, R., and Annaert, W. (2013). A fast growing spectrum of biological functions of γ-secretase in development and disease. Biochim. Biophys. Acta. 1828, 2815–2827. doi: 10.1016/j.bbamem.2013.04.016
Kajiwara, Y., Wang, E., Wang, M., Sin, W. C., Brennand, K. J., Schadt, E., et al. (2018). Gja1 (connexin43) is a key regulator of Alzheimer's disease pathogenesis. Acta Neuropathol. Commun. 6:144. doi: 10.1186/s40478-018-0642-x
Kanehisa, M., Furumichi, M., Tanabe, M., Sato, Y., and Morishima, K. (2017). Kegg: new perspectives on genomes, pathways, diseases and drugs. Nucleic Acids Res. 45, D353–D361. doi: 10.1093/nar/gkw1092
Kanehisa, M., and Goto, S. (2000). Kegg: kyoto encyclopedia of genes and genomes. Nucleic Acids Res. 28, 27–30. doi: 10.1093/nar/28.1.27
Kanehisa, M., Sato, Y., Kawashima, M., Furumichi, M., and Tanabe, M. (2016). Kegg as a reference resource for gene and protein annotation. Nucleic Acids Res. 44, D457–D462. doi: 10.1093/nar/gkv1070
Kolog Gulko, M., Heinrich, G., Gross, C., Popova, B., Valerius, O., Neumann, P., et al. (2018). Sem1 links proteasome stability and specificity to multicellular development. PLOS Genet. 14:e1007141. doi: 10.1371/journal.pgen.1007141
Kong, W., Mou, X., Liu, Q., Chen, Z., Vanderburg, C. R., Rogers, J. T., et al. (2009). Independent component analysis of Alzheimer's DNA microarray gene expression data. Mol. Neurodegen. 4:5. doi: 10.1186/1750-1326-4-5
Laifenfeld, D., Patzek, L. J., McPhie, D. L., Chen, Y., Levites, Y., Cataldo, A. M., et al. (2007). Rab5 mediates an amyloid precursor protein signaling pathway that leads to apoptosis. J. Neurosci. 27, 7141–7153. doi: 10.1523/JNEUROSCI.4599-06.2007
Li, H., and Wang, R. (2017). A focus on cxcr4 in Alzheimer's disease. Brain Circ. 3:199. doi: 10.4103/bc.bc_13_17
Li, S. S., Qu, Z., Haas, M., Ngo, L., Heo, Y. J., Kang, H. J., et al. (2016). The hsa21 gene eurl/c21orf91 controls neurogenesis within the cerebral cortex and is implicated in the pathogenesis of down syndrome. Sci. Rep. 6:29514. doi: 10.1038/srep29514
Liang, W. S., Dunckley, T., Beach, T. G., Grover, A., Mastroeni, D., Walker, D. G., et al. (2007). Gene expression profiles in anatomically and functionally distinct regions of the normal aged human brain. Physiol. Genomics. 28, 311–322. doi: 10.1152/physiolgenomics.00208.2006
Limon, A., Reyes-Ruiz, J. M., and Miledi, R. (2012). Loss of functional gabaa receptors in the Alzheimer diseased brain. Proc. Natl. Acad. Sci. U.S.A. 109, 10071–10076. doi: 10.1073/pnas.1204606109
Lin, Y. L., Chen, C., Keshav, K. F., Winchester, E., and Dutta, A. (1996). Dissection of functional domains of the human dna replication protein complex replication protein A. J. Biol. Chem. 271, 17190–17198.
Liu, H., Luo, K., and Luo, D. (2018). Guanosine monophosphate reductase 1 is a potential therapeutic target for Alzheimer's disease. Sci. Rep. 8:2759. doi: 10.1038/s41598-018-21256-6
Lopez-Otin, C., Blasco, M. A., Partridge, L., Serrano, M., and Kroemer, G. (2013). The hallmarks of aging. Cell. 153, 1194–217. doi: 10.1016/j.cell.2013.05.039
Maere, S., Heymans, K., and Kuiper, M. (2005). Bingo: a cytoscape plugin to assess overrepresentation of gene ontology categories in biological networks. Bioinformatics. 21, 3448–3449. doi: 10.1093/bioinformatics/bti551
Markesbery, W. R. (1997). Oxidative stress hypothesis in Alzheimer's disease. Free Rad. Biol. Med. 23, 134–147.
Marsh, S. E., Abud, E. M., Lakatos, A., Karimzadeh, A., Yeung, S. T., Davtyan, H., et al. (2016). The adaptive immune system restrains Alzheimer's disease pathogenesis by modulating microglial function. Proc. Natl. Acad. Sci. U.S.A. 113, E1316–E1325. doi: 10.1073/pnas.1525466113
Martorana, A., and Koch, G. (2014). Is dopamine involved in Alzheimer's disease? Front. Aging Neurosci. 6:252. doi: 10.3389/fnagi.2014.00252
Masters, C. L., Bateman, R., Blennow, K., Rowe, C. C., Sperling, R. A., and Cummings, J. L. (2015). Alzheimer's disease. Nat. Rev. Dis. Primers. 1:15056. doi: 10.1038/nrdp.2015.56
Matthews, K. A., Xu, W., Gaglioti, A. H., Holt, J. B., Croft, J. B., Mack, D., et al. (2018). Racial and ethnic estimates of Alzheimer's disease and related dementias in the United States (2015–2060) in adults aged >65 years. Alzheimer's Demen. 15, 17–24. doi: 10.1016/j.jalz.2018.06.3063
Mattson, M. P., and Arumugam, T. V. (2018). Hallmarks of brain aging: adaptive and pathological modification by metabolic states. Cell Metab. 27, 1176–1199. doi: 10.1016/j.cmet.2018.05.011
Menna, E., Disanza, A., Cagnoli, C., Schenk, U., Gelsomino, G., Frittoli, E., et al. (2015). Correction: Eps8 regulates axonal filopodia in hippocampal neurons in response to brain-derived neurotrophic factor (BDNF). PLOS Biol. 13:e1002184. doi: 10.1371/journal.pbio.1002184
Mias, G. (2018a). Analysis of Variance for Multiple Tests. Chapter 6.3. Cham: Springer International Publishing, 133–170.
Mias, G. (2018b). Databases: E-Utilities and UCSC Genome Browser. Chapter 4. Cham: Springer International Publishing, 133–170.
Mias, G. I., Yusufaly, T., Roushangar, R., Brooks, L. R., Singh, V. V., and Christou, C. (2016). Mathiomica: an integrative platform for dynamic omics. Sci. Rep. 6:37237. doi: 10.1038/srep37237
Miller, J. A., Woltjer, R. L., Goodenbour, J. M., Horvath, S., and Geschwind, D. H. (2013). Genes and pathways underlying regional and cell type changes in Alzheimer's disease. Genome Med. 5:48. doi: 10.1186/gm452
Moradifard, S., Hoseinbeyki, M., Ganji, S. M., and Minuchehr, Z. (2018). Analysis of microrna and gene expression profiles in Alzheimer's disease: a meta-analysis approach. Sci. Rep. 8:4767. doi: 10.1038/s41598-018-20959-0
Moreira, P. I., Carvalho, C., Zhu, X., Smith, M. A., and Perry, G. (2010). Mitochondrial dysfunction is a trigger of Alzheimer's disease pathophysiology. Biochim. Biophys. Acta. 1802, 2–10. doi: 10.1016/j.bbadis.2009.10.006
Nie, X., Sun, Y., Wan, S., Zhao, H., Liu, R., Li, X., Wu, S., Nedelska, Z., Hort, J., Qing, Z., et al. (2017). Subregional structural alterations in hippocampus and nucleus accumbens correlate with the clinical impairment in patients with alzheimer's disease clinical spectrum: parallel combining volume and vertex-based approach. Front. Neurol. 8:399. doi: 10.3389/fneur.2017.00399
Nobili, A., Latagliata, E. C., Viscomi, M. T., Cavallucci, V., Cutuli, D., Giacovazzo, G., et al. (2017). Dopamine neuronal loss contributes to memory and reward dysfunction in a model of Alzheimer's disease. Nat. Commun. 8:14727. doi: 10.1038/ncomms14727
Nygaard, V., Rødland, E. A., and Hovig, E. (2016). Methods that remove batch effects while retaining group differences may lead to exaggerated confidence in downstream analyses. Biostatistics. 17, 29–39. doi: 10.1093/biostatistics/kxv027
O'Bryant, S. E. (2016). Introduction to special issue on advances in blood-based biomarkers of alzheimer's disease. Alzheimer's Demen. 3, 110–112. doi: 10.1016/j.dadm.2016.06.003
O'Callaghan, P., Noborn, F., Sehlin, D., Li, J.-p., Lannfelt, L., Lindahl, U., and Zhang, X. (2014). Apolipoprotein e increases cell association of amyloid-β 40 through heparan sulfate and lrp1 dependent pathways. Amyloid. 21, 76–87. doi: 10.3109/13506129.2013.879643
Oh, S., Hong, H. S., Hwang, E., Sim, H. J., Lee, W., Shin, S. J., and Mook-Jung, I. (2005). Amyloid peptide attenuates the proteasome activity in neuronal cells. Mech. Ageing Dev. 126, 1292–1299. doi: 10.1016/j.mad.2005.07.006
Onyango, I. G., Dennis, J., and Khan, S. M. (2016). Mitochondrial dysfunction in Alzheimer's disease and the rationale for bioenergetics based therapies. Aging Dis. 7, 201–214. doi: 10.14336/AD.2015.1007
Owlanj, H., Jie Yang, H., and Wei Feng, Z. (2012). Nucleoside diphosphate kinase nm23-m1 involves in oligodendroglial versus neuronal cell fate decision in vitro. Differentiation. 84, 281–293. doi: 10.1016/j.diff.2012.08.007
Padgett, C. L., and Slesinger, P. A. (2010). Gabab receptor coupling to g-proteins and ion channels. In Adv. Pharmacol. 58, 123–147. doi: 10.1016/S1054-3589(10)58006-2
Parker, W. D., Parks, J., Filley, C. M., and Kleinschmidt-DeMasters, B. (1994). Electron transport chain defects in Alzheimer's disease brain. Neurology. 44, 1090–1090. Available online at: https://www.ncbi.nlm.nih.gov/pubmed/8208407
Pavlidis, P. (2003). Using anova for gene selection from microarray studies of the nervous system. Methods. 31, 282–289. doi: 10.1016/S1046-2023(03)00157-9
Pearce, S., Nezich, C. L., and Spinazzola, A. (2013). Mitochondrial diseases: translation matters. Mol. Cell. Neurosci. 55, 1–12. doi: 10.1016/j.mcn.2012.08.013
Pitts, M. W., Kremer, P. M., Hashimoto, A. C., Torres, D. J., Byrns, C. N., Williams, C. S., et al. (2015). Competition between the brain and testes under selenium-compromised conditions: insight into sex differences in selenium metabolism and risk of neurodevelopmental disease. J. Neurosci. 35, 15326–15338. doi: 10.1523/JNEUROSCI.2724-15.2015
Podcasy, J. L., and Epperson, C. N. (2016). Considering sex and gender in Alzheimer disease and other dementias. Dialogues Clin. Neurosci. 18, 437–446. Available online at: https://www.ncbi.nlm.nih.gov/pubmed/28179815 (accessed October 10, 2018).
Preische, O., Schultz, S. A., Apel, A., Kuhle, J., Kaeser, S. A., Barro, C., et al. (2019). Serum neurofilament dynamics predicts neurodegeneration and clinical progression in presymptomatic Alzheimer's disease. Nat. Med. 25, 277–283. doi: 10.1038/s41591-018-0304-3
Prieto, G. A., Trieu, B. H., Dang, C. T., Bilousova, T., Gylys, K. H., Berchtold, N. C., et al. (2017). Pharmacological rescue of long-term potentiation in Alzheimer diseased synapses. J. Neurosci. 37, 1197–1212. doi: 10.1523/JNEUROSCI.2774-16.2016
Purves, D., Augustine, G. J., Fitzpatrick, D., Katz L. C., LaMantia, A-S., McNamara, J. O., et al. (2001). Neuroscience, 2nd edition. Sunderland MA: Sinauer Associates. Available online at: https://www.ncbi.nlm.nih.gov/books/NBK10799/
R Core Team (2018). R: A Language and Environment for Statistical Computing. Vienna: R Foundation for Statistical Computing. Available online at: https://www.R-project.org/ (accessed September 30, 2016).
Rangaraju, S., Gearing, M., Jin, L.-W., and Levey, A. (2015). Potassium channel kv1. 3 is highly expressed by microglia in human alzheimer's disease. J. Alzheimers Dis. 44, 797–808. doi: 10.3233/JAD-141704
Ritchie, M. E., Phipson, B., Wu, D., Hu, Y., Law, C. W., Shi, W., et al. (2015). Limma powers differential expression analyses for RNA-sequencing and microarray studies. Nucleic Acids Res. 43:e47. doi: 10.1093/nar/gkv007
Rowe, J. W., Fulmer, T., and Fried, L. (2016). Preparing for better health and health care for an aging population. JAMA. 316, 1643–1644. doi: 10.1001/jama.2016.12335
Sakia, R. (1992). The box-cox transformation technique: a review. Statistician. 41, 169–178. doi: 10.2307/2348250
Salon, M. L., Pasquini, L., Moreno, M. B., Pasquini, J., and Soto, E. (2003). Relationship between β-amyloid degradation and the 26s proteasome in neural cells. Exp. Neurol. 180, 131–143. doi: 10.1016/S0014-4886(02)00060-2
Saura, C. A., Choi, S.-Y., Beglopoulos, V., Malkani, S., Zhang, D., Rao, B. S., et al. (2004). Loss of presenilin function causes impairments of memory and synaptic plasticity followed by age-dependent neurodegeneration. Neuron. 42, 23–36. doi: 10.1016/S0896-6273(04)00182-5
Serneels, L., Dejaegere, T., Craessaerts, K., Horré, K., Jorissen, E., Tousseyn, T., et al. (2005). Differential contribution of the three aph1 genes to γ-secretase activity in vivo. Proc. Natl. Acad. Sci. U.S.A. 102, 1719–1724. doi: 10.1073/pnas.0408901102
Seshadri, S., Wolf, P. A., Beiser, A., Au, R., McNulty, K., White, R., et al. (1997). Lifetime risk of dementia and Alzheimer's disease. The impact of mortality on risk estimates in the framingham study. Neurology. 49, 1498–504. Available online at: https://www.ncbi.nlm.nih.gov/pubmed/9409336 (accessed October 10, 2018).
Sethi, M. K., and Zaia, J. (2017). Extracellular matrix proteomics in schizophrenia and Alzheimer's disease. Anal. Bioanal. Chem. 409, 379–394. doi: 10.1007/s00216-016-9900-6
Shannon, P., Markiel, A., Ozier, O., Baliga, N. S., Wang, J. T., Ramage, D., et al. (2003). Cytoscape: a software environment for integrated models of biomolecular interaction networks. Genome Res. 13, 2498–504. doi: 10.1101/gr.1239303
Solarski, M., Wang, H., Wille, H., and Schmitt-Ulms, G. (2018). Somatostatin in Alzheimer's disease: a new role for an old player. Prion. 12, 1–8. doi: 10.1080/19336896.2017.1405207
Sonbol, H. S. (2018). Extracellular matrix remodeling in human disease. J. Microsc. Ultrastruct. 6:123. doi: 10.4103/JMAU.JMAU_4_18
Sood, S., Gallagher, I. J., Lunnon, K., Rullman, E., Keohane, A., Crossland, H., et al. (2015). A novel multi-tissue rna diagnostic of healthy ageing relates to cognitive health status. Genome Biol. 16:185. doi: 10.1186/s13059-015-0750-x
Steenland, K., Goldstein, F. C., Levey, A., and Wharton, W. (2016). A meta-analysis of Alzheimer's disease incidence and prevalence comparing African-Americans and Caucasians. J. Alzheimers Dis. 50, 71–76. doi: 10.3233/JAD-150778
Stelzer, G., Rosen, N., Plaschkes, I., Zimmerman, S., Twik, M., Fishilevich, S., et al. (2016). The genecards suite: from gene data mining to disease genome sequence analyses. Curr. Protoc. Bioinformatics. 54, 1.30.1–1.30.33. doi: 10.1002/cpbi.5
Stuart, T., and Satija, R. (2019). Integrative single-cell analysis. Nat. Rev. Genet.. doi: 10.1038/s41576-019-0093-7
Stygelbout, V., Leroy, K., Pouillon, V., Ando, K., D'amico, E., Jia, Y., et al. (2014). Inositol trisphosphate 3-kinase b is increased in human Alzheimer brain and exacerbates mouse alzheimer pathology. Brain. 137, 537–552. doi: 10.1093/brain/awt344
Swerdlow, R. H. (2018). Mitochondria and mitochondrial cascades in Alzheimer's disease. J. Alzheimers Dis. 62, 1403–1416. doi: 10.3233/JAD-170585
Tanaka, K. (2009). The proteasome: overview of structure and functions. Proc. Japan Acad. Series B. 85, 12–36. doi: 10.2183/pjab.85.12
Taylor, C. A., Greenlund, S. F., McGuire, L. C., Lu, H., and Croft, J. B. (2017). Deaths from Alzheimer's disease United States, 1999–2014. MMWR Morb. Mortal. Weekly Rep. 66:521. doi: 10.15585/mmwr.mm6620a1
Thei, L., Imm, J., Kaisis, E., Dallas, M. L., and Kerrigan, T. L. (2018). Microglia in alzheimer's disease: a role for ion channels. Front. Neurosci. 12:676. doi: 10.3389/fnins.2018.00676
Toepper, M. (2017). Dissociating normal aging from alzheimer's disease: a view from cognitive neuroscience. J. Alzheimers Dis. 57, 331–352. doi: 10.3233/JAD-161099
United Nations Department of Economic and Social Affairs (2015). World Population Ageing 2015. (ST/ESA/SER.A/390). Available online at: http://www.un.org/en/development/desa/population/publications/pdf/ageing/WPA2015_Report.pdf (accessed November 01, 2018).
Upadhyay, A., Hosseinibarkooie, S., Schneider, S., Kaczmarek, A., Torres-Benito, L., Mendoza-Ferreira, N., et al. (2019). Neurocalcin delta knockout impairs adult neurogenesis whereas half reduction is not pathological. Front. Mol. Neurosci. 12:19. doi: 10.3389/fnmol.2019.00019
Van Deursen, J. M. (2014). The role of senescent cells in ageing. Nature. 509:439. doi: 10.1038/nature13193
Van Eldik, L. J., Carrillo, M. C., Cole, P. E., Feuerbach, D., Greenberg, B. D., Hendrix, J. A., et al. (2016). The roles of inflammation and immune mechanisms in Alzheimer's disease. Alzheimer's Demen. 2, 99–109. doi: 10.1016/j.trci.2016.05.001
Vassar, R. (2004). Bace1: The β-secretase enzyme in Alzheimer's disease. J. Mol. Neurosci. 23, 105–114. doi: 10.1385/JMN:23:1-2:105
Vina, J., and Lloret, A. (2010). Why women have more Alzheimer's disease than men: gender and mitochondrial toxicity of amyloid-β peptide. J. Alzheimers Dis. 20, S527–S533. doi: 10.3233/JAD-2010-100501
Wang, D., and Bodovitz, S. (2010). Single cell analysis: the new frontier in omics. Trends Biotechnol. 28, 281–290. doi: 10.1016/j.tibtech.2010.03.002
Wang, M., Roussos, P., McKenzie, A., Zhou, X., Kajiwara, Y., Brennand, K. J., et al. (2016). Integrative network analysis of nineteen brain regions identifies molecular signatures and networks underlying selective regional vulnerability to Alzheimer's disease. Genome Med. 8:104. doi: 10.1186/s13073-016-0355-3
Wang, Q., Li, W. X., Dai, S. X., Guo, Y. C., Han, F. F., Zheng, J. J., et al. (2017). Meta-analysis of Parkinson's disease and Alzheimer's disease revealed commonly impaired pathways and dysregulation of nrf2-dependent genes. J. Alzheimers Dis. 56, 1525–1539. doi: 10.3233/JAD-161032
Winkler, J. M., and Fox, H. S. (2013). Transcriptome meta-analysis reveals a central role for sex steroids in the degeneration of hippocampal neurons in Alzheimer's disease. BMC Syst. Biol. 7:51. doi: 10.1186/1752-0509-7-51
Wolfram Research, Inc. (2017). Mathematica, version 11.2 edition. Available online at: https://www.wolfram.com/mathematica/?source=nav (accessed October 10, 2016).
Yoshida, R., Takaesu, G., Yoshida, H., Okamoto, F., Yoshioka, T., Choi, Y., et al. (2008). Traf6 and mekk1 play a pivotal role in the rig-i-like helicase antiviral pathway. J. Biol. Chem. 283, 36211–36220. doi: 10.1074/jbc.M806576200
Yu, G., and He, Q. Y. (2016). Reactomepa: an r/bioconductor package for reactome pathway analysis and visualization. Mol. Biosyst. 12, 477–479. doi: 10.1039/C5MB00663E
Yu, G., Wang, L. G., Han, Y., and He, Q. Y. (2012). clusterprofiler: an r package for comparing biological themes among gene clusters. OMICS., 16, 284–287. doi: 10.1089/omi.2011.0118
Yurov, Y. B., Vorsanova, S. G., and Iourov, I. Y. (2011). The dna replication stress hypothesis of Alzheimer's disease. Sci. World J. 11, 2602–2612. doi: 10.1100/2011/625690
Zhang, B., Gaiteri, C., Bodea, L. G., Wang, Z., McElwee, J., Podtelezhnikov, A. A., et al. (2013). Integrated systems approach identifies genetic nodes and networks in late-onset Alzheimer's disease. Cell. 153, 707–720. doi: 10.1016/j.cell.2013.03.030
Zhang, B., Wang, Q., Miao, T., Yu, B., Yuan, P., Kong, J., et al. (2015). Whether Alzheimer's diseases related genes also differently express in the hippocampus of ts65dn mice? Int. J. Clin. Exp. Pathol. 8:4120. Available online at: https://www.ncbi.nlm.nih.gov/pmc/articles/PMC4466988/ (accessed March 01, 2019).
Keywords: Alzheimer's disease, neurodegeneration, transcriptomics, meta-analysis, microarray analysis, aging, bioinformatics
Citation: Brooks LRK and Mias GI (2019) Data-Driven Analysis of Age, Sex, and Tissue Effects on Gene Expression Variability in Alzheimer's Disease. Front. Neurosci. 13:392. doi: 10.3389/fnins.2019.00392
Received: 17 December 2018; Accepted: 05 April 2019;
Published: 24 April 2019.
Edited by:
Hamid R. Sohrabi, Edith Cowan University, AustraliaReviewed by:
Alberto Granzotto, Centro Scienze dell'Invecchiamento e Medicina Traslazionale (CeSI-MeT), ItalyNataliya G. Kolosova, Institute of Cytology and Genetics, Russian Academy of Sciences, Russia
Copyright © 2019 Brooks and Mias. This is an open-access article distributed under the terms of the Creative Commons Attribution License (CC BY). The use, distribution or reproduction in other forums is permitted, provided the original author(s) and the copyright owner(s) are credited and that the original publication in this journal is cited, in accordance with accepted academic practice. No use, distribution or reproduction is permitted which does not comply with these terms.
*Correspondence: George I. Mias, gmias@msu.edu