 Yi-Shao Li
 Chung-Te Chang
 Chun-Neng Wang
 Philip Thomas
 Jeng-Der Chung5
 Shih-Ying Hwang
- 1Department of Life Science, National Taiwan Normal University, Taipei, Taiwan
- 2Department of Geography, National Taiwan University, Taipei, Taiwan
- 3Institute of Ecology and Evolution, National Taiwan University, Taipei, Taiwan
- 4International Conifer Conservation Programme of the Royal Botanic Garden, Edinburgh, United Kingdom
- 5Division of Silviculture, Taiwan Forestry Research Institute, Taipei, Taiwan
The question of what determines divergence both between and within species has been the central topic in evolutionary biology. Neutral drift and environmentally dependent divergence are predicted to play roles in driving population and lineage divergence. However, neutral drift may preclude adaptation if the rate of gene flow between populations is high. Here, we sampled populations of three Taiwania (Taiwania cryptomerioides) lineages occurring in Taiwan, the mainland of China (Yunnan-Myanmar border), and northern Vietnam, and tested the relative strength of neutral drift and divergent selection in shaping divergence of those populations and lineages. We quantified genetic and epigenetic variation, respectively, using amplified fragment length polymorphism (AFLP) and methylation-sensitive amplification polymorphism (MSAP). Analysis of 1413 AFLP and 462 MSAP loci using frequency-based genome scan methods and generalized linear models (GLMs) found no potential selective outliers when only Taiwanese populations were examined, suggesting that neutral drift was the predominant evolutionary process driving differentiation between those populations. However, environmentally associated divergence was found when lineages were compared. Thirty-two potential selective outliers were identified based on genome scans and their associations with environmental variables were tested with GLMs, generalized linear mixed effect models (GLMMs), and model selection with a model averaging approach. Ten loci (six AFLP and four MSAP) were found to be strongly associated with environmental variables, particularly monthly temperature variation and normalized difference vegetation index (NDVI) using model selection and a model averaging approach. Because only a small portion of genetic and epigenetic loci were found to be potential selective outliers, neutral evolutionary process might also have played crucial roles in driving lineage divergence, particularly between geographically and genetically isolated island and mainland Asia lineages. Nevertheless, the vast amount of neutral drift causing genetic and epigenetic variations might have the potential for adaptation to future climate changes. These could be important for the survival of Taiwania in different geographic areas.
Introduction
Both selective and neutral forces may be involved in population and lineage diversification. Elucidating their relative strength in driving biological variation is critical to understanding how these processes impact evolution at population level and early stages of speciation (Coyne and Orr, 2004; Rundell and Price, 2009; Raeymaekers et al., 2017). Adaptive lineages can evolve within the species distribution range when associated environmental gradients underlie local adaptation (Alberto et al., 2013; Savolainen et al., 2013). Environmentally associated genetic variation can be used as a stepping stone in identifying new ecotypes that can be useful in the future conservation of species. However, historical events and stochastic or neutral mechanisms can also play important roles in shaping the gene pool within the current distribution area (Lande, 1988; Wang et al., 2017).
Selection driven by ecological factors acting on genetic variation of DNA sequences is of major importance in evolutionary biology (Schluter, 2001, 2009). DNA sequence variation revealed by amplified fragment length polymorphism (AFLP) has been found to be closely associated with environmental conditions in shaping population adaptive divergence of many plant species (e.g., Fang et al., 2013; Huang et al., 2015a,b; Santiso et al., 2016; Yang et al., 2016; Chen et al., 2017). There is an increasing interest in investigating environmentally dependent epigenetic variation in natural populations, which is also important for understanding the potential for adaptation of populations and species that are enduring rapid global environmental changes (Bossdorf et al., 2008; Johnson and Tricker, 2010; Alonso et al., 2015; Huang et al., 2015b; Villota-Salazar et al., 2016). Such variation can be characterized by methylation-sensitive amplification polymorphism (MSAP) that reflects modification of cytosine methylation states (Bossdorf et al., 2008; Richards et al., 2017). The association between epigenetic variation and environments may be related to the lower levels of methylation status in different genes, resulting in the higher expression of fitness-related traits (Lira-Medeiros et al., 2010; Latzel et al., 2013; Whipple and Holeski, 2016; Richards et al., 2017). Three types of epigenetic variation (obligatory, facilitated, and pure epigenetic variation) have been characterized to explain the degree to which epigenetic and DNA sequence variation are related (Richards, 2006). In obligatory epigenetic variation, the epigenotype is entirely dependent on genotype. The relationship between epigenotype and genotype is either partially or completely independent in facilitated and pure epigenetic variation.
Taiwania (Taiwania cryptomerioides Hayata) is a coniferous species in the monotypic genus Taiwania of the cypress family Cupressaceae. While its fossil record indicates that it was formerly widespread across the northern Hemisphere (LePage, 2009), it currently has a disjunct distribution in Taiwan, northern Vietnam, and mainland China (Wang and Xie, 2004; Farjon and Thomas, 2007; Nguyen, 2007). Three main lineages have been identified in natural populations in Taiwan, along the Yunnan-Myanmar border, and in Vietnam (Chou et al., 2011). The Taiwanese and Yunnan-Myanmar lineages diverged between 3.23 and 3.41 million years ago (Mya), while Yunnan-Myanmar and Vietnamese lineages diverged between 1.0 and 1.39 Mya (Chou et al., 2011). The population located along the Yunnan-Myanmar border included four chloroplast DNA (cpDNA) haplotypes. The most common of these was also the only haplotype found in other doubtfully naturally occurring Chinese populations. The Vietnamese lineage contained five cpDNA haplotypes including the high frequency haplotype found in all mainland China populations and also shared one low frequency haplotype with Yunnan-Myanmar lineage. Only two cpDNA haplotypes, both different from those found in mainland China and Vietnam, were found in Taiwan. Overall, a low level of cpDNA variation was observed in Taiwania (Chou et al., 2011) in contrast to other related widespread cypress species (Cunninghamia konishii and Cu. lanceolata, Hwang et al., 2003).
In the present study, AFLP and MSAP variations were surveyed in the main extant Taiwania lineages, to investigate the contrasting driving forces (i.e., drift and selection) potentially shaping population and lineage divergence and its association with specific environmental variables. Additionally, AFLP and MSAP may have the advantage of revealing genetic and epigenetic variations that could also be useful for investigating population and lineage divergence and their association with specific environmental variables. Previous studies have indicated a high rate of gene flow among mainland China populations and also between the Chinese and the Vietnamese lineages (Chou et al., 2011). A high rate of gene flow between Taiwanese populations may also be inferred as only two cpDNA haplotypes were found and one of these was restricted to a single individual within the southeastern population of Guanshan (n = 12, Figure 1). High rate of gene flow among populations of cypress species can be attributed to effective pollen flow due to wind-pollination as cpDNA is paternally inherited (Neale et al., 1991; Hipkins et al., 1994). Drift-mediated evolutionary processes might have played an important role in Taiwania population and lineage divergence due to high rate of gene flow. However, limited or essentially no gene flow between geographically isolated island and mainland Asia Taiwania lineages has also been indicated in Chou et al. (2011). Since the island lineage is long-diverged from mainland Asia lineages, alternative genetic and epigenetic alleles may have accumulated largely through neutral drift (Wright, 1931; Govindaraju, 1989). To test the drift divergence hypothesis, the three Taiwania lineages were investigated for the relative strength of nonadaptive and adaptive force shaping population and lineage divergence. The specific goals of this study were to: (1) characterize the gene (genetic and epigenetic) pool structure of geographically isolated Taiwania lineages; (2) test the prediction that neutral drift was the main evolutionary process driving differentiation between populations within Taiwan and between the three previously identified lineages; and (3) test the associations of environmental variables with genetic and epigenetic variations between populations and lineages.
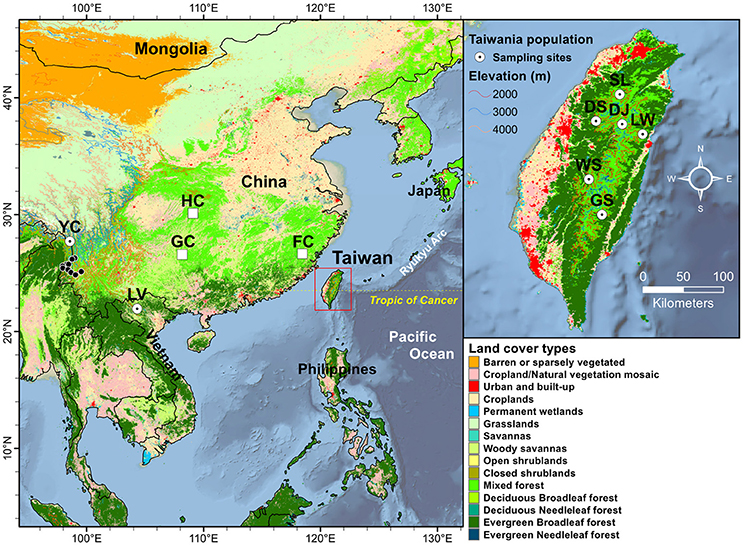
Figure 1. Geographic distribution of the eight populations of Taiwania in the Taiwanese, Yunnan-Myanmar, and Vietnamese lineages. Land cover types were extracted using MODIS product MCD12Q1 of 2013 at 500 m resolution. See Table 1 for abbreviations of the eight populations of Taiwania. The locations of other mainland China populations, representing probably cultivated or naturalized trees, not used in the present study including populations Guizhou (GC), Hubei (HC), and Fujian (FC) were marked by open squares. The black circles represent locations of herbarium specimens collected from south of Gaoligonshan along Yunnan-Myanmar border (http://threatenedconifers.rbge.org.uk/taxa/details/taiwania-cryptomerioides). The population codes on the map followed Chou et al. (2011).
Materials and Methods
Sampling
Three lineages of Taiwania located in Taiwan, Yunnan-Myanmar border, and northern Vietnam were used in the present study (Table 1, Figure 1.) Populations in Taiwan are distributed at elevations of 1,800–2,600 m along the central mountain range while those in the Gaoligon mountain (Gaoligonshan) of mainland China along the Yunnan-Myanmar border occur at elevations of 1,800–2,500 m. Samples of the Gaoligonshan population included individuals collected from two stands 5 km apart. Locations of herbarium specimens (http://threatenedconifers.rbge.org.uk/taxa/details/taiwania-cryptomerioides) collected from south of Gaoligonshan, though not used in the present study, were marked by black circles in Figure 1. In northern Vietnam a single population occurs in the Hoanglien mountain (Hoanglienshan) at elevations of 1,800–2,200. We did not include samples from three other Chinese populations (populations located in Guizhou, Hubei, and Fujian provinces) in the present study because they are probably cultivated or naturalized trees. Moreover, the only cpDNA haplotype found for those populations was the most common haplotype found in the Yunnan-Myanmar lineage and the Vietnamese lineage (Chou et al., 2011). Leaf samples for DNA extraction were collected, dried in silica gel, from separate individuals in a total of eight populations: six in Taiwan (n = 51), one along the Yunnan-Myanmar border (mainland China) (n = 18), and one in northern Vietnam (n = 33) (Doyle and Doyle, 1987; Table 1, Figure 1). We labeled the populations with the same codes as used in Chou et al. (2011).
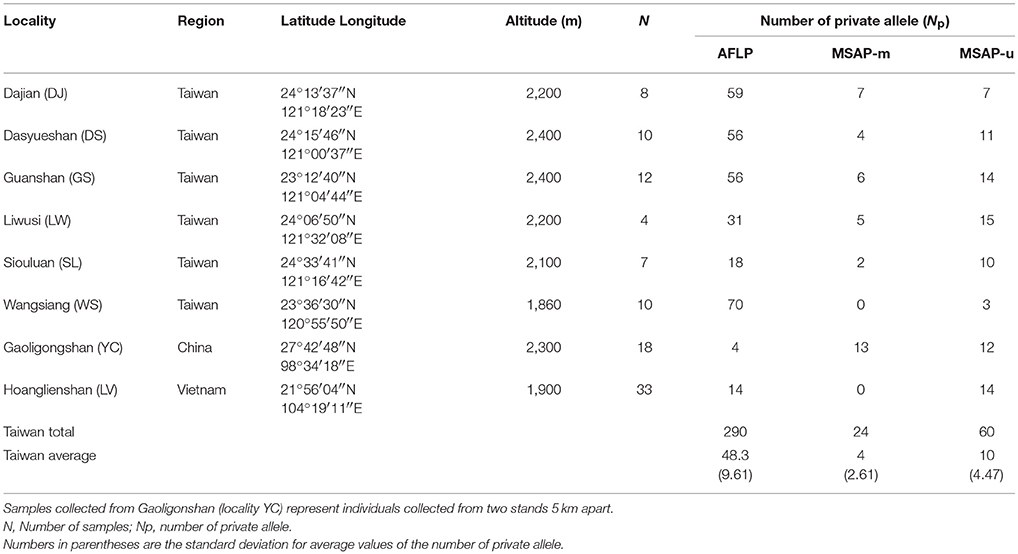
Table 1. Site properties of sampled Taiwania populations including the number of private allele for genetic and epigenetic markers.
AFLP and MSAP
We surveyed genetic and epigenetic variation using AFLP (Vos et al., 1995) with modifications in performing ligation, pre- and selective amplification (Huang et al., 2015b) and MSAP (Xiong et al., 1999), respectively. Eleven EcoRI-MseI selective primer combinations with sequences of the five or three bases additional to the E00 (5′-GACTGCGTACCAATTC-3′) and M00 (5′-GATGAGTCCTGAGTAA-3′) primers were used in AFLP amplification procedure (Supplementary Table 1). Eight primer combinations, were applied in selective amplification for MSAP, with additional five and two selective nucleotides, respectively, added to the E00 and HM00 (HpaII-MspI, 5′-ATCATGAGTCCTGCTCGG-3′) (Supplementary Table 1). AFLP and MSAP fragments were scored for each individual in the range of 100–500 bp with the software GeneMapper v.3.7 (Applied Biosystems, Foster City, CA, USA). The relative fluorescent unit threshold was set at 100. Markers with low peaks and markers separated by less than one nucleotide in a ±0.9 base pair window were removed. MSAP markers were further scored using the “mixed scoring 1” of the MSAP-calc R script (Schulz et al., 2013) in the R environment (R Development Core Team, 2017) and transformed to MSAP-m and MSAP-u datasets, where the last letter m and u represents methylated and unmethylated scoring types of MSAP markers, respectively. AFLP, MSAP-m, and MSAP-u datasets were deposited as Data Sheets 1–3.
Genotyping error rate (Bonin et al., 2004) per AFLP and MSAP locus was calculated as the ratio of mismatches in three amplification replicates of three randomly selected samples in each population for each primer combination. In MSAP, genotyping error rate of EcoRI-MspI (eMspI), EcoRI-HpaII (eHpaII), and a combined error rate (eMspI + eHpaII – 2eMspIeHpaII) for each primer combination were calculated (Herrera and Bazaga, 2010). The mean error rate was 7.31 and 4.85%, respectively, for AFLP and MSAP (Supplementary Table 1).
Genetic and Epigenetic Diversity
AFLP, MSAP-m, and MSAP-u scored markers were used for calculation of the percentage of polymorphic loci (%P) at the 95% level and unbiased expected heterozygosity (uHE) (Nei, 1987) within a population using AFLP-SURV v.1.0 (Vekemans et al., 2002). Allele frequencies were estimated using the method of Zhivotovsky (1999) assuming Hardy-Weinberg equilibrium with non-uniform prior distribution. ARLEQUIN (Excoffier and Lischer, 2010) was used to calculate uHE per locus. Nei's genetic distance (Nei, 1978) matrices of AFLP, MSAP-m, and MSAP-u datasets were calculated with the nei.dist function of R package poppr (Kamvar et al., 2015). Mantel correlations between the three datasets were assessed using the mantel function of R package vegan based on Spearman's rank correlation, and significance determined by 999 permutations.
The number of private allele for each population was calculated using the private_alleles function of R package poppr. Multilocus linkage disequilibrium (LD) was assessed with index of association (IA) (Brown et al., 1980) and modified index of association (rD) (Agapow and Burt, 2001), and calculated using the ia function of R poppr package. Significant departure from zero of IA and rD was tested with 999 permutations.
Linear mixed effect model (LMM) with reduced maximum likelihood estimation was used to assess whether mean uHE per locus was significantly different between populations and between lineages of Taiwania using the lmer function of R package lme4 (Bates et al., 2015). In LMMs, lineage and population were treated as fixed effects and locus as a random effect. Type II Wald χ2 test of the Anova function of R package car (Fox and Weisberg, 2011) was used to test the overall difference between lineages and between populations. Tukey's honest significance test for multiple comparisons was assessed using the lsmeans function of R package lsmeans (Lenth, 2016).
Differentiation, Relationships, and Clustering
AFLP, MSAP-m, and MSAP-u datasets were used for computation of the levels of genetic and epigenetic differentiation via analysis of molecular variance (AMOVA), across population FST, and Bayesian HICKORY θII (Holsinger and Lewis, 2003). AMOVA between populations and between lineages was computed using the poppr.amova function of R package poppr, and significance tested using the randtest function of R package ade4 with 9,999 permutations (Dray and Dufour, 2007). Across population FST was calculated using AFLP-SURV with 9,999 permutations. Pairwise population FST was calculated using ARLEQUIN with 10,000 permutations. The levels of genetic and epigenetic differentiation estimated based on θII was performed using HICKORY v.1.1 (Holsinger and Lewis, 2003). HICKORY θII is an estimate analogous to FST, while accounting for the uncertainty associate with the inbreeding coefficient (f) for dominant markers. The default settings for sampling and chain length parameters (burnin = 5,000, samples = 100,000; thinning = 20) were used in HICKORY. Four models, including a full model, f = 0 model, θII = 0 model, and f-free model, were assessed for the best model fitting to the genetic and epigenetic data. The f-free model was used to estimate f. Separate analyses of the population structure, including between populations and between lineages, were performed in HICKORY. The Deviance Information Criterion (DIC) was used to identify the best fitting model. A lower D + pD (model fit + model complexity) was used to assist determination of the best model if the difference between models was smaller than six units. We ran HICKORY twice for each analysis in order to check the convergence of parameters.
Considering that complex evolutionary processes such as gene flow between populations and recombination within a population can lead to conflict or ambiguous phylogenetic signals in a single tree representation, Neighbor-Net analysis (Bryant and Moulton, 2004) was used to reveal Taiwania population and lineage relationships, based on Nei's genetic distance using the neighborNet function of R package phangorn (Schliep, 2011; Schliep et al., 2017). The bootstrap support values were calculated with the aboot function of R package poppr.
To identify genetically and epigenetically homogeneous groups of Taiwania populations, we used the Bayesian model-based method implemented in STRUCTURE v.2.3 (Pritchard et al., 2000; Falush et al., 2007), the sparse non-negative factorization (sNMF) method implemented in R package LEA (Frichot and Francois, 2015), and the discriminant analysis of principal components (DAPC) method implemented in R package adegenet (Jombart et al., 2010; Jombart and Ahmed, 2011). In STRUCTURE, we assumed an admixture model with an informative prior of sampling location. K values ranging from 1 to 9 were tested with 10 replicate runs for each K with 106 iterations and 105 burn-in steps. We used R package pophelper (Francis, 2017) to summarize the mean log probability (LnP(D)) (Pritchard et al., 2000), change in the log probability (ΔK) (Evanno et al., 2005), and symmetric similarity coefficient (SSC) (Jakobsson and Rosenberg, 2007) for evaluation of clustering outcomes at each K. The snmf function of R package LEA was used to assess individual assignments based on sNMF algorithm with least-squares optimization. In snmf of LEA, regularization parameter, iterations, and repetitions were set to 100, 200, and 10, respectively, with other arguments set to defaults for K = 1–8. The best K was evaluated with the means of minimal cross-entropy (CE). DAPC, a multivariate method, was performed using the find.clusters and dapc functions of R package adegenet. DAPC first performed a principal component analysis (PCA) followed by a discriminant analysis that maximize the inter-group component of variation.
Potential Outlier Detection
Genome scan methods of DFDIST within the Mcheza workbench (Antao and Beaumont, 2011) and BAYESCAN v.2.1 (Foll and Gaggiotti, 2008) were used to test for FST outliers in global and pairwise comparisons. In DFDIST, outliers were identified by comparing observed distribution with neutral expectations at a 99.5% confidence interval (CI) and an FDR of 1% with each run comprising 106 simulations. Both “neutral mean FST” and “force mean FST” were selected. FST outliers were removed to increase the reliability of calculating the global distribution of FST. BAYESCAN uses a reversible-jump Markov chain Monte Carlo algorithm based on a Bayesian likelihood approach to estimate the ratio of posterior probabilities of selection over neutrality [the posterior odds (PO)]. Parameters for running BAYESCAN were 100 pilot runs of 50,000 iterations followed by a sample size of 50,000 with thinning interval of 20 among 106 iterations. A locus with log10(PO) > 0.5 was considered to have substantial evidence for selection (Jeffreys, 1961).
A total of 32 FST outliers were identified using DFDIST and BAYESCAN in global and pairwise lineage comparisons (see section Results). Because genome scan methods may obtain low support value [low log10(PO)] in BAYESCAN and false positives in DFDIST (Pérez-Figueroa et al., 2010), Samβada (Stucki et al., 2017) was further used to test whether allele frequencies of FST outliers identified either by DFDIST or by BAYESCAN had significant associations with the values of environmental variables using multiple univariate logistic regression based on generalized linear model (GLM). For the Samβada analysis, genetic and epigenetic markers were coded with “11” and “00” for presence and absence and tested for associations of allele frequencies with values of environmental variables (BIO4, BIO15, NDVI, PET, aspect, and slope) in global and pairwise lineage comparisons. Significant fit was identified comparing between models with and without environmental variables based on both Wald and G scores with an FDR cutoff of 0.01. When only Taiwanese populations were investigated, no FST outlier was found using DFDIST and BAYESCAN, and neither with Samβada for association between genetic and epigenetic variations with environmental variables. Therefore, we focused on lineage comparison in the following analyses.
Generalized linear mixed effect models (GLMMs) were also used to test for the association of FST outliers with environmental variables (Lobréaux and Melodelima, 2015). We performed GLMMs with a logit link function and a binomial residual distribution in analyzing the 32 FST outliers (response variables) using the glmer function of R package lme4. In GLMMs, environmental variables were used as fixed effects and lineage as a random effect. To determine significant associations of environmental gradients with allele frequencies of FST outliers, profile CIs (95 and 99%) based on likelihood ratio test for fixed effects were used. A two locus exact test was used to assess pairwise LD between potential outlier loci using ARLEQUIN, and significance determined by 10,000 permutations.
Relative Contribution of Environment and Geography in Explaining Genetic and Epigenetic Variation Between Taiwania Lineages
Environmental variables used were classified into three categories (i.e., bioclimate, topological, and ecological variables; Supplementary Table 2). Nineteen bioclimate variables for sample sites were downloaded from the WorldClim v.1.4 (http://www.worldclim.org/) at 30-s spatial resolution (~1 km) (Hijmans et al., 2005). Topographic (aspect and slope) variables were derived from a 30-m resolution ASTER GDEM (Global Digital Elevation Map; http://lpdaac.usgs.gov). Ecological factors including normalized difference vegetation index (NDVI) and enhanced vegetation index (EVI) derived from moderate resolution imaging spectroradiometer (MODIS) dataset MOD13A2 (1 km resolution), and leaf area index (LAI) and fraction of absorbed photosynthetically active radiation (fPAR) obtained based on MOD15A2 dataset (500 m resolution). The annual total potential evapotranspiration (PET) was calculated based on MOD16A3 dataset (500 m resolution). All the MODIS datasets were acquired from Land Process Distributed Active Archive Center (LPDAAC, http://lpdaac.usgs.gov) during 2001–2013. Four tiles (H26V06, H27V06, H28V06, and H29V06) were required to cover the entire study region. The monthly mean values of NDVI, EVI, LAI, and fPAR were computed using a maximum values composite procedures (Huete et al., 2002). The land cover types of population locations were extracted from a 500 m resolution MODIS product MCD12Q1 of 2013 (Figure 1, Friedl et al., 2010). Taiwania in Taiwan and along the Yunnan-Myanmar border occur in a mixed forest land cover type while the Vietnamese lineage occurs in evergreen broadleaf forests.
Analyses that were focused only on Taiwanese populations included seven additional ecological factors: annual moisture index, relative humidity (RH), cloud cover (CLO), time of sunshine (SunH), number of rainfall days per year (RainD), mean wind speed (WSmean), and soil pH. Monthly mean values of RH, CLO, SunH, RainD, and WSmean at spatial resolution of 1 km were obtained from the Data Bank for Atmospheric Research (DBAR, https://www.narlabs.org.tw/en/, recorded in 1990–2013) using a universal spherical model of the Kriging method in ArcGIS (Chang et al., 2014). Soil pH values of sample sites, based on an island-wide soil investigation (n = 1150) conducted in 1969–1986, were acquired from the Agriculture and Food Agency of Taiwan (Chang et al., 2009). Annual precipitation and annual potential evapotranspiration (derived from annual mean temperature) of each sample sites were used to calculate annual moisture index (Thornthwaite, 1948).
Correlations between environmental variables and variance inflation factor (VIF) were calculated using the cor function of R and vif function of R package usdm (Naimi et al., 2014), respectively. When all environmental variables were used in VIF calculation, high collinearity among environmental variables were found (Supplementary Table 2), hence we performed VIF calculation for environmental variables within each category (i.e., bioclimatic, topographic, and ecological factors). Finally, environmental variables with VIF > 5 and which were strongly correlated with other variables (|r| > 0.8) within each environmental category were removed. Six environmental variables including BIO4 (monthly temperature variation), BIO15 (monthly precipitation variation), PET, NDVI, aspect, and slope were retained when the three Taiwania lineages were considered (Supplementary Figures 1, 2). Eight environmental variables (BIO4, BIO15, CLO, RainD, WSmean, NDVI, aspect, and slope) were retained when only Taiwanese populations were considered (Supplementary Figures 1, 2).
Permutational multivariate analysis of variance (PERMANOVA) was used to test for environmental heterogeneity among Taiwania populations within Taiwan and among Taiwania lineages using the adonis function of R package vegan (Oksanen et al., 2017). Euclidean distance matrices of environmental variables were generated and used as response variable for PERMANOVA with 999 permutations. Pairwise comparisons were also conducted using the pairwise.perm.manova function of R package RVAideMemoire (Herve, 2018) with 999 permutations and a false discovery rate (FDR) of 5%.
The six retained environmental variables, for between lineage comparisons, were used in a PCA to obtain non-redundant PCs for variation partitioning of genetic and epigenetic variations explained by environment and geography. PCA was performed using the prcomp function of R. The first two PCs with eigenvalues >1 (PC1: 3.098; PC2: 1.687) explaining 51.63 and 28.12% of environmental variation were used in a redundancy analysis to assess the relative contribution of environmental variables explaining the total genetic and epigenetic variations using the varpart function of R package vegan, and significance tested using the anova.cca function with 999 permutations. AFLP, MSAP-m, and MSAP-u variations were, respectively, partitioned into four fractions explained by pure environmental variables (fraction [a]), geographically-structured environmental variables (fraction [b]), pure geographic variables (fraction [c]), and residual effects (fraction [d]) (Borcard et al., 1992; Borcard and Legendre, 2002), based on adjusted R2-values (Peres-Neto et al., 2006). Longitude and latitude of sample localities were used as geographic variables in the analysis.
To identify specific environmental variables significantly explaining the 32 FST outliers, forward selection was performed using the forward.sel function of R package packfor (Dray et al., 2016). The double-stopped criterion (Blanchet et al., 2008), i.e., selection stopped if either the conventional level of significance (α < 0.05) or the global adjusted R2 was exceeded, was applied in the selection procedure to prevent overestimation of the explained variance. The three categories of environmental variables were used separately in the forward selection analysis.
To further assess the relative importance of environmental variables influencing outlier genetic and epigenetic variations, functions within the R package MuMIn (Barton, 2018) were used. GLMM models mentioned above were used for the dredge function that fits all possible models for each outlier (response variable) and performed the subsequent model averaging analyses based on Akaike information criterion with a correction for small sample sizes (AICc) (ΔAICc ≤ 3, the model.avg function). AICc was used to rank the models and to calculate the Akaike weights for each model (Burnham and Anderson, 2002). A 95% confidence set of models was determined for each analysis performed and used to determine 95% CIs containing the best-approximating model to the best model conditioned on all parsimonious (ΔAICc ≤ 3) models. The relative importance of environmental variables contribution to explaining variations of outlier genetic and epigenetic loci was assessed using the importance function. The 95% CIs did not bracket zero were used to provide evidence for an association between the most important environmental variable (predictor) and the presence of a genetic or epigenetic outlier (response variable), and a marginal-R2 for the fixed effect of the most important environmental variable(s) explaining outlier variation was calculated using the r.squaredGLMM function.
Results
Correlation Between Genetic and Epigenetic Variation
In total, 1,413 and 462 loci were obtained, respectively, with a mean ± SD of 128.45 ± 10.46 and 57.75 ± 9.85, for AFLP and MSAP (Supplementary Table 1). We obtained 456 MSAP-m and 289 MSAP-u markers for the 462 MSAP loci. Mantel tests revealed significant correlations between genetic and epigenetic variations and also between the two types of epigenetic variation (AFLP vs. MSAP-m, Mantel r = 0.387, P < 0.001; AFLP vs. MSAP-u, Mantel r = 0.388, P < 0.001; and MSAP-m vs. MSAP-u, Mantel r = 0.680, P < 0.001).
Diversity, Differentiation, and Inbreeding
The number of private AFLP alleles was comparatively higher in populations of the Taiwanese lineage (Np ranged from 18 to 70; mean ± SD: 48.3 ± 19.60) than those of Yunnan-Myanmar (Np = 4) and Vietnamese (Np = 14) lineages (Table 1). A comparatively higher number of MSAP-m private alleles were found in the Yunnan-Myanmar lineage (Np = 13) compared with Vietnamese (Np = 0) and Taiwanese (Np ranged from 0 to 7, mean ± SD: 4 ± 2.61) lineages at the population level. The Yunnan-Myanmar and Vietnamese lineages had similar number of MSAP-u private alleles (Np = 12 and 14, respectively) compared to populations of Taiwanese lineage (Np ranged from 3 to 15, mean ± SD: 10 ± 4.47). The average percentage of polymorphism was comparatively higher in Taiwanese lineage compared with Yunnan-Myanmar and Vietnamese lineages (AFLP, MSAP-m, and MSAP-u, respectively, were 66.1, 59.0, and 49.3% in Taiwanese; 37.2, 49.6, 43.3% in Yunnan-Myanmar; and 37.4, 41.9, and 33.2% in Vietnamese lineages; Table 2). The %P and uHE indices were not positively dependent on population sample size based on Spearman's rank correlation test (%P: AFLP, ρ = −0.228, P = 0.588; MSAP-m, ρ = −0.084, P = 0.844; MSAP-u, ρ = −0.754, P = 0.031; uHE: AFLP, ρ = −0.753, P = 0.031; MSAP-m, ρ = −0.850, P = 0.007; MSAP-u, ρ = −0.539, P = 0.168).
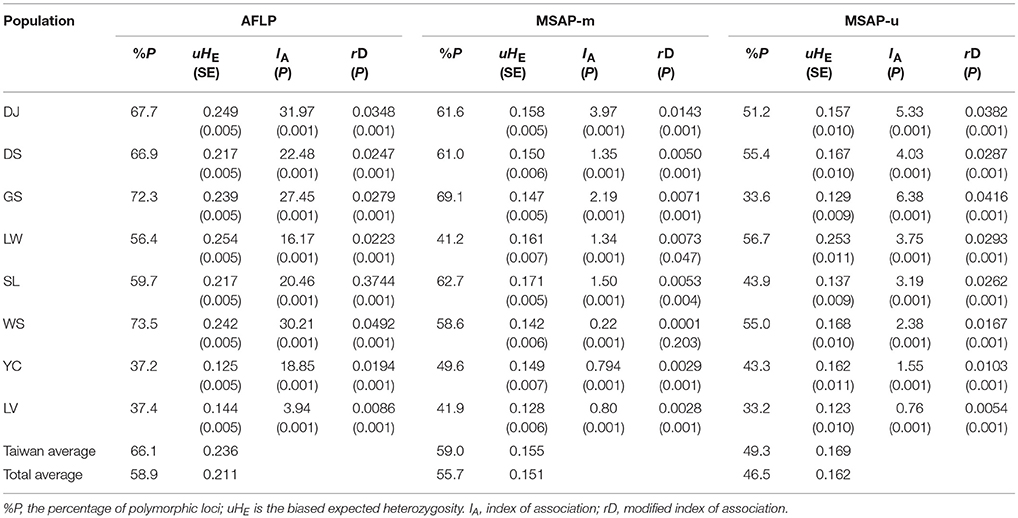
Table 2. Population genetic and epigenetic parameters of the eight populations of Taiwania.
The levels of uHE in Taiwanese populations ranged between 0.217 and 0.254 for AFLP, between 0.142 and 0.171 for MSAP-m, and between 0.129 and 0.253 for MSAP-u (Table 2). The levels of uHE of Yunnan-Myanmar lineage were 0.125, 0.149, and 0.162, respectively, for AFLP, MSAP-m, and MSAP-u. The levels of uHE in the Vietnamese lineage were 0.144, 0.128, and 0.123, respectively, for AFLP, MSAP-m, and MSAP-u. Significant differences were found between Taiwania lineages (LMMs; AFLP: χ2 = 1350.3, P < 0.0001; MSAP-m: χ2 = 49.76, P < 0.0001; MSAP-u: χ2 = 51.17, P < 0.0001). Post-hoc pairwise comparisons revealed significantly higher levels of AFLP, MSAP-m, and MSAP-u diversity in the Taiwanese lineage compared with the other two lineages, and significant differences in these diversity measures between the Yunnan-Myanmar and the Vietnamese lineages were also found (Supplementary Table 4). Moreover, the levels of genetic and epigenetic diversity were significantly different overall among Taiwania populations occurring in Taiwan (AFLP: χ2 = 215.69, P < 0.0001; MSAP-m: χ2 = 19.79, P = 0.0014; MSAP-u: χ2 = 43.38, P < 0.0001). However, not all pairwise population comparisons showed significant differences in the level of uHE (Supplementary Table 4).
AMOVA, FST, and HICKORY θII revealed consistent results in the levels of differentiation between lineages and between populations in all three datasets (AFLP, MSAP-m, and MSAP-u) analyzed using the total data (Table 3). The HICKORY results suggest that the full models fitted best to the data (AFLP, MSAP-m, and MSAP-u) based on DIC and D + pD values (Supplementary Table 5). We found moderate but significant levels of differentiation for AFLP and MSAP-u comparing between lineages and between populations according to AMOVA and θII (Table 3). However, low levels of differentiation, albeit significant, were found for MSAP-m, between lineages and between populations. Across lineage and across population FST showed similar trends of the level of differentiation as revealed in AMOVA and θII, however, with lower values. High levels of significant pairwise FST were found when compared between populations of Taiwanese lineage and populations of Yunnan-Myanmar and Vietnamese lineages (Supplementary Table 6). However, non-significant levels of pairwise population FST were found when only Taiwanese populations were compared.
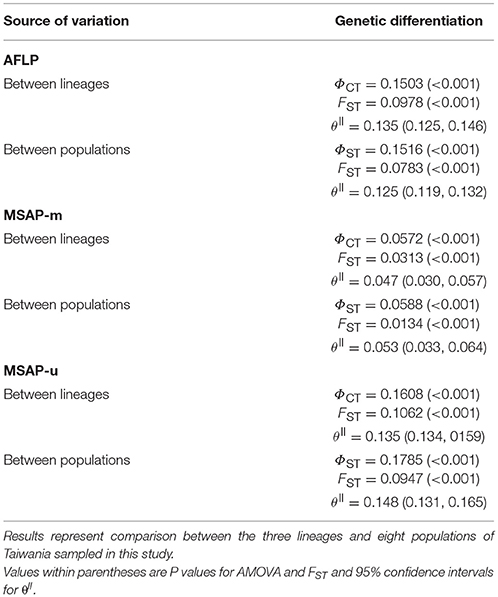
Table 3. Summary of the analysis of molecular variance (AMOVA), FST, and θII.
HICKORY was also used to assess the contemporary reproductive mode of Taiwania using the f-free model and results gave an estimate of f around 0.5 analyzed either at lineage or population level in all three datasets (Supplementary Table 5). IA and rD, the measures of multilocus LD, showed significant values departure from random association between loci of AFLP, of MSAP-m, and of MSAP-u (Table 2).
Population and Lineage Clustering
Population and lineage relationships were assessed using Neighbor-Net analysis (Figure 2). Genetic and epigenetic homogeneous groups of individuals were assessed using STRUCTURE, LEA, and DAPC (Supplementary Figure 4, Figures 3, 4). Neighbor-Net analysis consistently revealing the close relationship between Yunnan-Myanmar and Vietnamese lineages differentiated from Taiwanese populations based on AFLP, MSAP-m, and MSAP-u datasets (Figure 2). In the STRUCTURE analysis, the highest LnP(D) was, respectively, obtained at K = 6, 3, and 7, for AFLP, MSAP-m, and MSAP-u (Supplementary Figure 3A). However, the maximal ΔK occurred at K = 2 for all three datasets (Supplementary Figure 3B). SSC values were high (>0.997) for K = 2–3 in all three datasets and dropped when K = 4, particularly for MSAP-m and MSAP-u, but fluctuations in SSC values were observed at K = 5–9 (Supplementary Figure 3C). In the LEA analysis, CE was minimized at K = 4, 2, and 5, respectively, for AFLP, MSAP-m, and MSAP-u (Supplementary Figure 3D). LEA and STRUCTURE clustering results were depicted for K = 2–4 (Figure 3, Supplementary Figure 4, respectively) because K > 4 revealed no further information regarding to individual assignments for Taiwania samples examined. LEA and STRUCTURE analyses revealed a clear phylogeographic break distinguishing Taiwanese populations from Yunnan-Myanmar and Vietnamese lineages when K = 2 (island cluster: populations of Taiwanese lineage; mainland Asia cluster: populations of Yunnan-Myanmar and Vietnamese lineages). When K = 3 and 4, no further differentiation power between lineages was found based on AFLP and MSAP-m data. Nonetheless, LEA for MSAP-u showed differentiation between Yunnan-Myanmar and Vietnamese lineages at K = 4 (Figure 3).
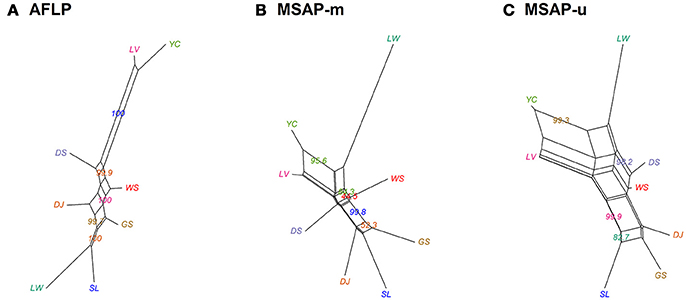
Figure 2. Neighbor-Net graph for the eight populations of Taiwania based on Nei's genetic distance, with bootstrap support values displayed. (A) AFLP, (B) MSAP-m, and (C) MSAP-u. See Table 1 for abbreviations of the eight populations of Taiwania.
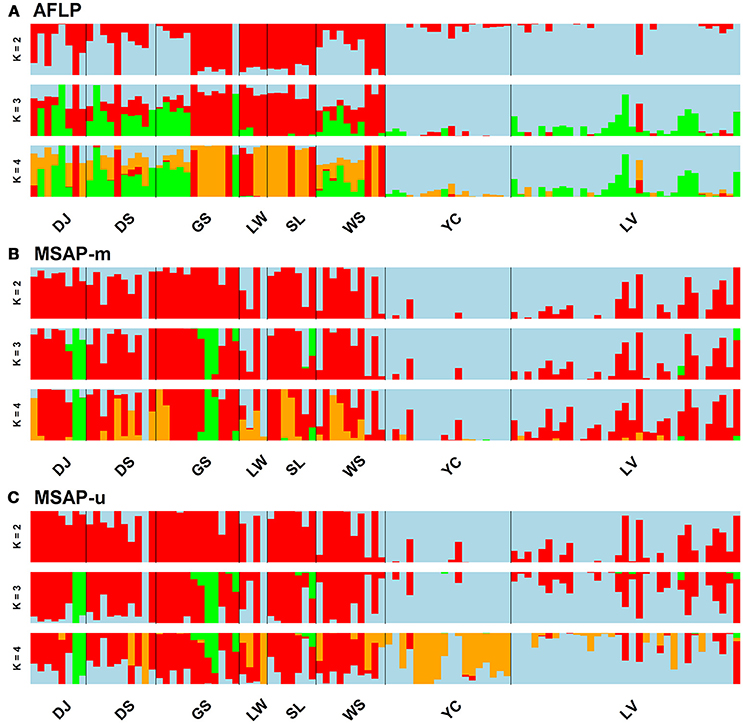
Figure 3. Individual assignments analyzed using LEA for clustering scenarios of K = 2–4. The subpanels display results analyzed based on the (A) AFLP, (B) MSAP-m, and (C) MSAP-u datasets, respectively. See Table 1 for abbreviations of the eight populations of Taiwania.
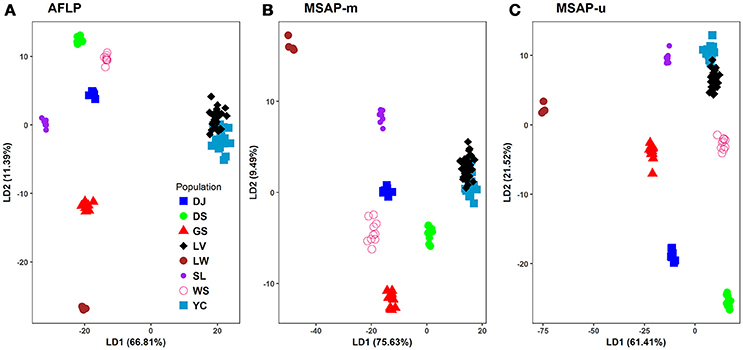
Figure 4. Scatter plots of the first two linear discriminants analyzed using discriminant analysis of principal components (DAPC). (A) AFLP, (B) MSAP-m, and (C) MSAP-u. See Table 1 for abbreviations of the eight populations of Taiwania.
In DAPC analysis, 90% of PCA variance in both genetic and epigenetic data was used in discriminant analysis. The PCA eigenvalues for the first two PCs were 5.28 and 2.32, 0.73 and 0.36, and 1.02 and 0.55, respectively for AFLP, MSAP-m, and MSAP-u. The eigenvalues for the first two DAPC linear discriminants were 6,141.35 and 1047.21, 4,364.64 and 547.77, and 5504.83 and 1929.34, respectively, for AFLP, MSAP-m, and MSAP-u. The amounts of genetic and epigenetic variation explained by the first two linear discriminants were, 66.81 and 11.39%, 75.63 and 9.49%, and 61.41 and 21.52%, respectively, for AFLP, MSAP-m, and MSAP-u (Figure 4). DAPC results also displayed close relationship between Yunnan-Myanmar and Vietnamese lineages in agreement with the Neighbor-Net, LEA, and STRUCTUTE results. However, varied phylogeographic relationships between Taiwanese populations were observed in DAPC in the AFLP, MSAP-m, and MSAP-u datasets. Nonetheless, DAPC also depicted clear differentiation of Taiwanese individuals from those of Yunnan-Myanmar and Vietnamese lineages genetically and epigenetically.
Partitioning Genetic and Epigenetic Variation Explained by Environment and Geography
Overall significant environmental heterogeneity, based on the six retained environmental variables (Supplementary Table 2), was found between the three Taiwania lineages using PERMANOVA (P = 0.001). Environmental heterogeneity was also found in pairwise lineage comparisons (all Ps = 0.001). Moreover, PERMANOVA revealed overall environmental heterogeneity based on the eight retained environmental variables when only the six populations of Taiwanese lineage were analyzed (P = 0.001). However, not all pairwise population comparisons showed significant environmental differences (Supplementary Table 3).
The six retained environmental variables, for the three Taiwania lineages, were analyzed with PCA. The first PC was used to assess the amounts of genetic and epigenetic information explained purely by environmental variables using variation partitioning. Because no significant amount of either genetic or epigenetic variation was found to be explained by the second environmental PC, we show here only the results analyzed for environmental PC1 (Table 4). Large amounts of genetic and epigenetic variations were unaccounted for in all three datasets. The total amount of variation explained by both environment and geography were, 11.23, 3.57, and 11.09%, respectively, for AFLP, MSAP-m, and MSAP-u. The portion of variation explained by pure geography independent of any environmental variables measured was larger compared to the portion explained by non-geographically structured environmental variables in all three datasets. Geography explained significant amount of genetic and epigenetic variations in all three datasets. Nonetheless, significant pure environmental effects, albeit small, were also found for AFLP and MSAP-u.
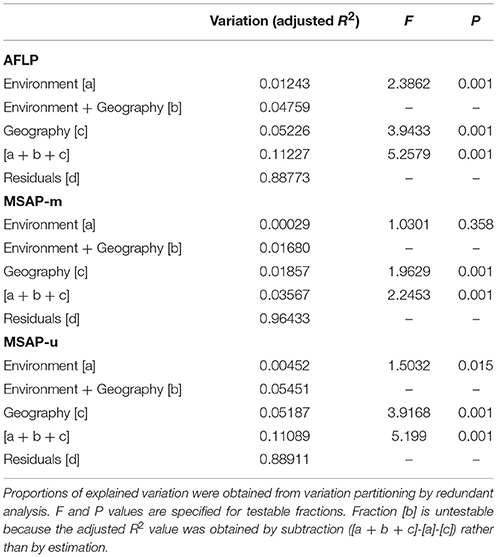
Table 4. The percentage of variation explained in genetic and epigenetic loci accounted for by non-geographically-structured environmental variables [a], shared (geographically-structured) environmental variables [b], pure geographic factors [c], and undetermined component [d] analyzed based on environmental PC1.
Potential Outliers Under Selection and the Most Important Environmental Factors Explaining Genetic and Epigenetic Variations
In total, 32 loci (15 AFLP, 1.06%; 4 MSAP-m, 0.88%; and 13 MSAP-u, 4.50%) were detected as potential outliers under selection based either on DFDIST or BAYESCAN (Table 5). Multiple univariate logistic regression using Samβada found these 32 potential outliers associated strongly with environmental variables in either global or pairwise lineage comparisons (Table 5). GLMM results showed 13 of 15 AFLP, 3 of 4 MASP-m, and 10 of 13 MSAP-u outliers were strongly associated with environmental variables either at 95 or 99% CIs (Table 5). Unexpectedly, neither genome scan methods (DFDIST and BAYESCAN) nor correlation based method (Samβada) found potential selective outliers for Taiwania populations within Taiwan in global and pairwise population comparisons, albeit PERMANOVA revealed significant environmental heterogeneity among populations.
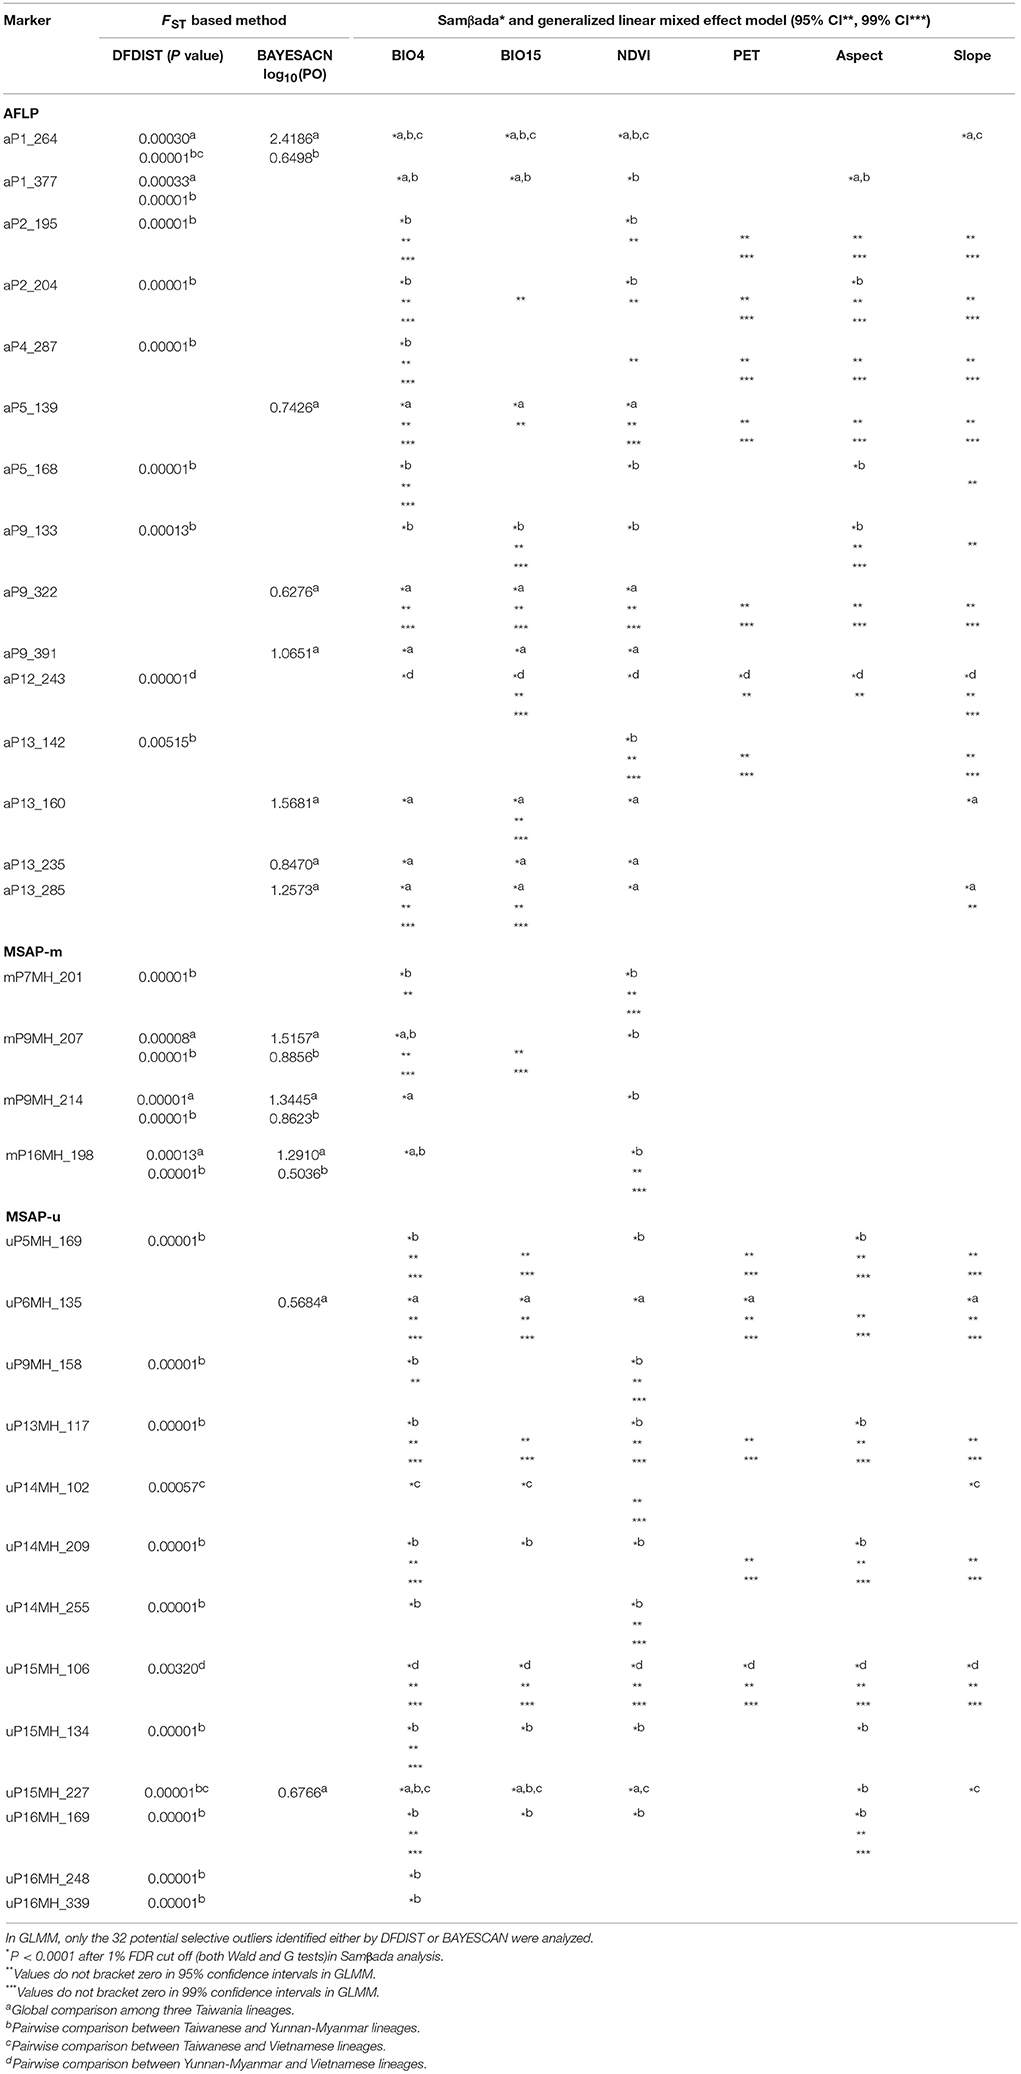
Table 5. Summary of outliers potentially evolved under selection identified by frequency based genome scan methods (DFDIST and BAYESCAN), generalized linear model (Samβada), and generalized linear mixed effect model (GLMM) based on AFLP, MSAP-m, MSAP-u datasets.
In forward selection, environmental variables were classified into three categories (i.e., bioclimate, ecology, and topology) considering the redundancy between variables in different categories in explaining genetic and epigenetic variations and also because of only small amounts of genetic and epigenetic variations attributed to pure environment in the variation partitioning analysis (Table 4). For all three datasets, forward selection showed that monthly temperature variation, NDVI, and aspect, respectively, was the most important bioclimatic, ecological, and topological factor explaining variation (Supplementary Table 7). Forward selection consistently found that environmental variables including monthly temperature variation, NDVI, and aspect significantly explained outlier genetic and epigenetic variations between Taiwania lineages.
Relative Importance of Environmental Variables Explaining Potential Selective Outliers
The 95% CIs for coefficients of environmental covariates which did not overlap with zero suggest individual environmental variables acted on potentially adaptive genetic and epigenetic loci (Table 6). Results showed that six, two, and two outlier AFLP, MSAP-m, and MSAP-u loci, respectively, were found to be strongly associated with environmental variables. The most commonly found important environmental variable explaining genetic and epigenetic variations was monthly temperature variation in agreement with the forward selection results (Supplementary Table 7). In the MuMIn results, monthly temperature variation was the most important explanatory factor for five AFLP (aP2_204, aP5_139, aP5_168, aP9_322, and aP13_142), two MSAP-m (mP9MH_214 and mP16MH_198), and one MSAP-u loci (uP15MH_134) (Table 6, Supplementary Table 8). MSAP-u locus uP14MH_102, with relative importance of 1.00, was found to be strongly correlated with NDVI (Supplementary Table 8). AFLP locus aP9_133 was strongly associated with all six environmental variables except monthly temperature variation, all with relative importance of 1.00. Population allele frequencies of the ten loci (six AFLP, two MSAP-m, and two MSAP-u) strongly associated with environmental variable(s) revealed by MuMIn are depicted in Figure 5.
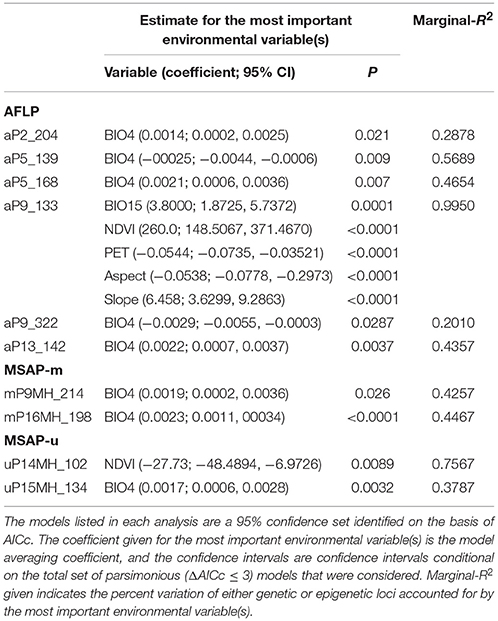
Table 6. Environmental variables strongly associated with genetic and epigenetic loci based on the model averaging (ΔAICc ≤ 3) using R package MuMIn.
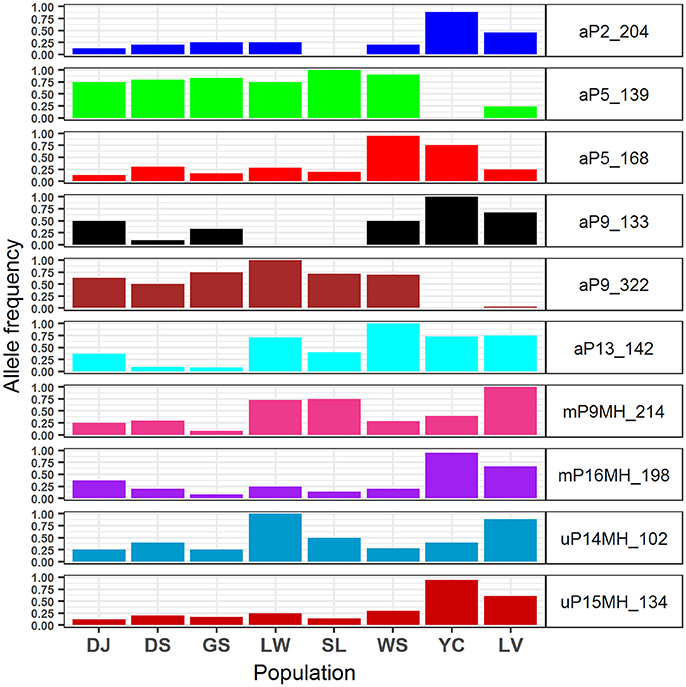
Figure 5. Allele frequencies of the 10 genetic and epigenetic loci strongly associated with environmental variables analyzed using model selection and a model averaging approach of MuMIn.
Within each lineage, the 32 potential selective outliers were subjected to two-locus exact test for LD (Supplementary Table 9). Strong LD was found between AFLP loci and also between AFLP and MSAP-m, between AFLP and MSAP-u, and between MSAP-m and MSAP-u. Interestingly, strong LD between AFLP and MSAP loci were essentially found within Taiwanese and Vietnamese lineages for loci that were revealed to be strongly associated with environmental variable(s) using MuMIn (Table 6, Supplementary Table 9).
Discussion
Interplay Between DNA Sequence Divergence and Methylation in Taiwania
DNA sequence divergence, random neutral events, or environmental gradients may play roles, alone or together, in contributing to epigenetic variation (Richards, 2006). In Taiwania, we found significant Mantel correlations between genetic and epigenetic variations and between methylated and unmethylated types of epigenetic variation. These results indicate not only partial dependence of epigenetic variation on DNA sequence variation, but also interactions between the two types of epigenetic variation, suggesting that such variation may mainly belong to the facilitated type of epigenetic variation proposed by Richards (2006). Interplay between sequence changes and methylation modifications could be involved in Taiwania lineage adaptive divergence as further suggested by strong LD (Supplementary Table 9) between AFLP and MSAP loci that have potentially evolved under selection (Tables 5, 6). Our results suggest environmental gradients such as monthly temperature variation (Table 6) could have critical impact on DNA sequence changes and the downstream influence on methylation pattern of potentially the same genes or linked loci, particularly within Taiwanese and Vietnamese lineages (Supplementary Table 9), which is consistent with other studies that suggest genetic-epigenetic interconnections (Richards, 2006, 2008; Bossdorf et al., 2008; Verhoeven et al., 2010; Schmitz et al., 2013; Silveira et al., 2013).
However, independence between epigenotypes and genotypes cannot be excluded, and a part of the genetic and epigenetic variation could be derived from drift-driven stochastic errors generated, respectively, via random sequence mutation and during the mitotic process independent of sequence divergence (Richards, 2008). In addition, epigenetic variation can be generated in parallel with no functional link to genetic variation (Richards et al., 2010).
Higher Diversity and Divergence Suggest Taiwanese Taiwania Could Be the Oldest Extant Taiwania Lineage
The Taiwanese and the Yunnan-Myanmar lineage diverged 3.23–3.41 Mya, whereas the Yunnan-Myanmar and the Vietnamese lineage diverged 1.0–1.39 Mya (Chou et al., 2011). Gene flow between conspecific island-mainland lineages is possible (e.g., between Cu. lanceolata and Cu. konishii, Hwang et al., 2003; Chung et al., 2004) and may result in lower than expected level of allopatric isolation (Otte and Endler, 1989; Losos and Ricklefs, 2009). In the present study, several lines of evidence (LEA, DAPC, and STRUCTURE; Figures 3, 4, Supplementary Figure 4), in agreement with the results based on cpDNA sequence variation (Chou et al., 2011), displayed distinct differentiation of Taiwanese individuals from those of mainland Asia lineages. Apparent incomplete lineage sorting of ancestral polymorphism between Yunnan-Myanmar and Vietnamese lineages was found based on the LEA, DAPC, and STRUCTURE results (Figures 3, 4, Supplementary Figure 4), however, a much lesser extent of incomplete lineage sorting of ancestral polymorphism between island and mainland Asia lineages was observed. Incomplete lineage sorting of ancestral polymorphism between the two mainland Asia lineages is also supported by the lower, albeit significant levels of genetic and epigenetic differentiation (Supplementary Table 6), in contrast to higher FST levels between island and mainland Asia lineages (Supplementary Table 6). Our results ruled out the hypotheses of recent divergence and extensive gene flow between island and mainland Asia lineages and supports an older divergence between the Taiwanese and the other two lineages as revealed in cpDNA study (Chou et al., 2011).
Our results suggest that most of the genetic and epigenetic variations in Taiwanese lineage is likely to have accumulated since divergence from the mainland Asia lineages 3.23–3.41 Mya. Taiwania in Taiwan could be the oldest extant lineage due to the higher values of the indices, including the percentage of polymorphism, average number of AFLP private allele, and average genetic and epigenetic diversity found in this lineage when compared to the mainland Asia lineages (Tables 1, 2). Although samples from south of Gaoligonshan were not surveyed for genetic and epigenetic variations in the present study, a much lower level of genetic diversity, based on inter-simple sequence repeats, was found compared with the Gaoligoshan population (HE, 0.0052 vs. 0.0316; Li Z.-C. et al., 2008). It is likely that Gaoligonshan population may harbor the main reservoir of genetic variation along the Yunnan-Myanmar border. Moreover, existing low levels of genetic diversity in mainland Asia lineages could be a consequence of small population sizes due to historical or recent bottlenecks and/or human disturbances. Nonetheless, the examined Gaoligonshan population may not be representative for Taiwania inhabiting large geographic area along the Yunnan-Myanmar border, therefore, evidence provided in the present study may not be conclusive and more complete sampling in the area is necessary for future research.
The Strong Population Nonadaptive and Environmentally Dependent Between-Lineage-Divergence in Taiwania
The question of what determines inter- and intra-specific divergence has long been a central issue in evolutionary biology. It is not uncommon that populations of conifers evolved by responding to environments (e.g., Mimura and Aitken, 2010; Grivet et al., 2011; Chen et al., 2012; Fang et al., 2013; Shih et al., 2018). However, neutral evolution could also have a strong effect on population and species divergence (Lynch, 2007; Wang et al., 2017). Two hypotheses might explain how populations diversify: selection driven and drift associated divergence (Leffler et al., 2012). Drift induced divergence is commonly associated with past demographic events (Barton, 1996; Comes et al., 2008) and selection driven divergence is emphasized by the strong association of genetic variation with environmental gradients (Schluter, 2001, 2009; Via, 2009; Barton, 2010). Our results of AMOVA, FST, and θII displayed overall significant differentiation (Table 3) among Taiwania populations, however, most pairwise FST between Taiwanese populations showed no significant AFLP differentiation (Supplementary Table 6). In addition, no potential selective outliers were detected using genome scan methods and also no correlation of allele frequencies of genetic and epigenetic loci with environmental gradients was found using Samβada. These results suggest that strong neutral drift acted on population differentiation within Taiwan.
In the present study, environmentally dependent selection between Taiwania lineages could be weak because only a small fraction of variation was explained purely by environments (Table 4), and also only a minor portion of AFLP and MSAP loci were identified as potential selective outliers (Table 5). In addition, only ten of the 32 potential selective outliers detected (six AFLP and two each for MSAP-m and MSAP-u) were found to be associated strongly with specific environmental factors (Table 6). These results also suggest that strong nonadaptive forces played important roles in shaping gene pool structure between lineages.
Substantially large amounts of unaccounted genetic and epigenetic variation (fraction [d], Table 4), which is typical for study integrating environmental features in multivariate analysis (Cottenie, 2005), suggest that fine-scale landscape heterogeneity among habitats might have played a crucial role in shaping divergence between lineages. The fine-scale landscape in habitats of the three lineages can differ greatly, albeit only two land cover types were revealed based on estimation using MODIS product MCD12Q1 of 2013 (Figure 1). Along the Yunnan-Myanmar border, Taiwania is associated mainly with Tsuga dumosa, Alnus nepalensis, Pinus yunnanensis, Manglietia insignis, and Cyclobalanopsis gambleana (He et al., 2015). In northern Vietnam it is mainly associated with Fokienia hodginsii with the forest being otherwise comprised of Fagaceae, Lauraceae, and Magnolia (Farjon and Thomas, 2007). In Taiwan it is associated with other conifers including Chamaecyparis obtusa var. formosana, Ch. formosensis, and Cu. konishii, but may also occur as scattered trees surrounded by broadleaved species of Fagaceae and Lauraceae (Fang et al., 1990; Huang et al., 1994). The differences in floristic compositions between habitats of Taiwania lineages suggest that landscape heterogeneity might have contributed to the large unaccounted genetic and epigenetic variations found using variation partitioning (Table 4). In addition, genetic and epigenetic variations of Taiwania may also be influenced by historical biogeographical processes (Ricklefs and Jenkins, 2011; Chen et al., 2017; Herrera et al., 2017; Richards et al., 2017).
In the present study, a large portion of total explained variation (fraction [a + b + c]) was attributed to geographically-structured environmental variables (Table 4), suggesting that interaction of environment and geography had crucial influence on genetic and epigenetic variations between lineages. The habitats of the lineages differ greatly in the complexity of floristic compositions, and local environments cannot be fully represented by the six retained environmental variables (Supplementary Table 2). Habitat association of genetic and epigenetic diversity with local environments is not uncommon (e.g., Lira-Medeiros et al., 2010; Latzel et al., 2013; Ma et al., 2018; Zoldoš et al., 2018) and it is likely that unmeasured environmental variables, constituting fine-scale microclimates, could also have impact on genetic and epigenetic variations, and may have played important roles in shaping Taiwania lineage divergence.
Monthly Temperature Variation and NDVI Could Be the Most Important Environmental Variables Driving Taiwania Lineage Divergence
Using the 32 potential outliers (Table 5), results of forward selection showed environmental variation, including monthly temperature variation, NDVI, and aspect, have an impact on outlier genetic and epigenetic variations (Supplementary Table 7). Moreover, analysis with model selection and a model averaging approach using MuMIn revealed strong correlations of nine potential selective outliers with either monthly temperature variation or NDVI (Table 6, Supplementary Table 8).
The values of monthly temperature variation were larger in Yunnan-Myanmar and Vietnamese lineage compared with populations of Taiwanese lineage (Supplementary Table 2). Allele frequencies of two outlier AFLP loci (aP5_139 and aP9_322) associated strongly with monthly temperature variation (Table 6), were found to be lower in the Vietnamese lineage and absent in the Yunnan-Myanmar lineage compared with Taiwanese populations (Figure 5). The accumulation of allele frequencies of aP5_139 and aP9_322 may have been driven by smaller fluctuations in temperature range in Taiwanese populations. In contrast, comparatively higher values of allele frequency of two AFLP (aP2_204 and aP9_133), one MSAP-m (mP16MH_198), and one MSAP-u (uP15MH_134) loci were found in Yunnan-Myanmar and Vietnamese lineages compared with Taiwanese populations. These loci were also found to be associated strongly with monthly temperature variation. Hence, differential values of allele frequency in genetic and epigenetic loci associated with monthly temperature variation suggest that different genetic and epigenetic loci responded differently to different amplitudes of temperature fluctuation in Taiwania, and they could have evolved by either positive or negative directional selection.
Moreover, genetic variation might have influenced the downstream methylation changes in response to monthly temperature variation as suggested by strong LD between pairs of genetic and epigenetic loci within Taiwanese lineage (aP5_139–mP9MH_214 and aP9_322–mP9MH_214) and within Vietnamese lineage (aP2_204–uP15MH_134, aP9_133–mP9MH_214, and aP9_322–uP15MH_134) (Supplementary Table 9) (Richards et al., 2017). However, in most Taiwanese populations, allele frequencies of the epigenetic loci that were identified as potentially having evolved under selection was found to be low (Figure 5). The homogenizing effect due to frequent gene flow as revealed by low and non-significant pairwise FST, particularly based on AFLP (Supplementary Table 6), could have a damping impact particularly on epigenetic loci despite overall environmental heterogeneity among Taiwanese populations. In addition, inbreeding within all Taiwania populations was likely (Supplementary Table 4) and significant non-random associations between loci within each population indicated by IA and rD (Table 2). These results suggest that mating between closely related individuals, probably due to population bottlenecks, may result in loss of alleles due to random drift (Ellstrand and Elam, 1993).
NDVI is a measure of surface coverage activity and has been shown to be correlated with intraspecific (Huang et al., 2015a; Chen et al., 2017) and interspecific adaptive divergence (Nakazato et al., 2010; Huang et al., 2015a). NDVI represents the level of vegetation greenness, a proxy to photosynthetic activity, and may be an influential factor acting on epigenetic variation (uP14MH_102) in response to interactions with other species in a local ecological community (Violle et al., 2012). Moreover, lower values of NDVI may correspond to higher allele frequency of uP14MH_102 in the population Liwusi of Taiwanese Taiwania and the Vietnamese population (Supplementary Table 2 and Figure 5). However, the relationship can be complex, intertwining with other habitat characteristics because low NDVI value was also found for population in Yunnan-Myanmar but with low uP14MH_102 allele frequency. The amount of evergreen conifer foliage may change with season (Gamon et al., 2016) or with disturbance. In Gaoligongshan (Yunnan-Myanmar) Taiwania thrives in unstable habitats subject to frequent landslides, and is dependent on disturbances or gap regeneration for recruitment (He et al., 2015). Under these conditions the extent of the vegetation cover may be dramatically altered. In contrast, habitats of Taiwanese populations have relatively stable conditions in mixed forests with open canopy (Fang et al., 1990; Huang et al., 1994). Such stable conditions are also thought to have been typical for the Vietnamese populations where it grows in dense and tall mixed forest stands and is associated mainly with F. hodginsii (Sano et al., 2009).
Our results suggest not only the individual environmental effects on genetic and epigenetic variations in Taiwania, but also that a probable combinatorial effect of certain environmental variables on genetic variation of an AFLP locus (aP9_133 locus). Higher allele frequency of aP9_133 was found in Yunnan-Myanmar and Vietnamese lineages in contrast to Taiwanese lineage (Figure 5), and aP9_133 was found to be strongly associated with a combinatorial effect of all six environmental variables excluding monthly temperature variation (Table 6). This AFLP locus was found to be linked strongly with MSAP mP9MH_214 (within Taiwanese lineage) and uP14MH_102 (within Vietnamese lineage) (Supplementary Table 9). No strong LD with epigenetic variation was found within Yunnan-Myanmar lineage, albeit high aP9_133 allele frequency was also found. This could be due to the smaller sample size collected (Excoffier and Slatkin, 1995). These results suggest that individual environmental variables may not act independently in shaping geographic distributions of genetic and epigenetic variations, and interdependencies of different environmental variables may exert direct and indirect effects on genetic and also the downstream epigenetic changes in Taiwania (Richards, 2006, 2008; Bossdorf et al., 2008; Verhoeven et al., 2010; Schmitz et al., 2013; Silveira et al., 2013).
Conclusions
Conservation genetics emphasizes the maintenance of the evolutionary capability of species adaptations to varying environments (Frankham et al., 2012). Genetic adaptation to environmental changes is crucial for the conservation and survival of species. In addition, ecologists are increasingly interested in epigenetic adaptations to different environments. Both genetic and epigenetic variations may be sources of variation which play a role in adapting to environmental heterogeneity and hence are important for understanding how environments shape natural population diversity in the face of global environmental changes. In the present study, we found that neutral evolution could have played a predominant role in shaping Taiwania population and lineage divergence. However, either genetic or epigenetic, or a combination may be driving lineage divergence in response to ecological niche differentiation (Li Y. et al., 2008; Herrera and Bazaga, 2010; Lira-Medeiros et al., 2010; Richards et al., 2012; Latzel et al., 2013; Huang et al., 2015a,b; Herrera et al., 2017; Ma et al., 2018) which may trigger speciation (Flatscher et al., 2012; Fernández-Mazuecos and Glover, 2017). Nonetheless, the drift-driven genetic and epigenetic variations may also have potential in adaptation to future climate changes in the different geographical regions that host the main extant Taiwania lineages.
Author Contributions
S-YH proposed, funded, and designed the research. PT, J-DC, and C-NW collected samples. Y-SL performed research. S-YH, Y-SL, and C-TC analyzed data. S-YH, Y-SL, C-TC, PT, and C-NW wrote the paper. All authors have read and approved the final manuscript.
Funding
This work was funded by the Taiwan Ministry of Science and Technology under grant number of MOST 106-2313-B-003-001-MY3. The Royal Botanical Garden Edinburgh is supported by the Scottish Government's Rural and Environment Science and Analytical Services Division.
Conflict of Interest Statement
The authors declare that the research was conducted in the absence of any commercial or financial relationships that could be construed as a potential conflict of interest.
Acknowledgments
The authors would like to thank the reviewers for their valuable comments and suggestions that greatly contributed to improving the quality of the paper. We particularly wish to thank one of the reviewer for critically reading the manuscript and suggesting substantial improvements.
Supplementary Material
The Supplementary Material for this article can be found online at: http://journal.frontiersin.org/article/10.3389/fpls.2018.01148/full#supplementary-material
Supplementary Figure 1. Correlation coefficients between environmental variables. (A) The eight retained environmental variables when only Taiwanese populations were compared and (B) the six retained environmental variables when Taiwania lineages were compared.
Supplementary Figure 2. Variance inflation factor (VIF) of environmental variables. Environmental variables were classified into bioclimate, ecology, and topology categories, and VIF calculated separately. VIFs were reported when only Taiwanese populations were considered (blue bars) or all populations were considered (pink bars).
Supplementary Figure 3. Indices for evaluation of clustering scenarios. (A) Mean log probability (LnP(D)), (B) change in the log probability (ΔK), (C) symmetric similarity coefficient (SSC) obtained from analysis using STRUCTURE, and (D) minimal cross-entropy (CE) analyzed using LEA.
Supplementary Figure 4. Individual assignments analyzed using STRUCTURE for clustering scenarios of K = 2–4. The subpanels display results analyzed based on the (A) AFLP, (B) MSAP-m, and (C) MSAP-u datasets, respectively. See Table 1 for abbreviations of the eight populations of Taiwania.
Supplementary Table 1. Primer combinations, number of markers, and error rate per locus in AFLP and MSAP techniques.
Supplementary Table 2. Site environmental variables of the eight populations of Taiwania. See Table 1 for abbreviations of the eight populations of Taiwania.
Supplementary Table 3. Pairwise comparisons of environmental differences for Taiwania populations occurring in Taiwan based on the eight retained environmental variables using permutational multivariate analysis of variance.
Supplementary Table 4. Results of post-hoc test for multiple comparisons of mean unbiased expected heterozygosity between lineages and between populations of Taiwania using linear mixed effect model. Lineage and population were treated as fixed effects and locus as a random effect.
Supplementary Table 5. The level of differentiation and inbreeding estimated using HICKORY based on genetic and epigenetic markers of Taiwania.
Supplementary Table 6. Pairwise FST between lineages and between populations of Taiwania using ARLEQUIN with 10,000 permutations.
Supplementary Table 7. Results of forward selection based on the 15 AFLP, 4 MSAP-m, and 13 MSAP-u outliers potentially evolved under selection. Environmental variables were classified into three categories, i.e., bioclimate, ecology, and topology, and analyzed separately.
Supplementary Table 8. The relative importance of the environmental variables acting as selective drivers of potentially genetic and epigenetic variations evaluating using AICc values (ΔAICc ≤ 3) using R package MuMIn. The models listed in each analysis are a 95% confidence set identified on the basis of AICc. Relative importance denotes the probability that a given environmental variable, among all parsimonious models considered, is in the model best approximating to the best model. All bold predictor variables have confidence intervals that do not include zero.
Supplementary Table 9. Linkage disequilibrium between outlier genetic and epigenetic loci using a two locus exact test implemented in ARLEQUIN, and significance determined by 10,000 permutations.
Data Sheet 1. Comma-separated value file for scored 1413 AFLP markers of the eight populations (n = 102) of Taiwania. The first three columns recorded the information of sample ID, lineage, and population. The rest of columns represent presence/absence of markers.
Data Sheet 2. Comma-separated value file for scored 456 MSAP-m markers of the eight populations (n = 102) of Taiwania. The first three columns recorded the information of sample ID, lineage, and population. The rest of columns represent presence/absence of markers.
Data Sheet 3. Comma-separated value file for scored 289 MSAP-u markers of the eight populations (n = 102) of Taiwania. The first three columns recorded the information of sample ID, lineage, and population. The rest of columns represent presence/absence of markers.
References
Agapow, P. M., and Burt, A. (2001). Indices of multilocus linkage disequilibrium. Mol. Ecol. Notes 1, 101–102. doi: 10.1046/j.1471-8278.2000.00014.x
Alberto, F. J., Aitken, S. N., Alía, R., González-Martínez, S. C., Hänninen, H., Kremer, A., et al. (2013). Potential for evolutionary responses to climate change – evidence from tree populations. Glob. Change Biol. 19, 1645–1661. doi: 10.1111/gcb.12181
Alonso, C., Pérez, R., Bazaga, P., and Herrera, C. M. (2015). Global DNA cytosine methylation as an evolving trait: phylogenetic signal and correlated evolution with genome size in angiosperms. Front. Genet. 6:4. doi: 10.3389/fgene.2015.00004
Antao, T., and Beaumont, M. A. (2011). Mcheza: a workbench to detect selection using dominant markers. Bioinformatics 27, 1717–1718. doi: 10.1093/bioinformatics/btr253
Barton, K. (2018). MuMIn: Multi-Model Inference. R Package Version 1.40.4. Available online at: https://CRAN.R-project.org/package=MuMIn
Barton, N. H. (1996). Natural selection and random genetic drift as causes of evolution on islands. Philos. Trans. R. Soc. Lond. B Biol. Sci. 351, 785–795. doi: 10.1098/rstb.1996.0073
Barton, N. H. (2010). What role does natural selection play in speciation? Philos. Trans. R. Soc. Lond. B Biol. Sci. 365, 1825–1840. doi: 10.1098/rstb.2010.0001
Bates, D., Maechler, M., Bolker, B., and Walker, S. (2015). Fitting linear mixed-effects models using lme4. J. Stat. Soft. 67, 1–48. doi: 10.18637/jss.v067.i01
Blanchet, F. G., Legendre, P., and Borcard, D. (2008). Forward selection of explanatory variables. Ecology 89, 2623–2632. doi: 10.1890/07-0986.1
Bonin, A., Bellemain, E., Bronken Eidesen, P., Pompanon, F., Brochmann, D., and Taberlet, P. (2004). How to track and assess genotyping errors in population genetics studies. Mol. Ecol. 13, 3261–3273. doi: 10.1111/j.1365-294X.2004.02346.x
Borcard, D., and Legendre, P. (2002). All-scale spatial analysis of ecological data by means of principal coordinates of neighbor matrices. Ecol. Model. 153, 51–68. doi: 10.1016/S0304-3800(01)00501-4
Borcard, D., Legendre, P., and Drapeau, P. (1992). Partialling out the spatial component of ecological variation. Ecology 73, 1045–1055. doi: 10.2307/1940179
Bossdorf, O., Richards, C. L., and Pigliucci, M. (2008). Epigenetics for ecologists. Ecol. Lett. 11, 106–115. doi: 10.1111/j.1461-0248.2007.01130.x
Brown, A. H., Feldman, M. W., and Nevo, E. (1980). Multilocus structure of natural populations of Hordeum spontaneum. Genetics 96, 523–536.
Bryant, D., and Moulton, V. (2004). Neighbor-Net: an agglomerative method for the construction of phylogenetic networks. Mol. Biol. Evol. 21, 255–265. doi: 10.1093/molbev/msh018
Burnham, K. P., and Anderson, D. R. (2002). Model Selection and Multimodel Inference: A Practical Information-Theoretic Approach. New York, NY: Springer-Verlag.
Chang, C.-T., Lin, T.-C., and Lin, N.-H. (2009). Estimating the critical load and the environmental and economic impact of acid deposition in Taiwan. J. Geogr. Sci. 56, 39–58.
Chang, C. T., Wang, S. F., Vadeboncoeur, M. A., and Lin, T. C. (2014). Relating vegetation dynamics to temperature and precipitation at monthly and annual timescales in Taiwan using MODIS vegetation indices. Int. J. Remote Sens. 35, 598–620. doi: 10.1080/01431161.2013.871593
Chen, J.-H., Huang, C.-L., Lai, Y.-L., Chang, C.-T., Liao, P.-C., Hwang, S.-Y., et al. (2017). Postglacial range expansion and the role of ecological factors in driving adaptive evolution of Musa basjoo var. formosana. Sci. Rep. 7:5341. doi: 10.1038/s41598-017-05256-6
Chen, J., Källman, T., Ma, X., Gyllenstrand, N., Zaina, G., Morgante, M., et al. (2012). Disentangling the roles of history and local selection in shaping clinal variation of allele frequencies and gene expression in Norway spruce (Picea abies). Genetics 191, 865–881. doi: 10.1534/genetics.112.140749
Chou, Y.-W., Thomas, P. I., Ge, X.-J., LePage, B. A., and Wang, C.-N. (2011). Refugia and phylogeography of Taiwania in East Asia. J. Biogeogr. 38, 1992–2005. doi: 10.1111/j.1365-2699.2011.02537.x
Chung, J.-D., Lin, T.-P., Tan, Y.-C., Lin, M.-Y., and Hwang, S.-Y. (2004). Genetic diversity and biogeography of Cunninghamia konishii (Cupressaceae), an island species in Taiwan: a comparison with Cunninghamia lanceolata, a mainland species in China. Mol. Phylogenet. Evol. 33, 791–801. doi: 10.1016/j.ympev.2004.08.011
Comes, H. P., Tribch, A., and Bittkau, C. (2008). Plant speciation in continental island floras as exemplified by Nigella in the Aegean Archipelago. Phils. Trans. R. Soc. Lond. B Biol. Sci. 363, 3083–3096. doi: 10.1098/rstb.2008.0063
Cottenie, K. (2005). Integrating environmental and spatial processes in ecological community dynamics. Ecol. Lett. 8, 1175–1182. doi: 10.1111/j.1461-0248.2005.00820.x.
Doyle, J. J., and Doyle, J. L. (1987). A rapid DNA isolation procedure from small quantities of fresh leaf material. Phytochem. Bull. 19, 11–15.
Dray, S., and Dufour, A.-B. (2007). The ade4 package: implementing the duality diagram for ecologists. J. Stat. Soft. 22, 1–20. doi: 10.18637/jss.v022.i04
Dray, S., Legendre, P., and Blanchet, G. (2016). Packfor: Forward Selection with Permutation (Canoco p.46). R Package Version 0.0-8/r136. Available online at: https://R-Forge.R-project.org/projects/sedar/
Ellstrand, N. C., and Elam, D. R. (1993). Population genetic consequences of small population size: implications for plant conservation. Annu. Rev. Ecol. System. 24, 217–242. doi: 10.1146/annurev.es.24.110193.001245
Evanno, G., Regnaut, S., and Goudet, J. (2005). Detecting the number of clusters of individuals using the software STRUCTURE: a simulation study. Mol. Ecol. 14, 2611–2620. doi: 10.1111/j.1365-294X.2005.02553.x
Excoffier, L., and Lischer, H. E. (2010). Arlequin suite ver 3.5: a new series of programs to perform population genetics analyses under Linux and Windows. Mol. Ecol. Resour. 10, 564–567. doi: 10.1111/j.1755-0998.2010.02847.x
Excoffier, L., and Slatkin, M. (1995). Maximum-likelihood estimation of molecular haplotype frequencies in a diploid population. Mol. Biol. Evol. 12, 921–927. doi: 10.1093/oxfordjournals.molbev.a040269
Falush, D., Stephens, M., and Pritchard, J. K. (2007). Inference of population structure using multilocus genotype data: dominant markers and null alleles. Mol. Ecol. Notes 7, 574–578. doi: 10.1111/j.1471-8286.2007.01758.x
Fang, J.-Y., Chung, J.-D., Chiang, Y.-C., Chang, C.-T., Chen, C.-Y., and Hwang, S.-Y. (2013). Divergent selection and local adaptation in disjunct populations of an endangered conifer, Keteleeria davidiana var. formosana (Pinaceae). PLoS ONE 8:e70162. doi: 10.1371/journal.pone.0070162
Fang, Y.-K., Chiu, L.-Y., Liao, T.-S., and Lin, H.-C. (1990). Study on the shade tolerance of tree seedlings (I) effect of shade on the growth of Cunninghamia lanceolata var. konishii f. konishii and Taiwania crypomerioides seedling. Bull. Expt. Dept. NCHU. 12, 89–106.
Farjon, A., and Thomas, P. (2007). “Taiwania cryptomerioides, an overview: biogeography and conservation,” in Proceedings of the International Symposium on Taiwania Cryptomerioides, ed C. L. Lee (Nantou: The Experimental Forest, National Taiwan University), 9–17.
Fernández-Mazuecos, M., and Glover, B. J. (2017). The evo-devo of plant speciation. Nat. Ecol. Evol. 1:0110. doi: 10.1038/s41559-017-0110
Flatscher, R., Frajman, B., Schönswetter, P., and Paun, O. (2012). Environmental heterogeneity and phenotypic divergence: can heritable epigenetic variation aid speciation? Genet. Res. Int. 2012:698421. doi: 10.1155/2012/698421
Foll, M., and Gaggiotti, O. (2008). A genome scan method to identify selected loci appropriate for both dominant and codominant markers: a Bayesian perspective. Genetics 180, 977–993. doi: 10.1534/genetics.108.092221
Fox, J., and Weisberg, S. (2011). An {R} Companion to Applied Regression, 2nd Edn. Thousand Oaks, CA: Sage. Available online at: http://socserv.socsci.mcmaster.ca/jfox/Books/Companion
Francis, R. M. (2017). pophelper: an R package and web app to analyse and visualize population structure. Mol. Ecol. Resour. 17, 27–32. doi: 10.1111/1755-0998.12509
Frankham, R., Ballou, J. D., Dudash, M. R., Eldridge, M. D. B., Fenster, C. B., Lacy, R. C., et al. (2012). Implications of different species concepts for conserving biodiversity. Biol. Conser. 153, 25–31. doi: 10.1016/j.biocon.2012.04.034
Frichot, E., and Francois, O. (2015). LEA: an R package for landscape and ecological association studies. Methods Ecol. Evol. 6, 925–929. doi: 10.1111/2041-210X.12382
Friedl, M. A., Sulla-Menashe, D., Tan, B., Schneider, A., Ramankutty, N., Sibley, A., et al. (2010). MODIS collection 5 global land cover: algorithm refinements and characterization of new datasets. Remote Sens. Environ. 114, 168–182. doi: 10.1016/j.rse.2009.08.016
Gamon, J. A., Huemmrich, K. F., Wong, C. Y., Ensminger, I., Garrity, S., Hollinger, D. Y., et al. (2016). A remotely sensed pigment index reveals photosynthetic phenology in evergreen conifers. Proc. Natl. Acad. Sci. U.S.A. 113, 13087–13092. doi: 10.1073/pnas.1606162113
Govindaraju, D. R. (1989). Estimates of gene flow in forest trees. Biol. J. Linnean Soc. 37, 345–357. doi: 10.1111/j.1095-8312.1989.tb01910.x
Grivet, D., Sebastiani, F., Alía, R., Bataillon, T., Torre, S., Zabal-Aguirre, M., et al. (2011). Molecular footprints of local adaptation in two mediterranean conifers. Mol. Biol. Evol. 28, 101–116. doi: 10.1093/molbev/msq190
He, L.-Y., Tang, C.-Q., Wu, Z.-L., Wang, H.-C., Ohsawa, M., and Yan, K. (2015). Forest structure and regeneration of the Tertiary relict Taiwania cryptomerioides in the Gaoligong mountains, Yunnan, southwest China. Phytocoenologia 45, 135–156. doi: 10.1127/phyto/2015/0038
Herrera, C. M., and Bazaga, P. (2010). Epigenetic differentiation and relationship to adaptive genetic divergence in discrete populations of the violet Viola cazorlensis. New Phytol. 187, 867–876. doi: 10.1111/j.1469-8137.2010.03298.x
Herrera, C. M., Mendrano, M., and Bazaga, P. (2017). Comparative epigenetic and genetic spatial structure of the perennial herb Helleborus foetidus: isolation by environment, isolation by distance, and functional trait divergence. Am. J. Bot. 104, 1–10. doi: 10.3732/ajb.1700162
Herve, M. (2018). RVAideMemoire: Testing and Plotting Procedures for Biostatistics. R Package Version 0.9-69. Available online at: https://CRAN.R-project.org/package=RVAideMemoire
Hijmans, R. J., Cameron, S. E., Parra, J. L., Jones, P. G., and Jarvis, A. (2005). Very high resolution interpolated climate surfaces for global land areas. Int. J. Climatol. 25, 1965–1978. doi: 10.1002/joc.1276
Hipkins, V. D., Krutovskii, K. V., and Strauss, S. H. (1994). Organelle genomes in conifers: structure, evolution, and diversity. For. Genet. 1, 179–189.
Holsinger, K. E., and Lewis, P. O. (2003). Hickory: a Package for Analysis of Population Genetic Data v1.1. Available online at: http://www.academia.edu/1839794/
Huang, C.-L., Chang, C.-T., Huang, B.-H., Chung, J.-D., Chen, J.-H., Chiang, Y.-C., et al. (2015a). Genetic relationships and ecological divergence in Salix species and populations in Taiwan. Tree Genet. Genomes 11:39. doi: 10.1007/s11295-015-0862-1
Huang, C.-L., Chen, J.-H., Tsang, M.-H., Chung, J.-D., Chang, C.-T., and Hwang, S.-Y. (2015b). Influences of environmental and spatial factors on genetic and epigenetic variations in Rhododendron oldhamii (Ericaceae). Tree Genet. Genomes 11, 823. doi: 10.1007/s11295-014-0823-0
Huang, T.-C., Shieh, W.-C., Keng, H., Tsai, J.-L., Hu, J.-M., Shen, C.-F., et al. (1994). “Taiwania Hayata” in Flora of Taiwan, 2nd Edn, ed. Editorial Committee of the Flora of Taiwan (Taipei: Epoch Publishing Co. Ltd.), 584–585.
Huete, A. R., Didan, K., Miura, T., Rodriguez, E. P., Gao, X., and Ferreira, L. G (2002). Overview of the radiometric and biophysical performance of the MODIS vegetation indices. Remote Sens. Environ. 83, 195–213. doi: 10.1016/S0034-4257(02)00096-2
Hwang, S.-Y., Lin, T.-P., Ma, C.-S., Lin, C.-L., Chung, J.-D., and Yang, J.-C. (2003). Postglacial population growth of Cunninghamia konishii (Cupressaceae) inferred from phylogeographical and mismatch analysis of chloroplast DNA variation. Mol. Ecol. 12, 2689–2695. doi: 10.1046/j.1365-294X.2003.01935.x
Jakobsson, M., and Rosenberg, N. A. (2007). CLUMPP: a cluster matching and permutation program for dealing with label switching and multimodality in analysis of population structure. Bioinformatics 23, 1801–1806. doi: 10.1093/bioinformatics/btm233
Johnson, L. J., and Tricker, P. J. (2010). Epigenomic plasticity within populations: its evolutionary significance and potential. Heredity 105, 113–121. doi: 10.1038/hdy.2010.25
Jombart, T., and Ahmed, I. (2011). adegenet 1.3-1: new tools for the analysis of genome-wide SNP data. Bioinformatics 27, 3070–3071. doi: 10.1093/bioinformatics/btr521
Jombart, T., Devillard, S., and Balloux, F. (2010). Discriminant analysis of principal components: a new method for the analysis of genetically structured populations. BMC Genet. 11:94. doi: 10.1186/1471-2156-11-94
Kamvar, Z. N., Brooks, J. C., and Grünwald, N. J. (2015). Novel R tools for analysis of genome-wide population genetic data with emphasis on clonality. Front. Genet. 6:208. doi: 10.3389/fgene.2015.00208
Latzel, V., Allan, E., Bortolini Silveira, A., Colot, V., Fischer, M., and Bossdorf, O. (2013). Epigenetic diversity increases the productivity and stability of plant populations. Nat. Commu. 4:2875. doi: 10.1038/ncomms3875
Leffler, E. M., Bullaughey, K., Matute, D. R., Meyer, W. K., Ségurel, L., Venkat, A., et al. (2012). Revisiting an old riddle: what determines genetic diversity levels within species? PLoS Biol. 10:e1001388. doi: 10.1371/journal.pbio.1001388
Lenth, R. V. (2016). Least-Squares Means: the R package lsmeans. J. Stat. Soft. 69, 1–33. doi: 10.18637/jss.v069.i01
LePage, B. A. (2009). Earliest occurrence of Taiwania (Cupressaceae) from the early cretaceous of Alaska: evolution, biogeography, and paleoecology. Proc. Acad. Nat. Sci. Philad. 158, 129–158. doi: 10.1635/053.158.0107
Li, Y., Shan, X., Liu, X., Hu, L., Guo, W., and Liu, B. (2008). Utility of the methylationsensitive amplified polymorphism (MSAP) marker for detection of DNA methylation polymorphism and epigenetic population structure in a wild barley species (Hordeum brevisubulatum). Ecol. Res. 23, 927–930. doi: 10.1007/s11284-007-0459-8
Li, Z.-C., Wang, X.-L., and Ge, X.-J. (2008). Genetic diversity of the relict plant Taiwania cryptomerioides Hayata (Cupressaceae) in mainland China. Silvae Genet. 57, 242–249. doi: 10.1515/sg-2008-0037
Lira-Medeiros, C. F., Parisod, C., Fernandes, R. A., Mata, C. S., Cardoso, M. A., and Ferreira, P. C. G. (2010). Epigenetic variation in mangrove plants occurring in contrasting natural environments. PLoS ONE 5:e10326. doi: 10.1371/journal.pone.0010326
Lobréaux, S., and Melodelima, C. (2015). Detection of genomic loci associated with environmental variables using generalized linear mixed models. Genomics 105, 69–75. doi: 10.1016/j.ygeno.2014.12.001
Losos, J. B., and Ricklefs, R. E. (2009). Adaptation and diversification on islands. Nature 457, 830–836. doi: 10.1038/nature07893
Lynch, M. (2007). The frailty of adaptive hypotheses for the origins of organismal complexity. Proc. Natl. Acad. Sci. U.S.A. 104, 8597–8604. doi: 10.1073/pnas.0702207104
Ma, K., Sun, L., Cheng, T., Pan, H., Wang, J., and Zhang, Q. (2018). Epigenetic variance, performing cooperative structure with genetics, is associated with leaf shape traits in widely distributed populations of ornamental tree Prunus mume. Front. Plant Sci. 9:41. doi: 10.3389/fpls.2018.00041
Mimura, M., and Aitken, S. N. (2010). Local adaptation at the range peripheries of Sitka spruce. J. Evol. Biol. 23, 249–258. doi: 10.1111/j.1420-9101.2009.01910.x
Naimi, B., Hamm, N. A. S., Groen, T. A., Skidmore, A. K., and Toxopeus, A. G. (2014). Where is positional uncertainty a problem for species distribution modelling? Ecography 37, 191–203. doi: 10.1111/j.1600-0587.2013.00205.x
Nakazato, T., Warren, D. L., and Moyle, L. C. (2010). Ecological and geographic modes of species divergence in wild tomatoes. Am. J. Bot. 97, 680–693. doi: 10.3732/ajb.0900216
Neale, D. B., Marshall, K. A., and Harry, D. E. (1991). Inheritance of chloroplast and mitochondrial DNA in incense-cedar (Calocedrus decurrens). Can. J. For. Res. 21, 717–720. doi: 10.1139/x91-100
Nei, M. (1978). Estimation of average heterozygosity and genetic distance from a small number of individuals. Genetics 23, 341–369.
Nguyen, T. B. (2007). Red Data Book of Vietnam. Vol. 2: Plants. Hanoi: Science and Technics Publishing House.
Oksanen, J., Blanchet, F. G., Friendly, M., Kindt, R., Legendre, P., McGlinn, D., et al. (2017). vegan: Community Ecology Package. R Package Version 2.4-2. Available online at: https://CRAN.R-project.org/package=vegan
Peres-Neto, P. R., Legendre, P., Dray, S., and Borcard, D. (2006). Variation partitioning of species data matrices: estimation and comparison of fractions. Ecology 87, 2614–2625. doi: 10.1890/0012-9658(2006)87[2614:VPOSDM]2.0.CO;2
Pérez-Figueroa, A., García-Pereira, M. J., Saura, M., Rolán-Alvarez, E., and Caballero, A. (2010). Comparing three different methods to detect selective loci using dominant markers. J. Evol. Biol. 23, 2267–2276. doi: 10.1111/j.1420-9101.2010.02093.x
Pritchard, J. K., Stephens, M., and Donnelly, P. (2000). Inference of population structure using multilocus genotype data. Genetics 155, 945–959.
Raeymaekers, J. A. M., Chaturvedi, A., Hablützel, P. I., Vedonck, I., Hellemans, B., Maes, G. E., et al. (2017). Adaptive and non-adaptive divergence in a common landscape. Nat. Commu. 8:267. doi: 10.1038/s41467-017-00256-6
R Development Core Team (2017). R: a Language and Environment for Statistical Computing. Version 3.0.0. Vienna: R Foundation for Statistical Computing. Available online at: https://www.r-project.org/
Richards, C. L., Alonso, C., Becker, C., Bossdorf, O., Bucher, E., Colomé-Tatché, M., et al. (2017). Ecological plant epigenetics: evidence from model and non-model species, and the way forward. Ecol. Lett. 20, 1576–1590. doi: 10.1111/ele.12858
Richards, C. L., Bossdorf, O., and Verhoeven, K. J. (2010). Understanding natural epigenetic variation. New Phytol. 187, 562–564. doi: 10.1111/j.1469-8137.2010.03369.x
Richards, C. L., Schrey, A. W., and Pigliucci, M. (2012). Invasion of diverse habitats by few Japanese knotweed genotypes is correlated with epigenetic differentiation. Ecol. Lett. 15, 1016–1025. doi: 10.1111/j.1461-0248.2012.01824.x
Richards, E. J. (2006). Inherited epigenetic variation – revisiting soft inheritance. Nat. Rev. Genet. 7, 395–401. doi: 10.1038/nrg1834
Richards, E. J. (2008). Population epigenetics. Curr. Opin. Genet. Dev. 18, 221–226. doi: 10.1016/j.gde.2008.01.014
Ricklefs, R. E., and Jenkins, D. G. (2011). Biogeography and ecology: towards the integration of two disciplines. Phil. Trans. R. Soc. B, 366, 2438–2448. doi: 10.1098/rstb.2011.0066
Rundell, R. J., and Price, T. D. (2009). Adaptive radiation, nonadaptive radiation, ecological speciation and nonecological speciation. Trends Ecol. Evol. 24, 394–399. doi: 10.1016/j.tree.2009.02.007
Sano, M., Buckley, B. M., and Sweda, T. (2009). Tree-ring based hydroclimate reconstruction over northern Vietnam from Fokienia hodginsii: eighteenth century meag-drought and tropical Pacific influence. Clim. Dyn. 33, 331–340. doi: 10.1007/s00382-008-0454-y
Santiso, X., Lopez, L., Retuerto, R., and Barreiro, R. (2016). Population structure of a widespread species under balancing selection: the case of Arbutus unedo L. Front. Plant Sci. 6:1264. doi: 10.3389/fpls.2015.01264
Savolainen, O., Lascoux, M., and Merilä, J. (2013). Ecological genomics of local adaptation. Nat. Rev. Genet. 14, 807–820. doi: 10.1038/nrg3522
Schliep, K. P. (2011). Phangorn: phylogenetic analysis in R. Bioinformatics 27, 592–593. doi: 10.1093/bioinformatics/btq706
Schliep, K., Potts, A. J., Morrison, D. A., and Grimm, G. W. (2017). Intertwining phylogenetic trees and networks. Methods Ecol. Evol. 8, 1212–1220. doi: 10.1111/2041-210X.12760
Schluter, D. (2001). Ecology and the origin of species. Trends Ecol. Evol. 16, 372–380. doi: 10.1016/S0169-5347(01)02198-X
Schluter, D. (2009). Evidence for ecological speciation and its alternative. Science 323, 737–741. doi: 10.1126/science.1160006
Schmitz, R. J., Schultz, M. D., Urich, M. A., Nery, J. R., Pelizzola, M., Libiger, O., et al. (2013). Patterns of population epigenomic diversity. Nature 495, 193–198. doi: 10.1038/nature11968
Schulz, B., Eckstein, R. L., and Durka, W. (2013). Scoring and analysis of methylation-sensitive amplification polymorphisms for epigenetic population studies. Mol. Ecol. Resour. 134, 642–653. doi: 10.1111/1755-0998.12100
Shih, K.-M., Chang, C.-T., Chung, J.-D., Chiang, Y.-C., and Hwang, S.-Y. (2018). Adaptive genetic divergence despite significant isolation-by-distance in populations of Taiwan Cow-tail fir (Keteleeria davidiana var. formosana). Front. Plant Sci. 9:92. doi: 10.3389/fpls.2018.00092
Silveira, A. B., Trontin, C., Cortijo, S., Barau, J., Del Bem, L. E., Loudet, O., et al. (2013). Extensive natural epigenetic variation at a de novo originated gene. PLoS Genet. 9:e1003437. doi: 10.1371/journal.pgen.1003437
Stucki, S., Orozco-terWengel, P., Bruford, M. W., Colli, L., Masembe, C., Negrini, R., et al. (2017). High performance computation of landscape genomic models integrating local indices of spatial association. Mol. Ecol. Resour. 17, 1072–1089. doi: 10.1111/1755-0998.1262
Thornthwaite, C. W. (1948). An approach toward a rational classification of climate. Geogr. Rev. 38, 55–94.
Vekemans, X., Beauwens, T., Lemaire, M., and Roldán-Ruiz, I. (2002). Data from amplified fragment length polymorphism (AFLP) markers show indication of size homoplasy and of a relationship between degree of homoplasy and fragment size. Mol. Ecol. 11, 139–151. doi: 10.1046/j.0962-1083.2001.01415.x
Verhoeven, K. J., Jansen, J. J., van Dijk, P. J., and Biere, A. (2010). Stress-induced DNA methylation changes and their heritability in asexual dandelions. New Phyto. 185, 1108–1118. doi: 10.1111/j.1469-8137.2009.03121.x
Via, S. (2009). Natural selection in action during speciation. Proc. Natl. Acad. Sci. U.S.A. 106, 9939–9946. doi: 10.1073/pnas.0901397106
Villota-Salazar, N. A., Mendoza-Mendoza, A., and González-Prieto, J. M. (2016). Epigenetics: from past to the present. Front. Life Sci. 9, 347–370. doi: 10.1080/21553769.2016.1249033
Violle, C., Enquist, B. J., McGill, B. J., Jiang, L., Albert, C. H., Hulshof, C., et al. (2012). The return of the variance: intraspecific variability in community ecology. Trends Ecol. Evol. 27, 244–252. doi: 10.1016/j.tree.2011.11.014
Vos, P., Hogers, R., Bleeker, M., Reijans, M., van der Lee, T., Hornes, M., et al. (1995). AFLP: a new technique for DNA fingerprinting. Nucl. Acids Res. 23, 4407–4414. doi: 10.1093/nar/23.21.4407
Wang, J., Feng, C., Jiao, T., Von Wettberg, E. B., and Kang, M. (2017). Genomic signatures of adaptive divergence despite strong nonadaptive forces on edaphic islands: a case study of Primulina juliae. Genome Biol. Evol. 9, 3495–3508. doi: 10.1093/gbe/evx263
Whipple, A. V., and Holeski, L. M. (2016). Epigenetic inheritance across the landscape. Front. Genet. 7:189. doi: 10.3389/fgene.2016.00189
Xiong, L. Z., Xu, C. G., Saghai Maroof, M. A., and Zhang, Q. (1999). Patterns of cytosine methylation in an elite rice hybrid and its parental lines, detected by a methylation-sensitive amplification polymorphism technique. Mol. Gen. Genet. 261, 439–446. doi: 10.1007/s004380050986
Yang, A.-H., Wei, N., Fritsch, P. W., and Yao, X.-H. (2016). AFLP genome scanning reveals divergent selection in natural populations of Liriodendron chinese (Magnoliaceae) along a latitudinal transect. Font. Plant Sci. 7:698. doi: 10.3389/fpls.2016.00698
Zhivotovsky, L. A. (1999). Estimating population structure in diploids with multilocus dominant DNA markers. Mol. Ecol. 8, 907–913. doi: 10.1046/j.1365-294x.1999.00620.x
Keywords: adaptive divergence, epigenetic variation, genetic variation, nonadaptive divergence, Taiwania cryptomerioides
Citation: Li Y-S, Chang C-T, Wang C-N, Thomas P, Chung J-D and Hwang S-Y (2018) The Contribution of Neutral and Environmentally Dependent Processes in Driving Population and Lineage Divergence in Taiwania (Taiwania cryptomerioides). Front. Plant Sci. 9:1148. doi: 10.3389/fpls.2018.01148
Received: 01 May 2018; Accepted: 18 July 2018;
Published: 08 August 2018.
Edited by:
Tian Tang, Sun Yat-sen University, ChinaReviewed by:
Linfeng Li, Washington University in St. Louis, United StatesManuela Winkler, Universität für Bodenkultur Wien, Austria
Copyright © 2018 Li, Chang, Wang, Thomas, Chung and Hwang. This is an open-access article distributed under the terms of the Creative Commons Attribution License (CC BY). The use, distribution or reproduction in other forums is permitted, provided the original author(s) and the copyright owner(s) are credited and that the original publication in this journal is cited, in accordance with accepted academic practice. No use, distribution or reproduction is permitted which does not comply with these terms.
*Correspondence: Shih-Ying Hwang, hsy9347@ntnu.edu.tw
† These authors have contributed equally to this work