 Thomas M. Adams1,2†‡
 Andrew D. Armitage1†‡
 Maria K. Sobczyk1†‡Helen J. Bates1†
 Javier F. Tabima3†Brent A. Kronmiller4†
 Brett M. Tyler3,4†
 Niklaus J. Grünwald5†
 Jim M. Dunwell2†
 Charlotte F. Nellist1*†
 Richard J. Harrison1,6†
- 1Department of Genetics, Genomics and Breeding, NIAB EMR, Kent, United Kingdom
- 2School of Agriculture, Policy and Development, University of Reading, Reading, United Kingdom
- 3Department of Botany and Plant Pathology, Center for Genome Biology and Biocomputing, Oregon State University, Corvallis, OR, United States
- 4Center for Genome Biology and Biocomputing, Oregon State University, Corvallis, OR, United States
- 5Horticultural Crops Research Unit, Agricultural Research Service, United States Department of Agriculture, Corvallis, OR, United States
- 6NIAB Cambridge Crop Research, NIAB, Cambridge, United Kingdom
The oomycete Phytophthora fragariae is a highly destructive pathogen of cultivated strawberry (Fragaria × ananassa), causing the root rotting disease, “red core”. The host-pathogen interaction has a well described gene-for-gene resistance relationship, but to date neither candidate avirulence nor resistance genes have been identified. We sequenced a set of American, Canadian, and United Kingdom isolates of known race type, along with three representatives of the closely related pathogen of the raspberry (Rubus idaeus), P. rubi, and found a clear population structure, with a high degree of nucleotide divergence seen between some race types and abundant private variation associated with race types 4 and 5. In contrast, between isolates defined as United Kingdom races 1, 2, and 3 (UK1-2-3) there was no evidence of gene loss or gain; or the presence of insertions/deletions (INDELs) or Single Nucleotide Polymorphisms (SNPs) within or in proximity to putative pathogenicity genes could be found associated with race variation. Transcriptomic analysis of representative UK1-2-3 isolates revealed abundant expression variation in key effector family genes associated with pathogen race; however, further long read sequencing did not reveal any long range polymorphisms to be associated with avirulence to race UK2 or UK3 resistance, suggesting either control in trans or other stable forms of epigenetic modification modulating gene expression. This work reveals the combined power of population resequencing to uncover race structure in pathosystems and in planta transcriptomic analysis to identify candidate avirulence genes. This work has implications for the identification of putative avirulence genes in the absence of associated expression data and points toward the need for detailed molecular characterisation of mechanisms of effector regulation and silencing in oomycete plant pathogens.
Introduction
Phytophthora fragariae, the causal agent of red core or red stele root rot, is a highly destructive pathogen of cultivated strawberry (Fragaria × ananassa), resulting in whole plant collapse. The majority of commercial strawberries grown in the United Kingdom are grown on table tops using soilless substrate, under polytunnels or in glasshouses (Robinson Boyer et al., 2016). Phytophthora spp. are a particular problem in these systems due to the ease of spread through the irrigation system via the motile zoospores. Since the first report in Scotland in 1920, this disease has spread to the majority of strawberry growing regions, except China and the Southern Mediterranean regions of Europe (van de Weg, 1997b; Efsa Panel on Plant Health [PLH], 2014). Currently, it is treated as a quarantine pest by the European and Mediterranean Plant Protection Organization (EPPO), where it is listed as an A2 pest (van de Weg, 1997b; EPPO, 2018). The classification of this pathogen has proven controversial, as initially the organism was identified as a single species (Hickman, 1941), but when a Phytophthora disease of raspberry (Rubus idaeus) was discovered, it was reclassified as P. fragariae var. fragariae (Wilcox et al., 1993). More recently, the pathogens have been separated into distinct species, P. fragariae and P. rubi, affecting strawberry and raspberry, respectively. This was supported by sequence analysis of key loci (Man in ’t Veld, 2007), as well as whole genome analyses (Tabima et al., 2018).
It has previously been proposed that the ability of different isolates of P. fragariae to cause disease on a variety of F. × ananassa cultivars can be explained by a gene-for-gene model (van de Weg, 1997a). The model is currently thought to consist of at least eleven resistance genes in F. × ananassa with eleven corresponding avirulence factors in P. fragariae (W. E. van de Weg, Wageningen University and Research, The Netherlands, personal communication). The development of race schemes is country dependent and ones exist for the United Kingdom, United States, and Canada.
All publicly available genome assemblies of P. fragariae have to date solely utilised Illumina short read sequencing technologies, resulting in assemblies of 73.68 and 76 Mb, in 1,616 and 8,511 scaffolds, respectively (Gao et al., 2015; Tabima et al., 2017). Recently, long read sequencing technology has been shown to provide assemblies of improved contiguity for P. pathogens, specifically the generation of the haplotype-phased assembly of P. ramorum (60.5 Mb in 302 primary contigs) using PacBio sequencing (Malar et al., 2019) and the assembly of P. capsici (95.2 Mb in 424 scaffolds) using Oxford Nanopore Technology (Cui et al., 2019).
Pathogenomic investigations in Phytophthora species of pathosystems with similar gene-for-gene models of resistance have shown a variety of mechanisms through which variation in virulence can be controlled. For instance, in P. sojae, the Avr1d gene was identified as an RxLR effector recognised by the Rps1d resistance gene in soybean (Yin et al., 2013). Studies of the RxLR effector PiAvr4 from P. infestans showed that it was always present in isolates avirulent on potato plants containing the resistance gene R4, whereas virulent isolates possessed a frameshift mutation producing a truncated protein (van Poppel et al., 2008). In comparison, Avr3c in P. sojae was identified in both virulent and avirulent isolates on soybean plants containing Rps3c, but in virulent isolates the gene displayed several polymorphisms resulting in a change to the amino acid sequence leading to a failure of recognition by the plant (Dong et al., 2009). Recently, investigations of P. sojae and P. infestans have identified epigenetic modifications aiding pathogen adaption, with the silencing of relevant effectors leading to the evasion of host immunity (Shan et al., 2004; Qutob et al., 2009, 2013; Dong et al., 2011; Pais et al., 2018).
In this study, we assembled and annotated a population of isolates of P. fragariae and the related pathogen of raspberry, P. rubi. We identified a subpopulation of P. fragariae isolates representing three distinct pathogenicity races (UK1-2-3). This subpopulation was found to be remarkably similar in gene complement, as well as showing little divergence at the nucleotide sequence level. To further investigate the cause of the observed variation in pathogenicity phenotypes, transcriptomic datasets were generated for representative isolates of each pathogenicity race in this subpopulation. This revealed expression level polymorphisms between the isolates, allowing for the generation of candidate lists for PfAvr1, PfAvr2 and PfAvr3. A strong candidate for PfAvr2, PF003_g27513 was identified as expressed in the BC-16 and A4 (UK2) isolates, yet not expressed in the BC-1 (UK1) and NOV-9 (UK3) isolates. A candidate for PfAvr3 was also identified, PF009_g26276; it is expressed in NOV-9 (UK3), yet not expressed in BC-1 (UK1), A4 (UK2), and BC-16 (UK2) isolates. Additional sequencing did not reveal long-range polymorphisms influencing the expression of these candidate genes; we therefore suggest control may be in trans or due to epigenetic factors.
Materials and Methods
Isolate Selection and Sources
A selection of ten isolates of P. fragariae were sourced from the Atlantic Food and Horticulture Research Centre (AFHRC), Nova Scotia, Canada. An additional isolate of P. fragariae, SCRP245, alongside three P. rubi isolates, were sourced from the James Hutton Institute (JHI), Dundee, Scotland (detailed in Table 1).
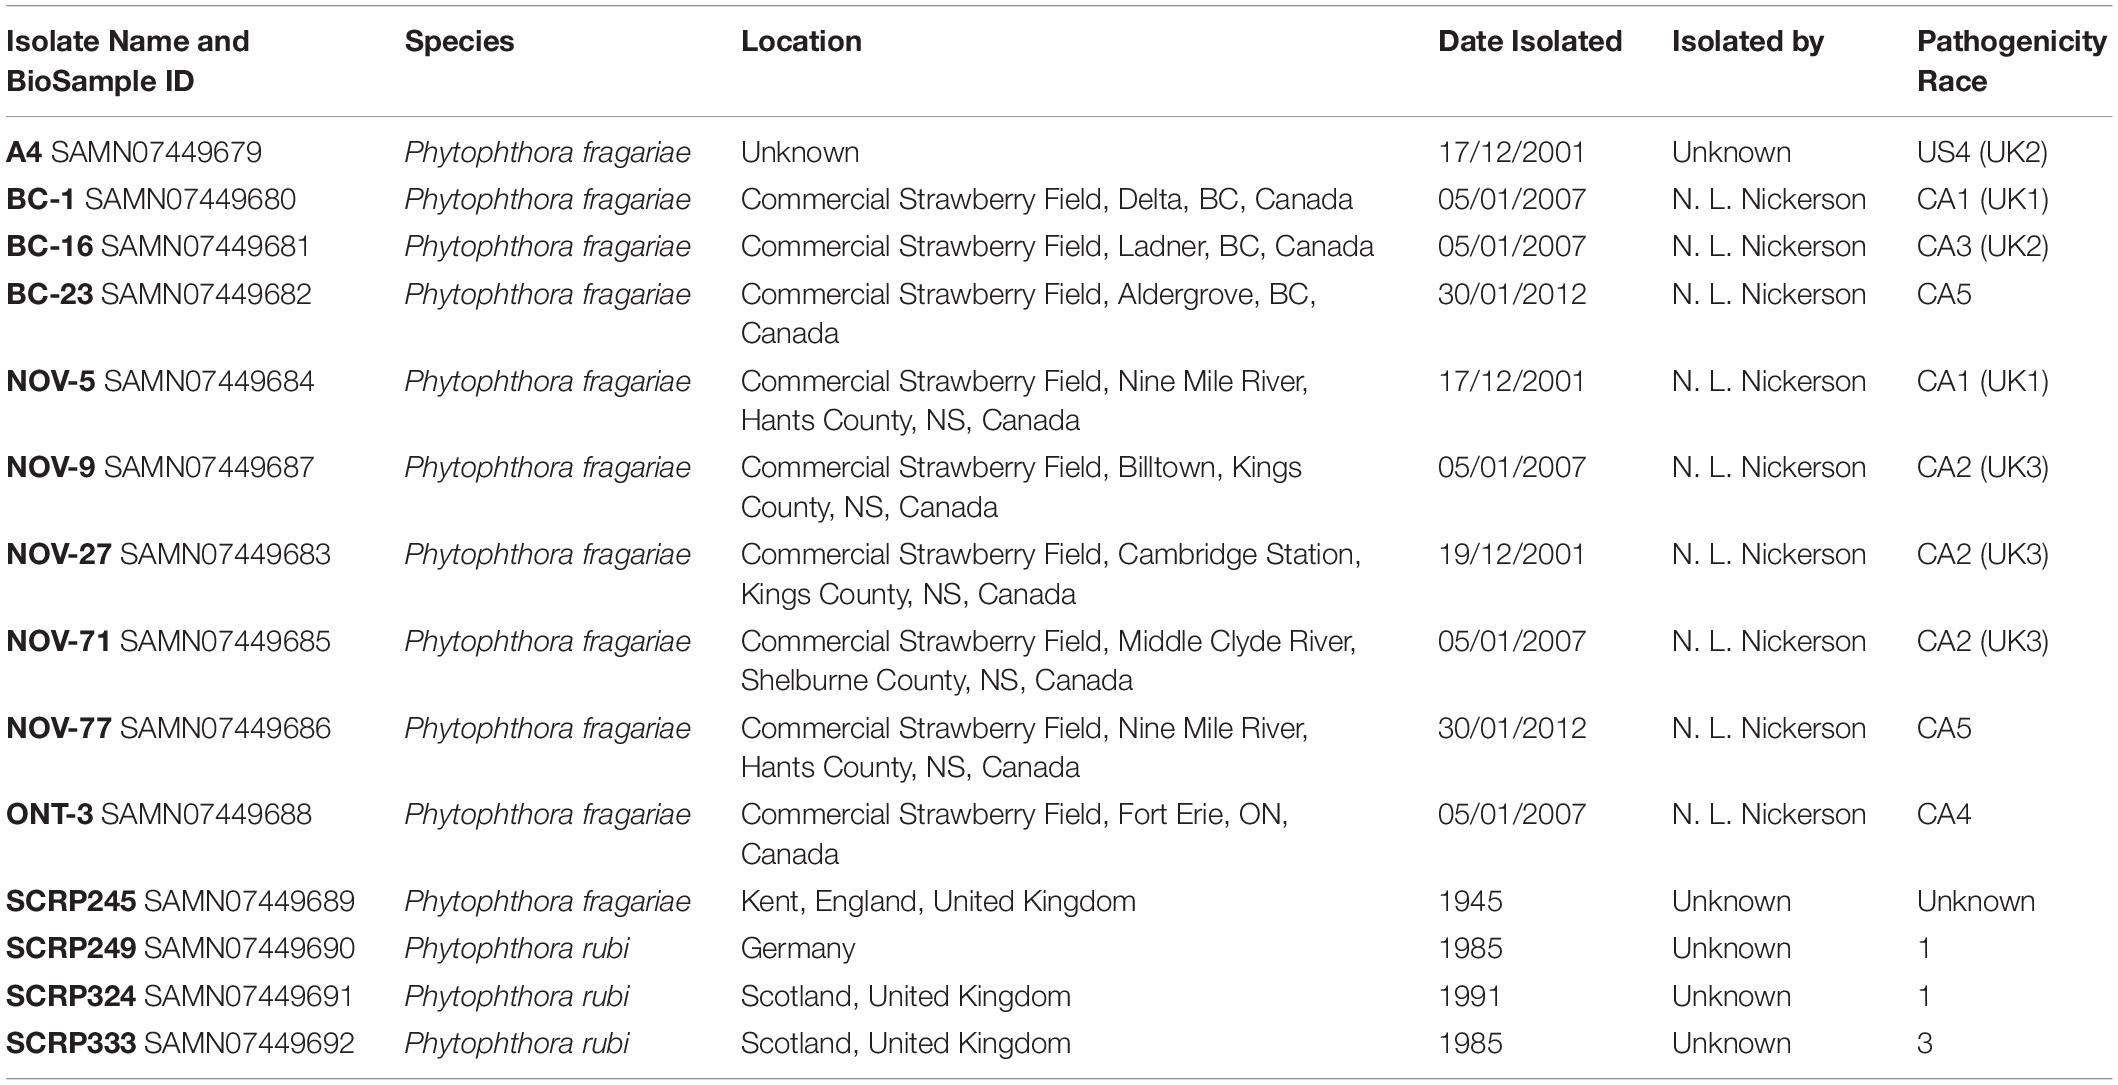
Table 1. Summary of Phytophthora fragariae and Phytophthora rubi isolates used in this study.
Culturing of Isolates
All work with P. fragariae and P. rubi was conducted in a Tri-MAT Class-II microbiological safety cabinet. Isolates were routinely subcultured on kidney bean agar (KBA) produced as previously described (Maas, 1972). Isolates were grown by transferring two pieces of between 1 and 4 mm2 onto fresh KBA plates, subsequently sealed with Parafilm®. Plates were then grown at 20°C in the dark in a Panasonic MIR-254 cooled incubator for between 7 and 14 days.
Mycelia were also grown in liquid pea broth, produced as previously described (Campbell et al., 1989) with the addition of 10 g/L sucrose. These plates were inoculated with five pieces (1 – 4 mm2) of mycelium and media, subsequently sealed with Parafilm®. These were grown at 20°C for 4 to 5 days in constant darkness.
Pathogenicity Testing of Isolates
Mother stock plants of F. × ananassa were maintained in 1 L pots in polytunnels. Runner plants were pinned down into 9 cm diameter pots filled with autoclaved 1:1 peat-based compost:sand. The clones were grown on for 3 weeks to establish their own root system and then were cut from the mother plant. Inoculations were performed as described previously (van de Weg et al., 1996). Plants were placed in a growth chamber with 16/8 h light/dark cycle at a constant 15°C. Inoculated plants stood in a shallow layer of tap water (2 – 7 mm) for the entire experiment and were watered from above twice a week. After 6 weeks, plants were dug up and the roots were rinsed to remove the soil/sand mix. Roots were then assessed for distinctive disease symptoms of “rat’s tails”, which is the dieback from the root tip and “red core”, which is the red discolouration of the internal root visible when longitudinally sliced open. Samples for which infection was unclear were visualised under a light microscope for the presence of oospores. This was performed through squash-mounting of the root tissue, where a sample of root was excised and pressed between a microscope slide and cover slip. This sample was then examined at 40x magnification under high light intensity with a Leitz Dialux 20 light microscope.
Sequencing of DNA
For Illumina sequencing, gDNA was extracted from 300 mg of freeze-dried mycelium using the Macherey-Nagel NucleoSpin® Plant II Kit. The manufacturer’s protocol was modified by doubling the amount of lysis buffer PL1 used, increasing the incubation following RNase A addition by 5 min, doubling the volume of buffer PC and eluting in two steps with 35 μL of buffer PE warmed to 70°C. For PacBio and Oxford Nanopore Technologies (ONT) sequencing, gDNA was extracted using the Genomic-Tip DNA 100/G extraction kit, following the Tissue Sample method.
To create Illumina PCR-free libraries, DNA was sonicated using a Covaris M220 and size-selected using a BluePippin BDF1510 1.5% gel selecting for 550 bp. Libraries were constructed using the NEBNext enzymes: End repair module (E6050), A-Tailing module (E6053), Blunt T/A ligase (M0367) and Illumina single-indexed adapters. Sequencing was performed to generate 2 × 300 bp reads on a MiSeqTM system using MiSeq Reagent Kit V3 600 cycle (MS-102-3003). PacBio library preparation and sequencing was performed by the Earlham Institute, United Kingdom on a PacBio RS II machine. ONT sequencing libraries were created using the SQK-LSK108 kit following the manufacturer’s protocol and sequenced using the FAH69834 FLO-MIN106 flow cell on a GridION for approximately 28 h.
Inoculation Time Course Experiment
Growth of isolates for inoculations were performed on fresh KBA plates for approximately 14 days as described above, before the mycelium had reached the plate edge. Plugs of mycelium growing on agar were taken using a flame sterilised 10 mm diameter cork borer and plugs were submerged in chilled stream water. Plates were incubated in constant light for 3 days at 13°C, with the water changed every 24 h. For the final 24 h, chilled Petri’s solution (Judelson et al., 1993) was used. Roots of micropropagated F. × ananassa “Hapil” plants (GenTech, Dundee, United Kingdom), maintained on Arabidopsis thaliana salts (ATS) media (Taylor et al., 2016), were submerged for 1 h before transfering back to ATS plates. These plates were kept at 15°C, with 16/8 h light/dark cycle, with a photosynthetic photon flux (PPF) of 150 μmol m–2 s–1 provided by fluorescent lamps (FL40SSENW37), in a Panasonic MLR-325H controlled environment chamber. Root tissue was harvested at a selection of time points post-inoculation by rinsing root tissue successively in three beakers of sterile dH2O to remove all media. Roots were separated below the crown tissue, flash frozen in liquid nitrogen and stored at −80°C.
Extraction of total RNA from inoculated root tissue was performed similarly to the previously described 3% CTAB3 method (Yu et al., 2012). Briefly, plant material was disrupted under liquid nitrogen in a mortar and pestle, previously decontaminated through cleaning with RNaseZapTM solution and baking for 2 h at 230°C to deactivate RNAse enzymes. This material was transferred to a warmed extraction buffer (Yu et al., 2012) containing β-mercaptoethanol with 0.01 g of PVPP added per 0.1 g of frozen tissue. The remaining steps were performed as previously described (Yu et al., 2012), except that 60 μL DEPC-treated H2O was used to elute RNA.
Mycelium was grown in liquid pea both and dried on a Q100 90 mm filter paper (Fisher Scientific) using a Büchner funnel and a Büchner flask attached to a vacuum pump. Total RNA was then extracted using the QIAGEN RNEasy Plant Mini kit with the RLC buffer. Extraction was carried out following the manufacturer’s instructions with an additional spin to remove residual ethanol.
RNA was checked for quality using a NanoDrop 1000 spectrophotometer, quantity with a Qubit 2.0 Fluorometer and integrity with a TapeStation 4200 before being prepared for sequencing via Reverse Transcription-Polymerase Chain Reaction (RT-PCR) and sequencing on an Illumina HiSeqTM 4000 by Novogene, Hong Kong, Special Administrative Region, China. Timepoints for sequencing were selected through the detection of β-tubulin transcripts by RT-PCR. Reverse transcription was performed with the SuperScriptTM III Reverse Transcriptase kit with an equal amount of RNA used for each sample. The complementary DNA (cDNA) was then analysed by PCR with 200 μM dNTPs, 0.2 μM of each primer (detailed in Supplementary Table S1), 2 μL of cDNA template and 2.5 units of Taq DNA polymerase and the buffer supplied in a 20 μL reaction. Reactions were conducted in a Veriti 96-well thermocycler with an initial denaturation step at 95°C for 30 s, followed by 35 cycles of a denaturation step at 95°C for 30 s, an annealing temperature of 60°C for 30 s and an extension step of 72°C for 30 s. This was followed by a final extension step of 72°C for 5 min and held at 10°C. Products were visualised by gel electrophoresis on a 1% w/v agarose gel at 80 V for 90 min, stained with GelRed. Following this, three biological replicates of samples taken at: 24, 48, and 96 hpi for BC-16, 48 hpi for BC-1 and 72 hpi for NOV-9 were sequenced (Supplementary Figure S1). Additionally, in vitro mycelial RNA was sequenced.
Phytophthora rubi RNA-Seq reads were sequenced on a HiSeqTM 2000 system.
Genome Assembly
Prior to assembly, Illumina reads were cleaned and sequencing adaptors were removed with fastq-mcf (Aronesty, 2013). Quality control of PacBio data was performed by the Earlham Institute, Norwich, United Kingdom. ONT reads were basecalled with Albacore version 2.2.7 and adaptors were removed with Porechop version 0.2.0 (Wick, 2018) and the trimmed reads were corrected with Canu version 1.4 (Koren et al., 2017).
Assemblies of isolates sequenced solely with Illumina data were generated with SPAdes version 3.11.0 (Bankevich et al., 2012) with Kmer sizes of 21, 33, 55, 77, 99, and 127. PacBio reads were assembled using FALCON-Unzip (Chin et al., 2016). FALCON version 0.7 + git.7a6ac0d 8e8492c64733a997d72a9359e1275bb57 was used, followed by FALCON-Unzip version 0.4.0 and Quiver (Chin et al., 2013). Error corrected ONT reads were assembled using SMARTdenovo version 1.0.0 (Ruan, 2018).
Following assembly, error correction was performed on ONT assemblies by aligning the reads to the assembly with Minimap2 version 2.8r711-dirty (Li, 2018) to inform ten iterations of Racon version 1.3.1 (Vaser et al., 2017). Following this, reads were again mapped to the assembly and errors were corrected with Nanopolish version 0.9.0 (Simpson, 2018). PacBio and ONT assemblies had Illumina reads mapped with Bowtie 2 version 2.2.6 (Langmead and Salzberg, 2012) and SAMtools version 1.5 (Li et al., 2009) to allow for error correction with ten iterations of Pilon version 1.17 (Walker et al., 2014).
Following assembly, all contigs smaller than 500 bp were discarded and assembly statistics were collected using Quast version 3.0 (Gurevich et al., 2013). BUSCO statistics were collected with BUSCO version 3.0.1 (Simão et al., 2015) using the eukaryota_odb9 database on the assemblies, as the stramenopile database was not available at the time of the analysis. Identification of repetitive sequences was performed with Repeatmasker version open-4.0.5 (Smit et al., 2015) and RepeatModeler version 1.73 (Smit and Hubley, 2015). Transposon related sequences were identified with TransposonPSI release 22nd August 2010 (Haas, 2010).
Prediction of Gene Models and Effectors
Gene and effector prediction was performed similarly to a previously described method (Armitage et al., 2018). Firstly, raw RNA-Seq reads of BC-16 from both mycelial samples and the inoculation time course were cleaned with fastq-mcf (Aronesty, 2013). Reads from the inoculation time course were first aligned to the Fragaria vesca version 1.1 genome (Shulaev et al., 2011) with STAR version 2.5.3a (Dobin et al., 2013) and unmapped reads were kept. These unmapped reads and those from in vitro mycelium were mapped to the assembled P. fragariae genomes with STAR (Dobin et al., 2013). RNA-Seq data from P. rubi were aligned to P. rubi assemblies with the same method. Further steps were performed as previously described (Armitage et al., 2018). Additionally, putative apoplastic effectors were identified through the use of ApoplastP (Sperschneider et al., 2018). Statistical significance of the differences between predicted numbers of effector genes was assessed with a Welch two sample t-test in R version 3.4.3 (R Core Team, 2017). Supporting annotation data for UK2 isolate BC-16 (Supplementary Table S2).
Gene Orthology Analysis
Orthologue identification was performed using OrthoFinder version 1.1.10 (Emms and Kelly, 2015) on predicted proteins from all sequenced P. fragariae and P. rubi isolates (Supplementary Table S3). Orthogroups were investigated for expanded and unique groups for races UK1, UK2 and UK3. Unique orthogroups were those containing proteins from only one race and expanded orthogroups were those containing more proteins from a specific race than other races. Venn diagrams were created with the VennDiagram R package version 1.6.20 (Chen and Boutros, 2011) in R version 3.2.5 (R Core Team, 2016).
Identification and Analysis of Variant Sites and Population Structure
Variant sites were identified through the use of the GATK version 3.6 HaplotypeCaller in diploid mode (McKenna et al., 2010) following alignment of Illumina reads for all sequenced isolates to the FALCON-Unzip assembled genome with Bowtie 2 version 2.2.6 (Langmead and Salzberg, 2012) and filtered with vcflib (Garrison, 2012) and VCFTools (Danecek et al., 2011). Additionally, structural variants were identified with SvABA (Wala et al., 2018) following the alignment of Illumina reads from all sequenced isolates to the FALCON-Unzip assembled genome with BWA-mem version 0.7.15 (Li, 2013). Population structure was assessed with fastSTRUCTURE (Raj et al., 2014) following conversion of the input file with Plink version 1.90 beta (Purcell et al., 2007). Finally, a custom Python script was used to identify variant sites private to races UK1, UK2, or UK3 (see Availability of Computer Code below).
Assessment of Gene Expression Levels and the Identification of Candidate Avirulence Genes
RNA-Seq reads of BC-1, BC-16, and NOV-9 were aligned to the assembled genomes of BC-1, BC-16, and NOV-9 as described above. Expression levels and differentially expressed genes were identified with featureCounts version 1.5.2 (Liao et al., 2014) and the DESeq2 version 1.10.1 R package (Love et al., 2014). Multiple test correction was performed as part of the analysis within the DESeq2 package.
Candidate avirulence genes were identified through the analysis of uniquely expressed genes and uniquely differentially expressed genes for each of the three isolates. Uniquely expressed genes were those with a Fragments Per Kilobase of transcript per Million mapped reads (FPKM) value greater than or equal to 5 in any time point from the inoculation time course experiment for a single isolate. Uniquely differentially expressed genes were those with a minimum LFC of 3 and a p-Value threshold of 0.05. Genes were compared between isolates through the use of orthology group assignments described above and scored on a one to six scale, with five and six deemed high confidence and one and two deemed as low confidence.
To identify homologous genes in other Phytophthora spp., candidate RxLRs were processed by SignalP-5.0 (Armenteros et al., 2019) to identify the cleavage site. The signal peptide sequence was removed before being submitted for a tblastn (Altschul et al., 1997) search on GenBank; interesting top hits are reported.
The expression levels of a strong candidate PfAvr2 gene, PF003_g27513 and a candidate PfAvr3 gene, PF009_g26276, were assessed via RT-qPCR. RNA-Seq results for reference genes identified previously in P. parasitica (Yan and Liou, 2006) were examined for stability of expression levels, resulting in the selection of β-tubulin (PF003_g4288) and WS41 (PF003_g28439) as reference genes. The gDNA of Pseudomonas syringae pv. maculicola 5422 and primers for 16S (Clifford et al., 2012) were used as an inter-plate calibrator. Primers were designed using the modified Primer3 version 2.3.7 implemented in Geneious R10 (Untergasser et al., 2012). Reverse transcription was performed on three biological replicates of each sequenced timepoint, alongside: 24 hpi, 72 hpi and 96 hpi for BC-1 and 24 hpi, 48 hpi and 96 hpi for NOV-9 with the QuantiTect Reverse Transcription Kit. Quantitative PCR (qPCR) was then performed in a CFX96TM Real-Time PCR detection system in 10 μL reactions of: 5 μL of 2× qPCRBIO SyGreen Mix Lo-Rox, 2 μL of a 1:3 dilution of the cDNA sample in dH2O and 0.4 μL of each 10 μM primer and 2.2 μL dH2O. The reaction was run with the following conditions: 95°C for 3 min, 39 cycles of 95°C for 10 s, 62°C for 10 s and 72°C for 30 s. This was followed by 95°C for 10 s, and a 5 s step ranging from 65°C to 95°C by 0.5°C every cycle. At least two technical replicates for each sample were performed and the melt curve results were analysed to ensure the correct product was detected. Relative gene expression was calculated using the comparative cycle threshold (CT) method (Livak and Schmittgen, 2001). Where there was a difference of at least 1 CT value between the minimum and maximum results for technical replicates, further reactions were conducted. Outlier technical replicates were first identified as being outside 1.5 times the interquartile range. Following this, additional outliers were identified using the Grubb’s test and excluded from the analysis. Technical replicates were averaged for each biological replicate and expression values were calculated as the mean of the three biological replicates.
Investigation of cis and trans Variations for Strong Candidate Avirulence Gene
The regions upstream and downstream of PF003_g27513 and PF009_g26276 in the FALCON-Unzip assembly of BC-16 and the SMART de novo assembly of NOV-9 were aligned with MAFFT in Geneious R10 (Katoh et al., 2002; Katoh and Standley, 2013). Variant sites were identified through visual inspection of the alignment alongside visualisation of aligned short reads from BC-16 and NOV-9 to both assemblies with Bowtie 2 version 2.2.6 (Langmead and Salzberg, 2012) in IGV (Thorvaldsdóttir et al., 2013).
Transcription factors were identified with a previously described HMM of transcription factors and transcriptional regulators in Stramenopiles (Buitrago-Flórez et al., 2014). These proteins were then analysed through methods described above for gene loss or gain, nearby variant sites and differential expression between isolates.
Availability of Computer Code
All computer code is available at: https://github.com/harri- sonlab/phytophthora_fragariae, https://github.com/harrisonlab/phytophthora_rubi, and https://github.com/harrisonlab/popgen/blob/master/snp/vcf_find_difference_pop.py.
Results
Race Typing Allowed Standardisation of United States and United Kingdom Race Nomenclature
The P. fragariae isolates A4 (race US4), BC-1 (race CA1), BC-16 (race CA3), NOV-5 (race CA1), NOV-9 (race CA2), NOV-27 (race CA2), and NOV-71 (race CA2) (Table 1) were phenotyped on a differential series of four F. × ananassa cultivars with known resistance. These were: “Allstar” (containing Rpf1, Rpf2, and Rpf3), “Cambridge Vigour” (containing Rpf2 and Rpf3), “Hapil” (containing no resistance genes), and “Redgauntlet” (containing Rpf2) (van de Weg et al., 1996; R. Harrison, unpublished). Following assessment of below ground symptoms, it was shown that race CA1 was equivalent to UK1, race CA2 was equivalent to UK3, race CA3 was equivalent to UK2 and race US4 was equivalent to UK2 (Figure 1 and Table 2).
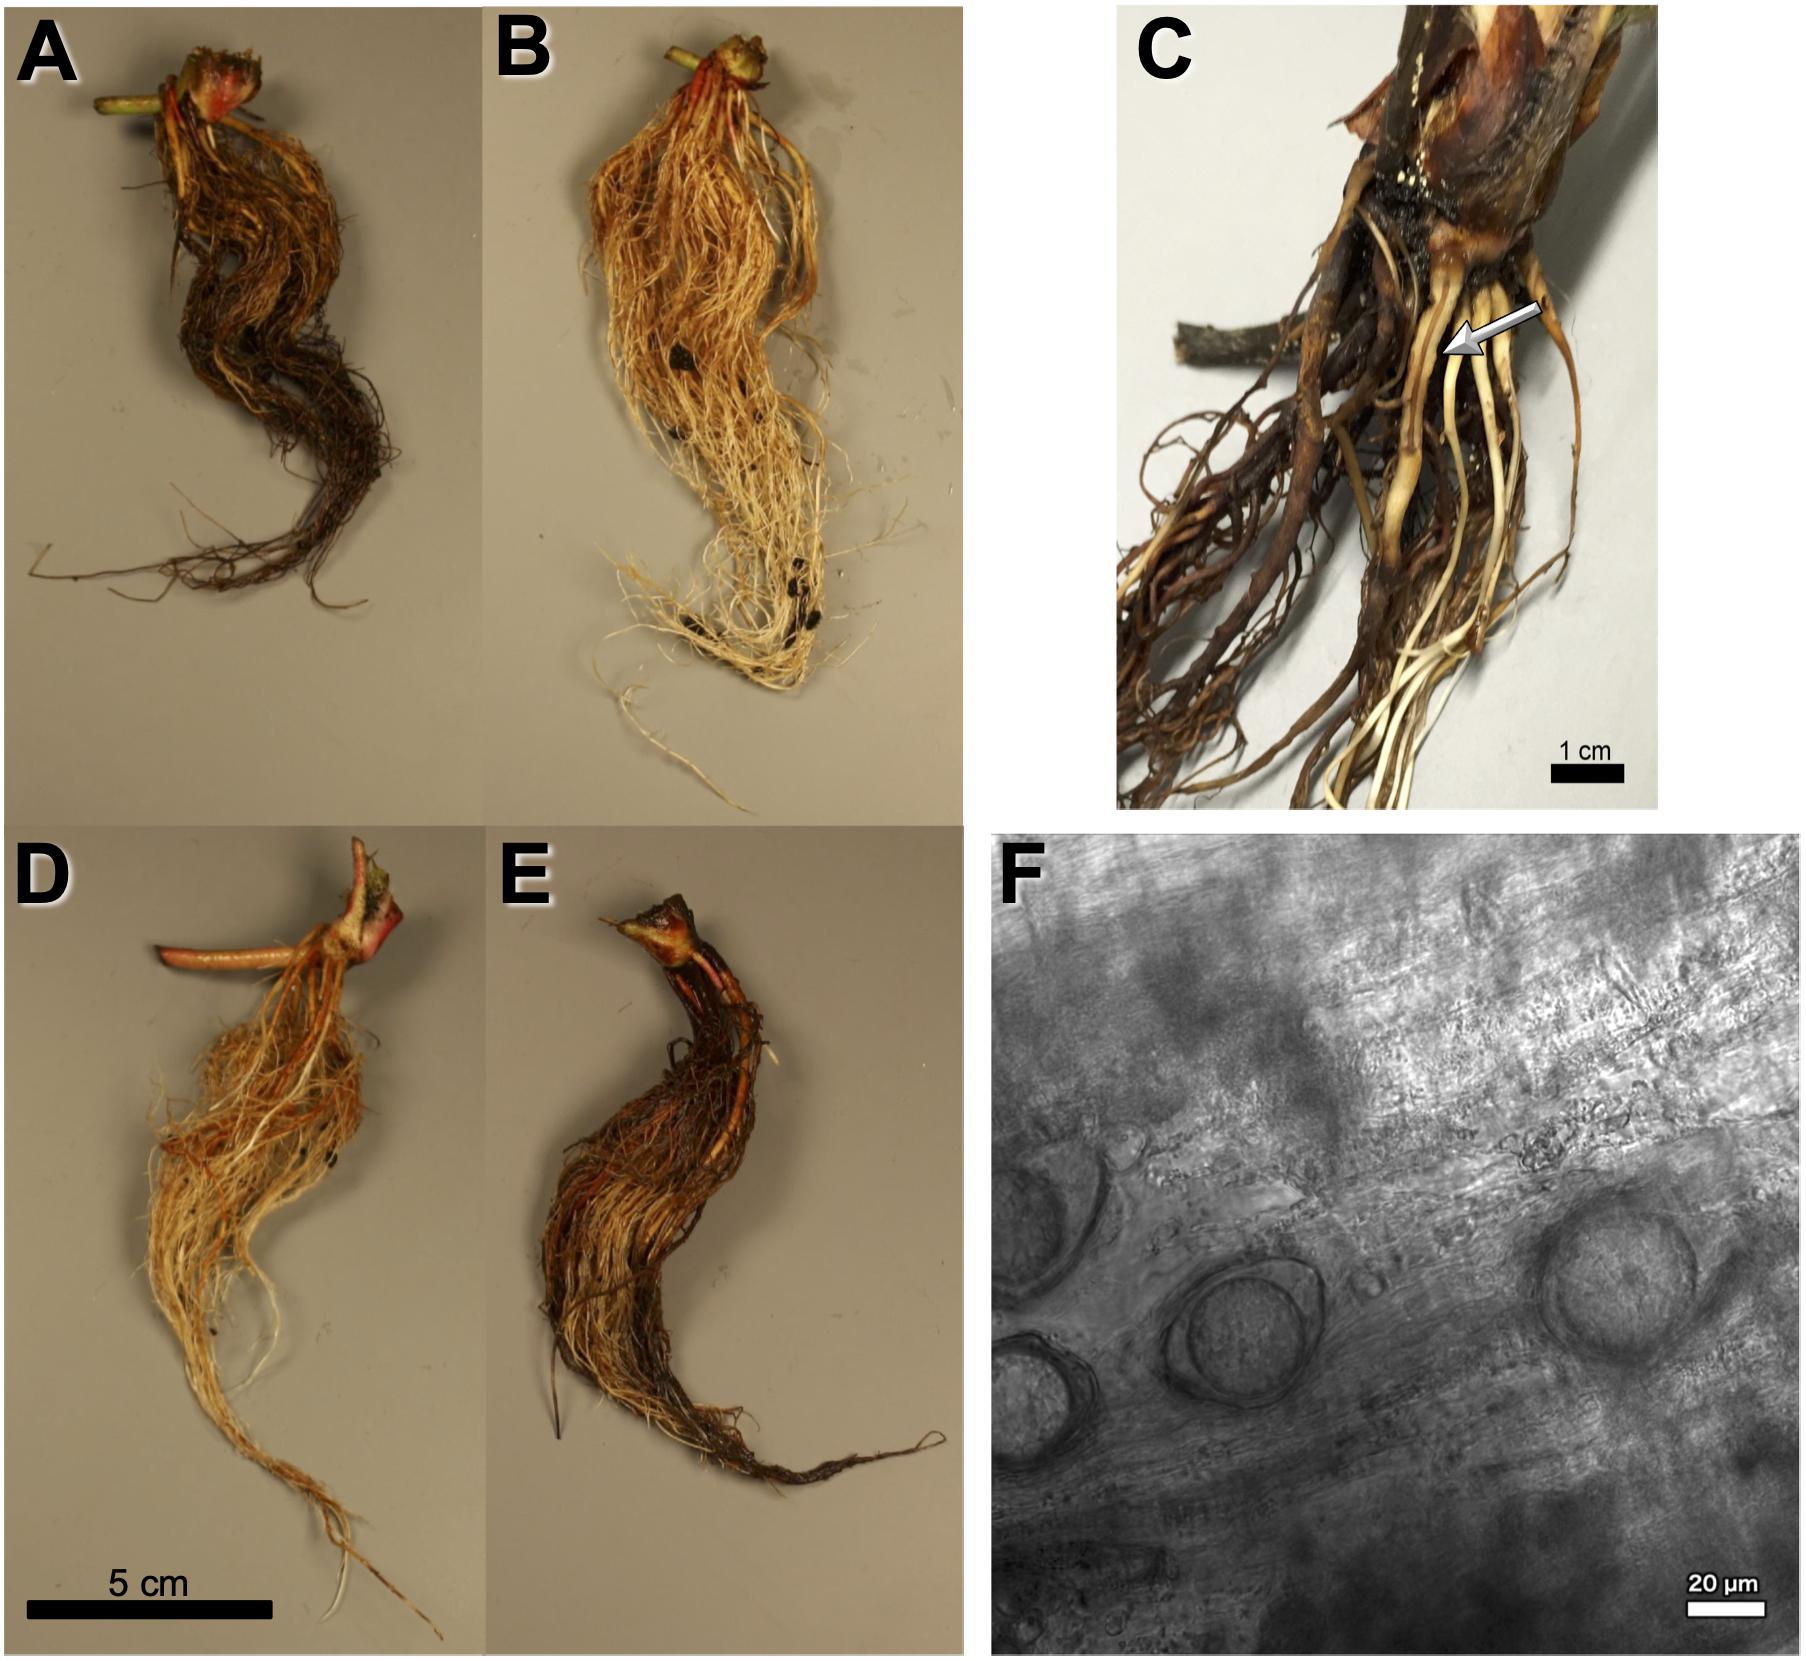
Figure 1. Observed Phytophthora fragariae symptoms in the cultivated strawberry (Fragaria × ananassa). (A,B,D,E) Roots of Fragaria × ananassa harvested 6 weeks after inoculation with Phytophthora fragariae mycelial slurry. (A) Successful infection of the P. fragariae isolate NOV-27 (race CA2) on a susceptible “Redgauntlet” plant (Rpf2 only). (B) Unsuccessful infection of the P. fragariae isolate A4 (US4/UK2) on a resistant “Redgauntlet” plant (Rpf2 only). (C) Example of “red core” symptoms observed in “Hapil” roots infected with BC-16, 3 weeks post-inoculation. (D) Unsuccessful infection of the P. fragariae isolate NOV-27 (race CA2) on a resistant “Allstar” plant (Rpf1, Rpf2 and Rpf3). (E) Successful infection of the P. fragariae isolate A4 (race US4/UK2) on a susceptible “Hapil” plant (no Rpf genes). (F) Example of BC-16 oospores observed in “Hapil” roots, 3 weeks post-inoculation, confirming infection.
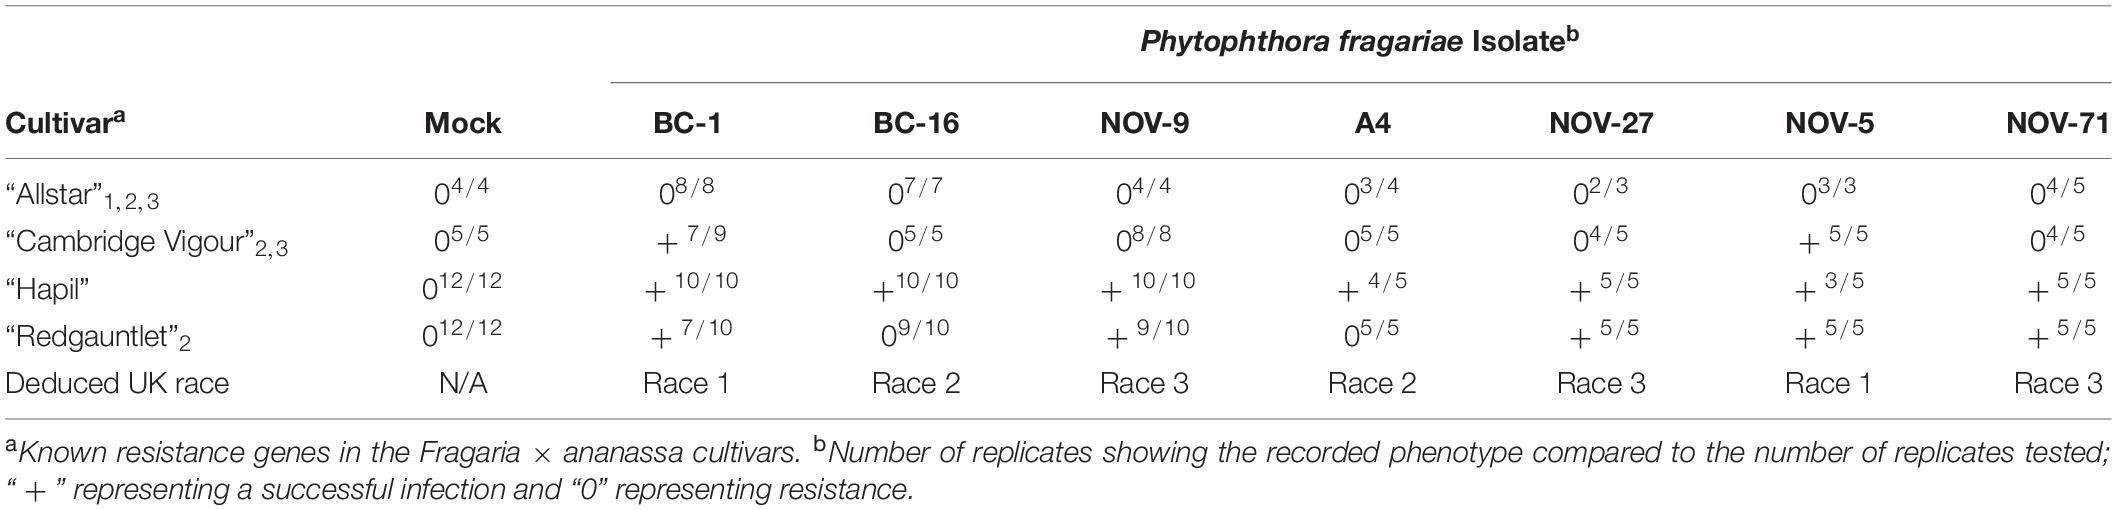
Table 2. Phytophthora fragariae race structure detected by three differential strawberry (Fragaria × ananassa) accessions and categorisation into UK race scheme.
A Highly Contiguous Genome Assembly of BC-16
Long read PacBio sequencing generated a highly contiguous P. fragariae isolate BC-16 (UK2) reference genome of 91 Mb in 180 contigs with an N50 value of 923.5 kb (Table 3). This was slightly larger than the closely related, well studied species from Clade 7, P. sojae, at 83 Mb (Table 3; Tyler et al., 2006). The BC-16 assembly contained 266 of 303 eukaryotic Benchmarking Universal Single-Copy Orthologs (BUSCO) genes (Table 4), compared to 270 in P. sojae (Armitage et al., 2018) and so likely represented a similar completeness of the genome as the P. sojae assembly. The P. fragariae genome was shown to be highly repeat rich, with 38% of the assembly identified as repetitive or low complexity, a larger value than the 29% shown for P. sojae (Armitage et al., 2018). A total of 37,049 genes encoding 37,346 proteins were predicted in the BC-16 assembly, consisting of 20,222 genes predicted by BRAKER1 (Hoff et al., 2016) and 17,131 additional genes added from CodingQuarry (Testa et al., 2015). From these gene models, 486 putative RxLR effectors, 82 putative crinkler effectors (CRNs) and 1,274 putative apoplastic effectors were identified (Table 5). Additionally, a total of 4,054 low confidence gene models were added from intergenic ORFs identified as putative effectors. These consisted of 566 putative RxLRs, 5 putative CRNs and 3,483 putative apoplastic effectors. This resulted in a combined total of 41,103 genes encoding 41,400 proteins with 1,052 putative RxLRs, 85 putative CRNs, and 4,757 putative apoplastic effectors (Tables 3, 5).
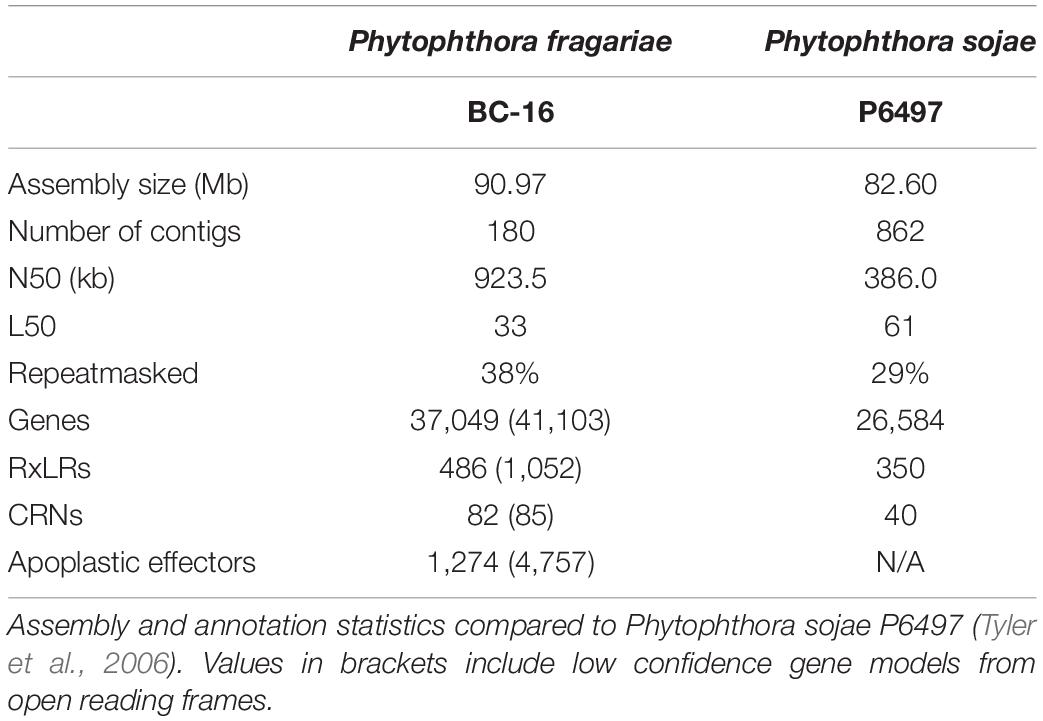
Table 3. Long read PacBio sequencing generated a highly contiguous Phytophthora fragariae BC-16 (UK2) reference genome.
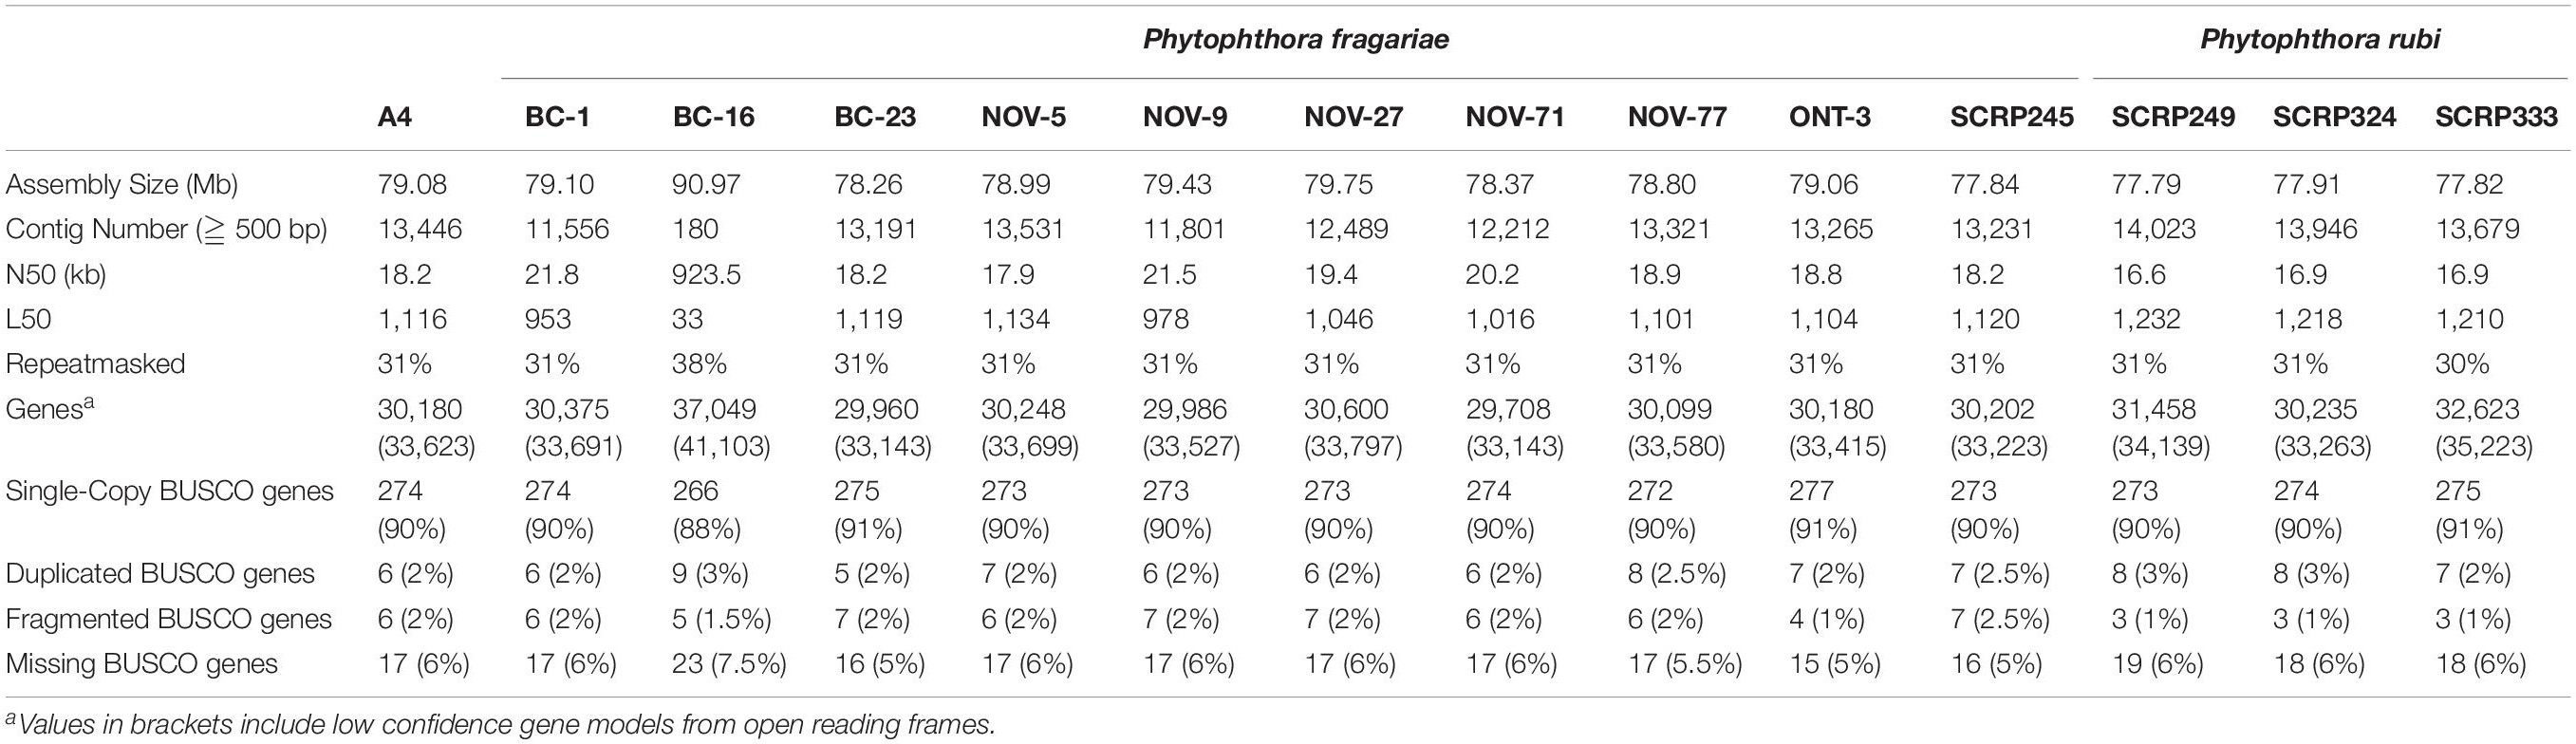
Table 4. Comparable assembly statistics and gene predictions in resequenced isolates of Phytophthora fragariae and Phytophthora rubi.
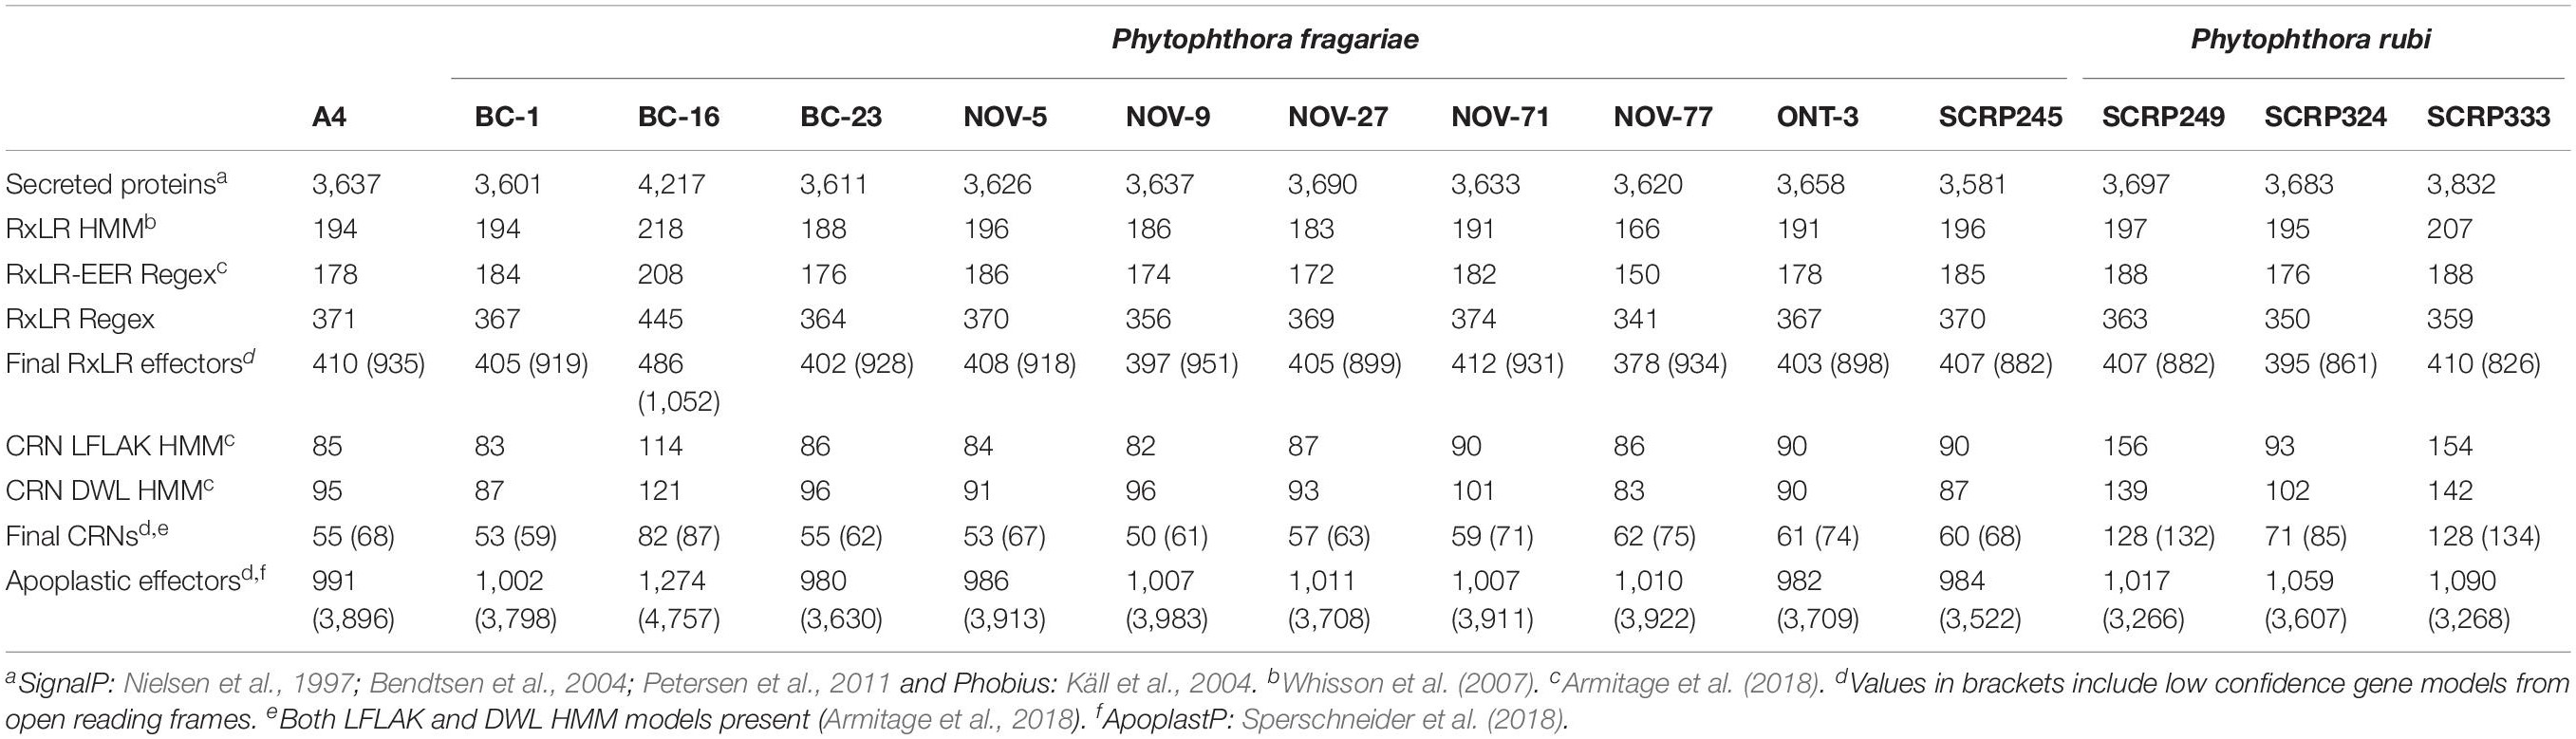
Table 5. Effector gene predictions in resequenced isolates of Phytophthora fragariae and Phytophthora rubi.
A Comparable Number of Effector Genes Were Identified Through Resequencing of Isolates of Phytophthora fragariae and Phytophthora rubi
Ten isolates of P. fragariae and three isolates of P. rubi were additionally resequenced, de novo assembled and annotated (Tables 1, 4). These isolates showed similar assembly statistics within and between species; an average of 79 Mb in 12,804 contigs with an N50 of 19.3 kb in P. fragariae, compared to an average of 78 Mb in 13,882 contigs with an N50 of 16.8 kb in P. rubi. All assemblies showed 31% of the assembly was identified as repetitive or low complexity sequences. On average both P. fragariae and P. rubi showed high levels of completeness, with an average of 274/303 BUSCO genes identified as single copies in these assemblies. Interestingly, a total of 17 genes were consistently not identified in Illumina, PacBio and Nanopore assemblies of P. fragariae and P. rubi isolates, suggesting these genes may be absent from these species and as such may not be considered true eukaryotic BUSCO genes. An average of 67 CRNs were predicted in P. fragariae and an average of 118 CRNs in P. rubi. A significantly (p = 0.013) smaller number of RxLRs were predicted in P. rubi isolates than P. fragariae isolates alongside a significantly (p = 0.039) smaller number of apoplastic effectors predicted in P. rubi than P. fragariae (Table 5). However, it is important to note that these effectors were predicted from a subset of secreted proteins, of which there were significantly (p = 0.030) fewer predicted in P. rubi than in P. fragariae (Table 5).
No Distinguishing Gene Loss or Gain; Or the Presence of INDELs or SNPs in Candidate Avirulence Genes Could Be Found Associated With Race Variation
An orthology analysis of all predicted proteins from the isolates of P. fragariae and P. rubi assigned 481,942 (98.7%) proteins to 38,891 orthogroups. Of these groups, 17,101 contained at least one protein from all fourteen sequenced isolates and 13,132 of these groups consisted entirely of single-copy proteins from each isolate. There were 2,345 of these groups unique to P. rubi and 1,911 of these groups unique to P. fragariae. Analysis of unique and expanded orthogroups for isolates of the UK1, UK2 and UK3 races did not lead to the identification of candidate avirulence genes, as these groups did not contain putative effector genes (Figure 2).
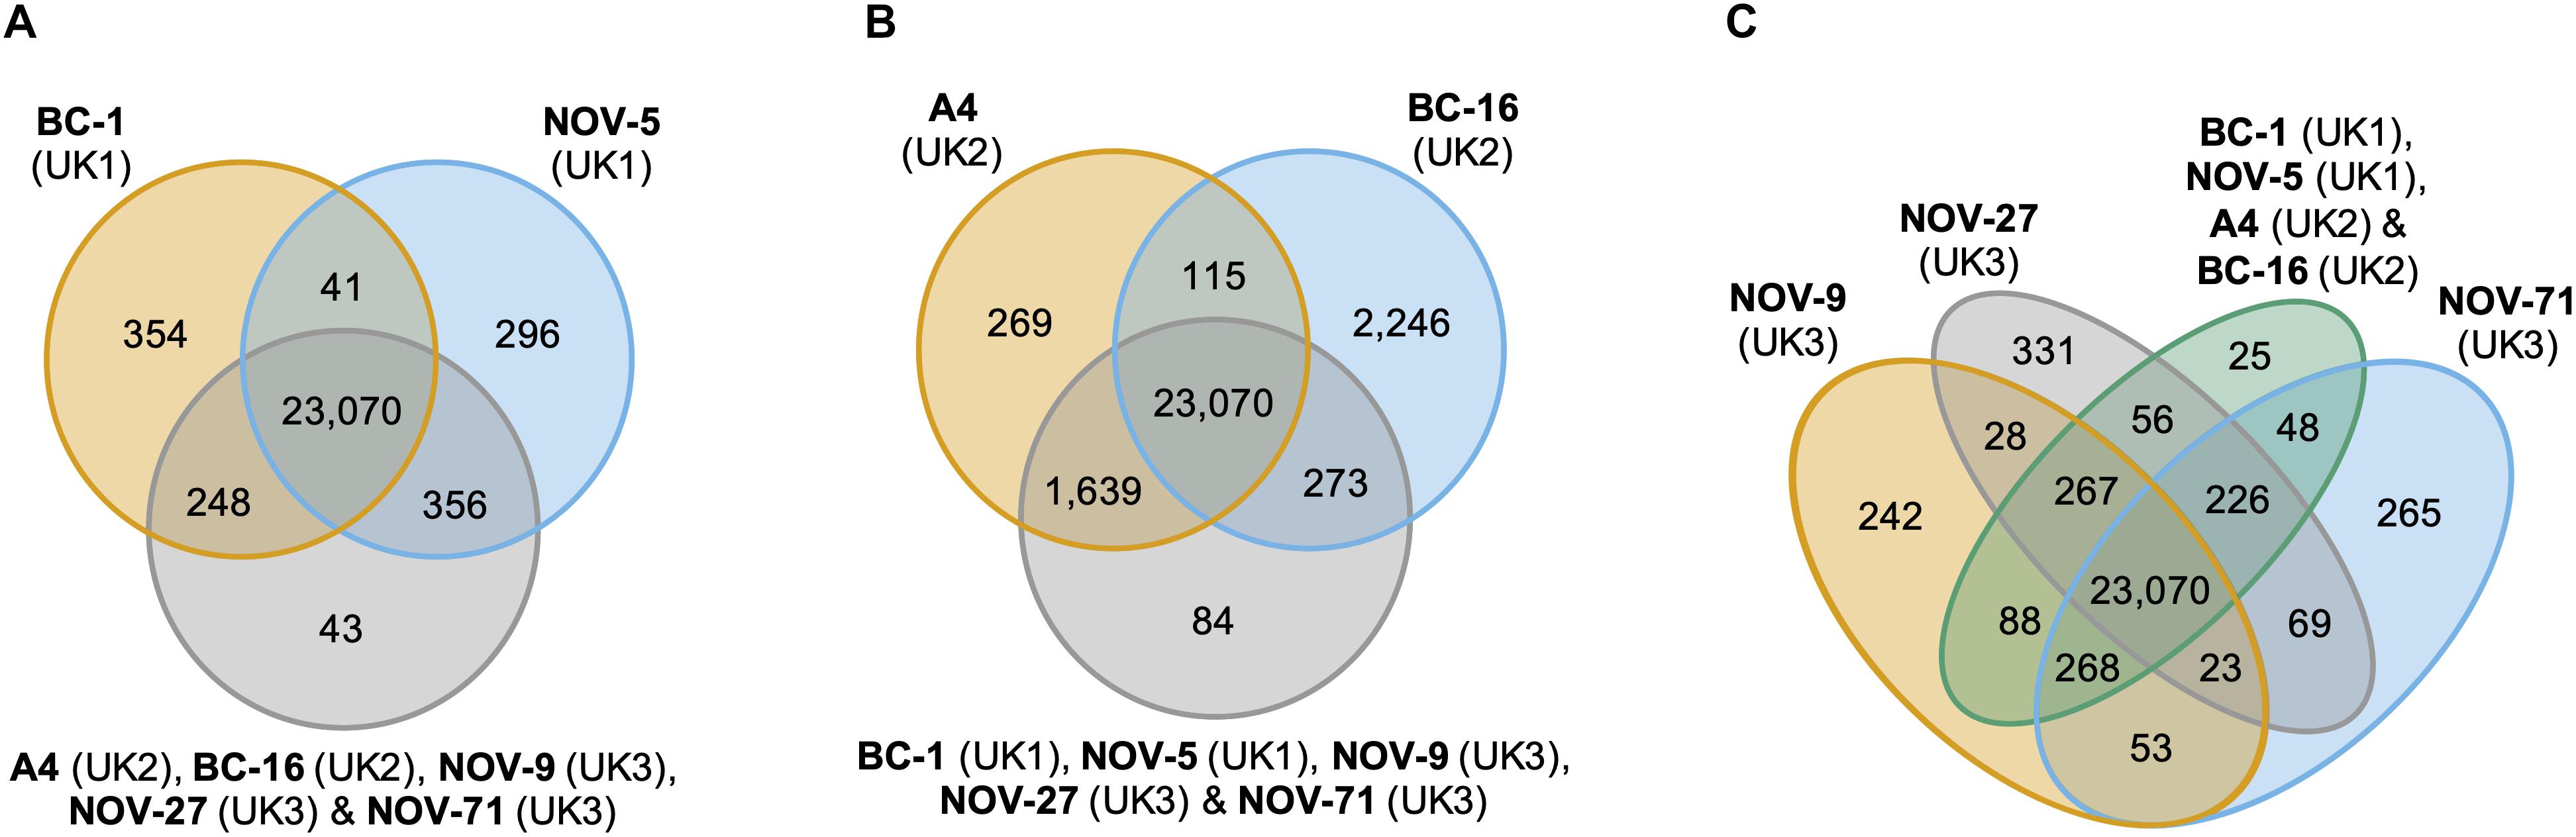
Figure 2. Analysis of unique and expanded orthogroups for Phytophthora fragariae isolates of the UK1, UK2, and UK3 races did not lead to the identification of candidate avirulence genes. Orthology groups were identified by OrthoFinder (Emms and Kelly, 2015) and Venn diagrams were plotted using the VennDiagram R package (Chen and Boutros, 2011) in R Core Team (2016). (A) Analysis focused on the P. fragariae isolates of race UK1: BC-1 and NOV-5 compared to isolates of races UK2 and UK3. (B) Analysis focused on the P. fragariae isolates of race UK2: A4 and BC-16 compared to isolates of races UK1 and UK3. (C) Analysis focused on the P. fragariae isolates of race UK3: NOV-5, NOV-27 and NOV-71 compared to isolates of races UK1 and UK2.
A total of 725,444 SNP sites and 95,478 small INDELs were identified within the P. fragariae and P. rubi isolates by the Genome Analysis ToolKit (GATK) haplotypecaller (McKenna et al., 2010) and 80,388 indels and 7,020 structural variants were identified by SvABA (Wala et al., 2018). Analysis of high quality, biallelic SNP sites allowed the identification of a distinct population consisting of the isolates of race UK1, UK2 and UK3, hereafter referred to as the UK1-2-3 population, with SCRP245, the only United Kingdom isolate, potentially forming an ancestral or hybrid isolate between the UK1-2-3 population and the population represented by BC-23 and ONT-3 (Figure 3). Additionally, clear separation between isolates of P. fragariae and P. rubi was observed. Further analysis within the UK1-2-3 population allowed for the identification of private variants, which were only present in isolates of one of the three races in this population. This resulted in the identification of twelve private variants in race UK2, shared between both A4 and BC-16; however, neither the genes they fell within or were neighbours to, were predicted to encode effectors or secreted proteins and likely did not explain the differences in pathogenicity (Supplementary Table S4).
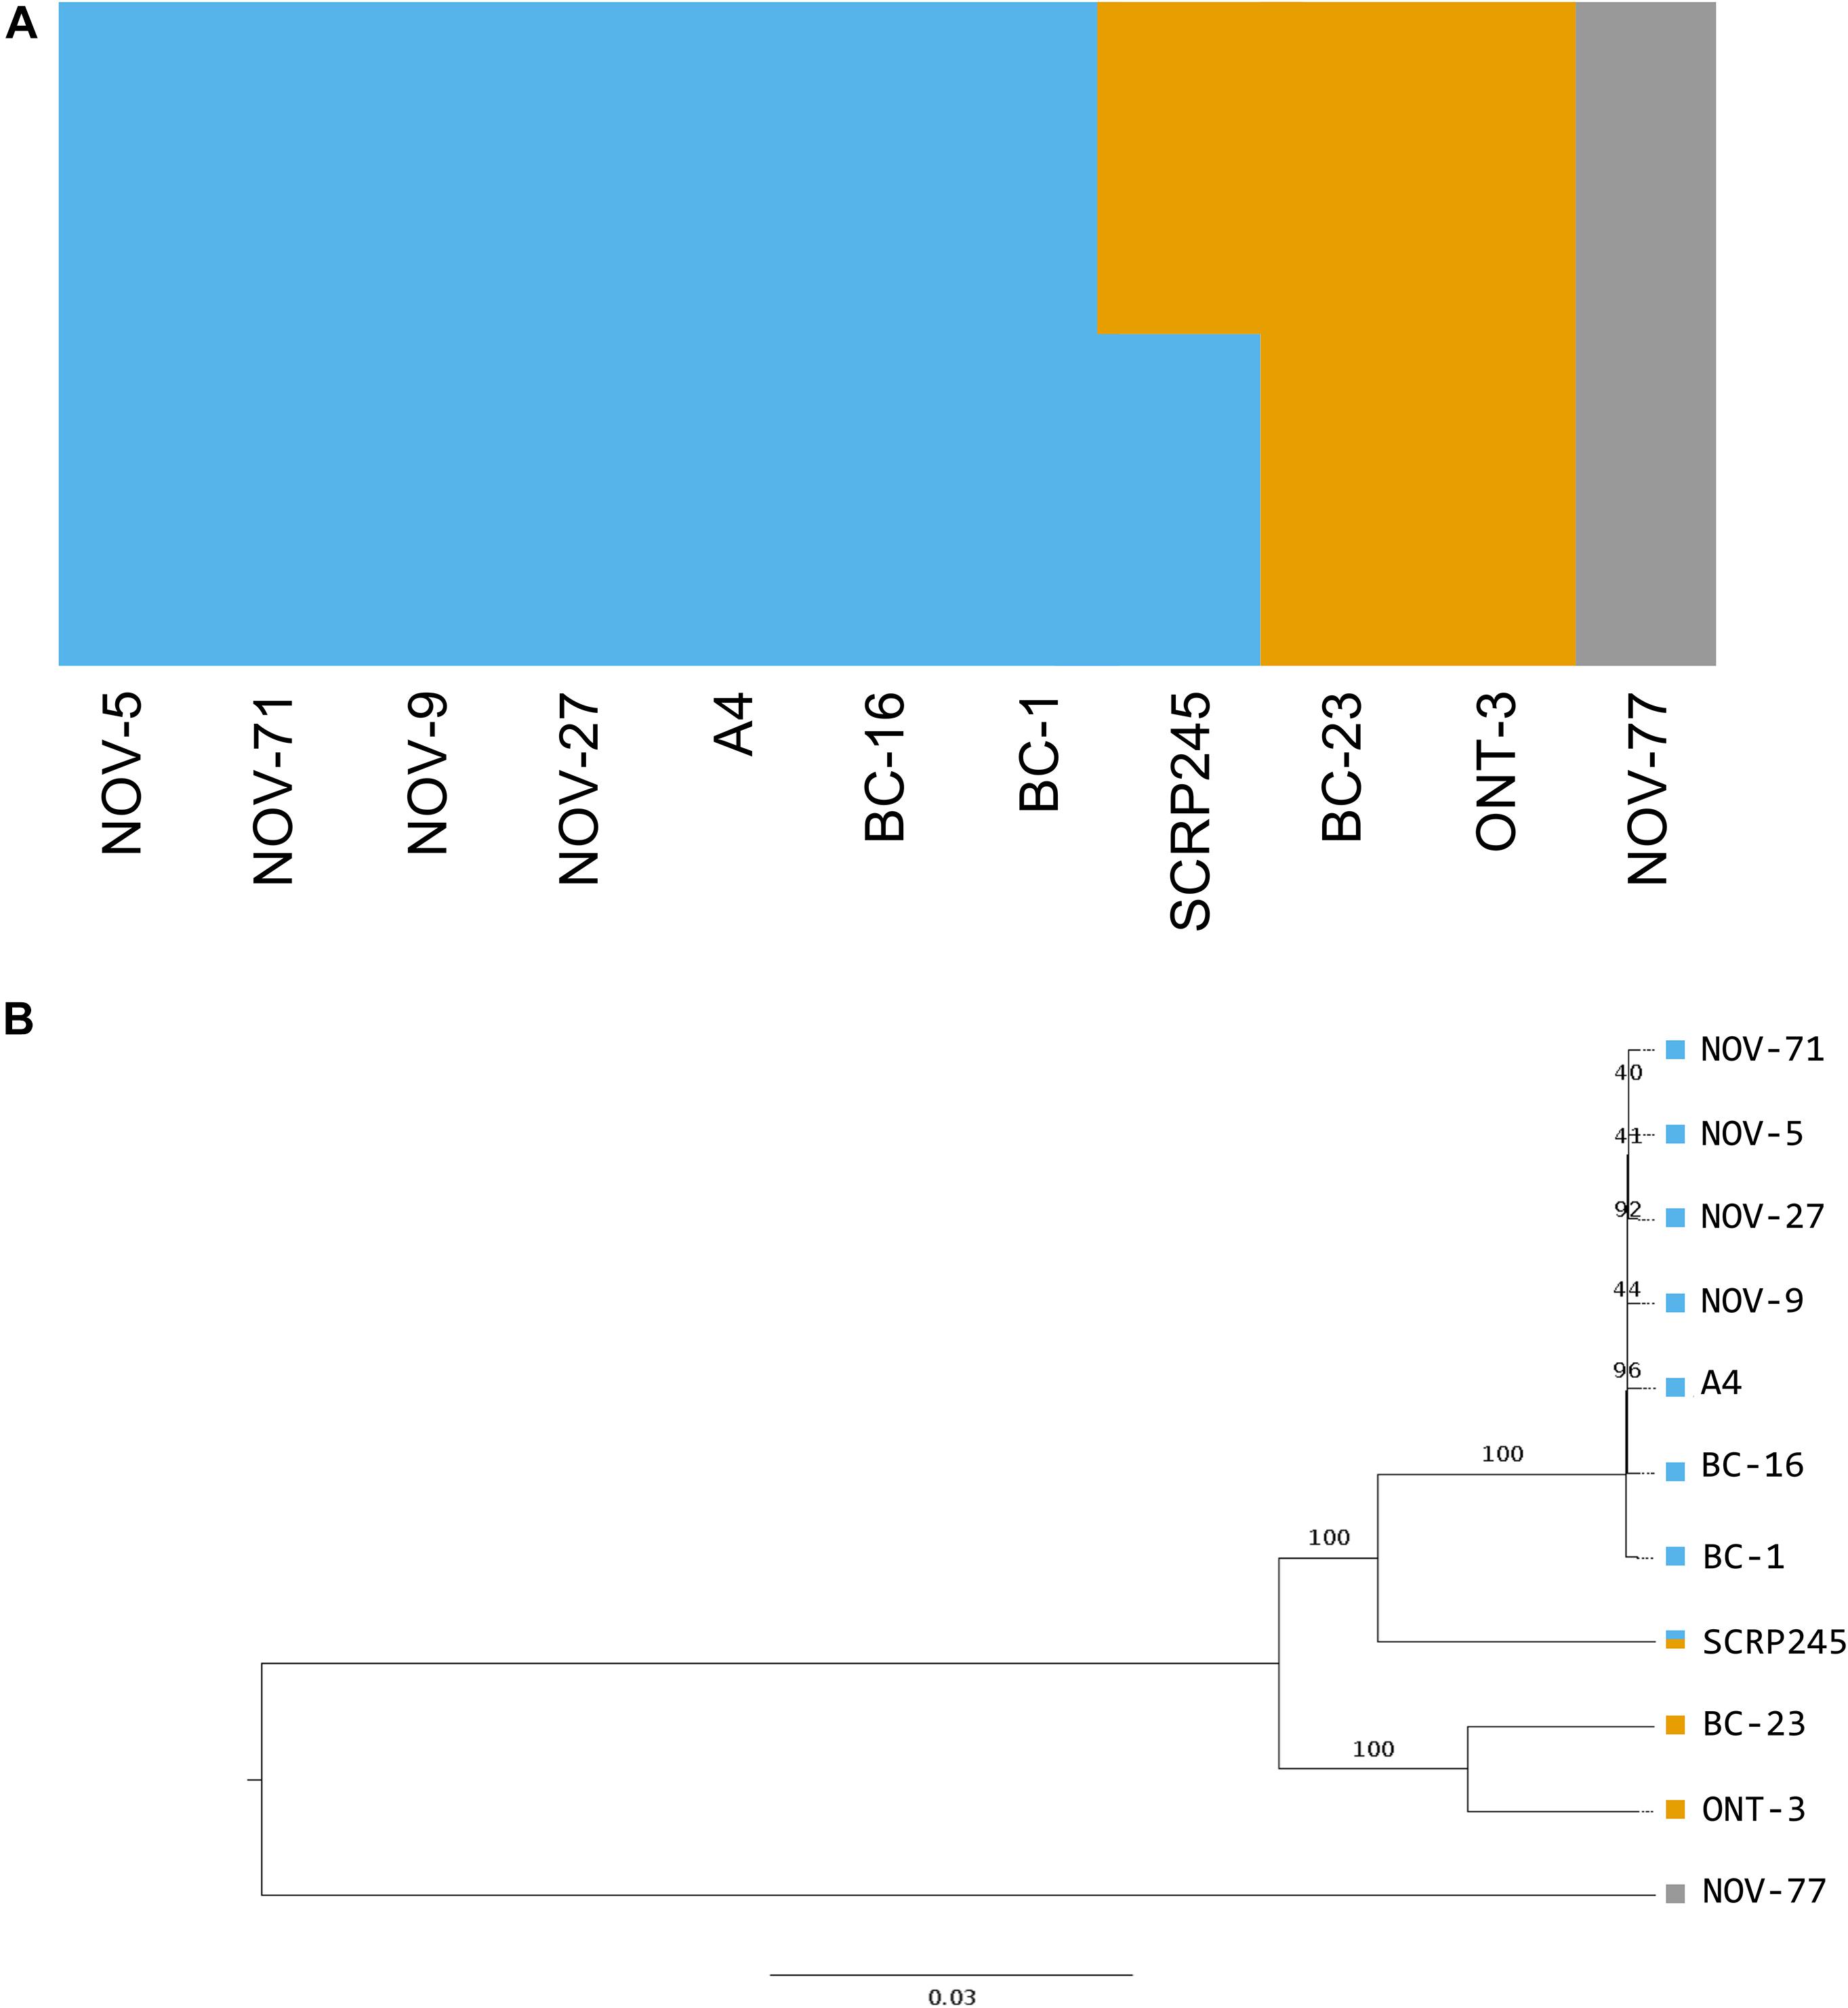
Figure 3. Phylogenetic and population analysis of high quality, biallelic SNP sites split the isolates into three populations with SCRP245, potentially forming an ancestral or hybrid isolate between the UK1-2-3 population and the population represented by BC-23 and ONT-3. (A) Distruct plot of fastSTRUCTURE (Raj et al., 2014) results carried out on all sequenced isolates of Phytophthora fragariae. Each colour represents a different population. 1,469 variant sites were retained for this analysis after filtering. (B) Neighbour joining tree based on 545,365 high quality, biallelic SNP sites, node labels represent the number of bootstrap replicates supporting the node. Variant sites were identified by aligning Illumina reads of all the sequenced isolates to the reference assembly of the BC-16 isolate of P. fragariae with Bowtie 2 (Langmead and Salzberg, 2012) and analysis with the Genome Analysis Toolkit (GATK) haplotypecaller (McKenna et al., 2010). Sites were filtered with VCFtools (Danecek et al., 2011) and VCFlib (Garrison, 2012) to leave only high quality, biallelic SNP sites.
Wide Scale Transcriptional Reprogramming of Effectors During Strawberry Infection
RNA-Seq data were generated from an inoculation time course experiment for representatives of races UK1, UK2 and UK3; BC-1, BC-16 and NOV-9, respectively. Following determination of expression levels of the predicted genes in both in planta and mycelia samples, a correlation analysis showed biological replicates of each timepoint grouped together (Figure 4A). Additionally, the 48 h post-inoculation (hpi) BC-1 time point grouped with the BC-16 24 hpi time point, suggesting these may represent similar points in the infection process. However, clear separation between the BC-16 timepoints was observed (Figure 4A). A total of 13,240 transcripts from BC-16 (32%) showed expression above a FPKM value threshold of five in at least one sequenced BC-16 time point and 9,329 (23%) of these showed evidence of differential expression in at least one sequenced in planta time point compared to mycelium grown in artificial media, suggesting large scale transcriptional reprogramming. As three time points post-inoculation were sequenced for BC-16, the changes in expression over the course of the infection process was investigated. A total of 2,321 transcripts (6%) showed a Log2 Fold Change (LFC) greater than or equal to one or less than or equal to minus one, representing a general reprofiling during infection in comparison to growth in artificial media. Of transcripts differentially expressed in planta compared to artificial media, fewer transcripts were differentially expressed at both 24 hpi and 96 hpi than between sequential timepoints (297 compared to 1,016 and 1,604 transcripts). This suggested that changes during the progress of infection were captured by this dataset (Figure 4B).
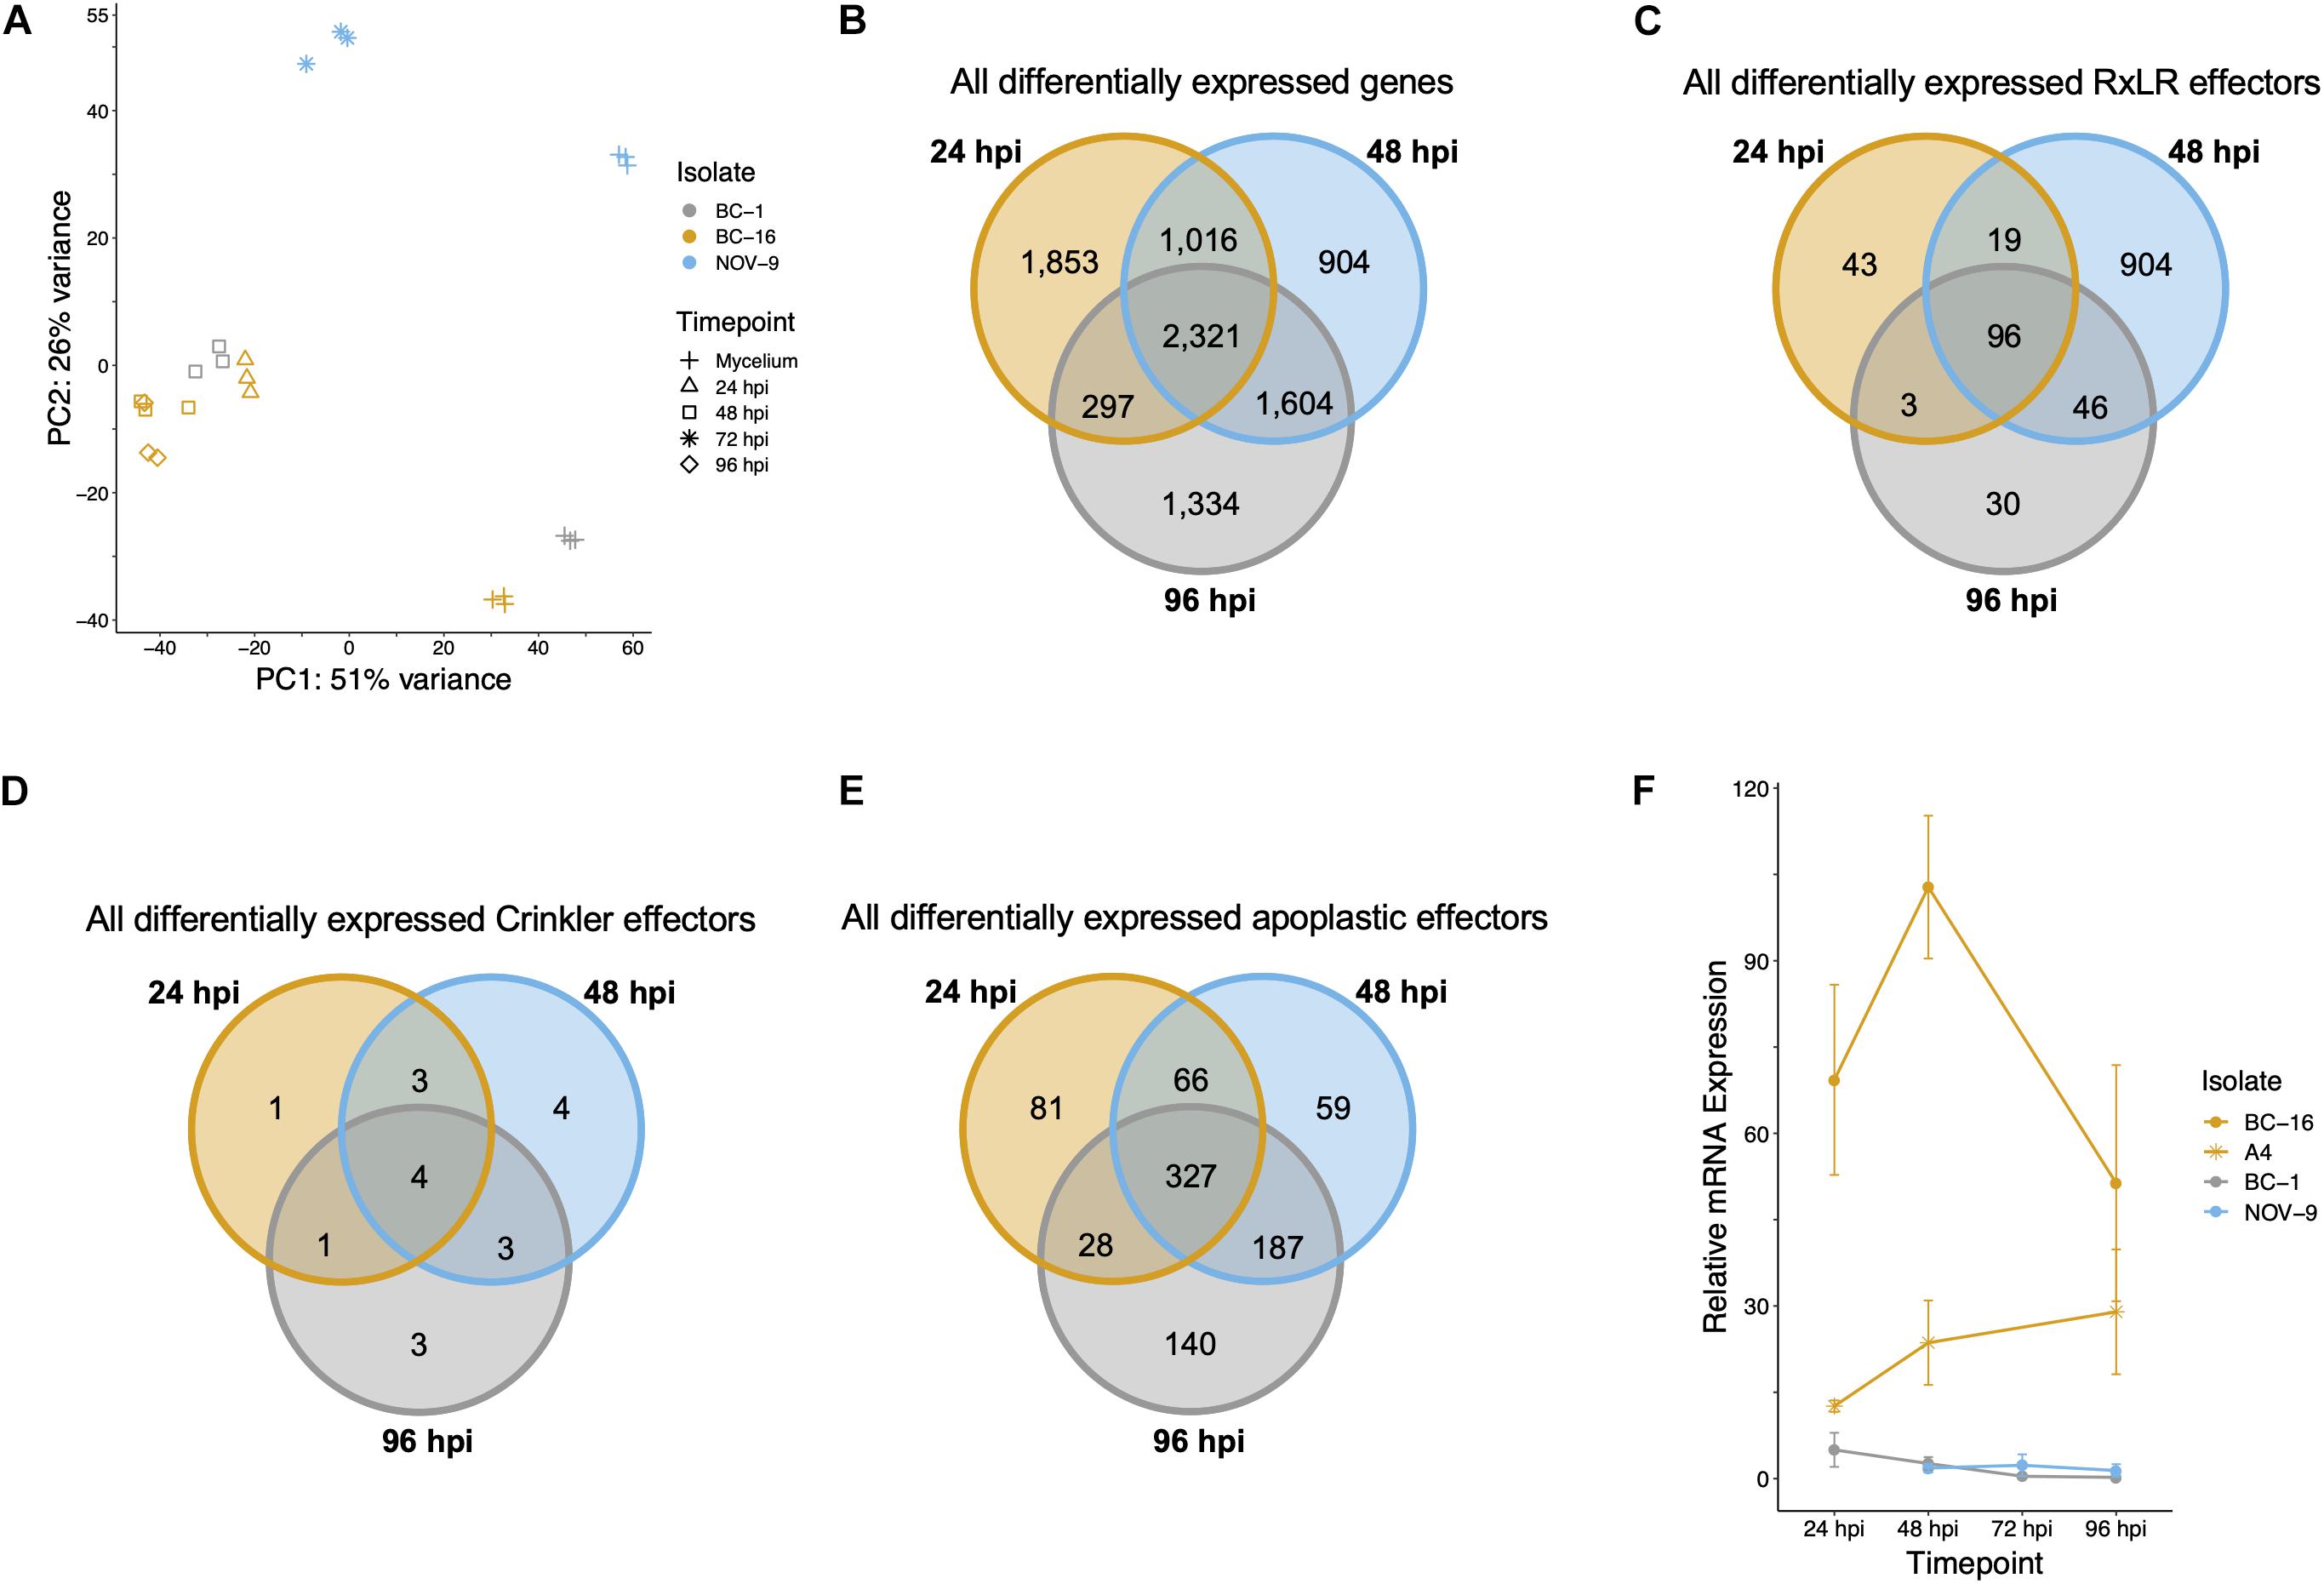
Figure 4. Analysis of expression data showed grouping of biological replicates, a separation of the BC-16 timepoints, changes during the infection process by the BC-16 isolate and confirmation of the differential expression of a candidate avirulence gene. (A) Principal component analysis of the differentially expressed transcripts for all analysed RNA-Seq experiments. RNA-Seq reads were aligned to the assembly of the BC-16 isolate of Phytophthora fragariae using STAR version 2.5.3a (Dobin et al., 2013). Predicted transcripts were then quantified with featureCounts version 1.5.2 (Liao et al., 2014) and differential expression was identified with the DESeq2 version 1.10.1 R package (Love et al., 2014). Following this, an rlog transformation of the expression data was plotted as a principal component analysis with R Core Team (2016). (B) Venn diagram of all differentially expressed transcripts during the BC-16 infection timecourse experiment. (C) Venn diagram of all differentially expressed predicted RxLR effectors during the BC-16 infection timecourse experiment. (D) Venn diagram of all differentially expressed predicted Crinkler effectors during the BC-16 infection timecourse experiment. (E) Venn diagram of all differentially expressed predicted apoplastic effectors during the BC-16 infection timecourse experiment. Venn diagrams were plotted using the VennDiagram R package (Chen and Boutros, 2011) in R Core Team (2016). (F) Quantitative reverse transcription PCR of a strong candidate for the avirulence gene possessed by BC-16 and A4, but not BC-1 and NOV-9 (PF003_g27513.t1). Plots created by the ggplot2 R package (Wickham, 2016) in R version 3.4.3 (R Core Team, 2017).
Levels of expression of effector genes were also assessed. A total of 274 (26%) RxLR effectors, 27 (31%) CRNs and 880 (18%) putative apoplastic effectors from BC-16 showed evidence of expression above the FPKM threshold of 5 in at least one sequenced time point. The majority of these effector genes also showed evidence of differential expression during in planta time points compared to in vitro mycelium. A total of 253 (24%) RxLR effectors, 19 (22%) CRNs and 888 (18%) putative apoplastic effectors showed an LFC greater than or equal to one or less than or equal to minus one, representing wide scale transcriptional reprogramming of effector genes during infection (Figures 4C–E). Ranking of the fifty highest expressed genes in planta with a LFC of ≥3 in comparison to its respective mycelium, identified four putative RxLR genes that were upregulated by all three isolates (Table 6). These genes represent putative core P. fragariae RxLR’s important for pathogenicity on strawberry. Interestingly, a BLASTP search of one of these putative core effectors, PF003_g16448 (amino acids 19-139), showed homology to P. sojae Avr1b (58% pairwise identity), GenBank accession AF449625 (Shan et al., 2004).
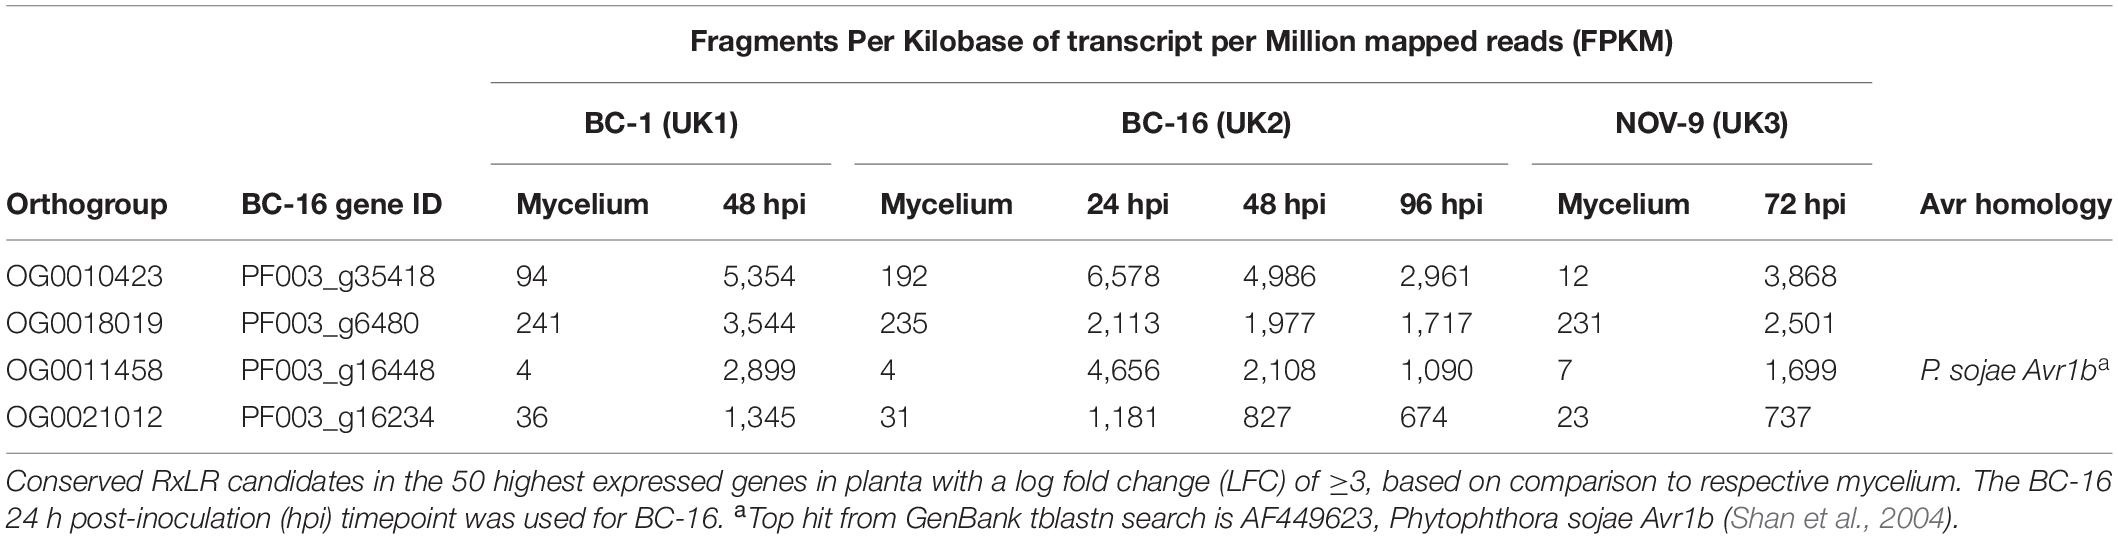
Table 6. Conserved putative core Phytophthora fragariae RxLR effector candidates important for pathogenicity on strawberry (Fragaria × ananassa) from isolates BC-1, BC-16 and NOV-9.
RxLR Effector PF003_g27513 Is a Strong Candidate for PfAvr2
Comparing transcripts with the highest LFC (in planta vs. mycelium) between isolates led to the identification of the putative RxLR effector encoding transcript PF003_g27513.t1 as a potential candidate for PfAvr2 in BC-16. PF003_g27513 had a peak FPKM value in BC-16 of 9,392 compared to peaks of 0 and 33, in BC-1 and NOV-9, respectively (Supplementary Table S5). Subsequent RT-qPCR analysis of further timepoints in the in planta timecourse supported the findings of the RNA-Seq timepoints and showed the expression of putative PfAvr2 in the UK2 isolates BC-16 and A4 was significantly (p < 0.05) different to those from all samples of BC-1 (UK1) and NOV-9 (UK3; Figure 4F). A BLASTP search of PF003_g16448 (amino acids 26-137) revealed homology to P. sojae Avh6/Avr1d (37% pairwise identity), GenBank accession JN253642 (Wang et al., 2011; Na et al., 2013).
The surrounding sequence of putative PfAvr2 in BC-16, BC-1 and NOV-9 was investigated for sequence variants that may explain the expression difference. As no variants were identified near the gene from the above mentioned variant panel, an assembly of the NOV-9 isolate was created from Nanopore sequencing data, producing an assembly of 93.72 Mbp in 124 contigs with an N50 of 1,260 Kb. This resulted in the identification of a SNP from T in BC-16 to G in NOV-9 ∼14 Kb downstream of the stop codon and a 30 bp insertion in NOV-9 ∼19 Kb upstream of the start codon (Figure 5A). The upstream variant appeared to be a sequencing error following the investigation of the alignment of short reads of BC-16 and NOV-9 to each assembly and so was rejected. Expression of the genes surrounding PF003_g27513 was investigated and PF003_g27514, directly upstream of putative PfAvr2 is expressed by all three isolates (Supplementary Table S5).
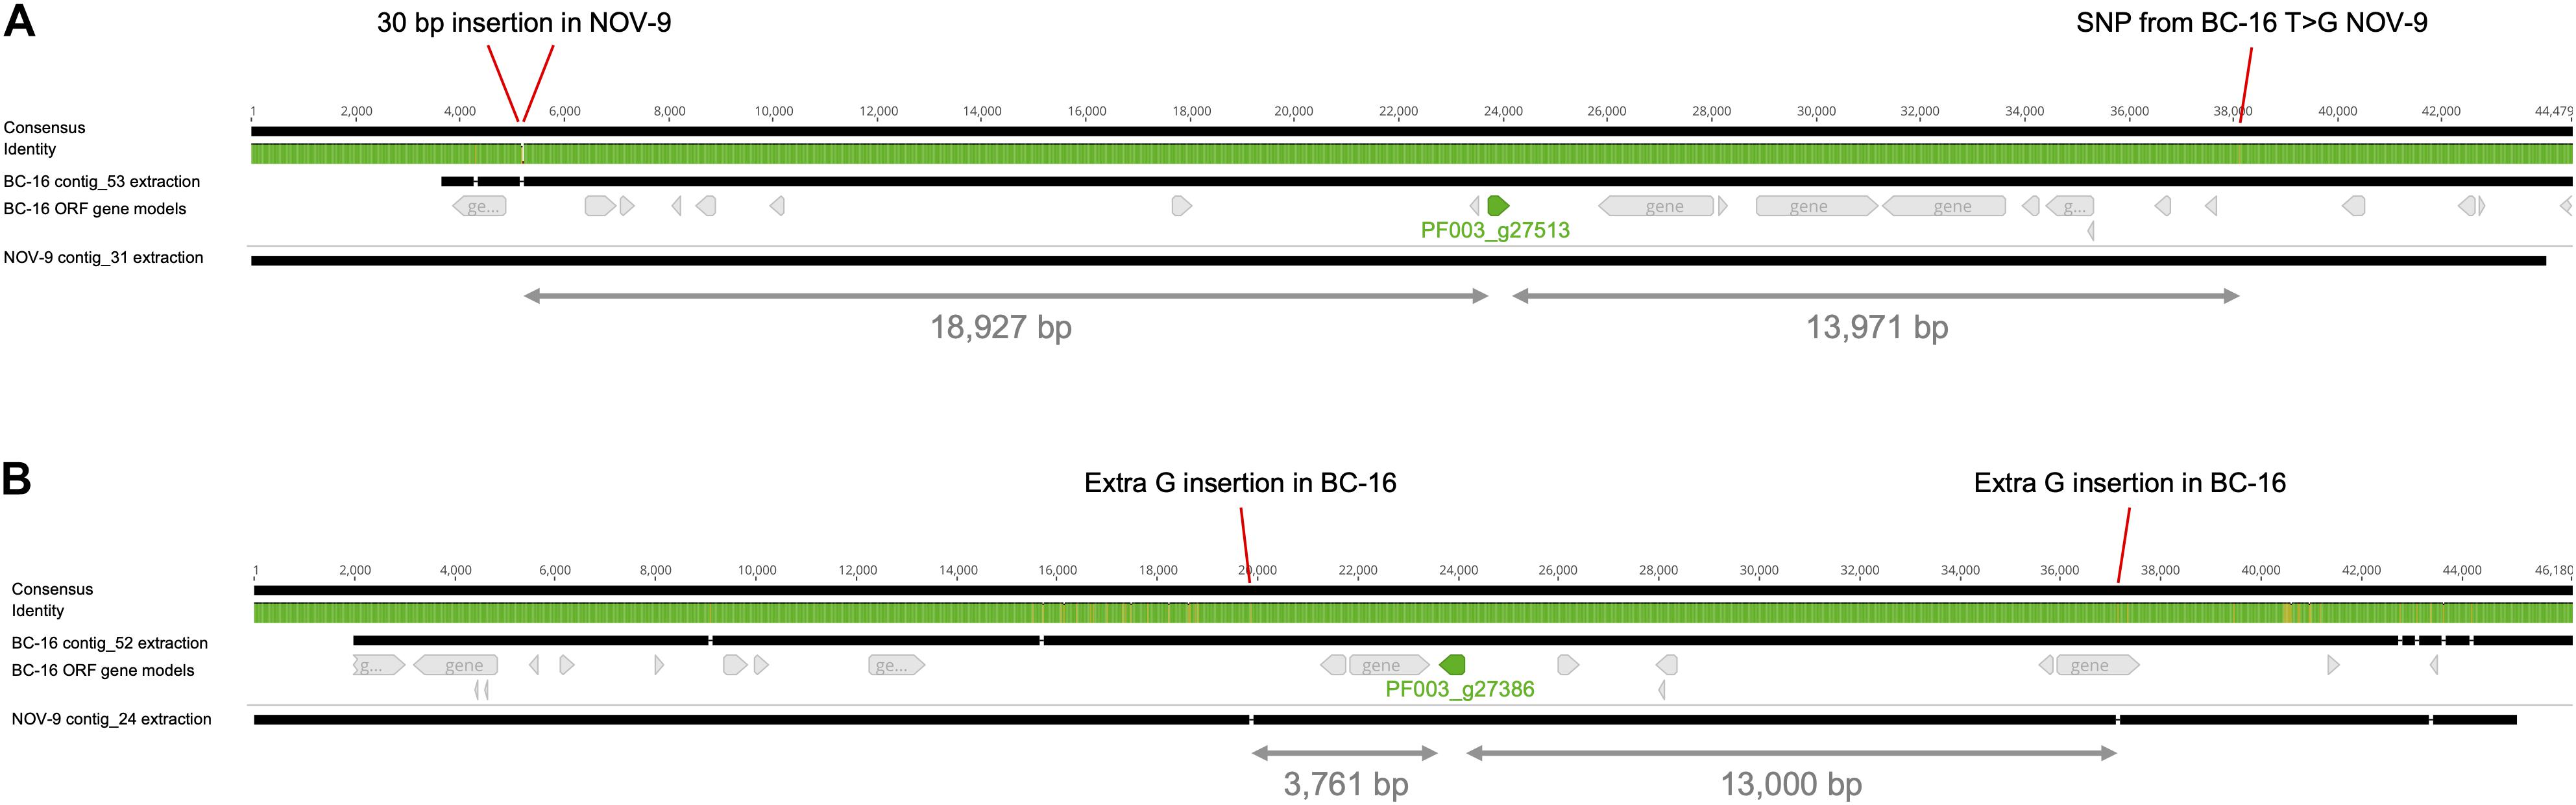
Figure 5. Differential expression of putative PfAvr2 and PfAvr3 is not due to sequence variation in Phytophthora fragariae BC-16 (UK2) and NOV-9 (UK3) genomes. Regions surrounding candidate avirulence genes, PfAvr2 and PfAvr3, from BC-16 and NOV-9 aligned with MAFFT in Geneious R10 (Katoh et al., 2002; Katoh and Standley, 2013). Black bars indicate contiguous sequences and gaps are represented by dashes. Identity is shown for all sequences in the alignment, green denotes residues at that position are the same across all sequences, yellow denotes less than complete identity and red denotes very low identity for the given position. (A) Putative PfAvr2, showing a 30 bp insertion in the NOV-9 sequence upstream of PF003_g27513 (shown in green) and a T to G SNP in NOV-9 downstream of the gene of interest. (B) Putative PfAvr3, showing an extra G insertion in BC-16 upstream of PF003_g27386 (an orthologue of PF009_g26267; shown in green) and an extra G insertion in BC-16 3,761 bp downstream.
Additionally, putative transcription factors and transcriptional regulators were identified in all sequenced genomes. This resulted in the identification of 269 genes in the BC-16 isolate of P. fragariae. However, analysis of gene loss or gain and an investigation of variant sites showed no race specific differences, though expression level variation was observed.
RxLR Effector PF009_g26276 Is a Putative Candidate for PfAvr3
Further analysis of the RNA-Seq datasets identified the putative RxLR effector encoding transcript PF009_g26276 (an orthologue of PF003_g27386) as a potential candidate for PfAvr3 in NOV-9, with a peak FPKM value in NOV-9 of 199 compared to in planta peaks of 6 and 12 in BC-1 and BC-16, respectively (Supplementary Table S6). Similar to putative PfAvr2, no sequence differences in putative PfAvr3 were observed between the three isolates. Analysis of the surrounding region between NOV-9 and BC-16 showed no sequence differences 13,000 bp upstream and 3,761 bp downstream of PF009_g26276 (Figure 5B). The two genes upstream from putative PfAvr3 are not expressed in any isolate (Supplementary Table S6), whereas the gene directly downstream in BC-16, PF003_g27385, is expressed by all the three isolates analysed.
Subsequent RT-qPCR analysis of further timepoints in the in planta time course revealed that the putative PfAvr3 was not expressed during any timepoints by the UK1 isolate BC-1 or by the UK2 isolates BC-16 and A4 (Supplementary Figure S2). However, absolute expression of PF009_g26276 in NOV-9 remained low. Expression in NOV-9 at 72 hpi was significantly (p < 0.05) greater than those from all samples of BC-1, BC-16, and A4.
Candidate Genes for PfAvr1 Identified From Expression Level Variation
Analysis of the RNA-Seq datasets did not reveal an obvious candidate for PfAvr1. Further analysis using custom scripts identified genes, which were uniquely expressed in BC-1 and those uniquely differentially expressed. These genes were scored for confidence of race avirulence determinant; high, medium and low. No genes were identified in the high confidence class in BC-1, but four genes were scored as medium confidence, one of which was a putative apoplastic effector (Supplementary Table S7). The analysis was repeated for BC-16 and NOV-9, in case the putative RxLR candidates are not PfAvr2 and PfAvr3, respectively (Supplementary Table S7).
Discussion
Understanding pathogenicity of plant pathogens is critical for developing durable resistance strategies. P. fragariae is a continuing threat to strawberry production. The UK1-2-3 population displayed clear separation from the other isolates of P. fragariae in this study. Two putative avirulence candidates for UK2 and UK3 were identified through population resequencing and analyses of gene expression during P. fragariae infection. We have shown that there are no distinguishing gene loss or gain events, INDELs or SNPs associated with race variation in UK1-2-3. Our results also suggest that the polymorphisms associated with avirulence to race UK2 and UK3 resistance is controlled in trans or with other stable forms of epigenetic modulating gene expression.
This study utilised long read sequencing technologies to improve the contiguity of the P. fragariae genome through the assembly of a greater amount of repeat rich sequence. Though this assembly still fell short of the estimated chromosome number of 10 – 12 (Brasier et al., 1999), at 180 contigs, it is a significant improvement over the previous assemblies that utilised solely short read technologies and produced relatively fragmented assemblies, comprised of >1,000 contigs each (Gao et al., 2015; Tabima et al., 2017). The increase in size of the assembly presented (91 Mb), suggests that the assembly includes an increased amount of repetitive sequence, indicating that it represents a more complete genome assembly than previous attempts. Although the assembly presented here was larger than previously reported assemblies, it is similar in size to the related Clade 7b species P. sojae (95 Mb; Tyler et al., 2006). This study produced assemblies of an additional ten isolates of P. fragariae and three isolates of the closely related raspberry pathogen P. rubi with short read technology. These assemblies were of similar sizes and contiguity to those previously published (Gao et al., 2015; Tabima et al., 2017).
All assemblies produced from PacBio and Illumina sequencing were annotated and putative effector genes were predicted. The gene model totals are likely inflated, due to the use of a greedy approach to effector gene prediction, to ensure the capture of all possible virulence genes. ApoplastP appeared to over-predict effectors, likely due to statistical issues arising from the use of a training set far smaller than the query set used in this study (Pritchard and Broadhurst, 2014). Interestingly, twice as many CRNs were predicted in P. rubi than P. fragariae on average (average of 118 in P. rubi and 67 in P. fragariae), though this was not consistent for all P. rubi isolates. In comparison to P. sojae, the BC-16 isolate was predicted to possess approximately 50% more RxLRs and twice as many CRNs from RNA-Seq guided gene models (Tyler et al., 2006). This difference may have been due to improvements in prediction strategies, as the number of CRNs was similar to those predicted for the Clade 1 species P. cactorum (Armitage et al., 2018). However for RxLR effectors this difference is likely explained by the greedy approach taken for gene prediction in this study. Following the validation of gene models by RNA-Seq data, the likely overprediction of effector genes was also shown by the low percentage of these classes of genes showing evidence of expression.
This work also allowed the resolution of P. fragariae race schemes between different countries, Canadian race 1 is equivalent to United Kingdom race 1, Canadian race 2 is equivalent to United Kingdom race 3 and both Canadian race 3 and United States race 4 is equivalent to United Kingdom race 2. This provided further support for the proposed gene-for-gene model of resistance in this pathosystem (van de Weg, 1997a). However, construction of orthology groups for all isolates of P. fragariae and P. rubi did not show the presence of proteins unique to the races UK1, UK2, and UK3. Additionally, the identification of variant sites, with the BC-16 genome acting as a reference, indicated there were only private variants present in UK2, with none identified in UK1 or UK3. None of these variants were in proximity to genes thought to be involved in pathogenicity. Additionally, analysis of population structure confirmed the previously described species separation of P. fragariae and P. rubi (Man in ’t Veld, 2007; Tabima et al., 2018) and identified a subpopulation consisting of the isolates of P. fragariae of UK1-2-3 on which further investigations focused.
Transcriptome analyses led to the identification of a strong candidate for PfAvr2, which was shown to be highly expressed in all in planta BC-16 timepoints, compared to evidence of no, or very low levels of expression in any BC-1 (UK1) or NOV-9 (UK3) samples. The strongest candidate for PfAvr3 was also shown to be differentially expressed between races, but not as highly expressed in NOV-9 as observed for putative PfAvr2. RT-qPCR confirmed the PfAvr2 results and additionally showed expression of PfAvr2 in the other sequenced UK2 isolate, A4. The assay showed high levels of variability, which was due to variation between biological replicates, likely the result of the inability of the inoculation method to control the quantity of zoospores inoculating an individual plant. Further in planta experiments and RT-qPCR of additional isolates are required to investigate the observations of putative PfAvr3.
We propose that silencing of putative PfAvr2 in races UK1 and UK3, enables those isolates to evade recognition in Rpf2 possessing plants, such as “Redgauntlet”, but not in plants possessing “Rpf1” or “Rpf3”, respectively. Silencing of putative PfAvr3 also enables races UK1 and UK2 to evade recognition in Rpf3 possessing plants, as long as they also do not possess Rpf1 and Rpf3. Whilst the exact mechanism of putative PfAvr2 and PfAvr3 silencing was not identified in this study, long read sequencing of a race UK3 isolate (NOV-9) identified a single SNP, 14 kb downstream of the stop codon of putative PfAvr2 and variation in expression of transcription factors was observed in the RNA-Seq data. This indicated that epigenetic modifications could explain the observed transcriptional variation in these epialleles. Multiple examples of gain in virulence through silenced epialleles have been reported in P. sojae; Avr1a, Avr1b, Avr1c, and Avr3a/5 (Shan et al., 2004; Qutob et al., 2009, 2013; Dong et al., 2011). In the P. sojae Avr3a gene, (small) sRNAs (24–26 nt in length) were identified as having a role in the heritable silencing of the gene (Qutob et al., 2013). In other isolates of P. sojae, variations in the promoter regions were attributed to the transcriptional differences (Dong et al., 2011). More recently, investigations of the EC-1 clonal lineage of P. infestans also revealed in the absence of genetic mutations, that differences in the expression level of Avrvnt1 were detected that correlated with virulence on potato plants possessing the Rpi-vnt1.1 gene (Pais et al., 2018). Further demonstrating that transcriptional silencing of effectors is a known mechanism that Phytophthora spp. employ to rapidly evade the activation of host R-gene-mediated immunity. However, the mechanisms underlying the rapid, adaptable and reversible silencing are poorly understood.
Adenine N6-methylation (6 mA) has been identified as an important epigenetic mark for the regulation of gene expression in Phytophthora spp., recent work in P. infestans and P. sojae identified evidence of 6mA methylation, alongside a lack of evidence of 5-methylcytosine (5mC) DNA methylation (Chen et al., 2018). It is also possible that chromatin modifications may be involved in controlling the expression differences, as demonstrated in P. infestans (van West et al., 2008; Chen et al., 2018). Investigation of these possibilities, while not achievable in the current study is a clear direction for future research, having implications in the understanding of the evolution of virulence in Phytophthora spp.
Nearly all P. fragariae isolates investigated in this study were collected from around Canada between 2001–2012. The SCRP245 isolate was identified as an intermediate between the UK1-2-3 population and the population represented by the BC-23 and ONT-3 isolates. SCRP245 could represent a rare hybrid of the two populations. However, due to the small sample size of isolates, the low number of SNP sites available for this analysis and the fact it was isolated in 1945 in the UK, at least 55 years before the other isolates, it appears more likely that SCRP245 represents a separate population but the data available were unable to resolve this fully. Further race typing with differential strawberry genotypes is required to ascertain the relationship between isolates of Canadian races 4 and 5.
Races of asexual species have been shown to evolve by the stepwise accumulation of mutations (Del Mar Jiménez-Gasco et al., 2004). One such example is the successive evolution of multiple pathotypes in a single clonal lineage of the wheat pathogen Puccinia striiformis f. sp. tritici in Australia and New Zealand (Steele et al., 2001). In comparison, our data do not indicate that P. fragariae has undergone simple stepwise evolution of effectors, but we rather postulate that some lineages of P. fragariae have been present for long periods of time in nature, evident by the large number of SNP differences and well supported branches and that the emergence of races (e.g., UK1-2-3) is fairly recent, possibly as a result of the R-genes deployed in commercial strawberries. The increased selection pressure on P. fragariae to overcome these genes, or the break-up of “wild” R-gene stacks upon hybridisation of octoploid strawberry species, may have led to very rapid evolution of races, in this case through epigenetic silencing of gene expression, to evade the R-genes present in common cultivars. Substantial further sampling from multiple geographic regions would be required to fully decipher population structure in the lineages of P. fragariae and the resistance status of wild octoploid Fragaria species. We predict that this would lead to the observation of other geographically distinct lineages of genetically similar individuals of P. fragariae but with similar differences in pathogenicity on strawberry. The implications of these findings highlight the potential adaptability of P. fragariae to modify effector expression to evade host resistance and the threat of the emergence of new races. Future strawberry breeding efforts must deploy cultivars with multiple resistance genes to mitigate against the rapid adaptation of P. fragariae. Identifying resistance genes that recognise the conserved core RxLRs identified in this study would enable broad-spectrum resistance to this pathogen to be deployed that would be effective against multiple races. One of the conserved highly expressed RxLRs was shown to have homology to P. sojae Avr1b and so identifying homologous R-genes to Rsp1b in strawberry could be a future avenue of work to provide resistance against multiple races.
Conclusion
In conclusion, we have shown for the first time that within a distinct subpopulation of P. fragariae isolates, displaying remarkably low levels of polymorphisms, the ability to cause disease on a range of differing strawberry cultivars was associated with variation in transcriptional levels rather than being due to sequence variation, similar to reports in P. sojae and P. infestans. This study presents a large amount of data, including an improved, long read assembly of P. fragariae alongside a collection of resequenced isolates of P. fragariae and P. rubi, and transcriptome data from multiple isolates that is a valuable resource for future studies.
Data Availability Statement
The datasets, including all assemblies and annotations, generated for this study are available on NCBI GenBank as part of BioProjects PRJNA396163 and PRJNA488213 with accession numbers of SAMN07449679–SAMN07449692. Raw sequencing reads have been deposited in the NCBI SRA, DNA-Seq reads are available with accession codes SRR7668085–SRR7668100 and P. fragariae RNA-Seq reads are available with accession codes SRR7764607–SRR7764615. P. rubi RNA-Seq reads are available with the accession codes SRR10207404–SRR10207405.
Author Contributions
RH, CN, and TA devised the study. RH, CN, and JD co-supervised TA’s Ph.D. study, within which some of this work was undertaken. TA performed the experimental work, with contributions from CN and drafted the manuscript with input from CN, JD, and RH. AA assisted with the development of genome assembly, annotation, and orthology pipelines. MS developed elements of the variant calling pipeline and structure analysis with TA. HB performed Nanopore and MiSeq sequencing. JT, BK, BT, and NG provided RNA-Seq reads of P. rubi for genome annotation. All authors read and approved the submission.
Conflict of Interest
The authors declare that the research was conducted in the absence of any commercial or financial relationships that could be construed as a potential conflict of interest.
Funding
This research was supported by grants awarded from the Biotechnology and Biological Sciences Research Council (BBSRC) to RH (BB/K017071/1, BB/K017071/2 and BB/N006682/1) and Sophien Kamoun (BB/K018639/1).
Acknowledgments
Elements of this work were previously included in TA’s Ph.D. thesis at the University of Reading (Adams, 2019). The authors gratefully acknowledge the East Malling Strawberry Breeding Club for access to strawberry material, to Dr. Andrew R. Jamieson for the P. fragariae isolates as well as Dr. David E.L. Cooke for the P. rubi isolates and P. fragariae SCRP245. The authors also gratefully acknowledge Prof. Sophien Kamoun, Dr. Eric van de Weg and Dr. Thijs van Dijk for useful discussions. In addition, we wish to thank the following people for the help received in the preparation and setting up of experiments Dr. Helen M. Cockerton, Dr. Laura A. Lewis, and Mr. Joseph Hutchings, as well as the members of RH’s group. Work was carried out under the terms of DEFRA Plant Health Licence 6996/221427 held by RH/CN.
Supplementary Material
The Supplementary Material for this article can be found online at: https://www.frontiersin.org/articles/10.3389/fmicb.2020.00490/full#supplementary-material
FIGURE S1 | Agarose gel electrophoresis of RT-PCR reactions on representative samples from inoculation time course experiments on the “Hapil” cultivar of Fragaria × ananassa. (A) Gel of samples from an inoculation time course experiment with the BC-16 isolate of Phytophthora fragariae. L: 100 bp Plus Ladder (Thermo Fisher Scientific, Waltham, MA, United States). 1: Mock inoculated Fragaria × ananassa cultivar “Hapil” plant. 2: Time course of inoculated plants with stream water used as the flooding solution. Time points from left to right: 24 h post-inoculation (hpi), 48 hpi, 96 hpi, 144 hpi, 192 hpi, and 240 hpi. 3: Time course of inoculated plants with Petri’s solution used as the flooding solution. Time points from left to right: 24 hpi, 48 hpi, 96 hpi, and 144 hpi. 4: dH2O control. 5: “Flamenco” gDNA control. 6: BC-16 gDNA control. B: Gel of samples from an inoculation time course experiment with the BC-1 and NOV-9 isolates of P. fragariae. L: 100 bp Plus Ladder from New England Biolabs. PCR templates: 1: Uninoculated plant cDNA. 2: NOV-9 12 hpi cDNA. 3: BC-1 12 hpi cDNA. 4: NOV- 9 24 hpi cDNA. 5: BC-1 24 hpi cDNA. 6: NOV-9 48 hpi cDNA. 7: BC-1 48 hpi cDNA. 8: NOV-9 72 hpi cDNA. 9: BC-1 72 hpi cDNA. 10: NOV-9 96 hpi cDNA. 11: BC-1 96 hpi cDNA. 12: dH2O control. 13: gDNA from a F. × ananassa cultivar “Hapil” plant. 14: gDNA from BC-16 mycelium. 15: cDNA from BC-16 mycelium.
FIGURE S2 | PfAvr3 candidate PF009_g26276 is differentially expressed in Phytophthora fragariae UK-1-2-3 isolates. Quantitative reverse transcription PCR of a candidate for the avirulence gene possessed by NOV-9, but not BC-1, BC-16 and A4 (PF009_g26276.t1). Plots created by the ggplot2 R package (Wickham, 2016) in R version 3.4.3 (R Core Team, 2017).
TABLE S1 | Primers used in this study. Primers supplied by IDT (Leuven, Belgium).
TABLE S2 | Details of all predicted genes in Phytophthora fragariae UK2 isolate BC-16.
TABLE S3 | Details of gene names for all orthogroups in Phytophthora fragariae and Phytopthora rubi.
TABLE S4 | Details of private variant sites identified in isolates of race UK2.
TABLE S5 | Details of expression of genes surrounding putative PfAvr2 (PF003_g27513).
TABLE S6 | Details of expression of genes surrounding putative PfAvr3 (PF003_g27386/PF009_g26276).
TABLE S7 | Gene names of all genes identified as putative candidate avirulence genes for Phytophthora fragariae UK1, UK2 and UK3. Gene names are listed with respect to the isolate for which they are described as candidate avirulence genes.
References
Adams, T. M. (2019). Pathogenomics of Phytophthora fragariae, the Causal Agent of Strawberry Red Core Disease. Ph.D. thesis, University of Reading, Reading.
Altschul, S. F., Madden, T. L., Schäffer, A. A., Zhang, J., Zhang, Z., Miller, W., et al. (1997). Gapped BLAST and PSI-BLAST: a new generation of protein database search programs. Nucleic Acids Res. 25, 3389–3402. doi: 10.1093/nar/25.17.3389
Armenteros, J. J. A., Tsirigos, K. D., Sønderby, C. K., Petersen, T. N., Winther, O., Brunak, S., et al. (2019). SignalP 5.0 improves signal peptide predictions using deep neural networks. Nat. Biotechnol. 37, 420–423. doi: 10.1038/s41587-019-0036-z
Armitage, A. D., Lysøe, E., Nellist, C. F., Lewis, L. A., Cano, L. M., Harrison, R. J., et al. (2018). Bioinformatic characterisation of the effector repertoire of the strawberry pathogen Phytophthora cactorum. PLoS One 13:e0202305. doi: 10.1371/journal.pone.0202305
Aronesty, E. (2013). Comparison of sequencing utility programs. Open Bioinform. J. 7, 1–8. doi: 10.2174/1875036201307010001
Bankevich, A., Nurk, S., Antipov, D., Gurevich, A. A., Dvorkin, M., Kulikov, A. S., et al. (2012). SPAdes: a new genome assembly algorithm and its applications to single-cell sequencing. J. Comput. Biol. 19, 455–477. doi: 10.1089/cmb.2012.0021
Bendtsen, J. D., Nielsen, H., von Heijne, G., and Brunak, S. (2004). Improved prediction of signal peptides: signalP 3.0. J. Mol. Biol. 340, 783–795. doi: 10.1016/j.jmb.2004.05.028
Brasier, C. M., Cooke, D. E., and Duncan, J. M. (1999). Origin of a new Phytophthora pathogen through interspecific hybridization. Proc. Natl. Acad. Sci. U.S.A. 96, 5878–5883. doi: 10.1073/pnas.96.10.5878
Buitrago-Flórez, F. J., Restrepo, S., and Riaño-Pachón, D. M. (2014). Identification of transcription factor genes and their correlation with the high diversity of stramenopiles. PLoS One 9:e111841. doi: 10.1371/journal.pone.0111841
Campbell, A. M., Moon, R. P., Duncan, J. M., Gurr, S.-J., and Kinghorn, J. R. (1989). Protoplast formation and regeneration from sporangia and encysted zoospores of Phytophthora infestans. Physiol. Mol. Plant P. 34, 299–307. doi: 10.1016/0885-5765(89)90027-1
Chen, H., and Boutros, P. C. (2011). VennDiagram: a package for the generation of highly-customizable Venn and Euler diagrams in R. BMC Bioinformatics 12:35. doi: 10.1186/1471-2105-12-35
Chen, H., Shu, H., Wang, L., Zhang, F., Li, X., Ochola, S. O., et al. (2018). Phytophthora methylomes are modulated by 6mA methyltransferases and associated with adaptive genome regions. Genome Biol. 19:181. doi: 10.1186/s13059-018-1564-4
Chin, C.-S., Alexander, D. H., Marks, P., Klammer, A. A., Drake, J., Heiner, C., et al. (2013). Nonhybrid, finished microbial genome assemblies from long-read SMRT sequencing data. Nat. Methods 10, 563–569. doi: 10.1038/nmeth.2474
Chin, C.-S., Peluso, P., Sedlazeck, F. J., Nattestad, M., Concepcion, G. T., Clum, A., et al. (2016). Phased diploid genome assembly with single-molecule real-time sequencing. Nat. Methods 13, 1050–1054. doi: 10.1038/nmeth.4035
Clifford, R. J., Milillo, M., Prestwood, J., Quintero, R., Zurawski, D. V., Kwak, Y. I., et al. (2012). Detection of bacterial 16S rRNA and identification of four clinically important bacteria by real-time PCR. PLoS One 7:e48558. doi: 10.1371/journal.pone.0048558
Cui, C., Herlihy, J., Bombarely, A., McDowell, J. M., and Haak, D. C. (2019). Draft assembly of Phytopthora capsici from long-read sequencing uncovers complexity. Mol. Plant Microbe Interact. 32, 1559–1563. doi: 10.1094/MPMI-04-19-0103-TA
Danecek, P., Auton, A., Abecasis, G., Albers, C. A., Banks, E., DePristo, M. A., et al. (2011). The variant call format and VCFtools. Bioinformatics 27, 2156–2158. doi: 10.1093/bioinformatics/btr330
Del Mar Jiménez-Gasco, M., Milgroom, M. G., and Jiménez-Díaz, R. M. (2004). Stepwise evolution of races in Fusarium oxysporum f. sp. ciceris inferred from fingerprinting with repetitive DNA sequences. Phytopathology 94, 228–235. doi: 10.1094/PHYTO.2004.94.3.228
Dobin, A., Davis, C. A., Schlesinger, F., Drenkow, J., Zaleski, C., Jha, S., et al. (2013). STAR: ultrafast universal RNA-seq aligner. Bioinformatics 29, 15–21. doi: 10.1093/bioinformatics/bts635
Dong, S., Qutob, D., Tedman-Jones, J., Kuflu, K., Wang, Y., Tyler, B. M., et al. (2009). The Phytophthora sojae avirulence locus Avr3c encodes a multi-copy RXLR effector with sequence polymorphisms among pathogen strains. PLoS One 4:e5556. doi: 10.1371/journal.pone.0005556
Dong, S., Yu, D., Cui, L., Qutob, D., Tedman-Jones, J., Kale, S. D., et al. (2011). Sequence variants of the Phytophthora sojae RXLR effector Avr3a/5 are differentially recognized by Rps3a and Rps5 in soybean. PLoS One 6:e20172. doi: 10.1371/journal.pone.0020172
Efsa Panel on Plant Health [PLH] (2014). Scientific opinion on the risks to plant health posed by Phytophthora fragariae hickman var. fragariae in the EU territory, with the identification and evaluation of risk reduction options. EFSA J. 12:3539. doi: 10.2903/j.efsa.2014.3539
Emms, D. M., and Kelly, S. (2015). OrthoFinder: solving fundamental biases in whole genome comparisons dramatically improves orthogroup inference accuracy. Genome Biol. 16:157. doi: 10.1186/s13059-015-0721-2
EPPO (2018). EPPO A2 List. Available online at: https://www.eppo.int/ACTIVITIES/plant_quarantine/A2_list (accessed January 31, 2019).
Gao, R., Cheng, Y., Wang, Y., Wang, Y., Guo, L., and Zhang, G. (2015). Genome sequence of Phytophthora fragariae var. fragariae, a quarantine plant-pathogenic fungus. Genome Announc. 3:e00034-15. doi: 10.1128/genomeA.00034-15
Garrison, E. (2012). Vcflib. A C++ Library for Parsing and Manipulating Vcf Files. Available online at: https://github.com/ekg/vcflib (accessed December 19, 2018).
Gurevich, A., Saveliev, V., Vyahhi, N., and Tesler, G. (2013). QUAST: quality assessment tool for genome assemblies. Bioinformatics 29, 1072–1075. doi: 10.1093/bioinformatics/btt086
Haas, B. (2010). TransposonPSI: an Application of PSI-Blast to Mine (Retro-)Transposon ORF Homologies. Available online at: http://transposonpsi.sourceforge.net/ (accessed January 10, 2019).
Hickman, C. J. (1941). The red core root disease of the strawberry caused by Phytophthora fragariae n.sp. J. Pomol. Hortic. Sci. 18, 89–118. doi: 10.1080/03683621.1941.11513556
Hoff, K. J., Lange, S., Lomsadze, A., Borodovsky, M., and Stanke, M. (2016). BRAKER1: Unsupervised RNA-Seq-Based Genome Annotation with GeneMark-ET and AUGUSTUS. Bioinformatics 32, 767–769. doi: 10.1093/bioinformatics/btv661
Judelson, H. S., Coffey, M. D., Arredondo, F. R., and Tyler, B. M. (1993). Transformation of the oomycete pathogen Phytophthora megasperma f. sp. glycinea occurs by DNA integration into single or multiple chromosomes. Curr. Genet. 23, 211–218. doi: 10.1007/BF00351498
Käll, L., Krogh, A., and Sonnhammer, E. L. L. (2004). A combined transmembrane topology and signal peptide prediction method. J. Mol. Biol. 338, 1027–1036. doi: 10.1016/j.jmb.2004.03.016
Katoh, K., Misawa, K., Kuma, K., and Miyata, T. (2002). MAFFT: a novel method for rapid multiple sequence alignment based on fast Fourier transform. Nucleic Acids Res. 30, 3059–3066. doi: 10.1093/nar/gkf436
Katoh, K., and Standley, D. M. (2013). MAFFT multiple sequence alignment software version 7: improvements in performance and usability. Mol. Biol. Evol. 30, 772–780. doi: 10.1093/molbev/mst010
Koren, S., Walenz, B. P., Berlin, K., Miller, J. R., Bergman, N. H., and Phillippy, A. M. (2017). Canu: scalable and accurate long-read assembly via adaptive k-mer weighting and repeat separation. Genome Res. 27, 722–736. doi: 10.1101/gr.215087.116
Langmead, B., and Salzberg, S. L. (2012). Fast gapped-read alignment with Bowtie 2. Nat. Methods 9, 357–359. doi: 10.1038/nmeth.1923
Li, H. (2013). Aligning sequence reads, clone sequences and assembly contigs with BWA-MEM. arXiv [preprint]. Available online at: https://www.scienceopen.com/document?vid=e623e045-f570-42c5-80c8-ef0aea06629c (accessed January 10, 2019).
Li, H. (2018). Minimap2: pairwise alignment for nucleotide sequences. Bioinformatics 34, 3094–3100. doi: 10.1093/bioinformatics/bty191
Li, H., Handsaker, B., Wysoker, A., Fennell, T., Ruan, J., Homer, N., et al. (2009). The sequence alignment/map format and SAMtools. Bioinformatics 25, 2078–2079. doi: 10.1093/bioinformatics/btp352
Liao, Y., Smyth, G. K., and Shi, W. (2014). featureCounts: an efficient general purpose program for assigning sequence reads to genomic features. Bioinformatics 30, 923–930. doi: 10.1093/bioinformatics/btt656
Livak, K. J., and Schmittgen, T. D. (2001). Analysis of relative gene expression data using real-time quantitative PCR and the 2(-Delta Delta C(T)) method. Methods 25, 402–408. doi: 10.1006/meth.2001.1262
Love, M. I., Huber, W., and Anders, S. (2014). Moderated estimation of fold change and dispersion for RNA-seq data with DESeq2. Genome Biol. 15:550. doi: 10.1186/s13059-014-0550-8
Maas, J. L. (1972). Growth and reproduction in culture of ten Phytophthora fragariae races. Mycopathol. Mycol. Appl. 48, 323–334. doi: 10.1007/BF02052636
Malar, C. M., Yuzon, J. D., Das, S., Das, A., Panda, A., Ghosh, S., et al. (2019). Haplotype-phased genome assembly of virulent Phytophthora ramorum isolate ND886 facilitated by long-read sequencing reveals effector polymorphisms and copy number variation. Mol. Plant Microbe Interact. 32, 1047–1060. doi: 10.1094/MPMI-08-18-0222-R
Man in ’t Veld, W. A. (2007). Gene flow analysis demonstrates that Phytophthora fragariae var.rubi constitutes a distinct species, Phytophthora rubi comb. nov. Mycologia 99, 222–226. doi: 10.1080/15572536.2007.11832581
McKenna, A., Hanna, M., Banks, E., Sivachenko, A., Cibulskis, K., Kernytsky, A., et al. (2010). The genome analysis toolkit: a MapReduce framework for analyzing next-generation DNA sequencing data. Genome Res. 20, 1297–1303. doi: 10.1101/gr.107524.110
Na, R., Yu, D., Qutob, D., Zhao, J., and Gijzen, M. (2013). Deletion of the Phytophthora sojae avirulence gene Avr1d causes gain of virulence on Rsp1d. Mol. Plant Microbe Interact. 26, 969–976. doi: 10.1094/MPMI-02-13-0036-R
Nielsen, H., Englebrecht, J., Brunak, S., and von Heijne, G. (1997). Identification of prokaryotic and eukaryotic signal peptides and prediction of their cleavage sites. Protein Eng. 10, 1–6. doi: 10.1093/protein/10.1.1
Pais, M., Yoshida, K., Giannakopoulou, A., Pel, M. A., Cano, L. M., Oliva, R. F., et al. (2018). Gene expression polymorphism underpins evasion of host immunity in an asexual lineage of the Irish potato famine pathogen. BMC Evol. Biol. 18:93. doi: 10.1186/s12862-018-1201-6
Petersen, T. N., Brunak, S., von Heijne, G., and Nielsen, H. (2011). SignalP 4.0: discriminating signal peptides from transmembrane regions. Nat. Methods 8, 785–786. doi: 10.1038/nmeth.1701
Pritchard, L., and Broadhurst, D. (2014). On the statistics of identifying candidate pathogen effectors. Methods Mol. Biol. 1127, 53–64. doi: 10.1007/978-1-62703-986-4_4
Purcell, S., Neale, B., Todd-Brown, K., Thomas, L., Ferreira, M. A. R., Bender, D., et al. (2007). PLINK: a tool set for whole-genome association and population-based linkage analyses. Am. J. Hum. Genet. 81, 559–575. doi: 10.1086/519795
Qutob, D., Chapman, B. P., and Gijzen, M. (2013). Transgenerational gene silencing causes gain of virulence in a plant pathogen. Nat. Commun. 4, 1349–1346. doi: 10.1038/ncomms2354
Qutob, D., Tedman-Jones, J., Dong, S., Kuflu, K., Pham, H., Wang, Y., et al. (2009). Copy number variation and transcriptional polymorphisms of Phytophthora sojae RXLR effector genes Avr1a and Avr3a. PLoS One 4:e5066–e5016. doi: 10.1371/journal.pone.0005066
R Core Team (2016). R: A Language and Environment for Statistical Computing. Vienna: R Foundation for Statistical Computing.
R Core Team (2017). R: A Language and Environment for Statistical Computing. Vienna: R Foundation for Statistical Computing.
Raj, A., Stephens, M., and Pritchard, J. K. (2014). fastSTRUCTURE: variational inference of population structure in large SNP data sets. Genetics 197, 573–589. doi: 10.1534/genetics.114.164350
Robinson Boyer, L., Feng, W., Gulbis, N., Hajdu, K., Harrison, R. J., Jeffries, P., et al. (2016). The use of arbuscular mycorrhizal fungi to improve strawberry production in coir substrate. Front. Plant. Sci. 7:1237. doi: 10.3389/fpls.2016.01237
Ruan, J. (2018). SMARTdenovo: Ultra-Fast de Novo Assembler using Long Noisy Reads. Available online at: https://github.com/ruanjue/smartdenovo (accessed January 10, 2019).
Shan, W., Cao, M., Leung, D., and Tyler, B. M. (2004). The Avr1b locus of Phytophthora sojae encodes an elicitor and a regulator required for avirulence on soybean plants carrying resistance gene Rps1b. Mol. Plant Microbe Interact. 17, 394–403. doi: 10.1094/MPMI.2004.17.4.394
Shulaev, V., Sargent, D. J., Crowhurst, R. N., Mockler, T. C., Folkerts, O., Delcher, A. L., et al. (2011). The genome of woodland strawberry (Fragaria vesca). Nat. Genet. 43, 109–116. doi: 10.1038/ng.740
Simão, F. A., Waterhouse, R. M., Ioannidis, P., Kriventseva, E. V., and Zdobnov, E. M. (2015). BUSCO: assessing genome assembly and annotation completeness with single-copy orthologs. Bioinformatics 31, 3210–3212. doi: 10.1093/bioinformatics/btv351
Simpson, J. (2018). Nanopolish: Signal-level Algorithms for MinION Data. Available online at: https://github.com/jts/nanopolish (accessed January 10, 2019).
Smit, A. F. A., and Hubley, R. (2015). RepeatModeler Open-1.0. Available online at: http://www.repeatmasker.org (accessed January 10, 2019).
Smit, A. F. A., Hubley, R., and Green, P. (2015). RepeatMasker Open-4.0. Available online at: http://www.repeatmasker.org (accessed January 10, 2019).
Sperschneider, J., Dodds, P. N., Singh, K. B., and Taylor, J. M. (2018). ApoplastP: prediction of effectors and plant proteins in the apoplast using machine learning. New Phytol. 217, 1764–1778. doi: 10.1111/nph.14946
Steele, K. A., Humphreys, E., Wellings, C. R., and Dickinson, M. J. (2001). Support for a stepwise mutation model for pathogen evolution in Australasian Puccinia striiformis f.sp. tritici by use of molecular markers. Plant Pathol. 50, 174–180. doi: 10.1046/j.1365-3059.2001.00558.x
Tabima, J. F., Coffey, M. D., Zazada, I. A., and Grünwald, N. J. (2018). Populations of Phytophthora rubi show little differentiation and high rates of migration among states in the Western United States. Mol. Plant Microbe Interact. 31, 614–622. doi: 10.1094/MPMI-10-17-0258-R
Tabima, J. F., Kronmiller, B. A., Press, C. M., Tyler, B. M., Zasada, I. A., and Grünwald, N. J. (2017). Whole genome sequences of the raspberry and strawberry pathogens Phytophthora rubi and P. fragariae. Mol. Plant Microbe Interact. 30, 767–769. doi: 10.1094/MPMI-04-17-0081-A
Taylor, A., Vágány, V., Jackson, A. C., Harrison, R. J., Rainoni, A., and Clarkson, J. P. (2016). Identification of pathogenicity-related genes in Fusarium oxysporum f. sp. cepae. Mol. Plant Pathol. 17, 1032–1047. doi: 10.1111/mpp.12346
Testa, A. C., Hane, J. K., Ellwood, S. R., and Oliver, R. P. (2015). CodingQuarry: highly accurate hidden Markov model gene prediction in fungal genomes using RNA-seq transcripts. BMC Genomics 16:170. doi: 10.1186/s12864-015-1344-4
Thorvaldsdóttir, H., Robinson, J. T., and Mesirov, J. P. (2013). Integrative Genomics Viewer (IGV): high-performance genomics data visualization and exploration. Brief. Bioinform. 14, 178–192. doi: 10.1093/bib/bbs017
Tyler, B. M., Tripathy, S., Zhang, X., Dehal, P., Jiang, R. H. Y., Aerts, A., et al. (2006). Phytophthora genome sequences uncover evolutionary origins and mechanisms of pathogenesis. Science 313, 1261–1266. doi: 10.1126/science.1128796
Untergasser, A., Cutcutache, I., Koressaar, T., Ye, J., Faircloth, B. C., Remm, M., et al. (2012). Primer3–new capabilities and interfaces. Nucleic Acids Res. 40:e115. doi: 10.1093/nar/gks596
van de Weg, W. E. (1997a). A gene-for-gene model to explain interactions between cultivars of strawberry and races of Phytophthora fragariae var. fragariae. Theor. Appl. Genet. 94, 445–451. doi: 10.1007/s001220050435
van de Weg, W. E. (1997b). Gene-for-Gene Relationships between Strawberry and the Causal Agent of Red Stele Root Rot, Phytophthora fragariae var. fragariae. Ph.D. thesis, Wageningen Agricultural University, Netherlands.
van de Weg, W. E., Giezen, S., Henken, B., and den Nijs, A. P. M. (1996). A quantitative classification method for assessing resistance to Phytophthora fragariae var. fragariae in strawberry. Euphytica 91, 119–125. doi: 10.1007/BF00035282
van Poppel, P. M., Guo, J., van de Vondervoort, P. J., Jung, M. W., Birch, P. R., Whisson, S. C., et al. (2008). The Phytophthora infestans avirulence gene Avr4 encodes an RXLR-dEER effector. Mol. Plant Microbe Interact. 21, 1460–1470. doi: 10.1094/MPMI-21-11-1460
van West, P., Shepherd, S. J., Walker, C. A., Li, S., Appiah, A. A., Grenville-Briggs, L. J., et al. (2008). Internuclear gene silencing in Phytophthora infestans is established through chromatin remodelling. Microbiology 154, 1482–1490. doi: 10.1099/mic.0.2007/015545-0
Vaser, R., Sović, I., Nagarajan, N., and Šikić, M. (2017). Fast and accurate de novo genome assembly from long uncorrected reads. Genome Res. 27, 737–746. doi: 10.1101/gr.214270.116
Wala, J. A., Bandopadhayay, P., Greenwald, N. F., O’Rourke, R., Sharpe, T., Stewart, C., et al. (2018). SvABA: genome-wide detection of structural variants and indels by local assembly. Genome Res. 28, 581–591. doi: 10.1101/gr.221028.117
Walker, B. J., Abeel, T., Shea, T., Priest, M., Abouelliel, A., Sakthikumar, S., et al. (2014). Pilon: an integrated tool for comprehensive microbial variant detection and genome assembly improvement. PLoS One 9:e112963. doi: 10.1371/journal.pone.0112963
Wang, Q., Han, C., Ferreira, A. O., Yu, X., Ye, W., Tripathy, S., et al. (2011). Transcriptional programming and functional interactions within the Phytophthora sojae RXLR effector repertoire. Plant Cell 23, 2064–2086. doi: 10.1105/tpc.111.086082
Whisson, S. C., Boevink, P. C., Moleleki, L., Avrova, A. O., Morales, J. G., Gilroy, E. M., et al. (2007). A translocation signal for delivery of oomycete effector proteins into host plant cells. Nature 450, 115–118. doi: 10.1038/nature06203
Wick, R. (2018). Porechop: Adapter Trimmer for Oxford Nanopore Reads. Available online at: https://github.com/rrwick/Porechop (accessed January 9, 2019).
Wilcox, W. F., Scott, P. H., Hamm, P. B., Kennedy, D. M., Duncan, J. M., Brasier, C. M., et al. (1993). Identity of a Phytophthora species attacking raspberry in Europe and North America. Mycol. Res. 97, 817–831. doi: 10.1016/S0953-7562(09)81157-X
Yan, H.-Z., and Liou, R.-F. (2006). Selection of internal control genes for real-time quantitative RT-PCR assays in the oomycete plant pathogen Phytophthora parasitica. Fungal Genet. Biol. 43, 430–438. doi: 10.1016/j.fgb.2006.01.010
Yin, W., Dong, S., Zhai, L., Lin, Y., Zheng, X., and Wang, Y. (2013). The Phytophthora sojae Avr1d gene encodes an RxLR-dEER effector with presence and absence polymorphisms among pathogen strains. Mol. Plant Microbe Interact. 26, 958–968. doi: 10.1094/MPMI-02-13-0035-R
Keywords: red core, oomycete, RNA-Seq, host–microbe interactions, nanopore sequencing, population resequencing, race structure
Citation: Adams TM, Armitage AD, Sobczyk MK, Bates HJ, Tabima JF, Kronmiller BA, Tyler BM, Grünwald NJ, Dunwell JM, Nellist CF and Harrison RJ (2020) Genomic Investigation of the Strawberry Pathogen Phytophthora fragariae Indicates Pathogenicity Is Associated With Transcriptional Variation in Three Key Races. Front. Microbiol. 11:490. doi: 10.3389/fmicb.2020.00490
Received: 30 November 2019; Accepted: 06 March 2020;
Published: 15 April 2020.
Edited by:
Dilantha Fernando, University of Manitoba, CanadaReviewed by:
Mark Gijzen, Agriculture and Agri-Food Canada (AAFC), CanadaJoe Win, The Sainsbury Laboratory, United Kingdom
Copyright © 2020 Adams, Armitage, Sobczyk, Bates, Tabima, Kronmiller, Tyler, Grünwald, Dunwell, Nellist and Harrison. This is an open-access article distributed under the terms of the Creative Commons Attribution License (CC BY). The use, distribution or reproduction in other forums is permitted, provided the original author(s) and the copyright owner(s) are credited and that the original publication in this journal is cited, in accordance with accepted academic practice. No use, distribution or reproduction is permitted which does not comply with these terms.
*Correspondence: Charlotte F. Nellist, charlotte.nellist@emr.ac.uk
†ORCID: Thomas M. Adams orcid.org/0000-0002-9729-8274; Andrew D. Armitage orcid.org/0000-0002-0610-763X; Maria K. Sobczyk orcid.org/0000-0003-3329-612X; Helen J. Bates orcid.org/0000-0002-7978-9213; Javier F. Tabima orcid.org/0000-0002-3603-2691; Brent A. Kronmiller orcid.org/0000-0001-5570-9277; Brett M. Tyler orcid.org/0000-0003-1549-2987; Niklaus J. Grünwald orcid.org/0000-0003-1656-7602; Jim M. Dunwell orcid.org/0000-0003-2147-665X; Charlotte F. Nellist orcid.org/0000-0002-7453-3710; Richard J. Harrison orcid.org/0000-0002-3307-3519
‡Present address: Thomas M. Adams, Department of Crop Genetics, John Innes Centre, Norwich, United Kingdom; Andrew D. Armitage, Natural Resources Institute, University of Greenwich, Kent, United Kingdom; Maria K. Sobczyk, MRC-IEU, Bristol Medical School, University of Bristol, Clifton, United Kingdom