 Sanjaya Gyawali
 Gehendra Bhattarai
 Ainong Shi
 Chris Kik
 Lindsey J. du Toit
- 1Washington State University Mount Vernon Northwestern Washington Research and Extension Center, Mount Vernon, WA, United States
- 2Department of Horticulture, University of Arkansas, Fayetteville, AR, United States
- 3Centre for Genetic Resources, the Netherlands (CGN), Wageningen University and Research (WUR), Wageningen, Netherlands
Genotype-by-sequencing (GBS) was used to explore the genetic diversity and structure of Spinacia turkestanica, and the selective sweeps involved in domestication of cultivated spinach, S. oleracea, from S. turkestanica. A total 7,065 single nucleotide polymorphisms (SNPs) generated for 16 Spinacia oleracea and 76 S. turkestanica accessions placed the S. oleracea accessions in one group, Q1, and the 76 S. turkestanica accessions, which originated from Central Asia, in two distinct groups, Q2 and Q3. The Q2 group shared greater genetic identity with the S. oleracea accessions, Q1, than the Q3 S. turkestanica group. Likewise, the S. oleracea Q1 group had a smaller Fst (0.008) with the Q2 group than with the Q3 group (Fst = 0.012), and a greater gene flow (Nm = 30.13) with the Q2 group than with the Q3 group (Nm = 21.83). The Q2 accessions originated primarily from Uzbekistan while the Q3 accessions originated mostly from Tajikistan. The Zarafshan Mountain Range appears to have served as a physical barrier that largely separated members of the Q2 and Q3 groups of S. turkestanica. Accessions with admixtures of Q2 and Q3 were collected primarily from lower elevations at the southern end of the Zarafshan Mountain Range in Uzbekistan. Selective sweep regions identified at 32, 49, and 52 Mb on chromosomes 1, 2, and 3, respectively, appear to have played a vital role in the domestication of S. oleracea as they are correlated with important domestication traits, including day length sensitivity for bolting (flowering). High XP-CLR scores at the 52 Mb genomic region of chromosome three suggest that a selective sweep at this region was responsible for early differentiation of S. turkestanica into two groups in Central Asia.
Introduction
The genus Spinacia consists of cultivated spinach (Spinacia oleracea L.) as well as two other species which occur in nature, S. turkestanica Iljin and S. tetrandra ex M. Bieb (Rubatzky and Yamaguchi, 1997). The three species are diploids (2n = 2x = 12), and all three have an annual life cycle and a dioecious breeding system (Morelock and Correll, 2008). Furthermore, the two wild species are cross-compatible with cultivated spinach. Currently, spinach is grown commercially worldwide. In 2018, 0.9 million ha were cultivated with spinach, producing 26.3 million tons of spinach at a production value of US$18 billion, which accounted for 2% of the global gross annual vegetable production value (FAOSTAT, 2020). S. tetrandra is distributed in the Middle East and the Trans Caucasus region (Armenia, Georgia, Iran, Iraq, Kurdistan, and Turkey), and S. turkestanica is distributed across Central Asia (Kazakhstan, Tajikistan, Turkmenistan, and Uzbekistan) and South Asia (Afghanistan and Pakistan) (Andersen and Torp, 2011; Ribera et al., 2020; van Treuren et al., 2020). A limited number of Spinacia genetic resources is available currently in gene banks around the world, including approximately 2,100 accessions, most of which are S. oleracea, with only 89 S. turkestanica and 59 S. tetrandra accessions (Ribera et al., 2020; van Treuren et al., 2020).
Few genetic diversity studies have been performed on spinach. Diversity analyses were first carried out for spinach accessions using polymerase chain reaction (PCR) assays based on simple sequence repeat (SSR) and target region amplification polymorphism (TRAP) markers to generate genetic fingerprint data (Hu et al., 2007; Khattak et al., 2007; Kuwahara et al., 2014; Göl et al., 2017; Li et al., 2018; Bhattarai et al., 2021). These studies found spinach accessions to be clustered based on their geographic origin, with separation of accessions into two to three major groups. Genotyping-by-sequencing (GBS) has been used in recent years to identify genome-wide single nucleotide polymorphism (SNP) markers (Shi et al., 2017), and transcriptome sequencing has been used to evaluate the genetic diversity and phylogeny of spinach accessions (Xu et al., 2015; Xu et al., 2017). Phylogenetic analysis of cultivated S. oleracea accessions and accessions of the wild relatives S. turkestanica and S. tetrandra, based on transcriptome sequence analysis, revealed that S. turkestanica is the progenitor of cultivated S. oleracea, with S. tetrandra genetically more distantly related to the other two species (Fujito et al., 2015; Xu et al., 2015; Xu et al., 2017). The same conclusion was reached by Ribera et al. (2021) who completed a diversity assessment of wild Spinacia species using a limited number of SNP markers (n = 56) for 25 S. turkestanica, 16 S. tetrandra, and 54 S. oleracea accessions.
Domestication transforms the traits and genomes of crops (Harlan, 1992; Meyer et al., 2012). During the domestication of wild species, certain traits that are advantageous for humans as sources of food, fiber, and/or other materials are selected, including female inflorescence, enlarged seed and fruit size (Frary et al., 2000; Doebley, 2004); seed dispersal, loss of dormancy, and ripening time (Cockram et al., 2007); flowering time (Xu et al., 2017); and diversification of plant architecture (Clark et al., 2004). During domestication, not only are the phenotypes transformed, but the domestication events also leave genetic signatures, measured as selective sweeps, on both the population structure and genetic diversity of existing populations (Doebley et al., 2006; Abbo et al., 2014). Domestication and the selection of specific agronomic traits reduces genetic diversity across the genome of cultivated species relative to wild species, with a significant reduction in genetic diversity associated with major domestication traits (Doebley, 1989). The genetic diversity and population structure, domestication history, and spread of spinach to current production areas have been examined (Xu et al., 2017; Ribera et al., 2020; Ribera et al., 2021). However, genetic changes in agronomically important traits, and the genetic basis of domestication are not well understood for spinach (Ribera et al., 2020). Xu et al. (2017) reported 93 selective sweeps in the spinach genome that are associated with a number of quantitative trait loci (QTLs), including QTLs for day length sensitivity to induce bolting and flowering, leaf number, stem length, and petiole color associated with domestication of cultivated spinach. A more detailed genetic characterization of available wild and cultivated Spinacia accessions may provide further insights into spinach diversity and domestication.
Wild Spinacia species can be sources of many commercially important genetic traits (for a review, see: Morelock and Correll, 2008; Simko et al., 2014). For example, the alleles conferring resistance to downy mildew (Peronospora effusa f. sp. spinaciae) in S. turkestanica have been transferred successfully into S. oleracea, providing the primary means of controlling this devastating disease (Smith, 1950; Smith and Zahara, 1956; Correll et al., 2011; Ribera et al., 2020; van Treuren et al., 2020). Despite examples of wild species providing valuable genetic traits for cultivated spinach, wild spinach species have not been characterized extensively for economically important traits, and the genetic structure of wild spinach accessions largely has not been explored. Wild relatives of spinach serve as a genetic reservoir for spinach breeding programs and genetic studies, but generally remain untapped. This is due, in part, to limited access to wild spinach accessions since the Convention on Biodiversity (UN, 1992) and the International Treaty on Plant Genetic Resources for Food and Agriculture (ITPGRFA) (FAO, 2009) have become enforced (van Treuren et al., 2020).
In 2008, the Centre for Genetic Resources, the Netherlands (CGN) carried out an expedition to collect seed from populations of S. turkestanica at the center of biodiversity for this genus, namely Central Asia (Kik, 2008). After the collecting mission, the seeds were multiplied and added to the CGN gene bank as accessions for public access. The population structure and genetic diversity of Spinacia accessions in relation to their geographic origin, the presence of selective sweeps identified using SNP markers, and the relationships of cultivated spinach accessions with accessions of this wild ancestor were investigated in this study to clarify our understanding of the domestication history of spinach. With an extensive SNP data set generated by GBS, this study aimed to address the following questions relating to the origin and domestication of spinach:
1) What is the genetic diversity and group structure of S. turkestanica in Central Asia?
2) If a group structure exists, what were the selective sweeps in the Spinacia genome that led to differences among these groups?
3) Which S. turkestanica selective sweeps were involved in the domestication of spinach?
Materials and Methods
Plant Material
A total of 92 accessions of two Spinacia spp. was used in this study. Three accessions of S. turkestanica originating from Turkmenistan, another S. turkestanica accession of unknown origin, and 16 S. oleracea accessions were received from the National Plant Germplasm System (NPGS) of the United States Department of Agriculture (USDA). In addition, 72 S. turkestanica accessions collected in Uzbekistan and Tajikistan were obtained from the CGN, Wageningen University and Research (WUR). CGN collected the material under the Standard Material Transfer Agreement (SMTA) of the ITPGRFA. Information on each accession, including the country of origin, collection site (latitude, longitude, and altitude), and collection year is provided in Supplementary Table S1. For each accession, one randomly selected plant (representing an accession) was used for the molecular analyses.
Spinach plants were grown in RediEarth propagation mix (Sunshine Horticulture, Agawam, MA) in a greenhouse at the Washington State University (WSU) Mount Vernon Northwestern Washington Research and Extension Center, with the air temperature set at 22–24°C during the day and 18–20°C by night, and supplemental lighting provided for 10 h/day. Plants were fertigated daily with General Purpose Fertilizer 20-20-20 (Plant Marvel, Chicago, IL) injected into the irrigation water at a 1:100 ratio for applying a final nitrogen concentration of 200 ppm at each irrigation. A single leaf was harvested from each plant 35 days after planting, frozen immediately in liquid nitrogen, and stored at −80°C.
Sequencing and Marker Discovery
Genomic DNA was isolated from the single frozen leaf of each plant using the cetyl trimethylammonium bromide (CTAB) method (Murray and Thompson, 1980; Porebski et al., 1997), after the leaf was ground in liquid nitrogen with a mortar and pestle. The DNA quality was checked on a 1% agarose gel, quantified using a Qubit, and submitted to the University of Wisconsin Madison Biotechnology Center (https://www.biotech.wisc.edu/) for sequencing, where DNA quality and integrity were re-evaluated using the Quant-IT PicoGreen fluorescent dye (Thermo Fisher, Waltham, MA). The GBS method of Elshire et al. (2011) was used to sequence the samples after digesting genomic DNA with the ApeKI restriction enzyme, as described by Bhattarai et al. (2020). Digested DNA fragments were ligated with unique barcodes and Illumina adapters, and the samples were pooled in equal proportion to construct GBS libraries, as described by Elshire et al. (2011). Finally, the 96-plex GBS libraries were amplified, purified, and sequenced as 150 bp paired-end reads on an Illumina NovaSeq machine (Illumina, San Diego, CA).
Using the Skewer program (Jiang et al., 2014), the reads were pre-processed to remove sequencing adapters and to filter out low-quality bases for a minimum quality of Q20. Filtered, good quality reads were de-multiplexed and aligned to the spinach reference genome (Xu et al., 2017; http://www.spianchbase.org) using Bowtie two software (Langmead and Salzberg, 2012). The TASSEL GBS v2 pipeline was used to remove barcodes, filter for quality, and call SNPs (Bradbury et al., 2007; Glaubitz et al., 2014). The SNPs were filtered further using VCFtools v0.1.15 (Danecek et al., 2011) to remove indels, remove minor alleles with frequency (MAF) < 0.05, retain only bi-allelic SNPs, achieve a minimum SNP quality score (minQ) < 20 and a minimum genotype read depth (minDP) of 10, remove SNPs missing from >20% of the accessions, and remove plants (accessions) with >20% missing data. Final filtration was used to exclude SNPs with >20% missing data, a minDP of 15, and a MAF <5%. The filtered SNPS were pruned for linkage disequilibrium (LD) in PLINK v1.9 (Chang et al., 2015) using the indep-pairwise 50 5 0.2 option to remove correlated pairs of SNPs. The SNPs were separated into two files, one for each of the S. oleracea and S. turkestanica species. Both files were checked for common SNPs, and the common SNP was genotyped across all accessions for both species. Final filtered SNP distribution across the six spinach chromosomes was determined using the CMplot package in R. The filtered datasets were then used for diversity, phylogenetic, structure, and selective sweep analyses.
Population Structure and Clustering
The structure of accessions of the two Spinacia spp. was analyzed using the software STRUCTURE 2.3.4, with individual accessions assigned to genetic clusters, hereafter called groups, based on inferred genetic ancestry (Pritchard et al., 2000). Structure implements a Bayesian model-based clustering method which assigns multi-locus accessions to a number of user-defined groups (K), and is based on maximization of linkage equilibrium (LE) within groups but minimization of LE among groups. The structure analysis parameters were set to an admixture model, with K ranging from 1 to 10 using five iterations, a burn in period of 100,000, and a Markov Chain Monte Carlo (MCMC) run length of 100,000. The K was determined by considering various factors suggested by Camus-Kulandaivelu et al. (2006). First, Structure Harvester version 0.6.4 was used to determine K, as described by Evanno et al. (2005) [http://taylor0.biology.ucla.edu/structureHarvester/]. The resulting proportion of membership coefficients (Q matrices) for each accession was used to draw a bar plot to visualize clustering of the spinach accessions. True groups were identified as the maximum value of ΔK, based on the rate of change of the natural log probability of the data. Spinacia spp. were assigned to individual groups (Q) based on an assignment value of 75%. Second, the inferred ancestry assessments obtained from Structure were judged based on prior knowledge of the geographic location of the collection site of each accession of both Spinacia spp., provided by the respective gene banks. A total of 7,065 SNPs common to the 76 S. turkestanica and 16 S. oleracea accessions was used to analyze the population structure of the accessions of these two species. To understand better the group structure and clustering pattern of these accessions, principal component analysis (PCA) was completed using PLINK v1.9 (Chang et al., 2015), and plotted in R. Genetic relationships among the accessions were inferred based on a neighbor-joining phylogenetic analysis in MEGA7 (Kumar et al., 2016) with 200 bootstraps.
The SNPs were used to determine the genetic diversity and genetic structure of the accessions of the two Spinacia species. The summary statistics of genetic diversity (GD) and polymorphic information content (PIC) of SNPs were calculated using PowerMarker software V 3.25. (Liu and Muse, 2005). The PIC of SNPs was calculated using the following formula, according to Botstein et al. (1980):
where, Pij and Pik are the frequencies of the jth and kth alleles, respectively, of bi-allelic SNP marker i.
The number of different alleles (Na), number of effective alleles (Ne), Nei’s genetic diversity (h) (Nei, 1973; Nei, 1978), unbiased genetic diversity (uh), and Shannon’s information index (I) were calculated using GenAlEx 6.3 (Peakall and Smouse, 2006). Analysis of molecular variance (AMOVA), group genetic differentiation (Fst), Nei’s unbiased genetic distance (D), and Nei’s unbiased genetic identity (Id) were also estimated using GenAlEx 6.3. Gene flow (Nm) was calculated using the formula Nm = [(1/Fst)-1]/4, according to Peakall and Smouse (2006). The AMOVA (Excoffier et al., 1992) was used for hierarchical partitioning of genetic variation among the groups, and among individuals within the groups of the two Spinacia spp., using G-statistics. In total, 999 permutations determined the fixation indices (Fst) at a level of significance of p < 0.001. Nucleotide diversity (π) was calculated using VCFtools v0.1.15 (Danecek et al., 2011) with a 1-kb window size across the genome (window-pi 1,000).
Linkage Disequilibrium and Selective Sweep Regions in the Spinacia Genome
Linkage disequilibrium (LD) was calculated using SNP pairs within a 200 Kb window, and plotted using PopLDdecay3.4.1 (Zhang et al., 2019) for each S. oleracea and S. turkestanica, and for the Q2 and Q3 groups of S. turkestanica (see details in the Results section). Again, for LD analysis between the Q2 and Q3 groups of S. turkestanica, accessions with <0.75 membership assignment (admixed between Q2 and Q3) of the group structure were excluded. As a result, of 76 S. turkestanica accessions, only 63 (33 from Q2 as the query panel, and 30 from Q3 as the reference panel) were used. The physical distance of the LD curve intersecting at the critical value of r2 = 0.20 was used as LD decay for each species and for groups within S. turkestanica. Screening of the spinach genome for selective sweep regions was first performed by comparing allele frequency differentiation between the S. turkestanica and S. oleracea accessions, following the method described by Xu et al. (2017). Then, since the population structure analysis described above revealed two distinct groups, Q2 and Q3, among the S. turkestanica accessions, screening for selective sweep regions associated with the Q2 and Q3 groups of S. turkestanica was carried out by modelling the likelihood of multi-locus allele frequency differentiation between the two groups using XP-CLR v1.0 (Chen et al., 2010). XP-CLR detects selective sweep regions by modeling the likelihood of multi-locus allele frequency differentiation between two groups. The XP-CLR was run using xpclr v1.1.2 (https://github.com/hardingnj/xpclr) for each pseudochromosome with 50 Kb sliding window, 10 Kb step size, and setting the maximum number of SNPs in each window to 50 (--size 50,000 --step 10,000 --maxsnps 50). The adjacent windows (<10 Kb) with high XP-CLR scores (top 1%) were grouped into a single region representing a single selective sweep region. The candidate genes within the selective sweep regions were also identified. XP-CLR analysis was performed using the 76 S. turkestanica accessions as a reference panel and 16 S. oleracea accessions as a query panel to identify selective sweeps. Of the 63 S. turkestanica accessions that remained after filtering for admixture, 33 accessions in Q2 and 30 in Q3 were used as the reference panel in the XP-CLR analysis. Similarly, given the evidence (see Results) that the S. oleracea accessions (Q1) are most closely related to the Q2 group of S. turkestanica, an analysis of selective sweeps was also computed between the 16 Q1 accessions as the query group and 33 Q2 accessions as the reference group.
Results
Genotyping, SNP Discovery, and SNP Distribution in S. turkestanica and S. oleracea
Approximately 331.2 million raw reads were generated from the Illumina NovaSeq run for the 92 Spinacia accessions. After filtering for sequencing adapters, low-quality bases, and de-multiplexing to extract reads matching the sample barcodes, approximately 300.7 million reads were retained with an average of 3.1 million and a median of 3.1 million reads per accession. Using the TASSEL GBS v2 pipeline, 210,968 SNPs were identified across the six chromosomes. After the SNPs were filtered for indels and a MAF <0.05, 105,328 SNPs were retained. Further filtering to keep only bi-allelic SNPs resulted in retention of 103,704 SNPs.
When the SNP dataset was separated into two files, one for each species, with filtering for 20% missing SNP data, 9,456 and 7,629 SNPs were retained for S. oleracea and S. turkestanica, respectively. Across both species, there were 20.7% missing calls, and the rest of the SNPs were retained for genetic analysis. Among the filtered SNPs, 7,065 SNPs common to all 92 Spinacia accessions that met the filtration criteria were retained. The distribution and density of these SNPs across the six chromosomes of S. turkestanica and S. oleracea are presented in Figure 1, with 832, 839, 1,915, 1,748, 906, and 825 SNPs located on chromosomes 1 through 6, respectively. The SNP density ranged from 0 to >40 SNPs/Mb physical distance. These SNPs were well distributed across all six chromosomes (Figure 1).
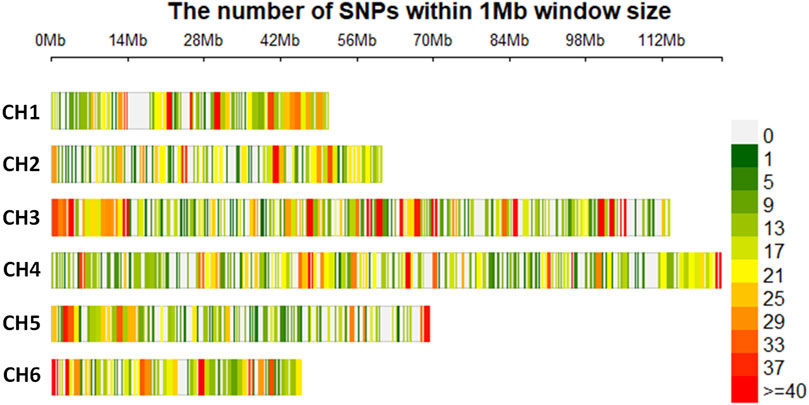
FIGURE 1. Single nucleotide polymorphisms (SNPs) detected in Spinacia genomes after quality filtration, showing the physical density map of 7,065 SNPs common to 16 S. oleracea and 76 S. turkestanica accessions. The colors refer to the SNP density across the six chromosomes (CH1 to CH6) in the Spinacia genome. Numbers above the six chromosome diagrams refer to the distance (in Mb) on the chromosomes of SNPs retained after filtering.
Genetic Diversity, Genetic Differentiation, and Gene Flow in S. turkestanica and S. oleracea
The genetic diversity of the 7,065 SNPs common to the 16 S. oleracea and 76 S. turkestanica accessions ranged from 0.10 (40 SNPs) to 0.50 (3,418 SNPs), with an average of 0.35 (Supplementary Figure S1A). The genetic diversity of 79% of these SNPs was >0.3. The PIC of these SNPs ranged from 0.10 (160 SNPs) to 0.40 (3,798 SNPs), with an average of 0.28 for the S. oleracea and S. turkestanica accessions (Supplementary Figure S1B). The PIC of 75% of these SNPs was >0.3.
The AMOVA of the 76 S. turkestanica and 16 S. oleracea accessions with 7,065 common SNPs showed 0.5% estimated variance accounted for by the two species, while 99.5% was accounted for by individual accessions within each species (Table 1). The average Fst and gene flow (Nm) was 44.5 among three groups of the two species. The greatest Fst, 0.012, was between groups Q2 and Q3, both of which consisted of accessions of S. turkestanica, followed by 0.011 for group Q1 of S. oleracea and Q3 of S. turkestanica, and then 0.008 between the Q1 and Q2 groups (Table 2). The genetic distance, D, followed the same pattern, with the largest D between groups Q2 and Q3, and the smallest between groups Q1 and Q2. The genetic identity, Id, was greatest for Q1 and Q2 (0.993), followed by Q1 and Q3 (0.989), and Q2 and Q3 (0.988). Consequently, the highest Nm was between Q1 and Q2 (30.13), followed by Q1 and Q3 (21.83), and Q2 and Q3 (19.77) (Table 2). The mean number of different alleles (Na), number of effective alleles (Ne), diversity index (h), unbiased diversity index (uh), Shannon’s Information Index (I) and nucleotide diversity (π) ranged from 1.988 to 1.997, 1.607 to 1.616, 0.347 to 0.351, 0.355 to 0.357, 0.516 to 0.523, and 0.9223 × 10⁻³ to 0.9371 × 10⁻³ respectively (Table 3). The mean nucleotide diversity (π) of the 92 Spinacia accessions was estimated to be 0.8998 × 10⁻³. Overall, of the three groups, Q2 was the most diverse (h = 0.351, uh = 0.356, and I = 0.523), followed by Q3 (h = 0.349, uh = 0.355, and I = 0.520) and Q1 (h = 0.347, uh = 0.357, and I = 0.516). However, the unbiased diversity index (uh) of Q1, which largely comprised S. oleracea accessions, was greater than that of the Q2 and Q3 groups (Table 3).
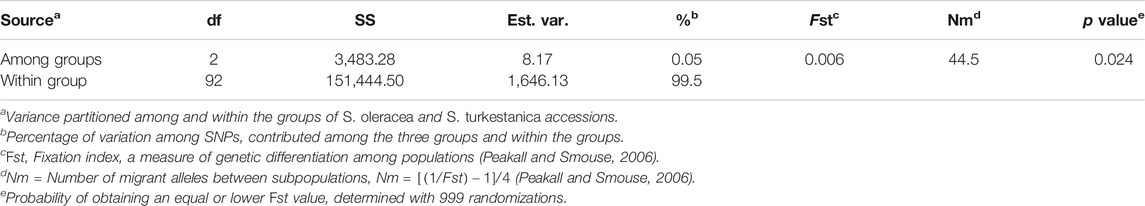
TABLE 1. Analysis of molecular variance (AMOVA) of the genetic differentiation among and within three subpopulations of Spinacia derived from 16 S. oleracea and 76 S. turkestanica accessions that had 7,065 single nucleotide polymorphisms (SNPs) in common.
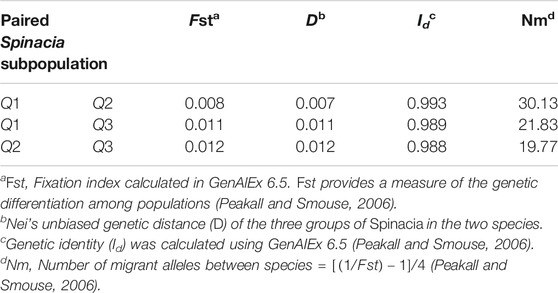
TABLE 2. Population differentiation, genetic distance, genetic identity, and gene flow between pairs of three subpopulations of Spinacia oleracea and S. turkestanica identified using 7,065 single nucleotide polymorphisms (SNPs) common to 16 S. oleracea and 76 S. turkestanica accessions.
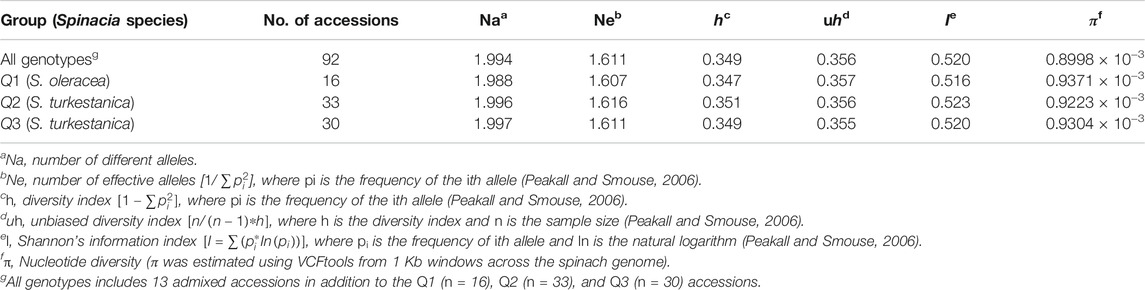
TABLE 3. Mean number of different alleles (Na), number of effective alleles (Ne), diversity index (h), unbiased diversity index (uh), Shannon’s information index (I), and nucleotide diversity (π) calculated for 7,065 single nucleotide polymorphisms (SNPs) common to 92 Spinacia accessions.
The STRUCTURE analysis based on 7,065 SNPs common to the S. oleracea and S. turkestanica accessions revealed three main groups, Q1, Q2, and Q3 (Figure 2), that comprised 18, 43, and 31 accessions, respectively (Figure 3A). The Q1 group largely comprised cultivated spinach, S. oleracea, and admixtures of both species, while the Q2 and Q3 groups comprised S. turkestanica accessions only. Multivariate analyses using UPGMA and PCA supported results of the structure analyses, clustering a large majority of the accessions of Spinacia into three groups, Q1 (11 accessions), Q2 (34 accessions), and Q3 (30 accessions), with another 17 accessions admixed (Figures 3B,C). The accessions AM45 (United States), AM239 (the Netherlands), AM268 (Macedonia), AM277 (United Kingdom), AM316 (Denmark), AM330 (Nepal), AM360 (United States), and Viroflay (France) had >0.970 inferred membership in the S. oleracea group, while another eight S. oleracea accessions had varying degrees of admixture with S. turkestanica (Figure 3A).
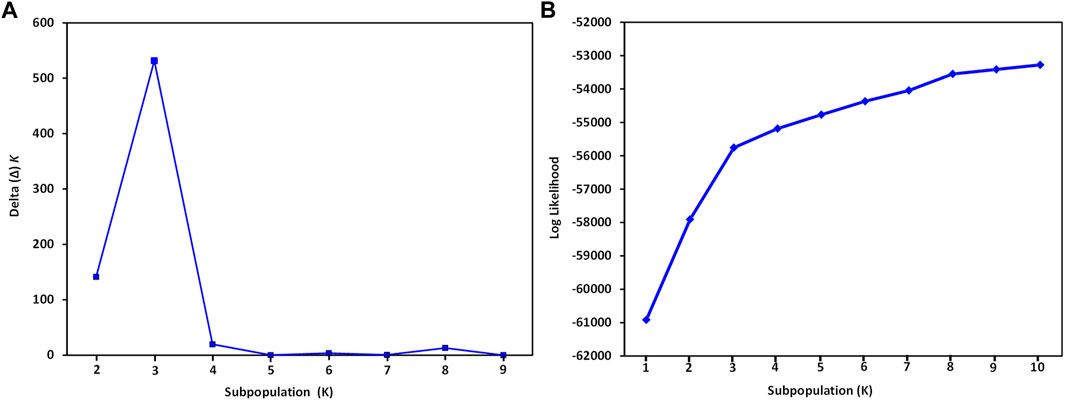
FIGURE 2. Graphical representation of variance in the number of subpopulations, K, and mean likelihood values generated with the software STRUCTURE for 16 Spinacia oleracea and 76 S. turkestanica accessions based on 7,065 single nucleotide polymorphisms common to these accessions. (A) Delta (Δ) K for the different number of spinach subpopulations (K). (B) The average log likelihood values of K.
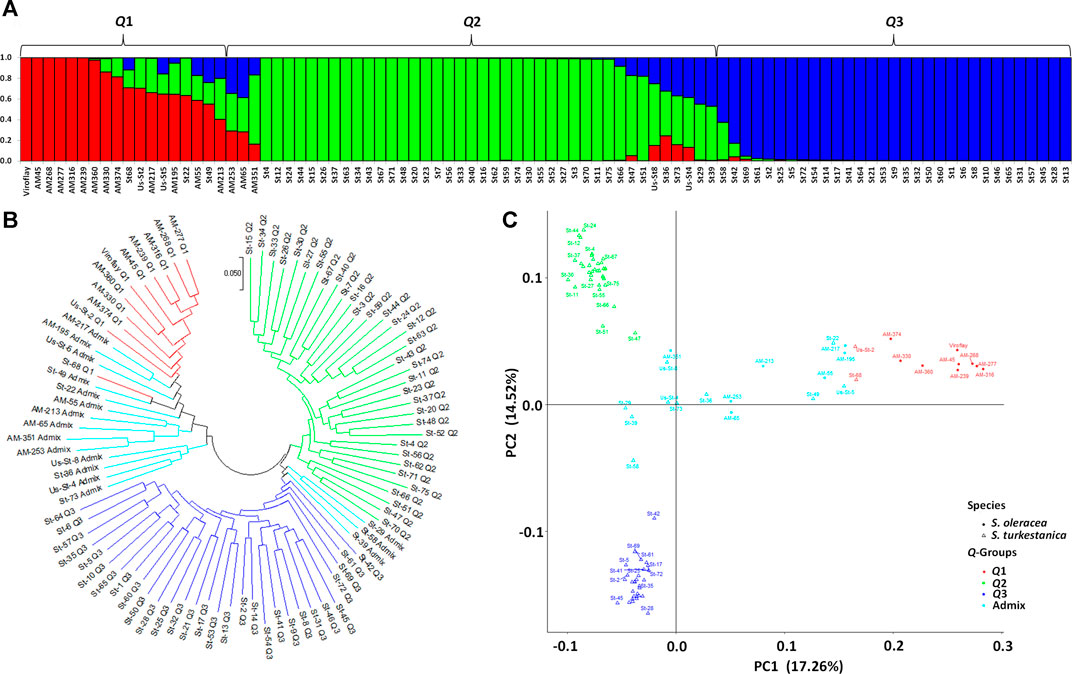
FIGURE 3. Population structure of 92 accessions of two Spinacia spp. based on single nucleotide polymorphisms (SNPs). (A) Population structure of 16 S. oleracea and 76 S. turkestanica accessions based on 7,065 SNPs common to these accessions, with K = 3 groups, Q1 (S. oleracea and S. turkestanica), Q2 (S. turkestanica), and Q3 (S. turkestanica), determined using STRUCTURE. (B) Neighbor joining tree of the 16 S. oleracea and 76 S. turkestanica accessions. (C) Principal component analysis (PCA) of the 16 S. oleracea and 76 S. turkestanica accessions based on the SNPs.
Geographic Distribution of S. turkestanica Accessions Collected in Central Asia
The distribution of spinach accessions based on their original geographic location of collection is presented in Figure 4, with detailed information on the two Spinacia spp. provided in Supplementary Table S1. The Q1 group was dominated by S. oleracea landraces (accessions) collected from Afghanistan, China, Iran, India, Nepal, and Pakistan, as well as nine S. turkestanica accessions admixed with S. oleracea accessions (Figure 4). Of these nine admixed S. turkestanica accessions in Q1, five (St22, St36, US-St4, US-St5, and US-St8) were collected from Turkmenistan. Interestingly, with few exceptions, group Q2 comprised S. turkestanica accessions originating from Uzbekistan, while a majority of group Q3 comprised S. turkestanica accessions originating from Tajikistan (Figure 4). The exceptions included three accessions (St39, St29, and St58) originating from the southeastern part of Uzbekistan, which had varying degrees of admixture of groups Q2 and Q3.
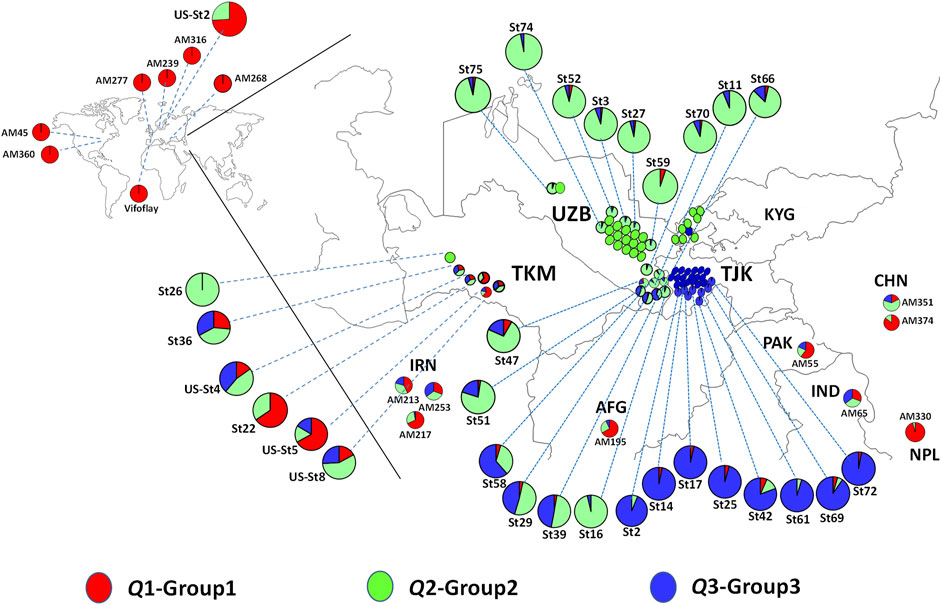
FIGURE 4. Geographic distribution of accessions of Spinacia oleracea and S. turkestanica that form three groups based on single nucleotide polymorphisms (SNPs) detected in the plants collected from these locations. Red represents the proportion of membership of a genotype from the Q1 group, comprised primarily of S. oleracea, and green and blue represent the proportions of membership in two groups, Q2 and Q3, respectively, of S. turkestanica. The admixed accessions are color-coded proportionally to the degree of ancestry from Q1, Q2, and Q3 groups. The S. turkestanica accessions consist of mixed ancestry, based on <95% membership in the Q2 or Q3 subpopulations. AFG, Afghanistan, CHN, China; IND, India; IRN, Iran; KYG, Kyrgyzstan; NPL, Nepal; PAK, Pakistan; TJK, Tajikistan; TMK, Turkmenistan, and UZB, Uzbekistan. AM, Association mapping panel of S. oleracea accessions obtained from the United States Department of Agriculture National Plant Germplasm System (USDA NPGS). St = S. turkestanica genotype obtained from the Centre for Genetic Resources in the Netherlands (CGN). Us-St = S. turkestanica accessions obtained from the USDA NPGS.
Linkage Disequilibrium and Selective Sweep Regions in the Spinacia Genome
The LD plot showed decreasing LD between markers with the increase in physical distance on the chromosomes (Figure 5). The LD decay plot revealed a rapid rate of LD decay in both Spinacia species. The LD decay was around 9 Kb in S. turkestanica and around 12 Kb in S. oleracea at r2 = 0.2 (Figure 5A). The S. turkestanica groups Q2 and Q3 did not show such differences in LD decay rate (Figure 5B). The analysis of selective sweeps of the S. oleracea and S. turkestanica genomes, determined by XP-CLR analysis, revealed a total of 20 regions, including 3, 2, 9, 1, 3, and two regions in chromosomes 1, 2, 3, 4, 5, and 6, respectively (Table 4; Supplementary Table S2). The highest XP-CLR score was for the 30–32 Mb region of chromosome 1, with 35 SNPs under selection (12 SNPs in chromosome region 1.3 with an XP-CLR score of 24.75009, and 23 SNPs in region 1.2 with an XP-CLR score of 0.00597). Another important selective sweep region was at 98 Mb on chromosome 3, where 23 SNPs are under selection (12 SNPs in region 3.8 with an XP-CLR score of 18.20349, and 11 SNPs in region 3.9 with a score of 11.40893).
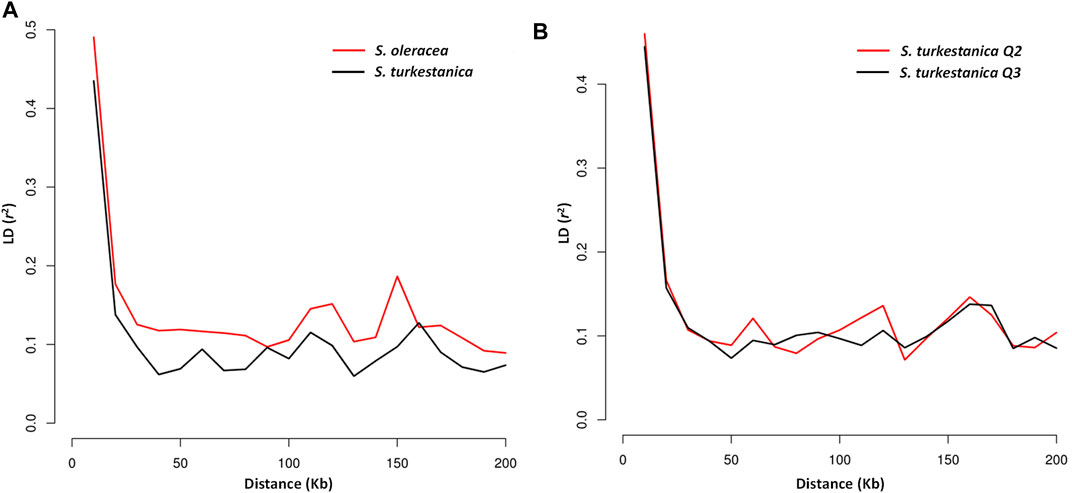
FIGURE 5. Linkage disequilibrium (LD) decay determined by squared correlations of allele frequency (r2) against physical distance (Kb) between single nucleotide polymorphism markers of (A) accessions of cultivated spinach, Spinacia oleracea, vs. accessions of the wild relative, S. turkestanica; and (B) group Q2 vs. Q3 of S. turkestanica.
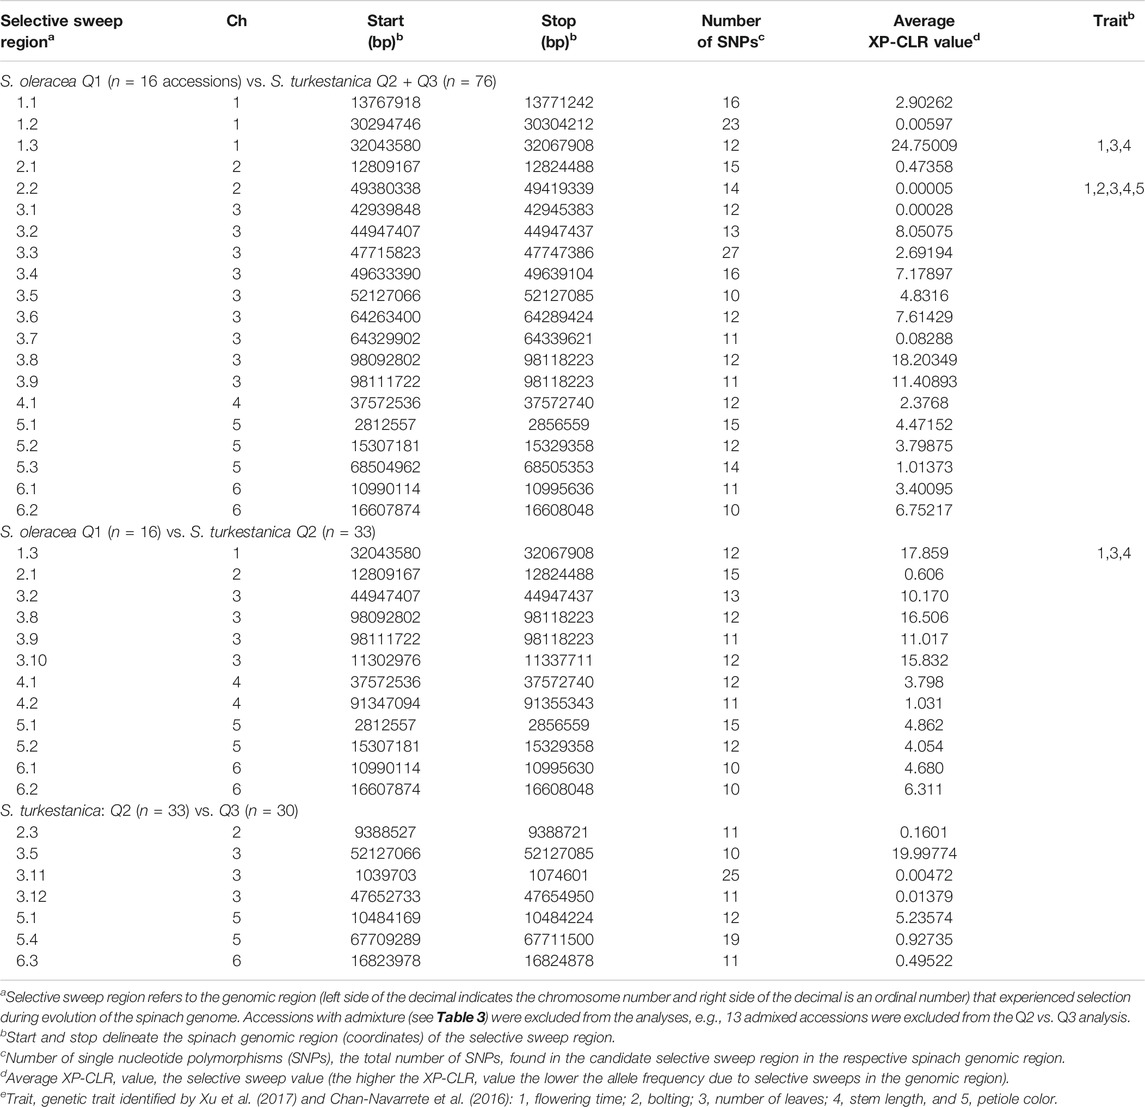
TABLE 4. Selective sweep regions of 16 Spinacia oleracea (Q1) accessions and 76 S. turkestanica (Q2 and Q3) accessions, 16 S. oleracea Q1 accessions and 33 Q2 S. turkestanica accessions, and 33 Q2 and 30 Q3 accessions within S. turkestanica, as determined by XP-CLR analyses.
Several of the selective sweep regions of Q1 vs. Q2 accessions were common to the Q1 vs. all S. turkestanica accessions (Q2 and Q3), including sweep regions 1.3, 2.1, 3.2, 3.8, 3.9, 4.1, 5.1, 5.2, 6.1 and 6.2 (Table 4). The analysis of selective sweeps of the two groups of S. turkestanica, Q2 vs. Q3, showed a total of seven regions spread over chromosomes 2, 3, 5, and 6 that played important roles in the differentiation of these two groups. Of these selective sweeps, 10 SNPs at the 52 Mb region of chromosome three were common to both S. oleracea and S. turkestanica and had an XP-CLR score of 19.99774. The next highest XP-CLR score, 5.23574, was for the selective sweep region at 10 Mb on chromosome 5, which encompassed 12 SNPs (Table 4).
Discussion
The relatively uniform, genome-wide distribution of 7,065 SNP markers identified across all six spinach chromosomes of 16 S. oleracea accessions and 76 S. turkestanica accessions, and the high genetic diversity and PIC of these SNPs, provided ideal molecular data for genetic analysis of these accessions of cultivated spinach, S. oleracea, and accessions of the wild relative, S. turkestanica. Botstein et al. (1980) reported that if the PIC of a marker is > 0.5, the marker can be considered highly polymorphic and desirable for genetic studies and crop breeding. The SNPs in this study were bi-allelic, restricting the highest value of PIC to 0.5 when the two alleles of a bi-allelic marker have identical frequencies. However, more than 75% of the SNPs had GD and PIC values > 0.3, so these SNPs are highly desirable for studying the genetic diversity, population structures, and potential breeding strategies for spinach. The nucleotide diversity (π) estimated for cultivated S. oleracea accessions (0.9371 × 10⁻³) and the two sub-populations, Q2 (0.9223 × 10⁻³) and Q3 (0.9304 × 10⁻³), of wild S. turkestanica relatives was similar. The high nucleotide diversity of the 16 S. oleracea accessions evaluated in this study might reflect the limited sample size (16 accessions) collected from different geographic regions. The nucleotide diversity estimated using GBS-generated SNPs in this study was slightly greater than estimates in Xu et al. (2017) with transcriptome-derived SNPs that ranged from 0.67 to 0.83 × 10⁻³.
Little information has been published on selective sweeps involved in the evolution of the genus Spinacia and domestication of cultivated spinach. This study identified 20 signatures of selective sweeps in the Spinacia genome associated with the domestication of S. oleracea from S. turkestanica (Supplementary Table S2). However, these results should be interpreted with some caution when taking into account that 1 to 40 SNPs per Mb were discovered in this study and a linkage decay (LD) of around 10 Kb can be assumed for cross-fertilizing species like spinach (Lowry et al., 2017). Therefore, it is possible that loci under selection were missed in this study. In this study, selective sweep region 1.3 in chromosome 1, near 32 Mb, had the greatest XP-CLR score, and his region aligns with the QTL for flowering time reported by Chan-Navarrete et al. (2016) and Chitwood et al. (2016). This is also corroborated by Xu et al. (2017) who showed that the selective sweep regions at 1.3 and 2.2 aligned with flowering time, number of leaves, and stem length. Interestingly, the selective sweep region 1.3 found when comparing the Q1 S. oleracea vs. Q2 S. turkestanica accessions was not present in the selective sweep analysis of the Q2 vs. Q3 groups of S. turkestanica. The analysis also identified nine selective sweep regions on chromosome 3, with regions 3.8 and 3.9 having high XP-CLR scores of 18.20349 (with 12 SNPs) and 11.40893 (with 11 SNPs), respectively. Further research is warranted to identify the specific domestication traits within these selective sweep regions in Spinacia.
Investigation of selective sweep regions of S. turkestanica groups Q2 and Q3 identified seven genomic regions that may be responsible for differentiation of these two groups. None of these selective sweeps regions coincided with domestication traits, although until present little research has been carried out on these traits in spinach. The selective sweep region 3.3 at the 52 Mb region of chromosome three appears to have had an important role in differentiation of the Q2 and Q3 groups. No genes involved in determining phenotypic traits have yet been associated with this region. A common selective sweep region at the 52 Mb region of chromosome three was also detected between the S. oleracea Q1 and S. turkestanica (Q2 and Q3) groups. This suggests that S. turkestanica was differentiated into groups Q2 and Q3 prior to the domestication of S. oleracea. As the S. oleracea accessions had greater genetic identity (Id = 0.993), less genetic distance (D = 0.007), and more gene flow (Nm = 30.13) with group Q2 accessions compared to group Q3 accessions (Id = 0.989, D = 0.011, and Nm = 21.83), it is plausible that most of the S. oleracea accessions evolved from the Q2 group of S. turkestanica.
The orogenic mountain range of Tien Shan stretches through Central Asia, including Kyrgyzstan, Tajikistan, Uzbekistan, and Turkmenistan (Brunet et al., 2017). The Zarafshan mountain range (up to 5,489 m above sea level) within this orogenic belt separates Uzbekistan, where group Q2 is concentrated, and Tajikistan, where group Q3 accessions were collected. Among the three groups, there was least gene flow (Nm = 19.77) between Q2 and Q3. This mountain range probably has served as a physical barrier to gene flow between these two groups for thousands of years. Therefore, we hypothesize that the two groups, Q2 and Q3, of S. turkestanica are in an early stage of allopatric speciation. The Zarafshan mountain range of the Tian Shan orogenic belt loses elevation in the southern part, a region where three accessions were found to have mixed genetic constitutions of the Q2/Q3 groups. This probably points to the occurrence of a hybrid zone between the two groups. Further research is warranted to elaborate on the early speciation of Q2 and Q3 groups of S. turkestanica in Central Asia.
Conclusions
High throughput GBS was employed to identify SNPs that were then used to explore the genetic diversity, genetic differentiation, and gene flow among accessions of S. turkestanica and S. oleracea, and to elucidate the origin of cultivated spinach. Three groups were identified among the S. oleracea and S. turkestanica accessions, with the S. oleracea accessions more closely related genetically to the Q2 group of S. turkestanica accessions than the Q3 group of this species. The selective sweep regions identified in the Spinacia genome indicated that S. turkestanica differentiated into the Q2 group (located on the western side of the Zarafshan mountain range) and Q3 group (located on the eastern side of the Zarafshan mountain range) first, followed by domestication of cultivated spinach, with Q2 accessions of S. turkestanica playing a greater role in the domestication of spinach. The selective sweep regions aligned with multiple domestication traits in the 32, 49, and 52 Mb regions of chromosomes 1, 2, and 3, respectively. A hybrid zone between both groups was found at the southern end of the Zarafshan mountain range. The highly polymorphic SNPs identified in this study can be used in future studies, such as genome wide association studies (GWAS) and marker assisted selection for various economically important agronomic traits found in S. turkestanica.
Data Availability Statement
The original contributions presented in the study are available publicly. This data can be found in Figshare at: https://doi.org/10.6084/m9.figshare.15043191.v1.
Author Contributions
SG, AS, and LdT designed and conceived the research. CK supplied S. turkestanica germplasm from the Centre for Genetic Resources, the Netherlands. SG performed the experiment. SG and GB analyzed the data and wrote the manuscript. LdT and CK reviewed and edited the manuscript, and all coauthors read, revised, and approved the final manuscript.
Conflict of Interest
The authors declare that the research was conducted in the absence of any commercial or financial relationships that could be construed as a potential conflict of interest.
Publisher’s Note
All claims expressed in this article are solely those of the authors and do not necessarily represent those of their affiliated organizations, or those of the publisher, the editors and the reviewers. Any product that may be evaluated in this article, or claim that may be made by its manufacturer, is not guaranteed or endorsed by the publisher.
Acknowledgments
Financial support for this study was received from the USDA National Institute of Food and Agriculture Specialty Crop Research Initiative Project No. 2017-51181-26830, the Alfred Christianson Endowment in Vegetable Seed Science, and Washington State University College of Agricultural, Human, and Natural Resource Sciences Hatch Project Nos. WNP0010 and WNP00595. The authors thank members of the Washington State University Vegetable Seed Pathology program for technical assistance with this research, particularly Michael Derie and Alex Batson. The contribution of CK was carried out in the framework of the program Genetic Resources (WOT-03) which is funded by the Dutch Ministry of Agriculture, Nature and Food Quality.
Supplementary Material
The Supplementary Material for this article can be found online at: https://www.frontiersin.org/articles/10.3389/fgene.2021.740437/full#supplementary-material
Supplementary Figure 1 | Distribution of the genetic diversity (A) and polymorphic information content (PIC) (B) for 7,065 single nucleotide polymorphisms (SNPs) common to 16 accessions of Spinacia oleracea and 76 accessions of S. turkestanica.
References
Abbo, S., Pinhasivan-Oss, R., Gopher, A., Saranga, Y., Ofner, I., and Peleg, Z. (2014). Plant Domestication versus Crop Evolution: A Conceptual Framework for Cereals and Grain Legumes. Trends Plant Sci. 19, 351–360. doi:10.1016/j.tplants.2013.12.002
Andersen, S. B., and Torp, A. M. (2011). “Spinacia,” in Wild Crop Relatives: Genomic and Breeding Resources. Editor K. Chittaranjan (Verlag Berlin Heidelberg: Springer), 273–276. doi:10.1007/978-3-642-20450-0_13
Bhattarai, G., Shi, A., Feng, C., Dhillon, B., Mou, B., and Correll, J. C. (2020). Genome Wide Association Studies in Multiple Spinach Breeding Populations Refine Downy Mildew Race 13 Resistance Genes. Front. Plant Sci. 11, 563187. doi:10.3389/fpls.2020.563187
Bhattarai, G., Shi, A., Kandel, D. R., Solís-Gracia, N., da Silva, J. A., and Avila, C. A. (2021). Genome-Wide Simple Sequence Repeats (SSR) Markers Discovered From Whole-Genome Sequence Comparisons of Multiple Spinach Accessions. Sci. Rep. 11, 9999. doi:10.1038/s41598-021-89473-0
Botstein, D., White, R. L., Skolnick, M., and Davis, R. W. (1980). Construction of a Genetic Linkage Map in Man Using Restriction Fragment Length Polymorphisms. Am. J. Hum. Genet. 32, 314–331.
Bradbury, P. J., Zhang, Z., Kroon, D. E., Casstevens, T. M., Ramdoss, Y., and Buckler, E. S. (2007). TASSEL: Software for Association Mapping of Complex Traits in Diverse Samples. Bioinformatics 23, 2633–2635. doi:10.1093/bioinformatics/btm308
Brunet, M-F., Sobel, E., and McCann, T. (2017). Geological Evolution of Central Asian Basins and the Western Tien Shan Range. Madison, Wisconsin: Special Publications Geological Society of London, 427. doi:10.1144/SP427.17.hal-01561458
Camus-Kulandaivelu, L., Veyrieras, J.-B., Madur, D., Combes, V., Fourmann, M., Barraud, S., et al. (2006). Maize Adaptation to Temperate Climate: Relationship Between Population Structure and Polymorphism in the dwarf8 Gene. Genetics 172, 2449–2463. doi:10.1534/genetics.105.048603
Chan-Navarrete, R., Dolstra, O., van Kaauwen, M., Lammerts van Bueren, E. T., and van der Linden, C. G. (2016). Genetic Map Construction and QTL Analysis of Nitrogen Use Efficiency in Spinach (Spinacia oleracea L.). Euphytica 208, 621–636. doi:10.1007/s10681-015-1618-6
Chang, C. C., Chow, C. C., Tellier, L. C., Vattikuti, S., Purcell, S. M., and Lee, J. J. (2015). Second-Generation PLINK: Rising to the Challenge of Larger and Richer Datasets. GigaSci. 4, 7. doi:10.1186/s13742-015-0047-8
Chen, H., Patterson, N., and Reich, D. (2010). Population Differentiation as a Test for Selective Sweeps. Genome Res. 20, 393–402. doi:10.1101/gr.100545.109
Chitwood, J., Shi, A., Mou, B., Evans, M., Clark, J., Motes, D., et al. (2016). Population Structure and Association Analysis of Bolting, Plant Height, and Leaf Erectness in Spinach. Hort Sci. 51, 481–486. doi:10.21273/hortsci.51.5.481
Clark, R. M., Linton, E., Messing, J., and Doebley, J. F. (2004). Pattern of Diversity in the Genomic Region Near the Maize Domestication Gene Tb1. Proc. Natl. Acad. Sci. 101, 700–707. doi:10.1073/pnas.2237049100
Cockram, J., Jones, H., Leigh, F. J., O'Sullivan, D., Powell, W., Laurie, D. A., et al. (2007). Control of Flowering Time in Temperate Cereals: Genes, Domestication, and Sustainable Productivity. J. Exp. Bot. 58, 1231–1244. doi:10.1093/jxb/erm042
Correll, J. C., Bluhm, B. H., Feng, C., Lamour, K., du Toit, L. J., and Koike, S. T. (2011). Spinach: Better Management of Downy Mildew and White Rust Through Genomics. Eur. J. Plant Pathol. 129, 193–205. doi:10.1007/s10658-010-9713-y
Danecek, P., Auton, A., Abecasis, G., Albers, C. A., Banks, E., DePristo, M. A., et al. (2011). The Variant Call Format and VCFtools. Bioinformatics 27, 2156–2158. doi:10.1093/bioinformatics/btr330
Doebley, J. F., Gaut, B. S., and Smith, B. D. (2006). The Molecular Genetics of Crop Domestication. Cell 127, 1309–1321. doi:10.1016/j.cell.2006.12.006
Doebley, J. (1989). “Isozymic Evidence and the Evolution of Crop Plants,” in Isozymes in Plant Biology. Editors D. Soltis, and P. Soltis (Portland, Oregon: Dioscorides Press), 165–191. doi:10.1007/978-94-009-1840-5_9
Doebley, J. (2004). The Genetics of Maize Evolution. Annu. Rev. Genet. 38, 37–59. doi:10.1146/annurev.genet.38.072902.092425
Elshire, R. J., Glaubitz, J. C., Sun, Q., Poland, J. A., Kawamoto, K., Buckler, E. S., et al. (2011). A Robust, Simple Genotyping-By-Sequencing (GBS) Approach for High Diversity Species. PLoS One 6, e19379. doi:10.1371/journal.pone.0019379
Evanno, G., Regnaut, S., and Goudet, J. (2005). Detecting the Number of Clusters of Individuals Using the Software STRUCTURE: A Simulation Study. Mol. Ecol. 14, 2611–2620. doi:10.1111/j.1365-294x.2005.02553.x
Excoffier, L., Smouse, P. E., and Quattro, J. M. (1992). Analysis of Molecular Variance Inferred from Metric Distances Among DNA Haplotypes: Application to Human Mitochondrial DNA Restriction Data. Genetics 131, 479–491. doi:10.1093/genetics/131.2.479
FAOSTAT (2020). Statistics Division of the Food and Agriculture Organisation of the United Nations. Rome. Available at: https://www.fao.org/faostat (Accessed July 13, 2020).
Food and Agriculture Organization (2009). International Treaty on Plant Genetic Resources for Food and Agriculture. Rome: Food and Agriculture Organisation of the United Nations. Available at: http://www.fao.org/3/i0510e/I0510E.pdf (Accessed June, 2021).
Frary, A., Nesbitt, T. C., Frary, A., Grandillo, S., Knaap, E. v. d., Cong, B., et al. (2000). fw2.2 : A Quantitative Trait Locus Key to the Evolution of Tomato Fruit Size. Science 289, 85–88. doi:10.1126/science.289.5476.85
Fujito, S., Takahata, S., Suzuki, R., Hoshino, Y., Ohmido, N., and Onodera, Y. (2015). Evidence for a Common Origin of Homomorphic and Heteromorphic Sex Chromosomes in Distinct Spinacia Species. G 5, 1663–1673. doi:10.1534/g3.115.018671
Glaubitz, J. C., Casstevens, T. M., Lu, F., Harriman, J., Elshire, R. J., Sun, Q., et al. (2014). TASSEL-GBS: A High Capacity Genotyping by Sequencing Analysis Pipeline. PLoS One 9, e90346. doi:10.1371/journal.pone.0090346
Göl, Ş., Göktay, M., Allmer, J., Doğanlar, S., and Frary, A. (2017). Newly Developed SSR Markers Reveal Genetic Diversity and Geographical Clustering in Spinach (Spinacia oleracea). Mol. Genet. Genomics 292, 847–855. doi:10.1007/s00438-017-1314-4
Hu, J., Mou, B., and Vick, B. A. (2007). Genetic Diversity of 38 Spinach (Spinacia oleracea L.) Germplasm Accessions and 10 Commercial Hybrids Assessed by TRAP Markers. Genet. Resour. Crop Evol. 54, 1667–1674. doi:10.1007/s10722-006-9175-4
Jiang, H., Lei, R., Ding, S.-W., and Zhu, S. (2014). Skewer: A Fast and Accurate Adapter Trimmer for Next-Generation Sequencing Paired-End Reads. BMC Bioinformatics 15, 182. doi:10.1186/1471-2105-15-182
Khattak, J. Z. K., Christiansen, J. L., Torp, A. M., and Andersen, S. B. (2007). Genic Microsatellite Markers for Discrimination of Spinach Cultivars. Plant Breed. 126, 454–456. doi:10.1111/j.1439-0523.2007.01392.x
Kik, C. (2008). Report of a Spinacia Collecting Expedition to Uzbekistan and Tajikistan: Itinerary, Collected Material and Data. CGN Report 12. Wageningen, Netherlands. Available at: https://missions.cgn.wur.nl/ (Accessed June 15, 2021).
Kumar, S., Stecher, G., and Tamura, K. (2016). MEGA7: Molecular Evolutionary Genetics Analysis Version 7.0 for Bigger Datasets. Mol. Biol. Evol. 33, 1870–1874. doi:10.1093/molbev/msw054
Kuwahara, K., Suzuki, R., Ito, Y., Mikami, T., and Onodera, Y. (2014). An Analysis of Genetic Differentiation and Geographical Variation of Spinach Germplasm Using SSR Markers. Plant Genet. Res. 12, 185–190. doi:10.1017/S1479262113000464
Langmead, B., and Salzberg, S. L. (2012). Fast Gapped-Read Alignment With Bowtie 2. Nat. Methods 9, 357–359. doi:10.1038/nmeth.1923
Li, S.-F., Wang, B.-X., Guo, Y.-J., Deng, C.-L., and Gao, W.-J. (2018). Genome-Wide Characterization of Microsatellites and Genetic Diversity Assessment of Spinach in the Chinese Germplasm Collection. Breed. Sci. 68, 455–464. doi:10.1270/jsbbs.18032
Liu, K., and Muse, S. V. (2005). PowerMarker: An Integrated Analysis Environment for Genetic Marker Analysis. Bioinformatics 21, 2128–2129. doi:10.1093/bioinformatics/bti282
Lowry, D. B., Hoban, S., Kelley, J. L., Lotterhos, K. E., Reed, L. K., Antolin, M. F., et al. (2017). Breaking RAD: An Evaluation of the Utility of Restriction Site‐Associated DNA Sequencing for Genome Scans of Adaptation. Mol. Ecol. Resour. 17 (2), 142–152. doi:10.1111/1755-0998.12635
Meyer, R. S., DuVal, A. E., and Jensen, H. R. (2012). Patterns and Processes in Crop Domestication: An Historical Review and Quantitative Analysis of 203 Global Food Crops. New Phytol. 196, 29–48. doi:10.1111/j.1469-8137.2012.04253.x
Morelock, T. E., and Correll, J. C. (2008). “Spinach,” in Vegetables I: Asteraceae, Brassicaceae, Chenopodicaceae, and Cucurbitaceae. Editors J. Prohens, and F. Nuez F. (New York: Springer), 189–218. doi:10.1007/978-0-387-30443-4_6
Murray, M. G., and Thompson, W. F. (1980). Rapid Isolation of High Molecular Weight Plant DNA. Nucl. Acids Res. 8, 4321–4326. doi:10.1093/nar/8.19.4321
Nei, M. (1973). Analysis of Gene Diversity in Subdivided Populations. Proc. Natl. Acad. Sci. 70, 3321–3323. doi:10.1073/pnas.70.12.3321
Nei, M. (1978). Estimation of Average Heterozygosity and Genetic Distance from a Small Number of Individuals. Genetics 89, 583–590. doi:10.1093/genetics/89.3.583
Peakall, R., and Smouse, P. E. (2006). Genalex 6: Genetic Analysis in Excel. Population Genetic Software for Teaching and Research. Mol. Ecol. Notes 6, 288–295. doi:10.1111/j.1471-8286.2005.01155.x
Porebski, S., Bailey, L. G., and Baum, B. R. (1997). Modification of a CTAB DNA Extraction Protocol for Plants Containing High Polysaccharide and Polyphenol Components. Plant Mol. Biol. Rep. 15, 8–15. doi:10.1007/bf02772108
Pritchard, J. K., Stephens, M., and Donnelly, P. (2000). Inference of Population Structure Using Multilocus Genotype Data. Genetics 155, 945–959. doi:10.1093/genetics/155.2.945
Ribera, A., Bai, Y., Wolters, A.-M. A., van Treuren, R., and Kik, C. (2020). A Review on the Genetic Resources, Domestication and Breeding History of Spinach (Spinacia oleracea L.). Euphytica 216, 48. doi:10.1007/s10681-020-02585-y
Ribera, A., van Treuren, R., Kik, C., Bai, Y., and Wolters, A.-M. A. (2021). On the Origin and Dispersal of Cultivated Spinach (Spinacia oleracea L.). Genet. Resour. Crop Evol. 68, 1023–1032. doi:10.1007/s10722-020-01042-y
Rubatzky, V. E., and Yamaguchi, M. (1997). Spinach, Table Beets, and Other Vegetable Chenopods. Boston, MA: World Vegetables, 457–473. doi:10.1007/978-1-4615-6015-9_21
Shi, A., Qin, J., Mou, B., Correll, J., Weng, Y., Brenner, D., et al. (2017). Genetic Diversity and Population Structure Analysis of Spinach by Single-Nucleotide Polymorphisms Identified through Genotyping-By-Sequencing. PLoS One 12, e0188745. doi:10.1371/journal.pone.0188745
Simko, I., Hayes, R. J., Mou, B., and McCreight, J. D. (2014). “Lettuce and Spinach,” in Yield Gains in Major U.S. Field Crops. Editors S. Smith, B. Diers, J. Specht, and B. Carvers, Madison, Wisconsin: Crop Science Society of America special edition, 33, 53–85. doi:10.2135/cssaspecpub33.c4
Smith, P. G., and Zahara, M. B. (1956). New Spinach Immune to Mildew: Hybrid Variety Developed by Plant Breeding Program Intended for Use Where Viroflay is Adapted, Produces Comparable Yield. Hilgardia 10, 15. doi:10.3733/ca.v010n07p15
Smith, P. G. (1950). Downy Mildew Immunity in Spinach. Phytopathology 40, 65–68. doi:10.1016/s0007-0785(50)80014-5
United Nations, (1992). Convention on Biological Diversity (Text with Annexes). New York: United Nations. Available at: https://www.cbd.int/ (Accessed June 15, 2021).
van Treuren, R., de Groot, L., Hisoriev, H., Khassanov, F., Farzaliyev, V., Melyan, G., et al. (2020). Acquisition and Regeneration of Spinacia turkestanica Iljin and S. tetrandra Steven Ex M. Bieb. to Improve a Spinach Gene Bank Collection. Genet. Resour. Crop Evol. 67, 549–559. doi:10.1007/s10722-019-00792-8
Xu, C., Jiao, C., Sun, H., Cai, X., Wang, X., Ge, C., et al. (2017). Draft Genome of Spinach and Transcriptome Diversity of 120 Spinacia Accessions. Nat. Commun. 8, 15275. doi:10.1038/ncomms15275
Xu, C., Jiao, C., Zheng, Y., Sun, H., Liu, W., Cai, X., et al. (2015). De Novo and Comparative Transcriptome Analysis of Cultivated and Wild Spinach. Sci. Rep. 5, 17706. doi:10.1038/srep17706
Keywords: gene flow, genetic diversity, population structure, selective sweeps, spinach, Spinacia, SNP
Citation: Gyawali S, Bhattarai G, Shi A, Kik C and du Toit LJ (2021) Genetic Diversity, Structure, and Selective Sweeps in Spinacia turkestanica Associated With the Domestication of Cultivated Spinach. Front. Genet. 12:740437. doi: 10.3389/fgene.2021.740437
Received: 13 July 2021; Accepted: 15 November 2021;
Published: 08 December 2021.
Edited by:
Luis Herrera-Estrella, Texas Tech University, United StatesReviewed by:
Briana Gross, University of Minnesota Duluth, United StatesJonathan F. Wendel, Iowa State University, United States
Copyright © 2021 Gyawali, Bhattarai, Shi, Kik and du Toit. This is an open-access article distributed under the terms of the Creative Commons Attribution License (CC BY). The use, distribution or reproduction in other forums is permitted, provided the original author(s) and the copyright owner(s) are credited and that the original publication in this journal is cited, in accordance with accepted academic practice. No use, distribution or reproduction is permitted which does not comply with these terms.
*Correspondence: Ainong Shi, ashi@uark.edu; Lindsey J. du Toit, dutoit@wsu.edu
†These authors have contributed equally to this work and share first authorship.