An Examination of the Techno-Economic Viability of Hybrid Grid-Integrated and Stand-Alone Generation Systems for an Indian Tea Plant
 M. Thirunavukkarasu
 Yashwant Sawle
- School of Electrical Engineering, Vellore Institute of Technology, Vellore, India
All tea plants in India rely on the national grid for their electrical needs and diesel for their thermal energy and transportation, which are encountering high costs, high emissions, and issues of accessibility. In this paper, hybrid renewable systems based on both standalone and grid-connected technologies have been modeled using HOMER Pro software for supplying power to a tea manufacturing plant in a typical rural area in India, namely, Gudalur village (Nilgiris), geographically located at 11°30.2′N and 76°29.5′E, which is presently run by the state grid to meet their energy requirements. The different configurations comprised of Solar PV, biomass, hydro, electrolyzer, boiler, thermal load controller to utilize excess electricity, and waste heat recovery options, and lead-acid batteries were designed to meet 650 kWh/day of electricity for processing units, 101 kWh/day of electricity for general applications, 4,450 kWh/day of thermal energy, and 86.35 kg/day of hydrogen energy. To determine the most feasible system design among various scenarios, several criteria such as NPC, COE, LCOH, and CO2 emission of the system have been investigated. In the case of off-grid hybrid systems, results show the highest NPC of $7.01 M with an LCOE of $1.06/kWh is obtained for the diesel generator/boiler/reformer/TLC system. It is reduced to $1.75 M with an LCOE of −$.420/kWh for the PV/biomass-CHP/hydro/TLC scenario. In a grid-connected system, the maximum NPC of $6.20 M with an LCOE of $0.835/kWh is obtained for a diesel generator/boiler system, and it is reduced to −$10.5 M with an LCOE of −$.240/kWh for the PV/biomass-CHP/hydro/TLC scenario. Additionally, in the off-grid systems, the PV/biomass-CHP/hydro/TLC system has LCOH of $4.27/kg, which is economical with the highest renewable fraction of 93%. The PV/biomass-CHP/hydro/TLC hybrid system has the lowest LCOH of −$64.5/kg with a maximum renewable fraction of 96% in on-grid systems. The findings show that recovering excess electricity and waste heat would increase renewable fraction, decrease the energy cost and emissions from the system, and emphasize the importance of TLC and CHP in HRES. According to the simulation results, the grid-connected system is more cost-effective than a stand-alone system due to the revenue obtained from selling renewable power to the grid.
1 Introduction
Tea is the most popular and widely consumed beverage worldwide, and the growth and production of tea have acquired a more exalted status, like the other plantation crops in the country. The world’s largest tea manufacturer is China, and India is the second largest (World Atlas, 2021). According to the tea production statistics data for 2020, Assam emerged as the most tea producing state in India, approximately 618.20 m kg, followed by West Bengal contributing 389.25 m kg. Tamil Nadu produced 153.83 m kg and was recorded as third state (Tea Board India, 2021). Tea production and consumption have increased steadily in recent decades, and the tea industry has made a considerable contribution to improving the economies of countries such as China, India, Kenya, and Sri Lanka, which produce half of the world’s tea (Gunathilaka and Tularam, 2016). Despite its economic significance to the nation, the cultivation and processing of tea contributes considerably to detrimental effects such as diminution of habitats, water pollution, and residues due to agricultural chemical use on the environment. Not everyone in the tea industry has sustainable plants for harvesting timber fuel. The principal firewood logging source remains the natural forest, resulting in deforestation. Tea factories are largely responsible for the emissions of gaseous, liquid, and particulate pollutants. The major pollution contributions are emitted by boilers, standby diesel generators, and the motor vehicles that transport freshly picked tea leaves to the factory. From exhaust fumes, emissions of carbon dioxide and nitrous oxide greenhouse gases are the primary contributors to global warming. Acid rain is formed mostly because of sulphur dioxide emissions, and particulate matter has various consequences for human health (Taulo and Sebitosi, 2016). According to the range of production scales in the tea sector, both specific electrical and thermal energy are consumed. In the tea industry, electricity from the power grid is the primary source of electrical energy, while diesel is used on the off-grid, and thermal energy requirements are provided by either coal or natural gas or by firewood. Power supply from the grid with frequent interruption to the tea industry is the major challenge to its production and quality. The tea industry has faced significant financial hardship as a result of high electricity costs (Kumar, 2009). Furthermore, the thermal energy required for tea processing is obtained by consuming wood fuel. The serious concern is that the use of forest firewood for thermal energy is causing deforestation in India (Visvanathan, 2002; Githinji and Daniel, 2019).
Tea production involves a sequence of processes: withering, rolling, fermentation, drying, sorting/grading, and packaging. Figure 1 depicts the general steps in the tea manufacturing process (Taulo and Sebitosi, 2016). All processes necessitate the use of electrical energy, while the withering and drying processes necessitate using thermal energy (Roy Mitra and Totan, 2016). Withering is the first processing step in the factory that starts daily, usually early morning, for black tea production. Thermal energy is required for this process, which reduces the surface moisture content of fresh tea leaves from 70%–80% to 60%–70% (wet basis) in order to condition them to be physically soft and flexible for subsequent rolling. There is no time limit for the withering process, which typically takes 14–18 h and should be performed at temperatures between 40 and 30°C (Deb and Jolvis Pou, 2016). The rolling process requires electrical energy because a rolling machine twists and breaks the leaves, releasing the fluid content and causing the leaves to ferment and oxidize. After rolling, the leaves are fed into a CTC machine, which chops them up into uniform pieces. The enzymes within the tea leaves come into contact with the air and are left to oxidize during fermentation, which is the least energy-intensive process. The change in color, flavor, and strength of the tea is attained at this stage. The fermentation room is kept at a temperature between 76°F and 78°F, and the fermentation process runs steadily for between 1 and 2 h (Tea processing, 2021). The drying process is the most critical and thermal energy-intensive in the tea-making process, and it determines the final product quality. Electrical power is also consumed by power blowers and dryers. The fermented tea leaves are dried in dryers, where the moisture content of the fermented leaves is reduced to 3%–5%. Depending on the dryer type, the required temperature of air for tea drying ranges between 60 and 140°C. The total time required for the drying process is approximately 1 hour (Temple et al., 2001). Sorting is the simple and final stage in the tea processing process. During this process, the sorter separates the leaves according to grades and fibers, and it is finally cleaned by removing any foreign materials. After separating all the different grades, packaging with different commercial names is put in bags and despatched from the factory. Electrical energy is required for sorting/grading and packaging and consumes less time (Lesson, 2021).
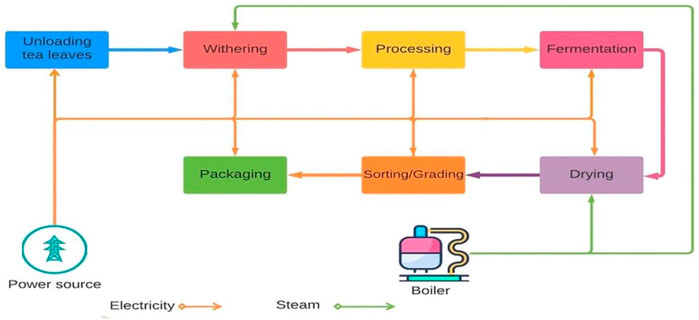
FIGURE 1. Processing steps in tea manufacturing.
Energy is a significant resource for the tea industry. In various phases of tea production, the quantity of energy consumed is different. All stages of tea processing require using electrical energy, and the withering and drying processes require using thermal energy to produce steam in boilers. Taulo and Sebitosi conducted extensive research on the energy consumption profiles of eight tea factories in Malawi’s supply. The specific electrical and thermal energy consumption in kW hours per kg of making tea was calculated to be .64 and 13.41 kWh/kg, respectively. The energy evaluation of each selected factory reveals that drying and withering units utilize the majority of the energy, ranging from 78% to 94% of the total energy consumed (Taulo and Sebitosi, 2016). A case study was conducted in Assam, India, to estimate the energy used in all processing units of a tea factory and suggested that some energy-efficient technologies will reduce a significant amount of production costs. For a tea production of 100 kg, the specific electrical consumption required for withering, maceration, drying, and grading is calculated as 5.54, 8.63, 6.23, and 3.95 kWh, respectively. Also, the required thermal energy is 49.75 and 497.53 kWh for withering and drying, respectively, proving that the thermal energy required for the drying process is higher than the withering process (Sharma et al., 2019). In India, specific electrical energy consumption ranges from .4 to .7 kWh/kg, whereas the total consumption of thermal energy ranges from 4.45 to 6.84 kWh/kg of tea (Sundaram and Kumar, 2021).
In tea factories, a large fraction of the energy is used for operating various units. A portion of the energy needed can be contributed using tea residue obtained from manufacturing and gardens. During processing, a large amount of waste is generated from withering due to spilling. In contrast, fibers are separated during sorting or grading, and the least amount of waste is generated in the offloading area. The waste derived from tea gardens is discarded leaves and branches of bushes, pruning/skiffing of tea bushes during the off-season, buds, tender stems of tea plants, and shade trees. The amount of acquired tea waste created accounts for about 2% of overall tea production. Thus, tea trash could thus be used constructively to offset the energy required to produce tea. Consequently, tea waste is referred to as biomass energy, and a possible alternative approach to extracting energy from tea waste is through pyrolysis and gasification (Kumar and Pou, 2016; Tamizselvan, 2021). The tea industry has a high energy demand, and the industry continues to rely on conventional fuels to meet it. However, the rising upstream cost of fossil fuels harms the economy and sharply reduces its production. The crisis in traditional energy systems has recently made a significant contribution to bio-energy solutions such as gasification, biofuels, agro-residue usage, and briquetting. Bearing the above facts in mind, the authors analyzed the feasibility of biomass options for a tea estate in the Northeast region of India. According to the analysis, renewable energy generation can reduce greenhouse gas emissions while improving efficiency and conserving fuel for the next generation (Saikia, 2013). Peria Karamalai Tea & Produce estate in Madurai District installed solar and wind power plants to reduce energy costs, CO2 emissions, and local air pollution. The annual estimation of solar plants is 4.5 million units, and the capacity of wind farms is 2.3 MW. The generation of power for the last 20 years is estimated at more than 95 GWh. The excess electricity generated by the power plant is connected to the grid. After successfully installing renewable technologies, 7,000 tonnes of CO2 emissions have been reduced per annum (The Peria Karamalai Tea and Produce Company Limited, 2021). The Xishuangbanna tea estate in China constructed a solar PV facility with a capacity of 51 MW, with an estimated yearly production of 80,000 MWh. Moreover, 80,000 tonnes of CO2 emissions into the environment are mitigated (Trina Solar, 2021).
Many studies examined the stand-alone or grid-connected hybrid power systems using various combinations of PV, wind, biomass, hydro, storage systems, diesel generator, and fuel cell. Besides, the scrutiny of hybrid power systems with thermal load controller arrangement is another propitious arrangement to provide thermal energy. Some research has been done in recent years to investigate the feasibility of the hybrid power concept for both electrical and thermal energy. The tea industries in Nilgiris are confronted with energy-related issues, such as increased energy expenditures and unreliable and inconsistent energy quality. Furthermore, the cost of energy is closely related to defining the entire product cost of the tea factory. Plenty of renewable energy resources, such as solar, wind, hydro, and biomass waste, are available in the selected location, which may provide affordable alternative sources of energy for driving parts of the manufacturing processes. Because of the lack of awareness of renewable energy resources, most tea companies have not utilized these resources properly. This research focuses on applying renewable energy sources instead of conventional fuels in the tea industry and lowering the cost of electricity and its environmental slam. Simultaneously, the use of excess electrical power from renewable energy systems and the reuse of waste heat from supplementary prime mover has not yet been attempted for the tea industry in India. The current study explores the method of harnessing waste products from tea factories to run a biodiesel generator. Moreover, excess electricity and waste heat are utilized to serve as thermal energy. During power generation using conventional diesel generators, biomass generators, microgas turbines, and fuel cells, most energy is squandered in the embodiment of heat. By incorporating combined heat and power units into an existing power system, waste heat energy would be recovered and can be utilized. The required heat is served by a thermal energy controller during tea processing, which reduces the amount of diesel consumed by the boiler. Hence, it results in conserving precious resources, and the energy conversion process of overall efficiency may be enhanced. Therefore, by wielding the Homer software and meteorological statistics gained from NASA, a feasibility study for various hybrid combinations of renewable energies to supply the required electrical and thermal energy of a tea factory in Nilgiri, India, has been conducted.
1.1 Related Techno-Economic Studies on Hybrid Energy Systems
Liu et al. performed optimal design and techno-economic analysis of a hybrid energy system, including photovoltaic, wind turbine, and biogas generator, for a village demand in China. The hybrid power system for rural electrification is modeled and simulated using HOMER software. They found that, compared with grid extension, off-grid PV/WT/biodiesel generator/battery is the most economically viable configuration. However, thermal load demand and utilization of excess energy and waste heat were neglected in their study (Li et al., 2020). Luta et al. carried out a comparative analysis between a grid analysis and an off-grid renewable system with hydrogen generation for a farming village located in South Africa. The geographical analysis of the chosen location reveals that most power stations are situated within a 200 km radius of Napier, making the deployment of an off-grid system less viable than grid extension (Luta and Raji, 2018). Bhattacharjee and Dey (2014) examined the feasibility of harnessing the waste rice husk biomass for power generation in the Tripura rice mills along with a combination of photovoltaic energy. The performance of the grid-connected PV/biomass combination conserves over 90% of consumption from the grid, which undoubtedly fulfills the starving of rice mill demand. The electrification rate in the Benin Republic country is low, which relies mostly on imports from its neighboring countries. The Alibori division in Benin has abundant renewable potential, such as solar, biomass, and hydro power, which are not untapped effectively. Therefore, the authors have developed an integrated on-grid PV/hydro/DG/battery model for commercial and community load demand in Fouay village. Results summarized that off-grid hybrid PV/DG/battery is the most optimal and economical technology to electrify the selected village in contrast to grid extension (Odou et al., 2020). Nigussie et al. developed a micro hydro-PV-DG-battery off-grid hybrid technology to power electricity for Melka Hera village in Ethiopia. From an economical standpoint, the cost of electricity obtained from the designed hybrid system is 0.133/kWh, which is more than the current grid price of 0.06/kWh. However, this system is cost-effective in delivering power to rural areas far from the grid. At the same time, from an environmental point of view, the renewable fraction covers about 99%, which promotes clean energy. The authors stated that this hybrid power system is an outstanding solution due to being cost-effective and environmentally friendly for electrifying the selected remote hamlet under the condition of obtaining funding or donations from the government or non-governmental organizations (Nigussie et al., 2017). Aziz et al. modeled an off-grid hybrid power system to electrify rural areas in northern Iraq and presented a techno-economic and environmental analysis based on a multi-year module. It was noted that, among different HESs, the PV/battery/hydro/diesel system is the most economical combination and has fewer pollutant impacts on the environment. Moreover, the outcome of the multi-year model outperforms that of the single-year module (Aziz et al., 2019b). Rezk and Dousoky (2016) carried out the technical and economic analysis of different off-grid renewable technologies for water pumping application to a remote agricultural area in Egypt, considering batteries and fuel cells as a storage unit.
The author proposed a synergistic hybrid NSGAII-MOPSO algorithm to solve the combined heat and power economic emission dispatch problem, which considerably improves system economy and efficiency and reduces fuel costs and emission levels of pollutants (Sundaram, 2020). Qiu Ting and Faraji optimized a standalone and grid-connected energy system that included solar system, wind turbine, storage system, gas generator, fuel-fired boiler, and resistive boiler. They intended to supply both electricity and thermal needs for a household in Iran and considered both load and annual electricity growth rate. Using the HOMER platform, a techno-economic investigation was performed. They concluded that the system based on the combination of the wind turbine, converter, resistive, and fuel-fired system with grid-connected mode was the most economical and superior to other configurations in the studied region (Qiu and Faraji, 2021). Isa et al. developed an economical and environmentally friendly cogeneration system for the University Kebangsaan Malaysia Medical Centre hospital building in Malaysia. This study shows the comparison between the feasibility of five different configurations. Furthermore, a sensitivity analysis has been performed by considering the impact of the annual interest rate and diesel prices. Finally, results show that the grid-connected PV/fuel cell and battery storage system has the lowest LCOE and NPV, which generates electricity and heat energy simultaneously using a single fuel cell. When the surplus and stored energy are sold to the grid, it provides more profit for the hospital through the Malaysian Government Fit program (Isa et al., 2016). Fernando et al. used the HOMER software to examine the optimal system configuration of a hybrid system in which solar, wind, and combined heat and power system were used for the Abertay University Library Building in Dundee, Scotland. In addition, a sensitivity analysis has been performed for various parameters, including solar radiation, wind speed, CHP size, and fuel price. Furthermore, it was estimated that the combination of CHP with grid-connected solar systems is the optimal configuration with the least cost of electricity of about $.0302 (Fernando et al., 2018). The applications of HRES related to various sectors are mentioned in Table 1.
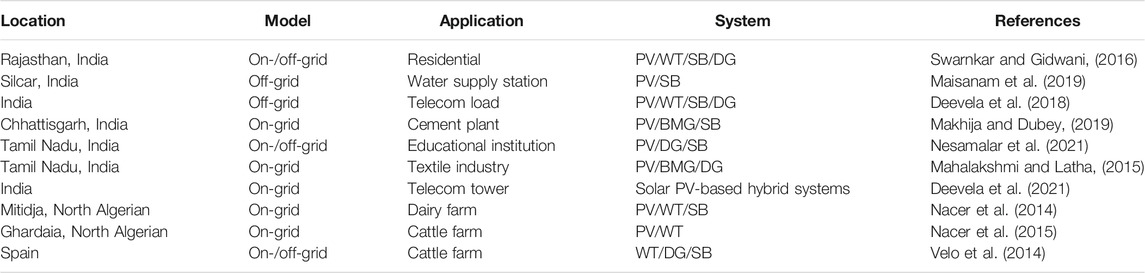
TABLE 1. Design of hybrid renewable energy systems for various applications.
Pal and Mukherjee (2021) delved techno-economic feasibility assessment of off-grid-based PV and hydrogen fuel cell integrated systems using HOMER software to provide electricity supply for end-user load demand in eight Indian northeast states. The COE and LCOH calculated from the simulation were $.509–.689/kWh and $16.1–18.7/kg, respectively. Peláez-Peláez et al. (2021) proposed a hybrid design combining solar PV technology with hydrogen fuel cell technology for cogeneration applications. For the system with a maximum electrical and thermal load of 14.5 and 40.54 kW, respectively, the techno-economic evaluations were investigated using the HOMER software. The lowest NPC and COE values for the PV-FC system, according to the findings, are $10,006,293 and $.8399/kWh, respectively.
Sawle et al. (2018a) analyzed the model of an off-grid-based diverse hybrid renewable energy system for a remote location based on various combinations of solar PV, wind, diesel generator, biomass, and energy storage systems using various optimization techniques (GA, PSO, BFPSO, and TLBO). The three diverse parameter considerations, namely, technical, economic, and social indices, were explored simultaneously. The result reveals that the TLBO algorithm presents the best solution and has superior performance. Sawle et al. (2018b) reviewed various configurations; control strategies to control the operation; and technological, economic, and social effects of off-grid HRES, which will provide insight into future hybrid system design and control advancements. Along with a comprehensive review, a comparative perusal of various grid-independent hybrid energy systems for a far-flung area in India has been performed using HOMER and PSO. Thirunavukkarasu and Sawle (2021) presented a comparative analysis of off-grid hybrid energy systems for remote sites located in India, and the results showed that a PV/wind/diesel/battery hybrid energy system is more economical than other hybrid systems. Sawle et al. (2016) discussed various optimization methods, control strategies, and software applications for designing and appraising hybrid energy systems. Moreover, a case study for a remote area in India was conducted to evaluate the performance of various hybrid combinations based on economic and environmental criteria. Ji et al. (2021) optimized a PV and biomass-CHP for satisfying the simultaneously required power and heat for rural villages in Northwest China. Sawle et al. (2018c) employed a novel approach to scrutinizing the distinct cases of off-grid-integrated hybrid systems to obtain the minimum worth of six different objective indices. Sawle et al. (2018d) simulated two different hybrid renewable energy systems, namely, solar-wind-biomass and solar-wind hybrid systems, to electrify a village in the Barwani district, India, and the optimal design based on the lowest COE has been decided using the GA and PSO techniques.
1.2 Novelty of the Study
Based on the current literature and research gaps described above, only a few studies examine the supply of thermal demand using recovered surplus power provided by renewable sources. Furthermore, in many locations worldwide, only a few studies have conducted feasibility evaluations of hydrogen generation based on off-grid and on-grid renewable power sources for refueling stations. To ensure the long-term viability of clean hydrogen fuel in energy security policies, hydrogen refueling terminals fueled by RES should be examined further to find a more appropriate and cost-effective solution. In this study, different types of off-grid and on-grid hybrid energy systems were modeled and compared to meet the required energy for a tea factory in India. Solar, biomass, and hydro energy are reasoned as the prime RE sources. Different possible configurations were modeled using components, such as solar system, biomass, hydro, diesel generator, boiler, thermal load controller, energy storage devices, and converters. The designed micro-energy systems in Homer software are divided into two categories: without a grid and with a grid. Microgrid systems based on renewable sources are expensive and can be intermittent due to varying weather conditions. Therefore, the diesel generator and battery storage are necessary to overcome this issue. During grid failure and peak demand, the diesel engine plays a vital role in meeting energy balance without excessively extending the current HRES. The combined TLC- CHP is utilized to meet thermal load, and diesel-based boilers are used to generate the required thermal energy when excess electricity is not available. Furthermore, the generation of green hydrogen from renewable energy sources would play a key role in achieving a carbon-uninfluenced economy and mitigating prospective energy preservation concerns.
The key contributions to this study are summed up as follows:
• This study analyses tri-generation, which has not been made in the literature as far as the authors’ knowledge is concerned, as the energy needs of India’s tea sector.
• Available renewable resources are estimated based on specific weather conditions and industrial activity. Using waste from tea factories and farmland, the biomass-based CHP units and a thermal load controller are explored to supply both power and heat concurrently, which is expected to increase system efficiency.
• Based on the available potential of solar PV, biomass, and hydro in Nilgiri district, India, the optimal sizing of different configurations is estimated by considering the tea industry load profile.
• A refueling station powered by renewable sources has been considered and modeled by the HOMER software. As a result, this study put effort into hydrogen generation from renewable sources, making it possible to lower transportation risk and expense.
• Electricity for general applications and tea processing uses, electricity for irrigation and processing, hydrogen for transportation, and thermal energy for heating are all given special consideration for the tea plant in a mountainous location.
• The simulation findings also feature optimized electrical, thermal, and hydrogen profiles, such as annualized production renewable system, available excess electricity, grid electrical transactions, and renewable fraction.
• The performance of stand-alone and grid-connected HRES was analyzed and compared in terms of NPC, COE, LCOH, and environmental benefits.
The rest of this paper is structured as follows: Section 2 describes the research area’s selection, the availability of renewable energy sources, and the analysis of energy demands. Section 3 presents an introduction to the HOMER optimization and the control strategy. In Section 4, mathematical models of systems components and analysis of resources are presented. In Section 5, the economic modeling of the HRES systems is discussed. In Section 6, the simulation results of the designed systems are presented and discussed. Finally, Section 7 summarizes the main conclusion.
2 Methodology
2.1 Site Location and Resource Assessment
Nilgiri district is typically mountainous and is at an altitude between 1,000 and 2,600 m above MSL. The Nilgiris’ elevation results in a considerably colder and wetter environment rather than the plains around, making the region renowned as a pleasant getaway and suitable for tea growing. The solar radiation and temperature at a location of 11°30.2′N and 76°29.5′E are taken from the NASA Surface Meteorology website. The temperature throughout the summer is up to a maximum of 25°C and a minimum of 10°C, respectively. In winter, the highest temperature is 20°C and the lowest temperature is 0°C. Water sources have a key role in the production of electricity in the district of the Nilgiris and represent almost one-third of Tamil Nadu’s generating hydro power. Many streams begin on hill slopes and morph into rivers in the deep valley sections. In the Nilgiri Hills, approximately 28 dams have been built to impound, divert, and regulate water resources for hydro power generation. The Pykara River is the biggest in the Nilgiri area, and the Pykara waterfall flows through Glen Morgan dams. The selected tea factory is located in Gudalur town, Nilgiri district. This location is at a height of approximately 1,100 m above sea level. Gudalur is located on the lower plateau of the Nilgiris, and the majority of the region is covered with green carpets. In and around the Gudalur area, there are several tea cultivations and processing plants.
2.2 Analysis of Energy Consumption
2.2.1 Electrical Load
Tea factories require electricity and thermal energy to run their processing units at a ratio of 15:85 (Baruah et al., 2012). Electrical energy for tea processing is required to power fans and tray motors, rotor vane, and conveyors, while thermal energy is required largely for withering and drying. The state’s electricity grid meets the requirements for electrical energy. During power outages and blackouts on the state grid, electricity is generated by a backup diesel generator unit. To generate thermal energy, external sources, such as coal, diesel, natural gas, or firewood, are used as the main source of fire for the boiler. Producing 1 kg of tea requires green leaves in the range of 4.1–6.33 kg (Sundaram and Kumar, 2021). Specific energy consumption is evaluated based on the production of 1,000 kg per day.
A tea factory’s daily output is assumed to be 1,000 kg. To produce 1 kg of tea, 0.65 Kwh of electrical energy is required (Taulo and Sebitosi, 2016; Sundaram and Kumar, 2021). The total electrical energy required for 1,000 kg is 1,000 * .65 = 650 Kwh/day. The tea industry is assumed to have been operating on a shift basis 24 h a day, 7 days a week. The total average load is 27.083 KW. Furthermore, for general applications such as indoor and outdoor lightning, fans, computers, printer, and pumping water, the required average kWh/day energy is calculated to be 101.23 kWh/day.
Figures 2A,B display a comprehensive hourly electrical demand profile for the processing and general applications of tea units, respectively.
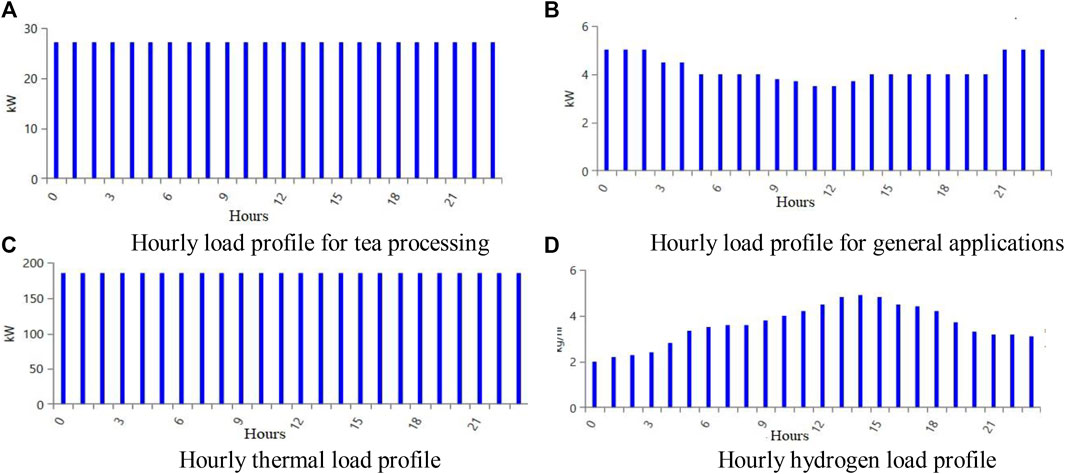
FIGURE 2. (A) Hourly electrical load profile for tea processing. (B) Hourly electrical load profile for general applications. (C) Hourly thermal load profile. (D) Hourly hydrogen load profile.
2.2.2 Thermal Load
To produce 1 kg of tea, 4.45 Kwh of thermal energy is required (Sundaram and Kumar, 2021). The total thermal energy required for 1,000 kg is 1,000 * 4.45 = 4,450 kWh/day. The total average kW is 185.416 kW. Figure 2C displays a comprehensive hourly thermal demand profile.
2.2.3 Hydrogen Load
Hydrogen has risen to the forefront of many sectors’ sustainability initiatives as a result of technological and economic advancements, drastically lowering or eliminating CO2 emissions. The demand for high-performance electrolyzers for hydrogen production through electrolysis is being sparked since hydrogen has been considered a pillar of the nation’s future energy transitions. Much of the activity surrounding today involves electrolyzers. When powered by renewable electricity sources, electrolyzers produce emission-free or green H2. The manufacturing of electrolyzers has substantially increased in recent years to fulfill worldwide green H2 demand. The transportation sector is important in the tea industry to facilitate the transportation of the required tea leaves from plantations to the processing center. The tea factories are usually located about a few kilometers from the tea farm. It is necessary to reach the tea leaves just after the harvest from cultivated land. Petrol and diesel vehicles are still used to transport and export tea leaves. Fuel prices have risen dramatically, as indicated in the graph, which has begun to impact the industry. Moreover, pollutants, such as carbon dioxide, carbon monoxide, unburned hydrocarbons, and nitrogen oxides, are produced when diesel fuel is used in generators, boilers, and automobiles. The diesel price is assumed as $1.29 (NDTV, 2021). This assessment presumed that the hydrogen refueling plant is located in the Nilgiris region of India, which is operated by an eco-friendly renewable energy system. This hydrogen refueling station is designed to meet a daily hydrogen demand of 86.35 kg/day. This demand is estimated to cover 30 cars with a 3 kg storage tank for daily 240 km use, considering that every vehicle requires around 12 g of H2 per kilometer (Islam, 2018). Figure 2D depicts a hydrogen load profile of a refueling station.
3 HOMER Software
Simulating, optimizing, and evaluating the performance of hybrid renewable energy systems may be done using a variety of software simulation tools. Among these, HOMER Pro is a unique and incredibly robust tool with the greatest application for developing renewable systems accessible. HOMER Pro is a sophisticated tool created first by the National Renewable Energy Laboratory, located in Golden, CO, United States. It is found to be the finest hour’s evaluation tool, with the best blend of flexibility and simplicity. It analyses all potential configurations in a single run and then ranks the systems based on the optimization variable of choice. HOMER is user-friendly, requires simple inputs, is easy to use, and provides an efficient graphical representation of results. This tool is used for the design and analysis of both on- and off-grid-connected hybrid energy systems. Techno-economic analyses are carried out utilizing HOMER energy to estimate the optimal size of the hybrid components of the system. Figure 3 illustrates the HOMER architecture for optimal hybrid system design and analysis (Thirunavukkarasu and Sawle, 2021). Several input data are required to design a system in HOMER, including load profile, renewable sources available at the selected site, technical and economic details of the system components, constraints, types of dispatch strategy, and system economics. The technical feasibility of the system will be determined by simulation, and the system optimization will be carried out based on several system configurations to find the most appropriate system. Moreover, a sensitivity analysis is carried out to assess how the configuration of the optimal system changes due to the effect of uncertainty or changes of various parameters. The downside of HOMER is that it does not allow us to represent transient changes in less than an hour.
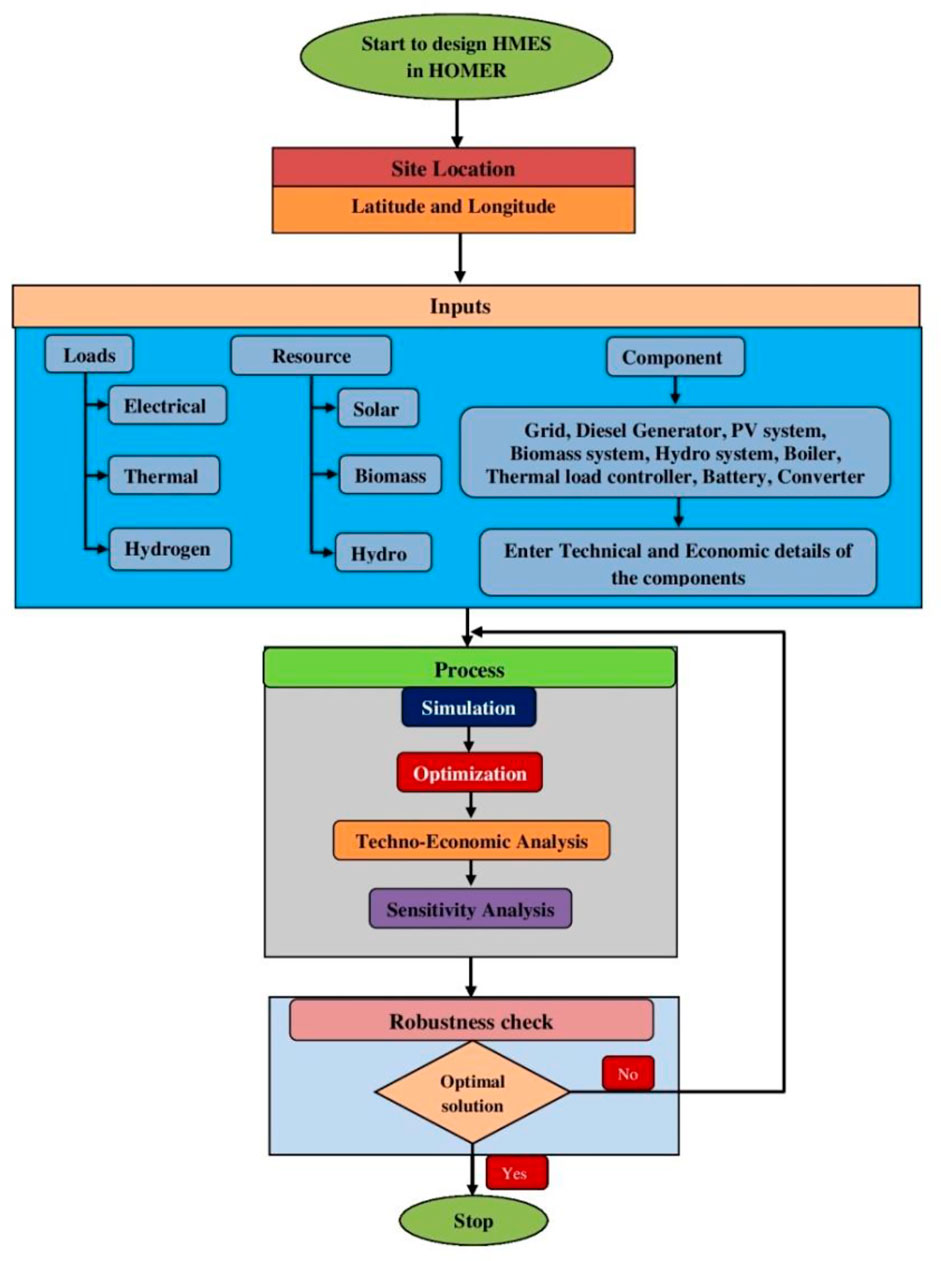
FIGURE 3. Diagrammatic representation of HOMER algorithm.
3.1 Control Strategy
When renewable energy sounds insufficient to meet the load, several collections of rules have been framed to govern the operation of generators and storage batteries, termed dispatch strategies. There are several dispatch strategies concerning optimizing the microgrid power management and optimal sizing. In the HOMER optimization algorithm, depending on the load demand, the availability of power sources, and the conditions of weather circumstances, various arrangements of dispatch strategies, such as load following, cycle charging, generator order, and combined dispatch, seem to be used. The dispatch strategies of LF and CC are utilized to control the generator operation and the battery. The technological, economic, and environmental performance of an off-grid and on-grid HES supplying electricity to industrial demand in India using a load-following technique has been investigated in this study. During CC dispatch strategies, generators energize storage batteries, and during off-peak periods, generators shut down, thereby decreasing the total operating hours of generators. However, the replacement cost of the battery is high in this strategy because of its sequence of charging and discharging processes. When a generator is needed, the load-following (LF) process states that it should only supply enough capacity to fulfill the load requirement. Load demand should be satisfied by renewable resources to keep the system sustainable and stable. The system under the LF strategy experiences maximum utilization of renewable sources because the generator is used for accessing load demand only and cannot cater to charging storage batteries. The battery is generally charged through the renewable system’s excess electricity only. Moreover, the battery attains a longer life due to its lower utilization. In this dispatch approach, the power supply to the load takes precedence. As a result, the system reliability for this technique is quite high. In this work, simulation was carried out using the load flow strategy, and the general flowchart for the load following strategy proposed is shown in Figure 4 (Aziz et al., 2019a).
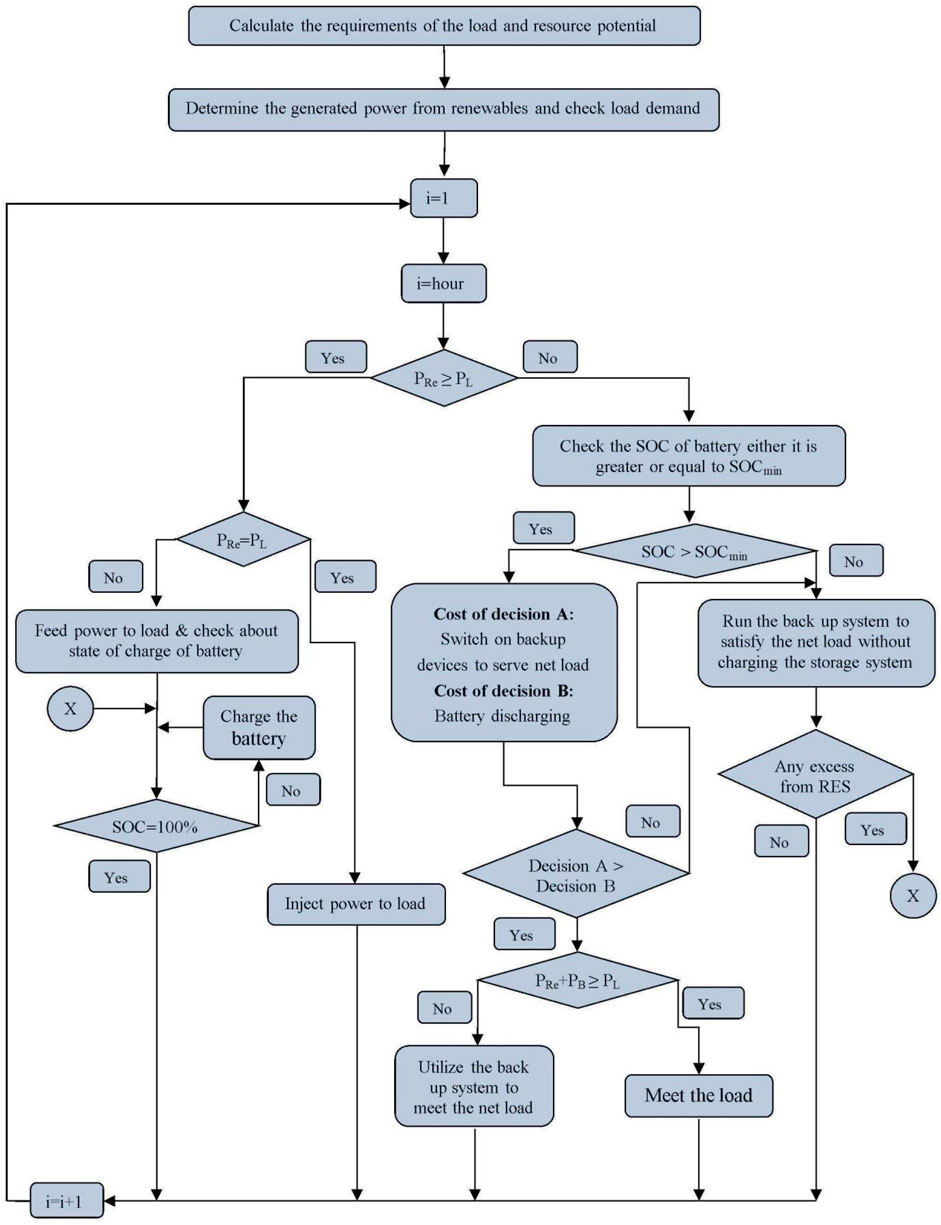
FIGURE 4. Diagrammatic representation of load-following dispatch strategies.
3.2 Project Economics
The lifespan of the system is considered to be 25 years at a discount rate of 8% and an inflation rate of 2%.
3.3 Constraints
The following input constraints are considered for the system: The maximum annual capacity shortage of 0% and the minimum renewable fraction of 0% are considered Operating reserve (as a percentage of loads): The load in the current time step is set to 10% and the annual peak load is set at 0%. Operating reserve (as a percentage of renewable output): The solar and wind power outputs are assumed to be 80% and 50%, respectively.
4 Modeling of System Components
4.1 Grid
According to the high tension energy tariff IA issued by the Tamil Nadu state government, the grid scheduled rates are specified as $.085/kWh, $.10/kWh, and $.0810/kWh during normal, peak, and off-peak periods, respectively. Furthermore, the demand costs are assessed as $ 4.7/kVA/month (Tamil Nadu Electricity Regulatory Commission, 2021; TNERC, 2021). Herein, the sell-back price to the grid is considered as $.280/kWh (Tomar and Tiwari, 2017). The grid is used to assure uninterrupted load supply, and the diesel fuel sources run as a backup system if the grid fails to supply power. As per government tariff, the grid power price paid by tea sectors is $.1/kWh. Power grids transmit electrical energy from generating stations to consumers. A “grid emission factor” assesses the impact of greenhouse gas emissions during electricity generation and the emission factor of grid power has unintended repercussions to natural environment. In research applications, the grid emission factor is an essential parameter to assess basic emissions of renewable energy and waste heat regeneration projects and proper monitoring will avoid pollution leakage. According to Inventory of India’s green house gasses, the average emission of CO2, unburned hydrocarbons, SO2, and NO in India are around 1,800, .02, 2.74, and 1.34 (g/kW h), respectively (DERC, 2014).
4.2 Solar System
Photovoltaic panels provide power during the day when the radiation is sufficient, but not at night or during the rainy season. However, other sources will compensate for the need for electricity. Solar energy may be a possible potential energy supply in selected locations to meet the tea industry’s electricity needs. The average yearly solar radiation for the location was about 4.98 kWh/m2/day, while the average clearness index was .511. Economical specifications of the considered photovoltaic panels are shown in Table 2. The Homer optimizer option is selected to find the optimum solar PV size.
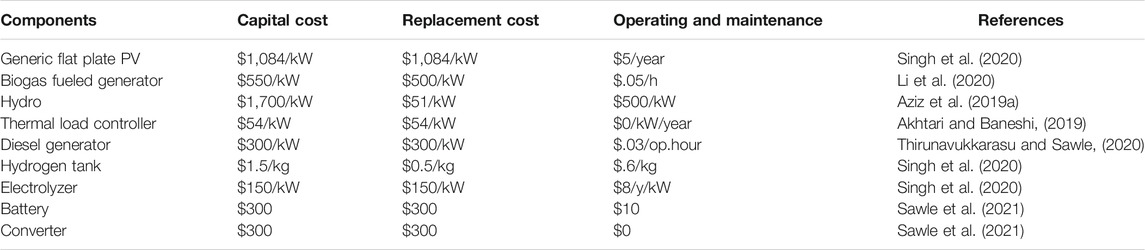
TABLE 2. Economic specifications of components.
When it comes to the PV array, energy balancing is used as the following Duffie and Beckman Eq. 1 (Akhtari and Baneshi, 2019):
The cell temperature can be obtained as per Eq. 2 (Akhtari and Baneshi, 2019):
where
HOMER determines the power output of the photovoltaic panels by applying the following equation (Sawle et al., 2021):
where YPV defines solar rated capacity in kW, Fspv defines solar PV derating factor, Gt is striking of solar photovoltaic radiation in kW/m2, Gt,stc is incident of solar PV radiation in kW/m2 at standard test conditions, αp defines the temperature coefficient of power, TC represents the temperature of the solar cell, and TCSTC denotes the temperature of the PV cell at standard conditions of temperature.
4.3 Biomass
With rapid population growth and economic development rates, the need for global electricity is growing. Tea waste has become a promising resource for biomass fuel. The typical gross calorific power of tea waste is 16.19 MJ/kg. As a result, there is a significant opportunity for a transition to energy conservation through the efficient use of tea waste. Gasification and combustion of tea waste with other biomass resources have received increased attention for electrical and thermal energy needs in the tea manufacturing process. Thus, the energy needs for tea processing units can be met using solid tea waste generated by the tea industry, resulting in zero waste and being environmentally friendly (Nagaraja et al., 2013). A generator, in general, consumes fuel to generate electricity and heat. The generator, according to HOMER, transforms the entire fuel energy into electricity and heat. The heat recovery ratio is the percentage of heat recovered and used to power the thermal load. Herein, the generator consumes biomass fuel derived from the biomass. The fuel consumption of the generator is determined by HOMER using Eq. 4, which assumes the fuel curve is a straight line with a y-intercept (Njoku et al., 2018). The electrical efficiency of a system is calculated by Eq. 5 (Anand Baredar, 2016). Economic details related to the biomass generator are available in Table 2.
where F0 is the coefficient of the fuel curve intercept, F1 represents the slope of the fuel curve, Ygen is the generator’s rated power (kW), Pgen denotes generator output power (kW):
where Pnet indicates the system’s maximum effective electrical power and (Input biomass)LHV represents the lower heating value of biomass input.
4.3.1 Analysis of Biomass Resources in the Selected Location
The economics of the tea industry in the Nilgiris face significant challenges due to high energy costs. Fuel prices rise continuously, and most tea factories rely on coal, firewood, natural gas, and briquetted biomass for thermal energy. The tea industry spends the majority of its profit on electricity and firewood. Due to high energy costs, the tea industry is in a position to use renewable energy as an alternative to the state’s grid electricity. Waste from tea factories and tea plantations could supply a major proportion of the required thermal energy for the tea processing units. The selected tea factory has about 1,695 small tea growers and 3,746 acres under cultivation, under regular production covering total tea production of around 22.68 tonnes per annum as against the installed production capacity of 28.10 kg per annum (Indcoserve, 2021). The availability of biomass potential in tea plantations and industry is listed in Supplementary Table S1 (Kumar et al., 2021). The tea waste generation during tea processing in factory is about 2% of the total tea production (Kumar et al., 2021). Thus, for 1,000 kg of tea production, the total solid waste is calculated to be approximately 20 kg/day. Total waste generated per day has been calculated as the summation of field waste, cover tree waste, and waste during processing. Tea waste is available in abundance, which can be directly obtained during the processing of tea and from farmland. The average price of tea waste is considered to be zero as the tea factories have their own plantations.
Total waste generated ≈60 tonnes/day (59122 + 1,107 + 20 = 60249 kg/day) Supplementary Table S1 (Kumar et al., 2021). An annual average of 30 tonnes per day (approximately half of the calculated value) has been considered as the biomass resource profile for this study.
4.4 Hydro Resource
Many dams have already been built in the Nilgiri district, so it gives us the opportunity to develop hydro power plants for the tea sector. Supplementary Table S2 shows the installed capacity of hydro power plants in Nilgiris (TANGEDCO, 2021). The dam Glenmorgan, built over the Glenmorgan River, is 16 m high and 80 m long. The catchment area is 2.59 km2, and the gross storage capacity of the reservoir at FRL is 0.74 mm3 (Dams and Reservoirs, 2021). The chosen tea estate is around 31 km from the dam of Glenmorgan. Based on the design flow rate (2,000 L/s) and available head (24 m), the nominal power of the water turbine is estimated to be 370.46 kW (Identified Future Hydro Projects, 2021). Cost parameters related to the hydro generator are available in Table 2. In HOMER, Eq. 6 is used to compute the amount of electricity generated by the hydro turbine (Aziz et al., 2019b):
where ƞhyd is the % efficiency of the hydro turbine, ρwater represents the water density (kg/m3), Qturbine indicates the flow rate through the turbine in terms of volume (m3/s), g is the gravitational acceleration of approximately 9.81 m/s2, and hnet is the turbine’s available effective head (m).
4.5 Thermal Load Controller
TLC serves as an electric boiler, allowing surplus electricity generation from PV modules, BMG, DG, and the hydro turbines to serve thermal loads. The produced excess energy may be alternately used to meet the required thermal energy for the withering and drying process rather than wasting it. Furthermore, recovering waste heat from supplemental prime movers to fulfill thermal load might result in significant economic and environmental advantages. Thermal load controller and heat recovery options can play an integral role in supplying thermal demand by utilizing excess electricity and waste heat, respectively, which consequently sets the stage for fewer emissions and diesel consumption. Table 2 specifies the economic parameters for the thermal load controller. Unfortunately, HOMER does not offer TLC specifics, and the only stated criteria are costs and sizes, which need to be improved to achieve greater optimization. For TLC, the “size your own” option under sizing is selected. The discrete sizes, such as 100, 200, 300, and 350 kW, were selected as a range of sizes.
4.6 Diesel Generator and Boiler
The conventional diesel generator is a simple way to generate electricity that uses more fuel and creates many pollutants. The power produced by renewable energy systems is utilized as a primary source to satisfy peak demand. Furthermore, when there is insufficient surplus electricity to operate an electric boiler, a diesel-fueled boiler will be activated to meet the thermal demand. All the generators consume fuel to produce energy, and whenever DG is operated, it produces greenhouse gas emissions. The average emission production by the diesel fuel-based resources is considered as follows: carbon monoxide, unburned hydrocarbon, particulate matter, the proportion of fuel sulfur converted to PM, and nitrogen oxides are about 6.5, .72, .49 g/L, 2.2%, and 58 g/L, respectively (Pahlavan et al., 2019). Economic parameters related to the generator are available in Table 2. For DG, the “size your own” option under sizing is selected. The discrete sizes, such as 10, 20, 30, 40, 50, and 55 kW, were selected as a range of sizes.
4.7 Reformer
Thermal methods for hydrogen generation usually use steam reform, a process of high temperature in which steam responds to the creation of hydrogen through the hydrocarbon fuel. Hydrocarbon fuels include gas, diesel, and natural gas, or gasification biomass can be reformed to generate hydrogen. Today, steam reformation of natural gas produces around 95% of hydrogen. Hydrogen is produced by reforming a hydrocarbon in a reformer driven by diesel fuel. The hydrogen load and the diesel-fueled reformer are regarded to be part of the vehicle. For reformers, the “size your own” option under sizing is selected. The discrete sizes, such as 1, 3, 5, and 7 kg/h, were selected as a range of sizes.
4.8 Hydrogen and Electrolyzer
Hydrogen has now become an essential component of HRES in order to have a sustainable and clean system. As previously stated, an electrolyzer was used to meet the hydrogen needs for hybrid vehicles. The excess electrical AC or DC is transformed by the electrolysis of water into hydrogen. The electrolyzer operates on the principle of the electrolysis method, which is based on the splitting of water into hydrogen and oxygen by applying electricity. The hydrogen tank can store hydrogen and utilize it as fuel for generators or hydrogen vehicles. The electrolyzer in HOMER operates only if the surplus power is generated by renewable sources or in the case to avoid unmet hydrogen demand. The cost parameters of the electrolyzer model and hydrogen tank used in HOMER are available in Table 2. For HT, the “size your own” option under sizing is selected. The discrete sizes, such as 50, 100, 150, and 200 kW, were selected as a range of sizes.
The hydrogen generation rate from an electrolyzer can be determined using the following equation (Ayodele et al., 2021):
where αH2 is the mass flow rate of hydrogen produced; ηf is the Faraday efficiency; Ns is the number of cells in series; Iel is the electrolyzer current; n is the number of electrons per mole; F is the faradays constant.
The generated hydrogen from the electrolyzer is at lower pressure than the pressure required at fuel filling stations (350 or 700 bar). Hence, a compressor is required to increase the pressure required to fill the fuel. The power required to compress the produced hydrogen to the required one has been evaluated using the following equation (Ayodele et al., 2021):
where
P1 and P2 are the inlet and outlet pressure, respectively. αH2 represents the flow rate of the hydrogen produced.
Using electricity, hydrogen can be obtained at the cathode by hydrolyzing water using Eq. 9, and oxygen can be obtained at the anode using Eq. 10 (Gökçek and Kale, 2018a):
The value of hydrogen pressure in the hydrogen tank can be calculated by the following equation (Ayodele et al., 2021):
where Qht is the hydrogen pressure, R represents a gas constant, T represents the inlet temperature of the compressor, Vht represents hydrogen tank volume, and nht represents the number of moles in the hydrogen tank.
The hydrogen tank autonomy, which is defined as the ratio of the hydrogen tank energy capacity to the electric load, can be determined using the following equation (HOMER Pro, 2021):
where Aht represents hydrogen tank autonomy, Yht represents hydrogen tank capacity (kg), LHVH2 represents the lower heating value of hydrogen (120 MJ/kg), and Lpr,av represents the average primary load (kWh/day).
4.9 Battery and Converter
Batteries have lately gained popularity as a form of energy storage due to their efficiency and environmental friendliness. In order to ensure consistent voltage during peak loads or short-term capacity production, batteries are employed as a supplemental backup. The converter includes both a rectifier and a converter to convert AC to DC power and vice versa. The economic specific details of the battery and converter are available in Table 2. The Homer optimizer option is selected to find the optimal size of the battery and converter.
From the model of kinetic battery, Eq. 13 gives the maximum amount of power that the battery can absorb in a given amount of time (Akhtari and Baneshi, 2019):
The following equation calculates the battery charge power associated with this maximum charge rate (Akhtari and Baneshi, 2019):
From the model of kinetic battery, the following equation gives the maximum amount of power that the battery can discharge in a given amount of time (Akhtari and Baneshi, 2019):
where Q1 is at the start of the time step, initial battery power (kWh); Q at the start of the time step, the entire quantity of energy in storage (kWh); Qmax is battery’s overall capacity (kWh); C represents the ratio of battery capacity; K represents constant storage rate (h−1); αc represents the maximum rate of charging (A/Ah); Δt represents Step length in time (h); and Kbm and mcr represent kinetic battery model and maximum charge rate, respectively.
The mathematical model of the rectifier can be illustrated using the following Eqs 16–18 (Ani Vincent, 2021):
At any time t,
where Erec-out represents the output energy from the rectifier (kWh), Erec-In represents the input energy to the rectifier (kWh), ηrec represents the rectifier efficiency, Erec-out represents the output energy from the rectifier (kWh), Esur-AC represents the available surplus energy from the AC sources, EDg represents the output energy from the diesel generator (kWh), and Eload represents the load demand (kWh).
4.10 Charge Controller
A charge controller is used to detect when a battery is completely charged and to halt or reduce the amount of energy flowing from the energy source to the batteries to prevent overcharging. The mathematical model of the charge controller can be illustrated by the following equations (Ani Vincent, 2021):
where Ecc-out represents the output energy from the charge controller (kWh), Ecc-In represents the input energy to the charge controller (kWh), ηcc represents the charge controller efficiency, Erec-out represents the output energy from the rectifier (kWh), and Esur-DC represents the available surplus energy from DC sources.
We consider the various combinations of the technologies discussed above, and Figure 5 shows the schematic of the on-grid and off-grid system configuration designs.
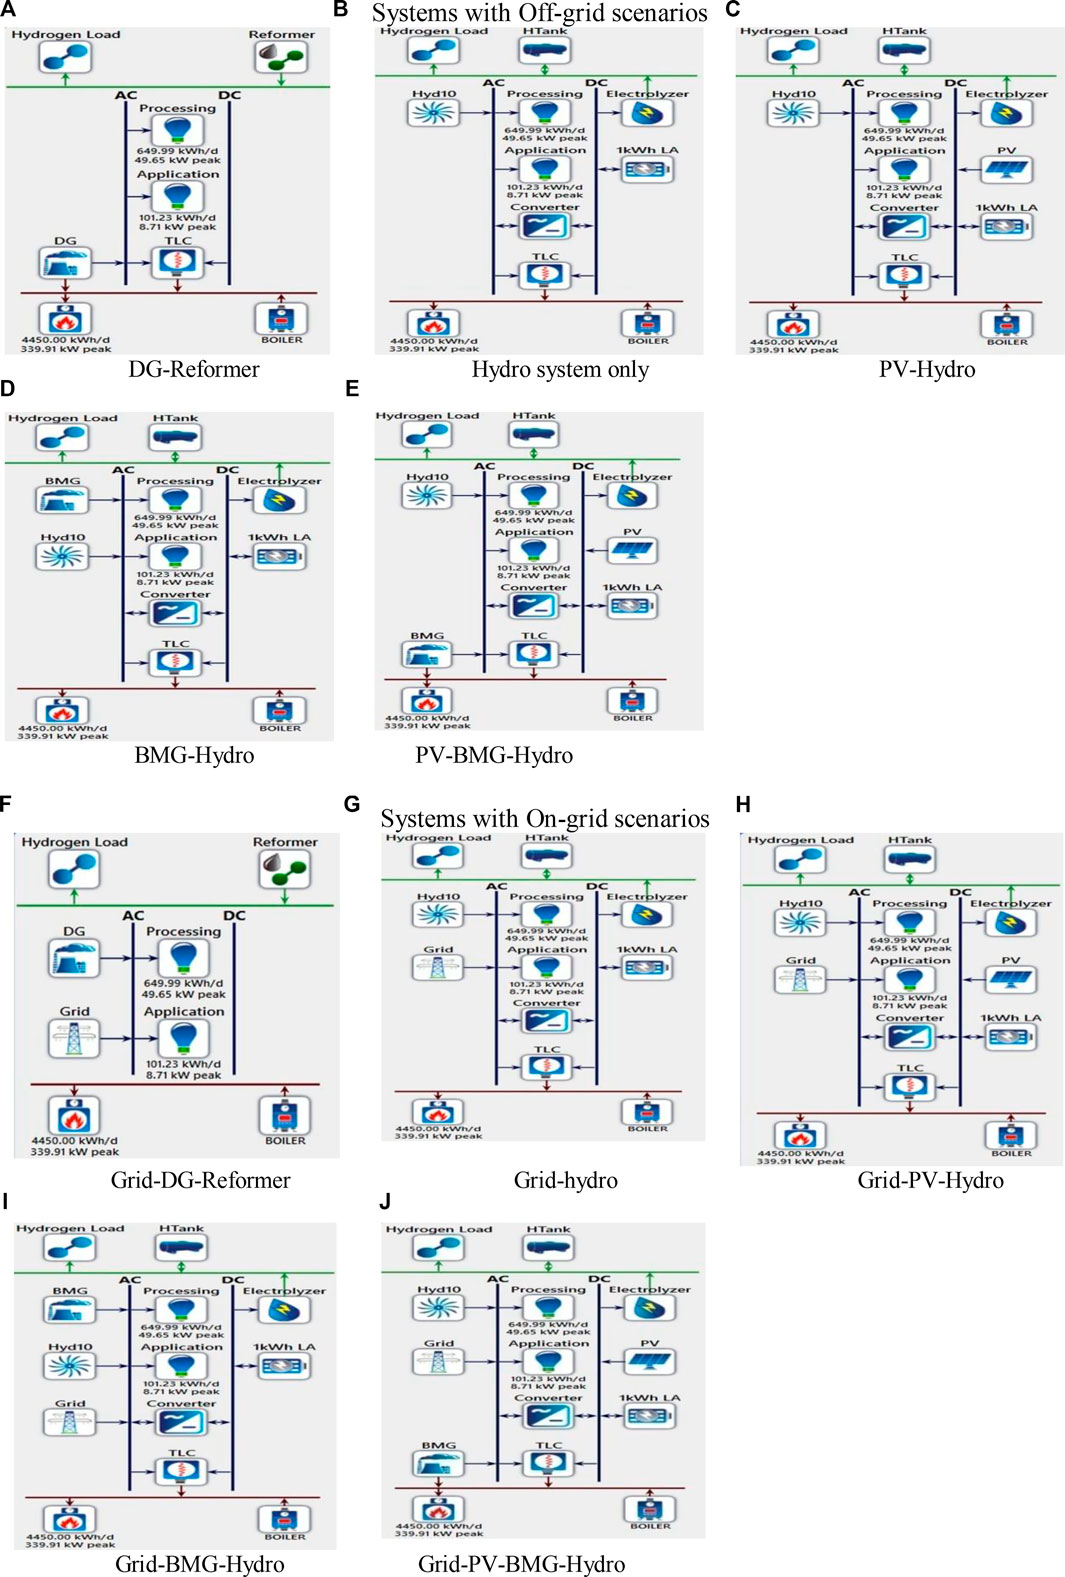
FIGURE 5. Designs of standalone and grid hybrid renewable energy technologies. (A) DG-reformer. (B) Hydro system only. (C) PV-hydro. (D) BMG-hydro. (E) PV-BMG-hydro. (F) Grid-DG-reformer. (G) Grid-hydro. (H) Grid-PV-hydro. (I) Grid-BMG-hydro. (J) Grid-PV-BMG-hydro.
5 Economic Modeling
5.1 Net Present Cost
Capital expenses, replacement costs, operation and maintenance costs, fuel costs, pollution penalties, costs of buying electricity from the electric grid, and revenue earned are all included in the total net present cost of a system. The total NPC is calculated by dividing the total annual cost by the payback period factor, as follows (Li et al., 2020):
where NPC is the system net present cost, Cann,tot represents the system’s total annualized cost ($/year), CRF represents capital recovery factor, i represents %interest rate, and Rproj is the lifetime of the project in years.
5.2 Levelized Cost of Electricity
tHOMER determines the levelized cost of the electricity (LCOE) by dividing the difference between the total annualized cost and the product of boiler marginal cost and thermal load served by the total electrical load served as represented in Eq. 22 (Elsaraf et al., 2021), and Eq. 23 determines the marginal cost of the boiler (Elsaraf et al., 2021):
where LCOE is the levelized cost of electricity ($/kWh), Cann,tot represents the system’s total annualized cost ($/year), Cboiler represents the marginal cost of the boiler, Hserved is the total thermal load which will be served by the system, and Eserved is the total electrical load served.
In boiler marginal cost, Cfuel represents diesel fuel cost, Cboiler emissions represents that the expense of boiler fuel has associated a penalty, ηboiler is the boiler efficiency, and LHVfuel represents the lower heating value of the fuel.
In this present study, the thermal load is considered, so the second term in the numerator of LCOE is non-zero, and hence the value of LCOE can be negative. Because of the high fuel cost, the negative component in the first equation is more than the total annual cost, which implies that the investment cost of the renewable system is lower than the annual cost of the thermal load if the diesel system is fully utilized to serve the load. In other words, savings occurring from replacing the diesel system exceed the cost of the renewable system. Hence, the LCOE becomes negative. When the thermal load provided by the renewable system is considered, the LCOE will be significantly even lower.
5.3 Levelized Cost of Hydrogen
HOMER determines the levelized cost of the hydrogen by dividing the difference between the total annualized cost and the yearly cost of the electricity by the total annual hydrogen production as follows (Siyal et al., 2015; Gökçek and Kale, 2018b; Minutillo et al., 2021):
LCOH is the levelized cost of hydrogen ($/kg), Cann, tot represents the system’s total annualized cost ($/year), Vel is the selling price of the electricity that will be sold and injected into the electrical grid ($/Kwh), Eexcess is the excess electricity which will be served by the TLC to thermal load (kWh/year), and Mhydrogen is the annual production of hydrogen (kg/year). In this study, the considered station is both an off- and on-grid system. In an off-grid system, the second term Celectricity in the numerator is zero because as the system is not connected to the grid, there is no sale of electricity to the grid, where Celectricity = Vel (Eprimary + EExcess + EGrid sales); Vel was taken as zero. Hence, HOMER calculates the LCOH by dividing the total annualized cost with the annual production of hydrogen.
6 HOMER Simulation Results
This chapter will give the details of the different studied SHRS for a typical tea factory corresponding to the study area of Nilgiri Mountain, India, and discussed toughly in the following subsections. A techno-economic analysis for both on- and off-grid mode of the several integrated energy systems has been investigated using the HOMER Pro software tool, including environmental aspects. The comparison is carried out based on some objective parameters, such as less cost of energy and hydrogen, high renewable fraction, less diesel fuel consumption, and less emission in order to select the best choice among the different power generating schemes.
6.1 Off-Grid DG-CHP/Boiler/Reformer/TLC
The tea factory process required a diesel generator to meet the electric load and a boiler for the thermal load. This is the most often applicable arrangement for energy use in tea farms. Diesel fuel is mostly used to run generators and boilers. A 55 kW diesel generator consumes 82,886 L of diesel and produces 274,289 kWh/year to meet the electrical load. Moreover, a boiler is used to supply the required steam for the thermal load, which utilizes 194,195 L of fuel to generate a total production of 1,624,250 kWh/yr. Hence, the amount of total fuel consumed by the system without considering cogenerated heat is 277,081 L. The NPC, LCOE/kWh, and LCOH/kg of the standalone DG/boiler/TLC (without considering CHP) are $7.55 M, $1.22, and $18.5, respectively. In generators, losses occur in the form of heat. Homer assumes that the generator transforms the entire energy from diesel into electricity and heat and can deliver the necessary energy simultaneously for electric and thermal load by utilizing cogeneration systems. The generator heat recovery ratio input is pertinent only for cogeneration systems. In order to consider a cogeneration system, the proportion of heat recoverable is assumed to be as input without retaining this input at zero. The amount of cogenerated heat is quite more as the generator has run for a long time. Figure 6 represents total system energy generation, and as shown in Figure 6C, the generator generates 270,652 kWh to satisfy the thermal demand at 50% of the generator’s heat recovery ratio, and the TLC and boiler supply the remaining thermal power. The NPC, LCOE/kWh, and LCOH/kg of the standalone DG/boiler (with TLC and 50% CHP) are $7.01 M, $1.06, and $17.2, respectively. In this case, a reformer based on diesel has been considered to serve hydrogen demand. The total amount of fuel cost to produce the required hydrogen is estimated to be $ 2,594,352, which is uneconomical. By recovering the excess electricity via TLC, and waste heat through a waste heat recovery system, the NPC, COE, total fuel usage of the boiler, and the release of pollutants are reduced substantially. Supplementary Table S3 depicts the optimization results based on the effect of TLC and CHP.
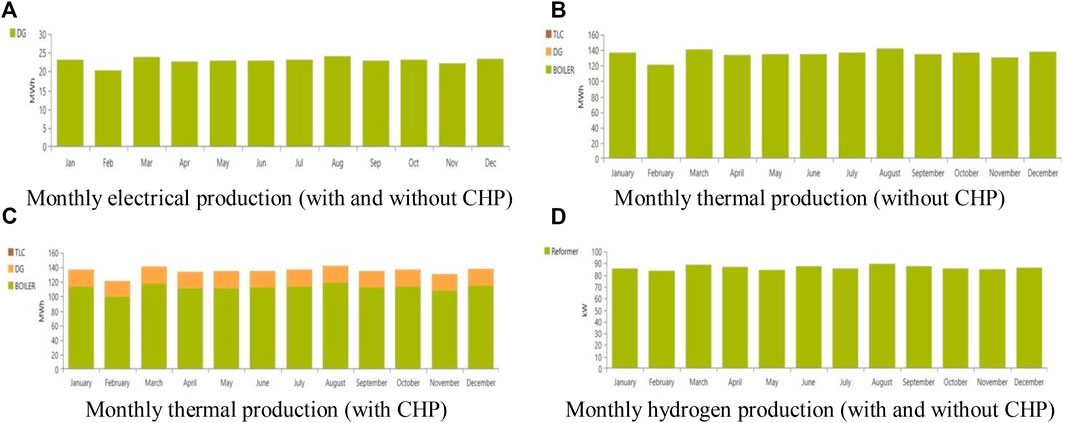
FIGURE 6. Monthly energy productions. (A) Monthly electrical production (with and without CHP). (B) Monthly thermal production (without CHP). (C) Monthly thermal production (with CHP). (D) Monthly hydrogen production (with and without CHP).
6.2 Off-Grid Hydro/Boiler/EL/HT/TLC/SB/PC
Due to the extreme perennial rainfall with the requisite hydraulic heads favored by the topology, the utilization of hydro plants is a viable alternative for electricity generation in the selected hilly stations. The optimal configuration and optimum results of the hydro system obtained from the result of simulation analysis are shown in Supplementary Table S4. The optimized options are designed to satisfy 649.99 and 2,424.25 kWh/day electrical loads, 4,450 kWh/day thermal, and a hydrogen load of 86.35 kg/day. In this system, 100% of energy is contributed by the hydro system, which generates 2,804,938 kWh/yr. Because this system is not connected to the electrical grid, the excess electricity of 1,071,943 kWh generated by it is wasted. This excess power is supplied by the thermal load controller to the thermal load. The electrical load of 274,195 kWh is served by the hydro system, and the remaining energy of 1,385,859 kWh/y is used to produce hydrogen of 31,621 kg/y via the electrolyzer. From Supplementary Table S4, it was evident that this analysis pointed out that the configuration with TLC led to the lowest COE and NPC because the thermal load controls allow surplus energy to satisfy thermal loads, resulting in substantially reduced COE and NPC. Seasonal variations constitute one of the main disadvantages of the hydro system, particularly when energy production is challenged by poor power output during the hot and dry seasons. The results of monthly electricity generated with TLC and without TLC are shown in Figure 7 for a thorough comparison.
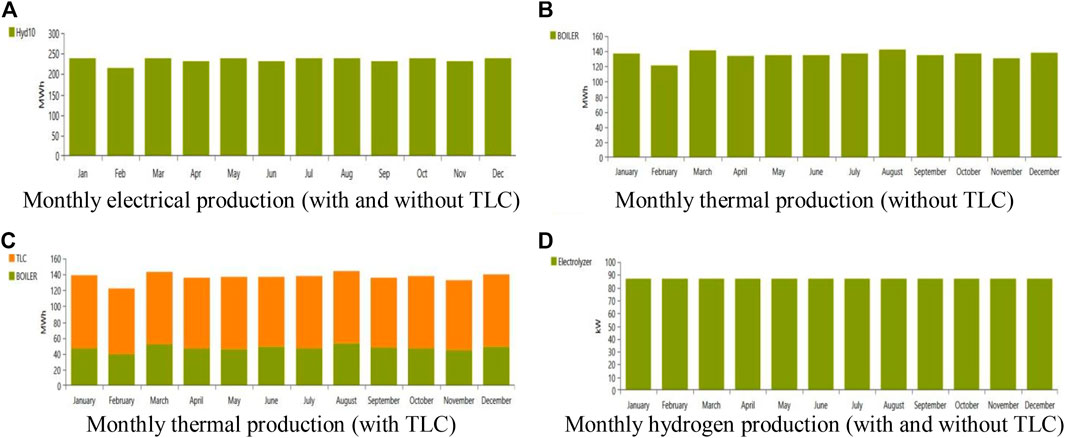
FIGURE 7. Monthly energy productions. (A) Monthly electrical production (with and without TLC). (B) Monthly thermal production (without TLC). (C) Monthly thermal production (with TLC). (D) Monthly hydrogen production (with and without TLC).
6.3 Off-Grid PV/Hydro/Boiler/SB/PC/EL/HT/TLC System
To resolve the cons of the hydro system, a hybrid system has been implemented by integrating photovoltaics with hydro systems. This integrated system ensures reliable power to satisfy the combined energy demand of the tea factory. This system strictly limits boiler contribution by ensuring sufficient surplus energy to meet the thermal load. The results of monthly electricity generated with TLC and without TLC are shown in Figure 8 for a thorough comparison. It implies that when TLC is connected to the system, the output from the PV system is still increasing and has the potential to provide excess electricity. Supplementary Table S5 depicts technical and economic details for PV/Hydro system, which shows that the optimum system solution achieved with TLC is superior to that without TLC. The system with TLC has a LCOE/kWh of $−.423 and net present cost of $1.74 M. In contrast, the system without TLC has a cost of energy of $.222 and net present cost of $4.03 M. According to simulation findings, if TLC interacted with the system, hydro and PV would create 2,804,938 kWh/y and 270,457 kWh/y, respectively, meeting the whole energy requirement, as indicated in the diagram. However, without TLC interaction, the production obtained from PV is only 19,817 kWh/y, much less than with TLC interaction. As addressed in Figure 8, the electricity production by RESs is sufficient to meet the electricity and hydrogen demand, and a substantial amount of thermal load (78.7%) is met by TLC. The boiler meets the remainder of the thermal requirement (21.3%). The results demonstrate that the TLC system outperforms the hybrid PV/hydro in terms of efficiency. The greater contribution of renewable sources is the major cause of this. Because of the lower fuel use due to TLC, there is less pollution generated, which is regarded as a positive factor in the environmental assessment of the system. It is obvious that lower cost and fewer emissions levels are found, which is better than the solution obtained by off-grid hydro-systems. Further examination reveals that the levelized cost of hydrogen for the case with the TLC scenario ($4.25/kg) is less than the scenario without TLC ($9.82/kg).
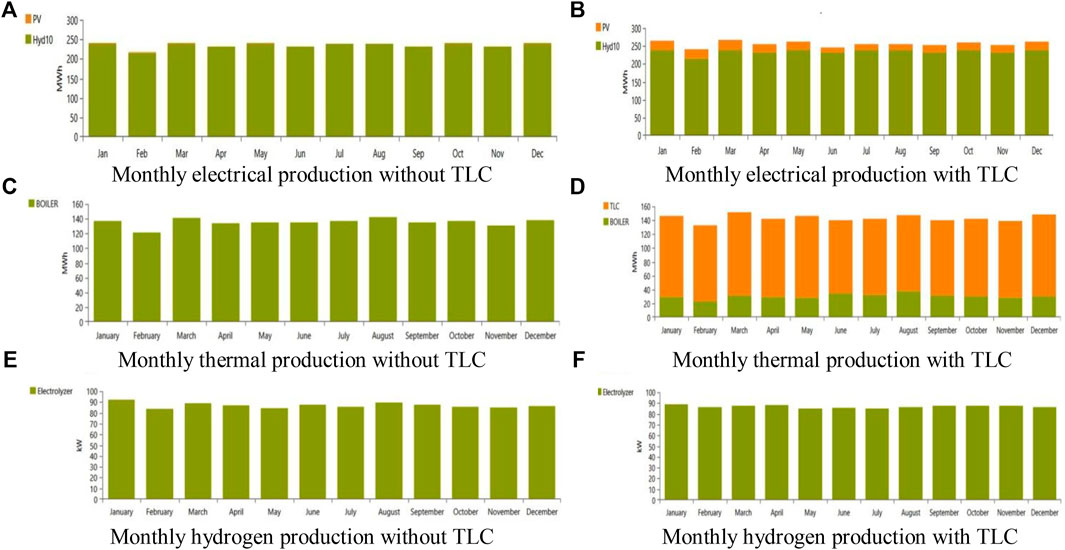
FIGURE 8. Monthly energy productions. (A) Monthly electrical production without TLC. (B) Monthly electrical production with TLC. (C) Monthly thermal production without TLC. (D) Monthly thermal production with TLC. (E) Monthly hydrogen production without TLC. (F) Monthly hydrogen production with TLC.
6.4 Off-Grid Biomass-CHP/Hydro/SB/PC/EL/HT/TLC
Due to the high potential of tea wastages available at tea farms and factories, synchronizing bio energies along with hydro have been introduced. Because there is sufficient biomass and hydro potential, the combination of these sources and the storage system are considered to design, and solar systems are not considered here. The annual electricity generation of biomass-CHP and hydro would be 333,712 and 2,804,938 kWh, respectively. In addition, this optimum system has an energy surplus of 1,401,193 kWh. The overall annual thermal consumption is 1,624,250 kWh, with the TLC accounting for 72.9%, biomass-CHP for 20.3%, and the diesel boiler for the remaining 6.81%. In contrast, the biomass output from the system without TLC is zero, and the hydro production supplies the electric and hydrogen loads, as indicated in Figure 9A. Moreover, it can be seen that the boiler produces the entire required heat to serve the thermal load. The results also reveal that the off-grid biomass/hydro/battery hybrid with considering TLC and CHP system generates more electricity and excess electricity and adequate heat energy compared to with and without TLC. The results of monthly electricity generated with TLC and CHP are shown in Figure 9 for a thorough comparison. The total value of NPC, COE, LCOH and renewable fraction of this combination is listed in Supplementary Table S6. From Supplementary Table S6, for systems with biomass-CHP and TLC, it is evident that the NPC, LCOH/kg, and LCOE/kWh are $1.76 M, $4.29, and −$.417, respectively, which is less than the systems with and without TLC combinations. The CO2 emissions achieved were 511,380 and 100,032 in the case without TLC and with TLC, respectively, while it can be seen that the system with TLC-CHP emits less CO2 (41,414).
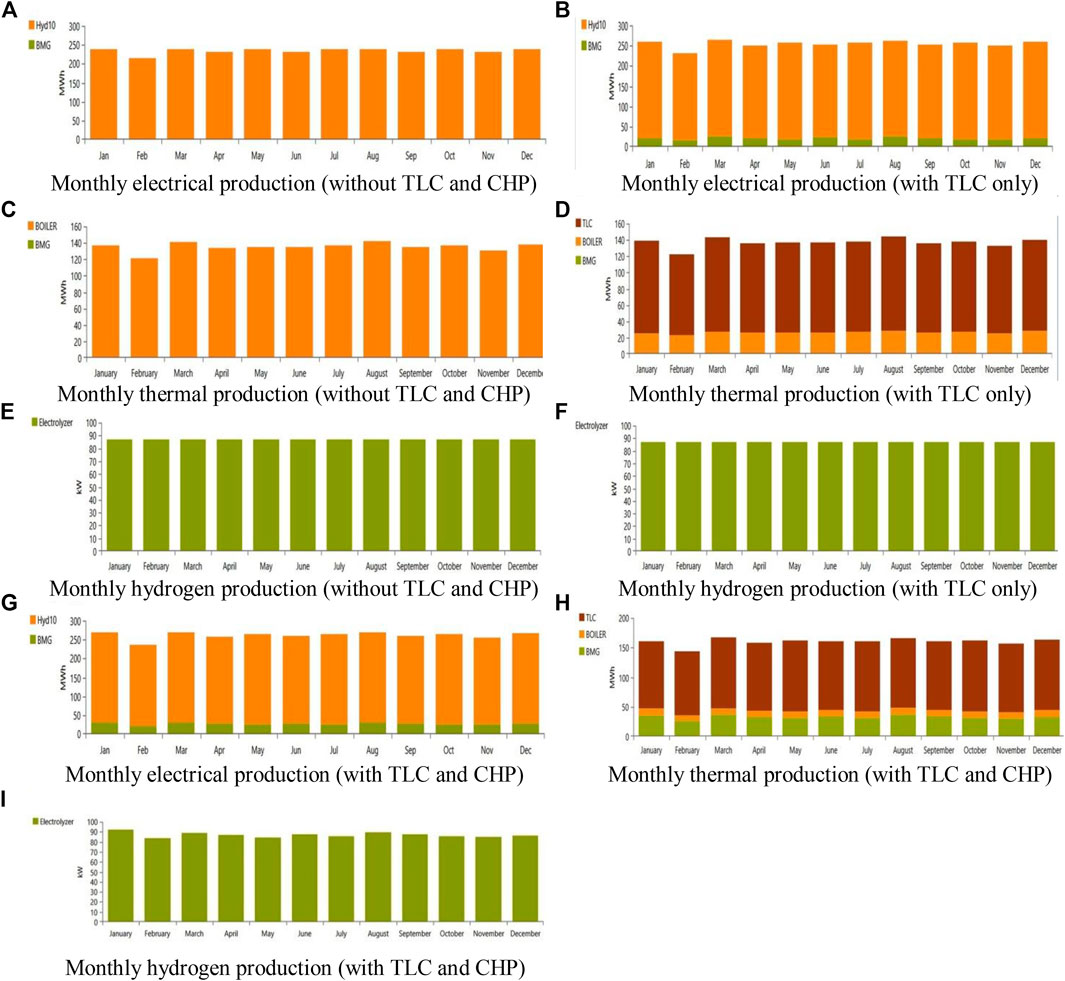
FIGURE 9. Monthly energy productions. (A) Monthly electrical production (without TLC and CHP). (B) Monthly electrical production (with TLC only). (C) Monthly thermal production (without TLC and CHP). (D) Monthly thermal production (with TLC only). (E) Monthly hydrogen production (without TLC and CHP). (F) Monthly hydrogen production (with TLC only). (G) Monthly electrical production (with TLC and CHP). (H) Monthly thermal production (with TLC and CHP). (i) Monthly hydrogen production (with TLC and CHP).
6.5 Off-Grid PV/Biomass-CHP/Hydro/SB/PC/EL/HT/TLC
The hybrid system with the combination of PV/biomass/hydro/electrolyzer/hydrogen tank/TLC-CHP/boiler/electrical storage devices has been designed to satisfy electrical power, heat, and hydrogen demand with a cost-effective goal and fewer pollutants. When compared to the configuration with and without TLC, the required PV capacity is reduced to 10.9 kW. The electricity generation from hydro (2,804,938 kWh/y) is high, followed by biomass generators (325,875 kWh/y) and solar systems (16,265 kWh/y). The NPC of the system with TLC is $1.78 M, which is about 56.5% less than that without TLC. Under the scenario with CHP and TLC, the NPC is relatively low, that is, $1.75 M, which would be a 1.7% decrease from TLC. In general, the COE is highest in the system without TLC, while in the system with TLC, it is the least. By contrast, it is even lower in the scenario with TLC and CHP. The renewable energy share is up to 93.1% with CHP-TLC, while with TLC and without TLC, it is 87.6% and 14.4%, respectively. Furthermore, TLC and CHP contribute significantly to the needed thermal. Consequently, the boiler contributes less due to adequate excess energy from the system and heat supply from biomass-CHP. The results of monthly electricity generated without TLC and CHP, with TLC, and considering both the TLC and the CHP options are shown in Figure 10 for a thorough comparison. Supplementary Table S7 depicts optimized technical details and the effect of the TLC and CHP on economic parameters.
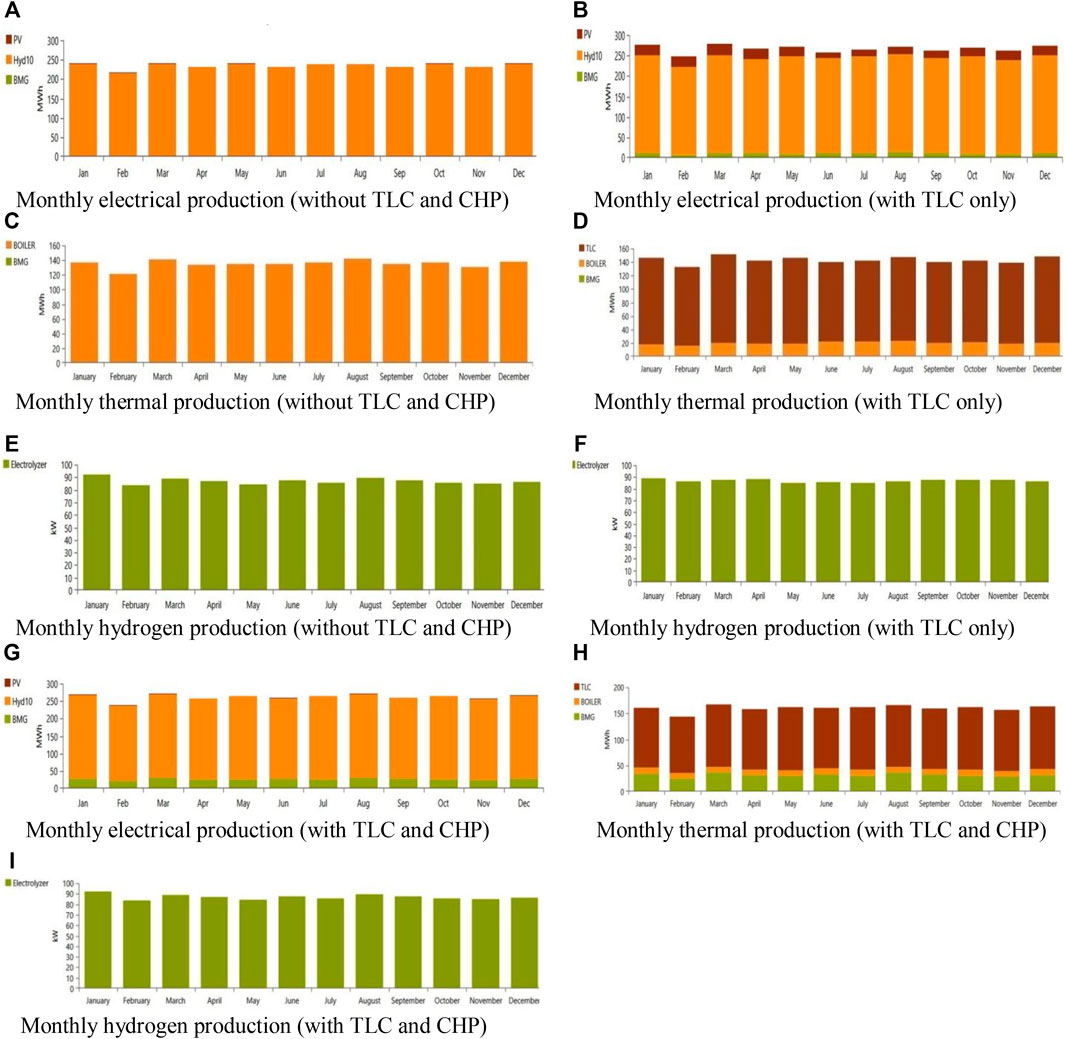
FIGURE 10. Monthly energy productions. (A) Monthly electrical production (without TLC and CHP). (B) Monthly electrical production (with TLC only). (C) Monthly thermal production (without TLC and CHP). (D) Monthly thermal production (with TLC only). (E) Monthly hydrogen production (without TLC and CHP). (F) Monthly hydrogen production (with TLC only). (G) Monthly electrical production (with TLC and CHP). (H) Monthly thermal production (with TLC and CHP). (I) Monthly hydrogen production (with TLC and CHP).
6.6 Grid/Diesel Generator/Boiler
Electrical power is provided by the Tamil Nadu electricity board to many tea companies in Nilgiris, India, while thermal energy is provided using fuelwood and diesel fuel. As the selected location is a hilly station, rainfall will occur throughout the year frequently. Most towns are severely affected by blackouts due to incessant rain, especially during the southwest monsoon. A diesel generator with a rating of 55 kW was selected to meet the electrical demand to fully replace the grid in case of a blackout or during maintenance. Figures 11A,B illustrate that total electrical energy of 274,195 kWh/year and thermal energy of 1,624,250 kWh/year was purchased from the grid and boiler, respectively. The contribution of diesel generator sources was not available. The obtained energy performance shows that the grid and DG contributed 100% and 0% of electrical energy, respectively. As a result, there is no recovery of waste heat from the generator and, thus, the boiler contributes 100% to thermal load demand. On the contrary, the reformer fulfills the required hydrogen to meet the hydrogen load. Because this system is connected to the grid without any integration of renewable sources, there is no availability of excess electricity to be sold to the grid. The total electrical energy of 274,195 kWh/year and thermal energy of 1,624,250 kWh/year were purchased from the grid and boiler, respectively. The contribution of diesel generator sources was not available. The NPC and LCOE/kWh for this scenario are $6.20 M and $.835, respectively. This system emits 1,004,932 kg of CO2 per year. Steam reforming of diesel fuel is considered to be the hydrogen generation technique in this case. The diesel fuel cost for hydrogen generation is calculated to be $2,594,352. In this case, the amount of hydrogen generated at the hydrogen refueling station is 31,504 kg/year, and the value of LCOH is $12.8/kg. The cost of hydrogen generation is strongly determined by Eq. 24. Because this system is composed without any renewable sources, there is a non-availability of excess electricity to sell to the grid. Hence, the term Eexcess becomes zero. The annual net energy purchased from the grid is 274,195 kWh. Figures 11D,E, respectively, show the grid electricity transactions and energy charges throughout the year. The value of the energy and demand charges are $24,301.92 and $2,993.43, respectively. Supplementary Table S8 depicts optimized technical details and economic results.
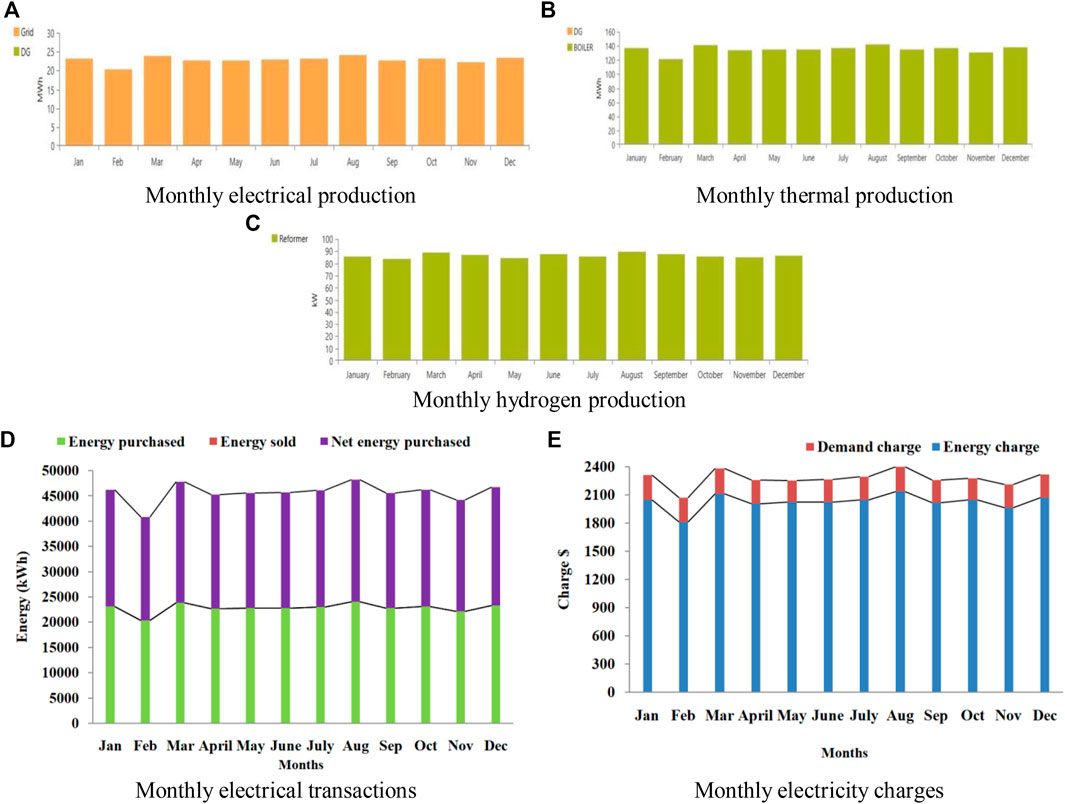
FIGURE 11. Monthly energy productions, transactions, and charges. (A) Monthly electrical production. (B) Monthly thermal production. (C) Monthly hydrogen production. (D) Monthly electrical transactions. (E) Monthly electricity charges.
6.7 Grid/Hydro/Boiler/TLC/EL/HT/SB/PC/TLC
To power the electrical, thermal, and hydrogen load, the energy generated by the grid/hydro/boiler is used. The optimization results of this system are composed of a 377 kW hydro, an electrolyzer of 200, 350 kW TLC, 200 kg of the hydrogen tank, 1 kWh batteries of generic lead acid, and a 158 kW power converter. From Figure 12, it is clear that the grid has not provided any required electrical energy for the load and the hydro system acts as the basic energy resource with a continuous power supply of 2,804,938 kWh/year, which accounts for 100% of system generation. The amount of 274,195 kWh/year is provided for AC load consumption and 1,383,935 kWh/year as input to the electrolyzer that produces 31,577 kg/year of hydrogen to meet the demand for hydrogen load. The amount of 1,073,969 kWh/year of power from the system has been fed into the utility grid, and the excess of electrical production by the system is zero. The boiler heating system consisting of a diesel fuel burner will provide thermal energy of 1,624,250, which meets the entire thermal load. The total input to TLC from the system is zero. Hence, the TLC could not operate to cover the thermal energy demand. The results of the monthly electricity generated are shown in Figure 12 for a thorough comparison. The NPC and LCOE/kWh are $125,003 and −$0.179, respectively. The negative value of the COE means the profit from the sale of electricity to the utility grid. The generation of the grid/hydro/TLC/battery system is the same as the grid/hydro/battery system. However, the NPC and COE of the grid/hydro/TLC/battery system are slightly higher, as shown in Supplementary Table S9, because of the additional cost of TLC. The value of LCOH for the case without TLC is $ −11.7/kg. In contrast, the initial cost and the total annualized cost of the system are considerably higher for the case with TLC, and the LCOH is −$11.6/kg. The negative sign of LCOH indicates immediate revenue from hydrogen generation. The annual net energy purchased from the grid is zero. Hence, demand charges become zero. The value of the annual energy sold to the grid is 1,073,969 kWh, and the annual energy charge is $300,711. Figures 12D,E, respectively, show the grid electricity transactions and energy charges throughout the year.
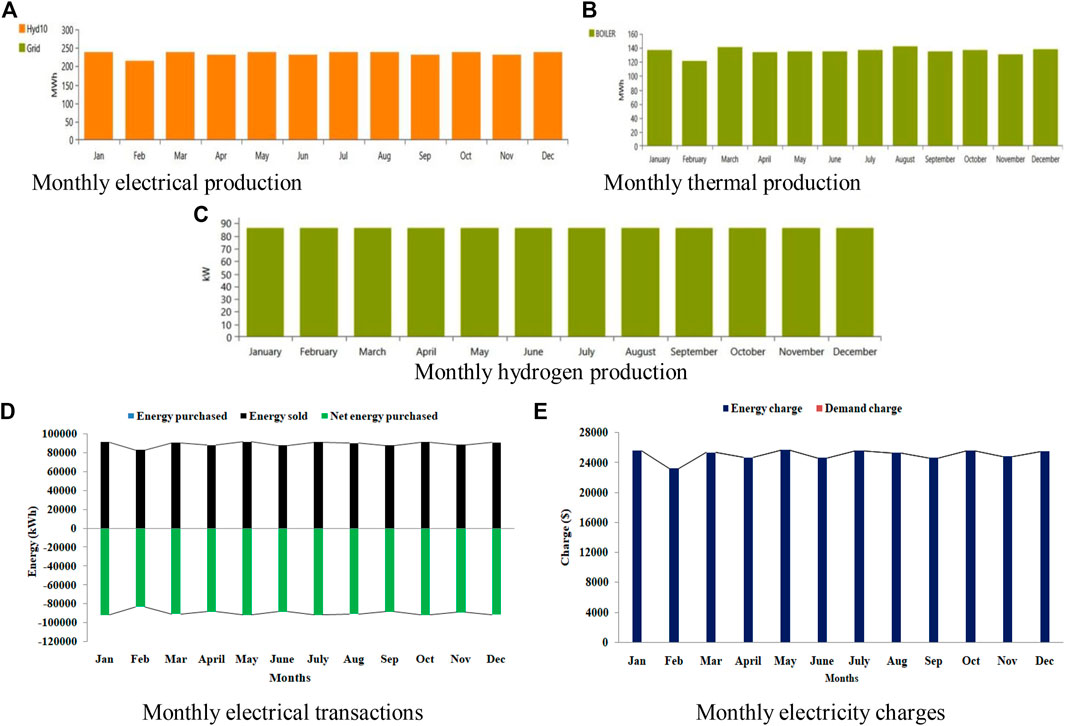
FIGURE 12. Monthly energy productions, transactions, and charges. (A) Monthly electrical production. (B) Monthly thermal production. (C) Monthly hydrogen production. (D) Monthly electrical transactions. (E) Monthly electricity charges.
6.8 Grid/PV/Hydro/Boiler/TLC/EL/HT/SB/PC
The power generated by PV and hydro accounts for 26.6% and 73.4%, respectively, of the system’s total power generation. According to the energy sharing, we can see that 274,195 kWh/year is used to provide the electrical load and the power feed from the hybrid system to the electrolyzer is 1,389,969 kWh/year. On the contrary, 1,973,841 kWh/year of energy is sold out to the power grid. The excess electricity of around 123,781 kWh per year is generated by the system. This excess energy is used to meet the thermal load through TLC. The remaining thermal load demand is provided by the boiler, which acts as a backup source when the TLC fails to serve the full thermal load. The NPC and LCOE/kWh of this system are −$2.46 M and −$.196. From an environmental viewpoint, the renewable energy of this design is 60.9%, which implies that the required electrical and hydrogen energy is obtained from renewable sources. Compared to grid/hydro renewable systems, the value of LCOH/kg can be seen as low as −$25.8 due to more energy sales to the grid. Compared to without TLC, it is obvious that TLC is beneficial for HRES to serve thermal load and also reduces initial capital cost and COE, resulting from the smaller PV size. Nevertheless, due to the lower number of PV, the total amount of energy production decreases, which results in a decrease in the renewable fraction of 60.9%. However, based on serving excess electricity via TLC to the thermal load, the emission of pollutants is much less. The results of monthly electricity generated with TLC and without TLC are shown in Figures 13A–F, for a thorough comparison. From Figures 13G,H, it is clear that grid energy transactions and charges are less by using TLC. Supplementary Table S10 depicts the optimized technical details and effect of the TLC on economic parameters.
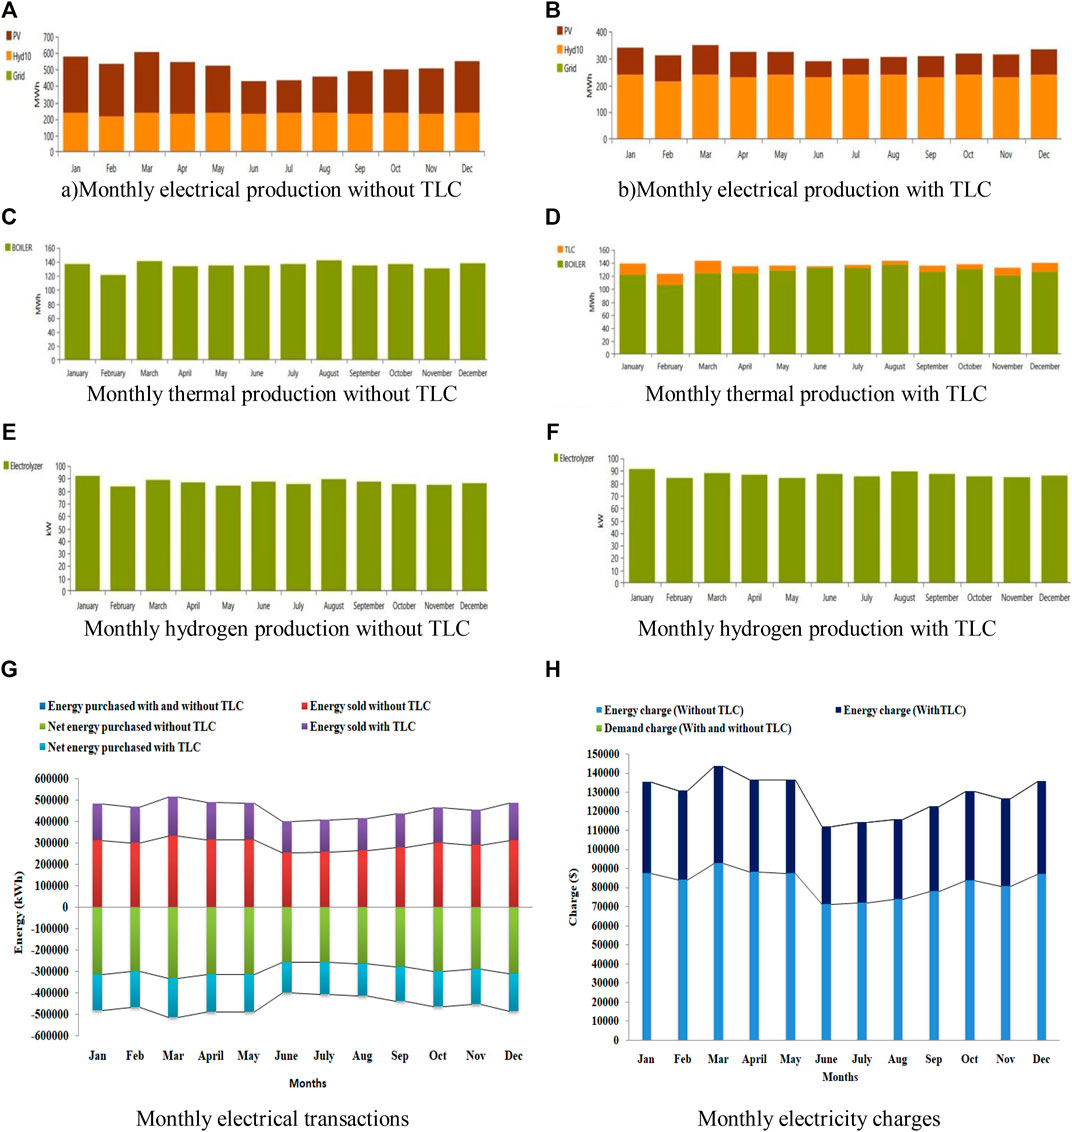
FIGURE 13. Monthly energy productions, transactions, and charges. (A) Monthly electrical production without TLC. (B) Monthly electrical production with TLC. (C) Monthly thermal production without TLC. (D) Monthly thermal production with TLC. (E) Monthly hydrogen production without TLC. (F) Monthly hydrogen production with TLC. (G) Monthly electrical transactions. (H) Monthly electricity charges.
6.9 Grid/BMG-CHP/Hydro/Boiler/TLC/EL/HT/SB/PC
This schematic design is designed for combined electrical, thermal, and hydrogen generation with a unified thermal load controller and heat recovery option. The optimized technical details and effects of the TLC and CHP are indicated in Supplementary Table S11. Moreover, in Figures 14A–D, the energy produced by the system is illustrated too. It is clear that the system’s overall energy supply was 4,118,938 kWh/yr, with BMG accounting for 31.9% and hydro being 68.1%. The system was connected to the grid, which led to the grid sales of 2,385,943 kWh/y and with the not available excess generation of electricity to serve TLC. Hence, TLC did not contribute to serving thermal demand. According to the results, the BMG-CHP generates 85.4% of waste heat to cover the thermal demand. The heat production from biomass-CHP is insufficient to satisfy the entire thermal load. Hence, the boiler compensates for the remaining thermal deficit. Premised on its optimal capacity, the electrolyzer has produced 31,621 units, with a high capacity factor of around 79.1%. By utilizing waste heat from the BMG, economic analysis ultimately led to the LCOE of −$.265/kWh, which is quite less with the highest renewable fraction of 94.2%, a reduction in fossil fuel consumption, and, consequently, CO2 emissions. Moreover, results highlighted that this configuration has the lowest value of LCOH as −$38/kg. Figures 14E,F illustrate the electrical transaction and energy charges, respectively, for three cases (without LLC, with TLC, and with TLC at 50% CHP). All three cases have the same energy transactions and energy charges. The value of the annual energy sold to the grid is 2,385,943 kWh, and the annual energy charge is $668,064.14.
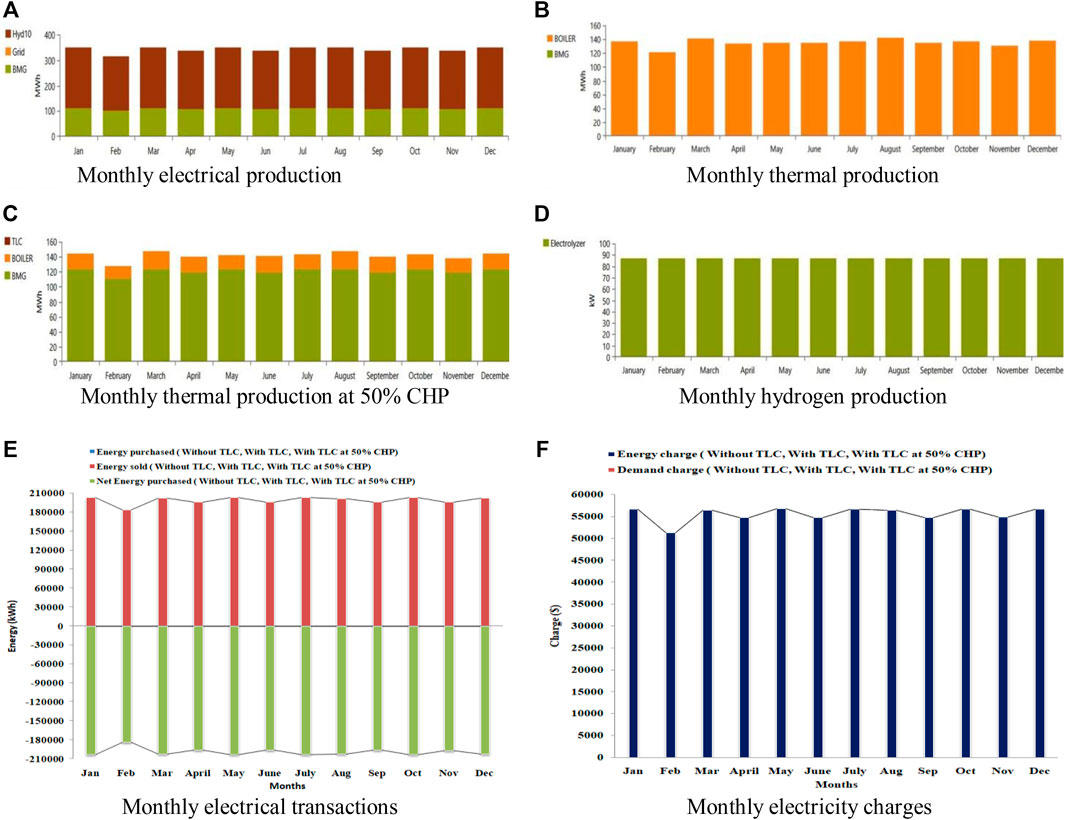
FIGURE 14. Monthly energy productions, transactions, and charges. (A) Monthly electrical production. (B) Monthly thermal production. (C) Monthly thermal production at 50% CHP. (D) Monthly hydrogen production. (E) Monthly electrical transactions. (F) Monthly electricity charges.
6.10 Grid/PV/BMG-CHP/Hydro/Boiler/TLC/EL/HT/SB/PC
This on-grid hybrid system, which combines solar, biomass, and hydro power, has numerous benefits over other on-grid systems. In this section, the PV/biomass/hydro system is analyzed to satisfy all demands for applying a tea factory to examine the effects of utilizing EE via TLC and recovering waste heat. Figures 15A–I show the amount of energy from renewable sources serving the electric, thermal, and hydrogen needs of the tea factory. According to Figure 15B, if TLC is connected to the system, more power is generated from hydro power than the power sources from solar and biomass power. In order to maximize power sales to the grid, the on-grid HES system architecture constantly focuses on maximizing the usage of renewable output power. The LCOE can reach as little as −.240 $/kWh (considering both CHP and TLC) with a renewable fraction of 96%. In contrast, without CHP, it can have an electricity rate of −.195 $/kWh. The hybrid system that includes both the thermal load controller (uses surplus energy) and the heat recovery option showed that the cost of energy is lower than that of the system in that the thermal load controller only allows extra energy to be used. In this section of the analysis, without adding the heat recovery option to the system, the maximum thermal demand was satisfied by the diesel boiler (92.4%), and the TLC satisfied the remaining one (7.56%). With the unification of the heat recovery option and TLC, The recovery of waste heat generation from BMG prime mover has been shown to fulfill a significant percentage (83.9%) of the thermal load, whereas the TLC and the boiler contributed 13.8% and 2.27%, respectively. As displayed in Supplementary Table S12, refueling stations can create sustainable hydrogen fuel at $−64.5/kg (with TLC at 50% CHP). As more energy is sold back to the grid, more revenues are obtained from the hybrid system units. In this system, CO2 emissions are much lower when considering both TLC and heat recovery choices (75,952). In contrast, with only the TLC option, it is very high (477,336). Figures 15J,K, respectively, display grid electricity transactions and energy charges during the whole year. It should also be noted that while considering TLC alone, the rate of energy sold to the grid is lower. Also, it should be noted that the system with TLC and 50% CHP yields more revenue by selling more energy to the grid than the system with TLC alone.
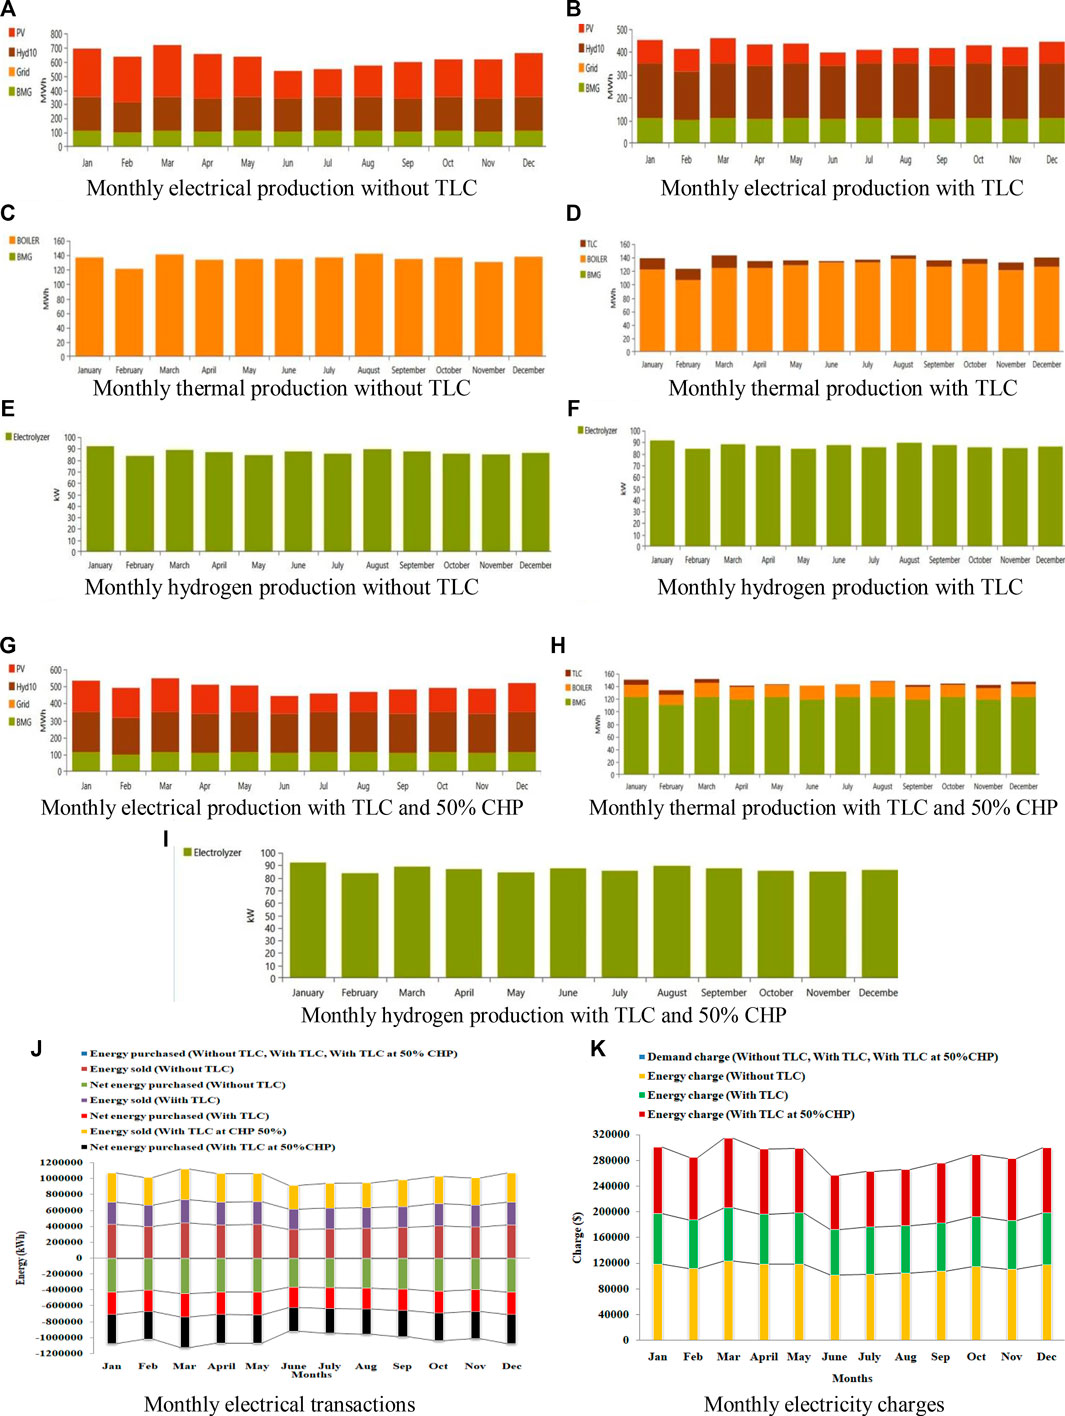
FIGURE 15. Monthly energy productions, transactions, and charges. (A) Monthly electrical production without TLC. (B) Monthly electrical production with TLC. (C) Monthly thermal production without TLC. (D) Monthly thermal production with TLC. (E) Monthly hydrogen production without TLC. (F) Monthly hydrogen production with TLC. (G) Monthly electrical production with TLC and 50% CHP. (H) Monthly thermal production with TLC and 50% CHP. (i) Monthly hydrogen production with TLC and 50% CHP. (J) Monthly electrical transactions. (K) Monthly electricity charges.
6.11 Discussions on Off-Grid Systems
• In a diesel generator/boiler/reformer system, all the components operate at their maximum hours of 8,760 h/year, which means they consume maximum fuel. Furthermore, it is obvious that this system has the highest COE, as the fuel and maintenance costs have risen much higher than those of other configurations studied. Hence, it is recommended that this system is not economical to operate as it exhibits high NPC and is highly harmful to the environs, as it exhibits the highest quantity of CO2. This case did not consider any renewable sources of power and hence did not provide an option for utilizing storage devices.
• The hydro station generates higher output than the required power, which feeds the load demand and allows the battery to charge 100%. Finally, the LF strategy feeds the 38.2% excess energy to the thermal load. From the point of economical view, the capital cost of the hydro system contributes around 86% of the overall system capital cost. The total fuel cost accounts for approximately 60% of the system’s total net present cost. Thus, when compared with the DG/boiler/reformer system, the NPC and COE are significantly lower (resp., a decrease of 72% and 65%). In contrast to the system with the diesel generator/reformer/boiler, this system is friendly to the environment by having a minimum CO2 emission contribution. The renewable contribution of 69.9%, on the contrary, is a good choice for creating an autonomous energy system utilizing only hydro, and it is one of the most sustainable possibilities. It is worth noting that the continuous use of traditional diesel generators can be a sustainable alternative by developing similar types of hydro power plants. As a result, in such rural steep terrain with rich hydro resources, the small-scale industry can thrive. Conventionally, a drastic energy deficit from micro hydros happens in the dry months of the year, and to fix this seasonal shortfall globally, an alternative hybrid renewable system appears to be an effective option.
• A hydro system combined with a PV system is modeled as an alternate combination to meet the load requirement. Although the hydro/battery system has a cheaper initial capital cost than this one, it has greater operating and maintenance costs and higher fuel consumption. According to simulation data, hydro has a large contribution of 91%, followed by solar with 9% as the least contribution out of a total of 100%. The overall system’s electrical energy output is 10% higher than that of the hydro/battery system. When it comes to environmental concerns, this design is shown to be more suited than a hydro system alone because it reduces fuel usage by 36%, which results in lowering CO2 emissions and increasing the renewable fraction by 15%.
• The capital cost for installing the biomass system ($82,500) in the developed biomass/hydro integrated renewable energy system is the lowest compared to the capital cost of PV ($196,733) in the PV/hydro scenario. However, the cost required for replacement and O&M costs for biomass seems to be higher than required for PV systems. As a result, the entire cost of biomass/hydro increases significantly, making it economically unfeasible. It was evident from the analysis that the minimum LCOE/kWh was obtained for PV/hydro as $−.423 and the maximum LCOE/kWh of $−.417 for the biomass/hydro system. However, the fuel cost is considerably decreased by incorporating biomass, resulting in the biomass/hydro system being environmentally feasible. In both systems, the total energy generated by the hydro system is constant, whereas the potential of the energy assessment indicates that energy generated from biomass resources is 333,712 kWh/year while that from PV is 270,457 kWh/year. This means that more excess electricity has been available from biomass/hydro systems, which reduces the amount of fuel consumed by the boiler, and more renewable fraction is added to the system.
• Due to the inclusion of a PV system along with the other two renewable sources (biomass and hydro), the operating hours of the biomass generator here are much lower than in the biomass/hydro system. Operating the biomass generator for fewer hours (3,950) per year reduces the replacement and O&M costs while increasing salvage costs. However, the total NPC of this system is slightly higher (.6%) than the PV/hydro system and lesser (0.5%) than the biomass/hydro system. This combination generates total power of 3,147,078 kWh/year, which is 2.3% and .3% more than PV/hydro and biomass/hydro systems, respectively. The amount of energy fed to the thermal load by the biomass generator is 7% less than the biomass/hydro system. Hence, it slightly increases the boiler running hours, diesel consumption, and emissions.
• When compared to a diesel-only integrated system, all off-grid renewable power systems have the potential to lower energy costs to a range of −$.370 to −$.423/kWh. Furthermore, out of these IRE models, the value of LCOH was found to be in a range of $4.25 to $4.29/kg. In terms of environmental analysis, the system based on biomass/hydro emits the least amount of CO2 (41,414 kg/y), followed by PV/biomass/hydro (41,980 kg/y). Regarding overall assessment, an optimum selection of scenarios based on economic and environmental analysis, PV/biomass/hydro was found to be the best possible option, as this case was associated with the contribution of TLC and CHP, hence satisfying the electrical and thermal demands simultaneously from BMG. In the event of the failure of any one of the renewable sources, the remaining renewable sources will generate more power to compensate for the demand.
6.12 Discussions on On-Grid Systems
• For the project’s duration, all the required electrical energy is obtained from the grid at the current electricity purchasing rate, and the total grid cost is estimated at $35,861. The total NPC of the system will rise when the price of electricity consumption rises. As the renewable sources are not connected to this system, a total renewable fraction of 0% was obtained.
• From the simulation results of grid/hydro, it has been observed that hydro contributes 100% of the total generation. The obtained LCOE of −$.179/kWh is significantly lower than the cost of power from the state grid, making the grid-connected hydro system more cost-effective than the grid/boiler/reformer one. The total input required for the electrolyzer has been supplied by hydro sources. Hence, the yearly fuel cost and CO2 emissions are reduced by 45% and 49%, respectively, compared to the previous one. It was revealed that the total power generated by the grid is zero, and the system sells 1,073,969 kWh/year of energy to the grid.
• From the optimization results of grid/hydro/solar, it has been revealed that PV contributes 26.6% of the total system. The obtained LCOE of −$.196/kWh is significantly lower than the cost of power from the state grid, also making the grid-connected hydro/solar system more cost-effective than the grid/hydro/solar one. The total input required for the electrolyzer has been supplied by renewable sources. Hence, the yearly fuel cost and CO2 emissions are reduced by 7% compared to the grid/hydro. It was observed that the total power generated (36%) and power sold from the system to the grid (88%) is quite significantly higher than the grid/hydro system due to the solar system.
• The developed grid/BMG/hydro has been found to be economically profitable, which represents an NPC and LCOE/kWh of −$5.89 M and −$.265, respectively. By integrating the CHP option, in this case, 85% of the thermal demand is served by the biomass generator. Hence, the cost of the fuel consumed by the boiler is reduced by 84% compared to grid/hydro/solar, and CO2 emissions are further reduced. The system has produced zero excess electricity, and the energy sold has been revealed to be very high (21%) compared to grid/hydro/solar.
• When compared with all previous contributions, the contributions of grid/solar/BMG/hydro have been found to be more economically profitable, which represents an NPC of −$10.5 M, though the LCOE/kWh (−$.240) of these configurations are slightly higher than grid/BMG/hydro. This system generates the most total energy when compared to other on-grid scenarios and has a maximum renewable fraction of 96%. By integrating the CHP and TLC option, in this case, 86% of the thermal demand is served by renewable sources. Hence, the cost of the fuel consumed by the boiler is reduced by 3.4% compared to grid/hydro/BMG, and CO2 emissions are further reduced. The system has produced zero excess electricity, and the energy sold has been revealed to be very high (73%) compared to grid/hydro/BMG. Based on the economic and environmental factors, this configuration has been recommended to be the first priority, followed by grid/hydro/BMG as the next priority.
The PV system is affected by weather conditions, clouds, and time of day, all of which have a negative impact on system dependability and power output to satisfy the needs of load demand. As water potential is abundant to install hydro plants and sufficient industrial and agricultural wastes are available to install biomass power plants, the share of these plants is essential as a part of designing a hybrid system. Both stand-alone and grid-dependent systems have advantages and are technically and economically viable, according to the simulation results. The resulting LCOE is significantly lower than the energy cost from the national grid and traditional diesel-powered systems. The combined impact of TLC and CHP has the additional benefit of assisting in the reduction of CO2 emissions. It has been revealed that the potential of available renewable energy in the selected location can supply all of the electricity and hydrogen demand, as well as the majority of the thermal load, at a far lower cost. When compared to on-grid systems, the stand-alone related system utilizes all available excess electricity to meet thermal load and thereby contributes to CO2 emission reduction. A grid-connected hybrid energy system, on the contrary, is used to purchase power from the grid and sell power back to the grid when the hybrid system generates extra electricity. From the simulation results, it is important to remember that, by selling the excess energy to the grid, on-grid systems make a significant amount of revenue, which is feasible in terms of electric power generation and finance. However, renewable system component costs are quite high, demanding a decrease in component manufacturing costs to design efficient, cost-effective systems. In this regard, appropriate financial support such as subsidies on renewable energy goods from the central and state government will encourage the use of IRES in hilly areas.
7 Conclusion
Many challenges have compelled researchers and scientists all around the globe to develop and evaluate sustainable methods of fulfilling energy demand. The study aims to simulate various hybrid systems to precisely assess and determine the optimum systems among hybrid power generating systems connected to the grid and independent of the grid.
The following are the major conclusions of the simulation:
• Two of the five off-grid model system scenarios can be optimal to reconcile the energy demand at a significant expense. The PV/biomass-CHP/Hydro/SB/PC/EL/HT/TLC system is the best alternative by comparing it with other off-grid systems, which is more dependable and cost-effective.
• Next to the aforementioned systems, the best optimal system is the off-grid-based biomass-CHP/hydro/SB/PC/EL/HT/TLC.
• However, excess energy shows the possibility of reducing costs via the economy of scale, which is a more realistic alternative. If the off-grid systems had access to a grid system to deliver excess power with fixed expenses and to gain a return, then it would be more beneficial.
• In both on- and off-grid systems, the TLC and CHP options play a significant role in providing the necessary heat to thermal load.
• In the on-grid system, the negative sign of NPC indicates that revenue exceeds the cost by vending more electricity to the grid.
• In the on-grid system, the negative sign of COE suggests that generating electricity out of a renewable system actually yields money.
• Adding TLC and CHP decreases the total fuel consumption of the boiler and CO2 emissions.
• Compared with stand-alone systems, the hydrogen refueling stations with systems connected to the grid were more affordable.
• The value of LCOH decreases if more electricity is sold to electric utilities.
• Due to energy sold to the grid and less contribution from TLC, it is found that the CO2 emissions from the grid-connected hybrid system are a little bit more than the off-grid system. However, regarding overall performance, a grid-connected renewable system is more beneficial economically and environmentally.
• The grid-connected PV/biomass-CHP/hydro/SB/PC/EL/HT/TLC system accomplished a significant reduction in COE, LCOH, and NPC, settling at −$.240/kWh, −$64.5/kg and −$10.5 M, respectively, with the highest renewable fraction of 96%. It is observed from the analysis that the energy sold from this system to the grid is more than that compared to grid-connected biomass-CHP/hydro/SB/PC/EL/HT/TLC.
• The analysis and comparison of several configurations revealed that the grid-connected system combining three resources of solar, biomass, and hydro energy is the most cost-competitive, with the lowest NPC, LCOE, and LCOH values.
The conclusion is that the grid-connected system is more cost-effective and efficient than the off-grid hybrid systems. The unique benefit of this study is that it shows the techno-economic and environmental consequences of utilizing grid-connected and stand-alone hybrid systems based on their level of amalgamation, allowing the investor to select the best design for his plant.
Data Availability Statement
The original contributions presented in the study are included in the article/Supplementary Material, further inquiries can be directed to the corresponding author.
Author Contributions
MT contributed to the conception and design of the analysis. All authors contributed to manuscript revision and read and approved the submitted version.
Conflict of Interest
The authors declare that the research was conducted in the absence of any commercial or financial relationships that could be construed as a potential conflict of interest.
Publisher’s Note
All claims expressed in this article are solely those of the authors and do not necessarily represent those of their affiliated organizations, or those of the publisher, the editors, and the reviewers. Any product that may be evaluated in this article, or claim that may be made by its manufacturer, is not guaranteed or endorsed by the publisher.
Supplementary Material
The Supplementary Material for this article can be found online at: https://www.frontiersin.org/articles/10.3389/fenrg.2022.806870/full#supplementary-material
Abbreviations
BMG, biomass generator; CC, cycle charging; CHP, combined heat and power; DG, diesel generator; EL, electrolyzer; LCOE, levelized cost of electricity; LCOH, levelized cost of hydrogen; LF, load following; NPC, net present cost; PC, power converter; PV, solar photovoltaic; RF, renewable fraction; SB, storage batteries; TLC, thermal load controller; WT, wind turbine.
References
Akhtari, M. R., and Baneshi, M. (2019). Techno-economic Assessment and Optimization of a Hybrid Renewable Co-supply of Electricity, Heat and Hydrogen System to Enhance Performance by Recovering Excess Electricity for a Large Energy Consumer. Energ. Convers. Manag. 188, 131–141. doi:10.1016/j.enconman.2019.03.067
Anand Baredar, P. (2016). Techno-economic Assessment of a Solar PV, Fuel Cell, and Biomass Gasifier Hybrid Energy System, Energy Reports, ISSN 2352-4847, 2. Amsterdam: Elsevier, 254–260.
Ani Vincent, A. (2021). Strategies for Modeling and Simulation of Alternative Energy Systems for Powering Health Facilities Using HOMER Application, [Online]. Glob. J. Res. Eng. 30 Dec. 2021.
Ayodele, T. R., Mosetlhe, T. C., Yusuff, A. A., and Ntombela, M. (2021). Optimal Design of Wind-Powered Hydrogen Refuelling Station for Some Selected Cities of South Africa. Int. J. Hydrogen Energ. 46 (49), 24919–24930. doi:10.1016/j.ijhydene.2021.05.059
Aziz, A. S., Tajuddin, M. F. N., Adzman, M. R., Azmi, A., and Ramli, M. A. M. (2019). Optimization and Sensitivity Analysis of Standalone Hybrid Energy Systems for Rural Electrification: A Case Study of Iraq. Renew. Energ. 138, 775–792. doi:10.1016/j.renene.2019.02.004
Aziz, A., Tajuddin, M., Adzman, M., Ramli, M., and Mekhilef, S. (2019). Energy Management and Optimization of a PV/Diesel/Battery Hybrid Energy System Using a Combined Dispatch Strategy. Sustainability 11, 683. doi:10.3390/su11030683
Baruah, B. P., Khare, P., and Rao, P. G. (2012). The Energy Utilization Pattern in tea Industries of NE India and Environmental Issues. Two and a Bud 59 (2), 9–13.
Bhattacharjee, S., and Dey, A. (2014). Techno-economic Performance Evaluation of Grid Integrated PV-Biomass Hybrid Power Generation for rice Mill. Sustainable Energ. Tech. Assessments 7, 6–16. doi:10.1016/j.seta.2014.02.005
Dams And Reservoirs (2021). Dams and Reservoirs in Tamil Nadu. Available at: https://en.wikipedia.org/wiki/List of dams and reservoirs.
Deb, S., and Jolvis Pou, K. R. (2016). A Review of Withering in the Processing of Black Tea. J. Biosyst. Eng. 41, 365–372. doi:10.5307/JBE.2016.41.4.365
Deevela, N. R., Singh, B., and Kandpal, T. C. (2018). “Load Profile of Telecom Towers and Potential Renewable Energy Power Supply Configurations,” in IEEE International Conference on Power Electronics, Drives and Energy Systems (PEDES), Power Electronics, Drives and Energy Systems (PEDES) (IEEE), 1–6. doi:10.1109/PEDES.2018.8707484
Deevela, N. R., Singh, B., and Kandpal, T. C. (2021). Techno-economics of Solar PV Array-Based Hybrid Systems for Powering Telecom Towers. Environ. Dev. Sustain. 23, 17003–17029. doi:10.1007/s10668-021-01379-z
Derc (2014). Annual Report 2013–2014. New Delhi, India: Delhi Electricity Regulatory Commission, Government of National Capital Territory. Available at: www.derc.gov.in.
Elsaraf, H., Jamil, M., and Pandey, B. (2021). Techno-Economic Design of a Combined Heat and Power Microgrid for a Remote Community in Newfoundland Canada. IEEE Access 9, 91548–91563. doi:10.1109/access.2021.3091738
Fernando, W., Gupta, N., Linn, H. H., and Ozveren, C. S. (2018). “Design of Optimum Configuration of a Hybrid Power System for Abertay University Campus,” in IEEE Conference of Russian Young Researchers in Electrical and Electronic Engineering (EIConRus) (IEEE), 1795–1800.
Githinji, K. S., and Daniel, M. G. (2019). Impact of Fuelwood Consumption by Three Tea Factories on Environment and On-Farm Tree Production in Kangema Sub-county, Muranga County, Kenya. Int. J. Sci. Res. (Ijsr) 8, 1058–1062. Available at: https://www.ijsr.net/search_index_results_paperid.php?id=7061901.
Gökçek, M., and Kale, C. (2018). Optimal Design of a Hydrogen Refuelling Station (HRFS) Powered by Hybrid Power System. Energ. Convers. Manag. 161, 215–2244.
Gökçek, M., and Kale, C. (2018). Techno-economical Evaluation of a Hydrogen Refuelling Station Powered by Wind-PV Hybrid Power System: A Case Study for İzmir-Çeşme. Int. J. Hydrogen Energ. 43 (23), 10615–10625. doi:10.1016/j.ijhydene.2018.01.082
Gunathilaka, R. P. D., and Tularam, G. A. (2016). The Tea Industry and a Review of its Price Modelling in Major Tea Producing Countries. Jms 7. doi:10.5430/jms.v7n1p21
Homer Pro (2021). Hydrogen Tank Autonomy. Available at: https://www.homerenergy.com/products/pro/docs/latest/hydrogen_tank_autonomy.html.
Identified Future Hydro Projects (2021)Identified Future Hydro Projects in Tamil Nadu. Available at: https://shp.gov.in/documents/Tamilnadu identified future projects.pdf.
Indcoserve (2021). Indco tea Factories. Available at: https://www.indcoserve.com/indco-tea-factories (Accessed on June 29th, 2021).
Isa, N. M., Das, H. S., Tan, C. W., Yatim, A. H. M., and Lau, K. Y. (2016). A Techno-Economic Assessment of a Combined Heat and Power Photovoltaic/fuel Cell/battery Energy System in Malaysia Hospital. Energy 112, 75–90. doi:10.1016/j.energy.2016.06.056
Islam, M. S. (2018). A Techno-Economic Feasibility Analysis of Hybrid Renewable Energy Supply Options for a Grid-Connected Large Office Building in southeastern Part of France. Sust. Cities Soc. 38, 492–508. doi:10.1016/j.scs.2018.01.022
Ji, L., Liang, X., Xie, Y., Huang, G., and Wang, B. (2021). Optimal Design and Sensitivity Analysis of the Stand-Alone Hybrid Energy System with PV and Biomass-CHP for Remote Villages. Energy 225, 120323. doi:10.1016/j.energy.2021.120323
Kumar, K. R., Dashora, K., Krishnan, N., Sanyal, S., Chandra, H., Dharmaraja, S., et al. (2021). Feasibility assessment of renewable energy resources for tea plantation and industry in India - A review. Renew. Sustain. Ener. Rev. 145. doi:10.1016/j.rser.2021.111083
Kumar, S. (2009).Energy Audit in Tea Industry: a Case Study for Makaibari Tea Estate. J. Inst. Eng. 9090, 7–12.
Kumar, S., and Pou, K. R. J. (2016). Assessment of Bio-Energy Potential in tea Industries of India. Ajard 6 (5), 83–89. doi:10.18488/journal.1005/2016.6.5/1005.5.83.89
Lesson (2021). Sorting and Grding of tea. Available at: https://teaworld.kkhsou.in/page-details.php?name=Sorting-and-Grading-of-Tea (Accessed on June 29th, 2021).
Li, J., Liu, P., and Li, Z. (2020). Optimal Design and Techno-Economic Analysis of a Solar-Wind-Biomass Off-Grid Hybrid Power System for Remote Rural Electrification: A Case Study of West China. Energy, 208. doi:10.1016/j.energy.2020.118387
Luta, D. N., and Raji, A. K. (2018). Decision-making between a Grid Extension and a Rural Renewable Off-Grid System with Hydrogen Generation. Int. J. Hydrogen Energ. 43 (20), 9535–9548. doi:10.1016/j.ijhydene.2018.04.032
Mahalakshmi, M., and Latha, S. (2015). An Economic and Environmental Analysis of Biomass-Solar Hybrid System for the Textile Industry in India. Turk J. Elec Eng. Comp. Sci. 23 (6), 1735–1747. doi:10.3906/elk-1404-228
Maisanam, A. K. S., Podder, B., Biswas, A., and Sharma, K. K. (2019). Site-specific Tailoring of an Optimal Design of Renewable Energy System for Remote Water Supply Station in Silchar, India. Sust. Energ. Tech. Assessments 36, 100558. doi:10.1016/j.seta.2019.100558
Makhija, S. P., and Dubey, S. P. (2019). Feasibility Analysis of Biomass-Based Grid-Integrated and Stand-Alone Hybrid Energy Systems for a Cement Plant in India. Environ. Dev. Sustain. 21 (2), 861–878. doi:10.1007/s10668-017-0064-0
Minutillo, M., Perna, A., Forcina, A., Di Micco, S., and Jannelli, E. (2021). Analyzing the Levelized Cost of Hydrogen in Refueling Stations with On-Site Hydrogen Production via Water Electrolysis in the Italian Scenario. Int. J. Hydrogen Energ. 46 (26), 13667–13677. doi:10.1016/j.ijhydene.2020.11.110
Nacer, T., Hamidat, A., and Nadjemi, O. (2014). Feasibility Study and Electric Power Flow of Grid Connected Photovoltaic Dairy Farm in Mitidja (Algeria). Energ. Proced. 50, 581–588. doi:10.1016/j.egypro.2014.06.071
Nacer, T., Hamidat, A., and Nadjemi, O. (2015). Techno-economic Impacts Analysis of a Hybrid Grid Connected Energy System Applied for a Cattle Farm. Energ. Proced. 75, 963–968. doi:10.1016/j.egypro.2015.07.292
Nagaraja, M., Sundaresan, R., Natarajan, R., Srinivas, T., and Srinivas, T. (2013). Energy and Byproducts Recovery from Tea Waste. Ijoee 1, 49–54. doi:10.12720/ijoee.1.1.49-54
Ndtv (2021). Diesel price in Nilgiris. Available at: https://www.ndtv.com/fuel-prices/diesel-price-in-nilgiris-city (Accessed on July 22nd, 2021).
Nesamalar, J. J. D., Suruthi, S., Raja, S. C., and Tamilarasu, K. (2021). Techno-economic Analysis of Both On-Grid and Off-Grid Hybrid Energy System with Sensitivity Analysis for an Educational Institution. Energ. Convers. Manag. 239, 114188. doi:10.1016/j.enconman.2021.114188
Nigussie, T., Bogale, W., Bogale, W., Bekele, F., and Dribssa, E. (2017). Feasibility Study for Power Generation Using off- Grid Energy System from Micro Hydro-PV-Diesel Generator-Battery for Rural Area of Ethiopia: The Case of Melkey Hera Village, Western Ethiopia. AIMS Energy 5 (4), 667–690. doi:10.3934/energy.2017.4.667
Njoku, C., Onojo, J., Chukwuchekwa, N., and Okafor, K. (2018). Design and Simulation of a Hybrid Biomass-Solar Renewable Energy System for Rural Dwellers in Nigeria. 4. 368–378.
Odou, O. D. T., Bhandari, R., and Adamou, R. (2020). Hybrid Off-Grid Renewable Power System for Sustainable Rural Electrification in Benin. Renew. Energ. 145, 1266–1279. doi:10.1016/j.renene.2019.06.032
Pahlavan, S., Jahangiri, M., Alidadi Shamsabadi, A., and Rahimi Ariae, A. (2019). Assessment of PV-Based CHP System: The Effect of Heat Recovery Factor and Fuel Type. J. Energ. Manag. Tech. 3 (1), 40–47.
Pal, P., and Mukherjee, V. (2021). Off-grid Solar Photovoltaic/hydrogen Fuel Cell System for Renewable Energy Generation: An Investigation Based on Techno-Economic Feasibility Assessment for the Application of End-User Load Demand in North-East India. Renew. Sust. Energ. Rev. 149, 111421. doi:10.1016/j.rser.2021.111421
Peláez-Peláez, S., Colmenar-Santos, A., Pérez-Molina, C., Rosales, A.-E., and Rosales-Asensio, E. (2021). Techno-economic Analysis of a Heat and Power Combination System Based on Hybrid Photovoltaic-Fuel Cell Systems Using Hydrogen as an Energy Vector. Energy 224, 120110. doi:10.1016/j.energy.2021.120110
Qiu, T., and Faraji, J. (2021). Techno‐economic Optimization of a Grid‐connected Hybrid Energy System Considering Electric and thermal Load Prediction. Energy Sci Eng 9, 1313–1336. doi:10.1002/ese3.906
Rezk, H., and Dousoky, G. M. (2016). Technical and Economic Analysis of Different Configurations of Stand-Alone Hybrid Renewable Power Systems - A Case Study. Renew. Sust. Energ. Rev. 62, 941–953. doi:10.1016/j.rser.2016.05.023
Roy Mitra, S., and Totan, R. (2016). An Energy Audit in a tea Manufacturing Industry at North Bengal, India. Int. J. Res. Eng. Technol. 5, 83–89.
Saikia, M. (2013). Prospect of Bioenergy Substitution in tea Industries of North East India. Int. J. Mod. Eng. Res. 3, 1272–1278.
Sawle, Y., Gupta, S. C., and Bohre, A. K. (2018). A Novel Methodology for Scrutiny of Autonomous Hybrid Renewable Energy System. Int. J. Energ. Res 42, 570–586. doi:10.1002/er.3841
Sawle, Y., Gupta, S. C., and Bohre, A. K. (2018). Review of Hybrid Renewable Energy Systems with Comparative Analysis of Off-Grid Hybrid System. Renew. Sust. Energ. Rev. 81, 2217–2235. doi:10.1016/j.rser.2017.06.033
Sawle, Y., Gupta, S. C., and Bohre, A. K. (2018). Socio-techno-economic Design of Hybrid Renewable Energy System Using Optimization Techniques. Renew. Energ. 119, 459–472. doi:10.1016/j.renene.2017.11.058
Sawle, Y., Gupta, S. C., and Bohre, A. K. (2018). Techno-economic Scrutiny of HRES through GA and PSO Technique. Ijret 9 (1/2), 84. doi:10.1504/ijret.2018.090106
Sawle, Y., Gupta, S. C., and Kumar Bohre, A. (2016). PV-wind Hybrid System: A Review with Case Study. Cogent Eng. 3 (1). doi:10.1080/23311916.2016.1189305
Sawle, Y., Jain, S., Babu, S., Nair, A. R., and Khan, B. (2021). Prefeasibility Economic and Sensitivity Assessment of Hybrid Renewable Energy System. IEEE Access 9, 28260–28271. doi:10.1109/access.2021.3058517
Sharma, A., Dutta, A. K., Bora, M. K., and Dutta, P. P. (2019). Study of Energy Management in a tea Processing Industry in Assam , India. AIP Conf. Proc. 2, 1–8. doi:10.1063/1.5096503
Singh, S., Chauhan, P., and Singh, N. (2020). Capacity Optimization of Grid Connected Solar/fuel Cell Energy System Using Hybrid ABC-PSO Algorithm. Int. J. Hydrogen Energ. 45 (16), 10070–10088. doi:10.1016/j.ijhydene.2020.02.018
Siyal, S. H., Mentis, D., and Howells, M. (2015). Economic Analysis of Standalone Wind-Powered Hydrogen Refueling Stations for Road Transport at Selected Sites in Sweden. Int. J. Hydrogen Energ. 40 (32), 9855–9865. doi:10.1016/j.ijhydene.2015.05.021
Sundaram, A. (2020). Combined Heat and Power Economic Emission Dispatch Using Hybrid NSGA II-MOPSO Algorithm Incorporating an Effective Constraint Handling Mechanism. IEEE Access 8, 13748–13768. doi:10.1109/ACCESS.2020.2963887
Sundaram, E. G., and Kumar, K. R. S. (2021). Energy and Environmental Issues in Tea Industries: A Case Study. Tamil Nadu, India: Department of Mechanical Engineering, Velammal Engineering College.
Swarnkar, N. M., and Gidwani, L. (2016). Analysis of Hybrid Energy System for Supply Residential Electrical Load by HOMER and RETScreen: A Case in Rajasthan, India. December, 1–6. doi:10.1109/ICRAIE.2016.7939487
Tamil Nadu electricity regulatory commission (2021). Determination of Tariff for Generation and Distribution. Available at: www.derc.gov.in. Accessed on 29th June 2021
Tamizselvan, R. (2021). Establishing Auto Gasification of tea Waste. National Conference on Energy and Chemicals from Biomass (NCECB). AIP Conf. Proc. 2225, 050006-1–050006-4.
Tangedco (2021). Hydro Stations in Nilgiris. Available at: https://www.tangedco.gov.in/hydrokundah.html.
Taulo, J. L., and Sebitosi, A. B. (2016). Material and Energy Flow Analysis of the Malawian tea Industry. Renew. Sust. Energ. Rev. 56, 1337–1350. doi:10.1016/j.rser.2015.11.072
Tea Board India (2021). Tea Production Data for the Year 2020. Available at: http://www.teaboard.gov.in/(Accessed on June 29th, 2021).
Tea Processing (2021). Technology Innovation Management & Entrepreneurship Information Service. Available at: https://techno-preneur.net/technology/project-profiles/food/Tea.htm (Accessed on June 29th, 2021).
Temple, S. J., Temple, C. M., Boxtel, A. J. B. v., Clifford, M. N., and Clifford, M. (2001). The Effect of Drying on Black tea Quality. J. Sci. Food Agric. 81, 764–772. doi:10.1002/jsfa.88110.1002/jsfa.881
The Peria Karamalai Tea and Produce Company Limited, (2021). Renewable Energy Installations. Available at: https://www.periatea.com/green-energy/(Accessed on June 29th, 2021).
Thirunavukkarasu, M., and Sawle, Y. (2020). Design, Analysis and Optimal Sizing of Standalone PV/diesel/battery Hybrid Energy System Using HOMER, 2020. IOP Conf. Ser. Mater. Sci. Eng. 937, 012034.
Thirunavukkarasu, M., and Sawle, Y. (2021). A Comparative Study of the Optimal Sizing and Management of Off-Grid Solar/Wind/Diesel and Battery Energy Systems for Remote Areas. Front. Energ. Res. 9, 752043. doi:10.3389/fenrg.2021.752043
Tnerc One Page Statement on Tariff Rates as in the Tnerc. Available at: https://www.tangedco.gov.in/linkpdf/ONE_PAGE_STATEMENT.pdf (Accessed on June 29th, 2021).
Tomar, V., and Tiwari, G. N. (2017). Techno-economic Evaluation of Grid Connected PV System for Households with Feed in Tariff and Time of Day Tariff Regulation in New Delhi - A Sustainable Approach. Renew. Sust. Energ. Rev. 70, 822–835. doi:10.1016/j.rser.2016.11.263
Trina Solar (2021). Solar PV Installation in Xishuangbanna Tea Garden. China. Available at: https://www.trinasolar.com/us/resources/success-stories/xishuangbanna-tea-garden (Accessed on June 29th, 2021).
Velo, R., Osorio, L., Fernández, M. D., and Rodríguez, M. R. (2014). An Economic Analysis of a Stand-Alone and Grid-Connected Cattle Farm. Renew. Sust. Energ. Rev. 39, 883–890. doi:10.1016/j.rser.2014.07.156
Visvanathan, C. (2002). Small and Medium Scale Industries in Asia: Energy and Environment. Tea Sector. Pathumthani 12120, Thailand: School of Environmental, Resources and Development, Asian Institute of Technology.
World Atlas (2021). The World's Top Tea-Producing Countries. Available at: https://www.worldatlas.com/articles/the-worlds-top-10-tea-producing-nations.html (Accessed on June 29th, 2021).
Keywords: hybrid renewable sources, tri-generation, thermal load controller, combined heat and power, levelized cost of electricity, levelized cost of hydrogen, homer
Citation: Thirunavukkarasu M and Sawle Y (2022) An Examination of the Techno-Economic Viability of Hybrid Grid-Integrated and Stand-Alone Generation Systems for an Indian Tea Plant. Front. Energy Res. 10:806870. doi: 10.3389/fenrg.2022.806870
Received: 01 November 2021; Accepted: 04 January 2022;
Published: 17 March 2022.
Edited by:
K. Sudhakar, Universiti Malaysia Pahang, MalaysiaReviewed by:
Baseem Khan, Hawassa University, EthiopiaKarthick Alagar, KPR Institute of Engineering and Technology, India
Copyright © 2022 Thirunavukkarasu and Sawle. This is an open-access article distributed under the terms of the Creative Commons Attribution License (CC BY). The use, distribution or reproduction in other forums is permitted, provided the original author(s) and the copyright owner(s) are credited and that the original publication in this journal is cited, in accordance with accepted academic practice. No use, distribution or reproduction is permitted which does not comply with these terms.
*Correspondence: Yashwant Sawle, yashsawle@gmail.com