Correct Species Identification and Its Implications for Conservation Using Haploniscidae (Crustacea, Isopoda) in Icelandic Waters as a Proxy
 Karlotta Kürzel1*
  Stefanie Kaiser2
  Anne-Nina Lörz3
  Sven Rossel4
  Eva Paulus5,6
  Janna Peters5 Martin Schwentner6
  Pedro Martinez Arbizu4
  Charles Oliver Coleman7
  Jörundur Svavarsson8
  Saskia Brix5
- 1Department of Biology, University of Hamburg, Hamburg, Germany
- 2Department of Invertebrate Zoology and Hydrobiology, Faculty of Biology and Environmental Protection, University of Łódź, Łódź, Poland
- 3Institute for Hydrobiology and Fisheries Science, Center for Earth System Research and Sustainability (CEN), University of Hamburg, Hamburg, Germany
- 4German Centre for Marine Biodiversity Research (DZMB), Senckenberg am Meer, Wilhelmshaven, Germany
- 5German Centre for Marine Biodiversity Research (DZMB), Senckenberg am Meer, Biocenter Grindel, Hamburg, Germany
- 6Naturhistorisches Museum Wien, Vienna, Austria
- 7Museum für Naturkunde, Leibniz Institute for Evolution and Biodiversity Science, Berlin, Germany
- 8Department of Life and Environmental Sciences, University of Iceland, Reykjavík, Iceland
Correct identification of species is required to assess and understand the biodiversity of an ecosystem. In the deep sea, however, this is only possible to a limited extent, as a large part of the fauna is undescribed and the identification keys for most taxa are inadequate or missing. With the progressive impact of climate change and anthropogenic activities on deep-sea ecosystems, it is imperative to define reliable methods for robust species identification. In this study, different techniques for the identification of deep-sea species are tested, including a combination of morphological, molecular (DNA barcoding, and proteomic fingerprinting), biogeographical and ecological modeling approaches. These are applied to a family of isopods, the Haploniscidae, from deep waters around Iceland. The construction of interactive identification keys based on the DELTA format (DEscription Language for TAxonomy) were a major pillar of this study, the evaluation of which was underpinned by the application of the supplementary methods. Overall, interactive keys have been very reliable in identifying species within the Haploniscidae. Especially in a deep-sea context, these types of keys could become established because they are easy to adapt and flexible enough to accommodate newly described species. Remarkably, in this study, the interactive key enabled identification of a supposedly new species within the Haploniscidae that was later verified using both molecular genetic – and proteomic methods. However, these keys are limited given that they are based on purely morphological characteristics, including where species with strong ontogenetic or sexual dimorphism occur as both genders are not always described. In this case, integrative taxonomy is the method of choice and the combination presented here has been shown to be very promising for correct identification of deep-sea isopods.
Introduction
Species determination is the first step in conducting almost any kind of biological research. Without identifying known and scientifically describing newly discovered species, drawing conclusions about species diversity, their distribution and their ecology is impossible. Species delimitation describes the process by which species boundaries are identified and defined involving the identification of (known) species as well as of species new to science (e.g., Wiens et al., 2007). The question of how one species can be differentiated from another is irrevocably linked to the question of “what is called a species?”
Just like in other habitats in the deep sea, defined as depth >200 m (Gage and Tyler, 1991), species are often identified based on their morphological appearance. However, deep-sea sampling is known to be challenging; long hauls over several hours and subsequent sampling and sorting processes can damage specimens and thus conceal important morphological characters. In addition, morphological identifications are limited by the high rate of new species discoveries (Brandt et al., 2007), combined with a high diversity and typically low densities of deep-sea communities. The latter in turn imposes restrictions on the evaluation of intra- and interspecific variations (e.g., Brandt et al., 2007; Lim et al., 2012). Since the deep-sea environment also has a high proportion of morphologically similar but genetically different species, so-called cryptic species (Raupach and Wägele, 2006; Vrijenhoek, 2009; Brasier et al., 2016), the morpho-species approach tends to underestimate true biodiversity and, conversely, to overestimate the range of species and their population size. In addition, intraspecific morphological variability, including ontogenetic variation, polymorphism, or sexual dimorphism, poses a challenge to species assignment based on morphological characters alone (Raupach and Wägele, 2006; Riehl et al., 2012; Zaharias et al., 2020; Paulus et al., 2021).
In the last two decades, major leaps have been made in the development of taxonomic approaches and methodologies, including DNA-based taxonomy and (meta-) barcoding, “-omic” techniques, imaging tools, and integrative approaches linking different types of taxonomic information (Dayrat, 2005; Boistel et al., 2011; Raupach et al., 2016; Paulus et al., 2021). Many of these methods, despite their apparent advantage in facilitating and accelerating species delimitation, have been slow to find their way into deep-sea taxonomy. However, with increasing human impacts on deep-sea ecosystems, new methods and ideas for identifying and delimiting species are urgently needed (Brix et al., 2020).
In this study, we use a relatively well known deep-sea benthic group, isopod crustaceans (Brix and Svavarsson, 2010; Brix et al., 2018), from a relatively well known region, waters around Iceland (Brökeland and Svavarsson, 2017), to apply a range of (morphological and molecular) methods and procedures for the identification of deep-sea species. Situated right at the border between the Northern North Atlantic and the Nordic seas and separated by the Greenland-Iceland-Faroe (GIF) ridge, Icelandic waters provide a very heterogeneous marine environment linked to complex water masses and diverse submarine topography that strongly influence faunal distributions. Additionally, the fauna is threatened by climate change, including warming, acidification, freshening and productivity changes (Hanna et al., 2006; Arnason, 2007; D’alba et al., 2010; Pecl et al., 2017) which in turn could lead to changes in species diversity and geographic ranges (e.g., D’alba et al., 2010; Pecl et al., 2017). To properly assess these future impacts, understanding where species occur and how they are distributed is imperative, and thus they must be properly identified.
Isopod crustaceans are commonly found in deep-sea benthic communities, and they are also widespread in Icelandic waters (Svavarsson et al., 1993; Brix and Svavarsson, 2010; Brökeland and Svavarsson, 2017; Schnurr et al., 2018). The isopod family Haploniscidae Hansen, 1916 is considered a typical deep-sea family, although members are also found at shelf depth (Brökeland and Svavarsson, 2017; Johannsen et al., 2020). Due to their ubiquity and widespread occurrence in Icelandic waters, Haploniscidae, and the genus Haploniscus Richardson, 1908 in particular, are well suited as proxies for assessing species distributions around Iceland.
The basis for the current study is provided by sampling carried out in the course of the BIOICE (Benthic Invertebrates of Icelandic Waters) and the IceAGE (Icelandic marine Animals:
Genetics and Ecology) projects leading to a very comprehensive data set that is also suitable for genetic and “omic” studies (Brix et al., 2014; Riehl et al., 2014; Meißner et al., 2018). Morphology-based approaches (interactive identification keys) were used to separate haploniscid genera occurring around Iceland (Antennuloniscus Menzies, 1962, Chauliodoniscus Lincoln, 1985b and Haploniscus) and to identify species within the genus Haploniscus. In addition, bathymetric and geographic information for species in the family Haploniscidae around Iceland are compiled as part of an integrative taxonomic framework. These data are complemented by genetic [using Cytrocrome oxidase I (COI) as barcoding marker] and proteomic fingerprinting tools to foster species identification. The assumption was that many of the Icelandic haploniscid species are described and can therefore be reliably recognized as such with the interactive key as not many cryptic species are to be expected. That is, we sought to test whether the species identified by the key are “valid,” and what were the limiting factors for correct species identification? This combined approach has the power to overcome problems of taxonomic standardization with data being made publicly available (e.g., via BOLD, OBIS) and enhancing species identification, for instance by fellow taxonomists, para-taxonomists and students, through online-identification keys (Balke et al., 2013).
Materials and Methods
Study Area, Sampling and Data Collection
Specimens of the isopod family Haploniscidae were collected around Iceland during BIOICE (Benthic Invertebrates of Icelandic waters) with yearly expeditions between 1992 and 2004 and IceAGE with four expeditions: IceAGE (2011), IceAGE2 (2013), IceAGE_RR (2018) and IceAGE3 in 2020 (Figure 1).
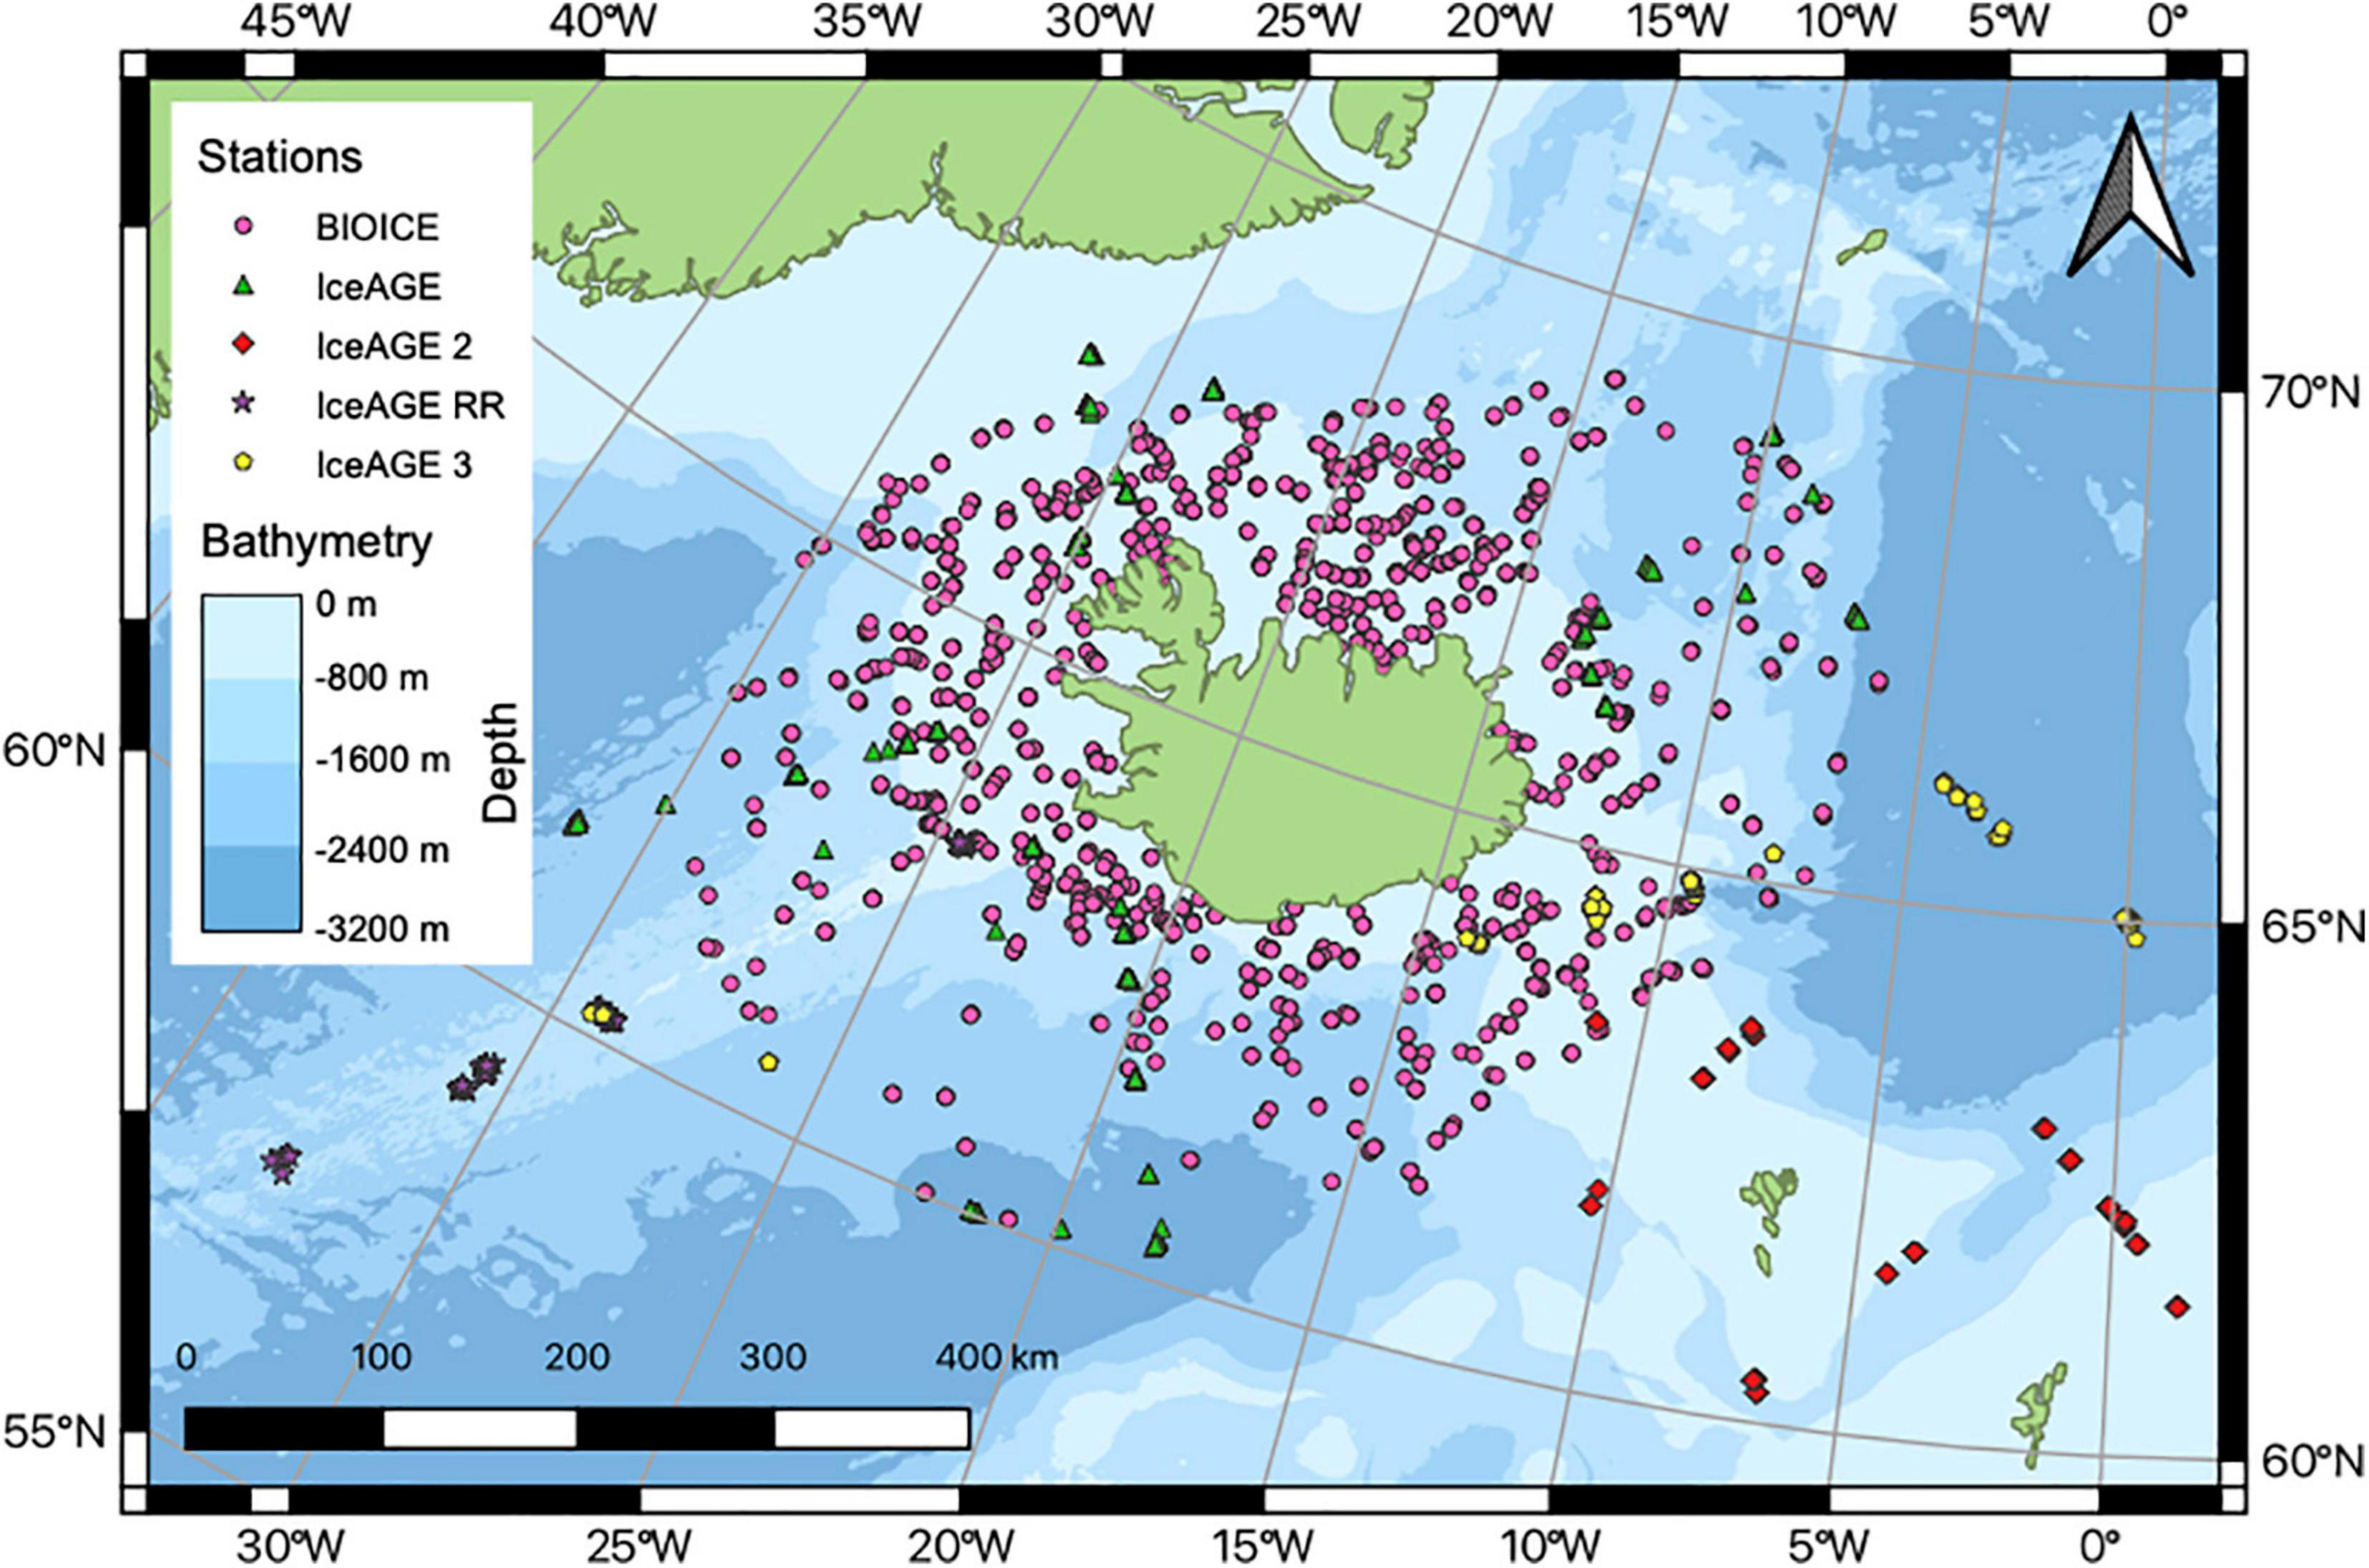
Figure 1. Stations sampled during the BIOICE and IceAGE projects with the latter including the following four expeditions: IceAGE (M85/3), IceAGE 2 (POS456), IceAGE RR (MSM75), IceAGE 3 (SO276).
For the molecular analyses, only specimens were taken that were collected during the IceAGE, IceAGE2 and IceAGE_RR cruises respectively using an epibenthic sledge (EBS) or a van Veen grab (Brix and Devey, 2019). These samples were fixed in cooled high-grade ethanol to ensure genetic analysis. The material was first examined morphologically and given a unique database number at the DZMB (German Centre for Marine Biodiversity Research, Hamburg). For the species distribution models as well as bathymetry and geological distribution analyses, specimens from BIOICE and IceAGE (IceAGE, IceAGE2, IceAGE_RR, IceAGE3) were utilized.
During the BIOICE project, specimens were collected using a detritus sledge (Sneli sled; Sneli, 1998), a RP sledge (Rothlisberg and Pearcy sledge; Rothlisberg and Pearcy, 1976), a triangle dredge and an Agassiz trawl. The RP samples were elutriated through a 0.5 mm sieve, and the remaining sediment and animals were processed through a series of sieves (4, 2, 1, and 0.5 mm). The detritus sledge samples were then processed through two vertically stacked (1 and 0.5 mm) sieves. The Agassiz and triangle dredge samples were hand-picked on board. After the sorting process the BIOICE samples were stored in 5% buffered formalin (Brökeland and Svavarsson, 2017). Samples that were collected during the four different IceAGE expeditions and included in the analyses come from the EBS (EBS, Brenke, 2005) and triangle dredge.
Interactive Identification Keys
Interactive keys were developed for identifying genera of the family Haploniscidae as well as for identifying species of the genus Haploniscus distributed around Iceland by examining the relevant literature of species and genera descriptions to derive distinguishing morphological characters (Lincoln, 1985a,b; Sars, 1896-1899; Richardson, 1908; Hansen, 1916; Menzies, 1962; Hessler, 1970; Chardy, 1974; Brökeland and Wägele, 2004; Brökeland, 2005; Brökeland and Svavarsson, 2017). The genus Haploniscus was present with nine species: H. aduncus Lincoln, 1985a, H. ampliatus Lincoln, 1985a, H. angustus Lincoln, 1985a, H. astraphes Brökeland and Svavarsson, 2017, H. bicuspis (Sars, 1877), H. borealis Lincoln, 1985a, H. foresti Chardy, 1974, H. hamatus Lincoln, 1985a and H. spinifer Hansen, 1916. The genera Antennuloniscus and Chauliodoniscus were only represented by one species each with Antennuloniscus simplex Lincoln, 1985a and Chauliodoniscus armadilloides (Hansen, 1916).
Length-width ratios of body segments and appendages were measured according to Hessler (1970); total width refers to the widest part of the habitus, while total length was measured from the anterior beginning of the head (excluding the rostrum if present) to the exterior medial end of the pleotelson. Length and width measurements for the appendage ratios always describe the greatest length of the articles. Arabic numerals were used to refer to body segments (Wolff, 1962; Hessler, 1970).
For distinguishing characters as well as digital habitus drawings were created. To illustrate these, literature drawings were modified, first by scanning the image and then tracing them manually using a Wacom Intuos M Drawing Pad, while using the vector-based software Adobe Illustrator CC (Lincoln, 1985a,b; Sars, 1896-1899; Hessler, 1970; Coleman, 2003; Brökeland and Wägele, 2004; Brökeland, 2005; Coleman, 2009; Brökeland and Svavarsson, 2017; Adobe Inc, 2019).
To create the interactive keys, the software package DELTA (DEscription Language for TAxonomy) (Dallwitz, 1980; Dallwitz et al., 2006; Coleman et al., 2010) was utilized, running in a virtual machine (Oracle, 2021) with Microsoft Windows XP as operating system. Characters, character states, species-specific links to worms.org and obis.org as well as taxa were added and put into the DELTA editor together with previously created character and taxon illustrations. Afterward this was exported into natural language descriptions and a multi-access key (INTKEY) using the actions set‘s directive files tonatr and toint. Finally, the interactive keys were published online.1
Molecular Analysis
Cytrocrome Oxidase I Barcoding
The focus of the molecular analysis was on the genus Haploniscus. Five individuals of each species were studied, where available. Haploniscus bicuspis has been previously shown to represent a species complex (see Paulus et al., 2021) and thus representative sequences of all three cryptic species identified by Paulus et al. (2021) were included.
DNA extraction was performed using the Marine Animal Tissue Genomic DNA Extraction Kit (Neo Biotech) or the Genomic DNA from tissue kit with NucleoSpin technology (Macherey-Nagel) following the manufacturer’s recommendations. The gut was removed prior to DNA extraction and only the midsection of the specimens was utilized. A 70 μL elution buffer was added to elute the DNA. For PCR amplification of COI, 1 μL of the DNA extract was utilized together with PuReTaq Ready-To-Go PCR Beads (GE Healthcare) and 1 μL of either dgLCO (GGT CAA CAA ATC ATA AAG AYA TYG G; Meyer, 2003)/dgHCO (TAA ACT TCA GGG TGA CCA AAR AAY CA; Meyer, 2003) or LCOJJ(CHACWAAYCATAAAGATATYGG; Astrin and Stüben, 2008)/HCOJJ (AWACTTCVGGRTGVCCAAARAATCA; Astrin and Stüben, 2008) primers as well as 22 μL nuclease-free water. The PCR program comprised of an initial denaturation step at 95°C for 5 min, followed by 38 cycles of 95°C for 45 s, 45°C for 50 s and 72°C for 1 min as well as a final elongation at 72°C for 5 min. Successful amplification was assessed via gel electrophoresis (1% TAE gels). Excess primers were removed with ExoSAP and the final PCR products were bidirectionally sequenced by Macrogen using the PCR primers. Forward and reverse sequences were assembled and quality checked in GENEIOUS Prime version 2019.2.3. Sequences were aligned with MUSCLE (v 3.8.425, Edgar, 2004) including Chauliodoniscus sp. (GenBank accession: JF283447) as an outgroup.
To identify genetic lineages that may correspond to species, two different computational approaches were employed: general mixed Yule coalescent (GMYC; Pons et al., 2006) and assembling species by automatic partitioning (ASAP; Puillandre et al., 2021). ASAP partitions species by ranked genetic distances. Pairwise uncorrected p-distances were pre-computed with MEGA-X 10.0.5 (Kumar et al., 2018). The online version of ASAP was run using standard settings, except for increasing the maximum considered distance to 15%. GMYC delimits species based on branching patterns in an ultrametric tree. The ultrametric tree was computed with BEAST2 2.63 (Bouckaert et al., 2019), employing a Yule prior and enforcing the monophyly of the ingroup. Each haplotype was included only once. BEAST2 was run for 106 generations, sampling every 1000th tree. Convergence was assessed with Tracer and the final tree annotated with TreeAnnotator (BEAST2 package), removing the first 25% of retained trees as burn-in. GMYC was run in R (R Core Team, 2020) using the once the single and once the multiple threshold method.
Phylogenetic analysis was performed with MrBayes (v 3.2.7a, Ronquist et al., 2012) using the best-fitting model (GTR + G + I) with four runs and six chains for 107 generations. Every 5000th tree was retained and the first 25% were removed as burn-in. The best-fitting model was determined with MEGA-X following the AIC, and the analysis was performed on the CIPRES Science Gateway (Miller et al., 2010). The resulting tree was visualized with FigTree (Version 1.4.4).
Matrix-Assisted Laser Desorption/Ionization Time-of-Flight Mass Spectrometry
From the same specimens used for COI barcoding, a single pereopod with the attached muscles was used for matrix-assisted laser desorption/ionization time-of-flight mass spectrometry (MALDI-TOF MS) measurements. The tissue was incubated in 5 μl of a matrix solution containing α-Cyano-4-hydroxycinnamic acid (HCCA) as a saturated solution in 50% acetonitrile, 47.5% molecular grade water and 2.5% trifluoroacetic acid. After 5 min of incubation, 1.5 μl of the extract solution was applied to one spot for crystallization on a target plate. Measurements were carried out on a Microflex LT/SH System (Bruker Daltonics), employing the flexControl 3.4 (Bruker Daltonics) software. Masses were measured in a range from 2,000 to 20,000 Dalton (Da). During measurements, peaks were evaluated using a centroid peak detection algorithm, a signal-to-noise threshold of 2, and a minimum intensity threshold of 600, with a peak resolution higher than 400 in a range from 2,000 to 10,000 Da. For fuzzy control the Proteins/Oligonucleotide method was employed with a maximal resolution ten times above the threshold. Analyses included mass spectra from H. bicuspis (I-III = 6, IV = 5, V = 5), H. foresti A (n = 3), H. foresti B (n = 1), H. angustus (n = 3), H. hamatus (n = 4) and H. n. sp. A (n = 4).
Data were processed in R (R Core Team, 2020) using R packages MALDIquant and MALDIquantForeign (Gibb and Strimmer, 2012; Gibb, 2015), trimming mass spectra to an identical range from 2,000 to 20,000 Da. Data were smoothed with the Savitzky-Golay method (Savitzky and Golay, 1964) and the baseline was removed using the SNIP baseline estimation method (Ryan et al., 1988) using 15 iterations. After normalization was done using the TIC method, a noise reduction using a signal to noise ratio (SNR) of 3 was applied. For peak picking, a half window size of 14 was used, applying the MAD method implemented in MALDIquant. Repeated peak binning was carried out with a tolerance of 0.002 in a strict approach. Missing values were interpolated from the corresponding mass spectra and all signals below a SNR of 1.75 were assumed to be below the detection limit and set to zero. The resulting data matrix was Hellinger transformed (Legendre and Gallagher, 2001).
To test group differentiation for classification approaches, a Random Forest (RF) (Breiman, 2001) analysis was carried out using R package Random Forest (Liaw and Wiener, 2002) (ntree = 2000, mtry = 35). Only species with at least three specimens were used for RF models. Significant deviation from random of the observed model errors was calculated with the function MVSF.test from package RFtools2 (Rossel and Martínez Arbizu, 2018). Classification success was tested by creating RF models whereby one sample was omitted in each case and this was then classified using the model. Classification was tested using the post hoc test described by Rossel and Martínez Arbizu (2018) from the R package Rftools using a 1% alpha value for false positive recognition. Data were visualized in R using a Barnes-Hut implementation of t-Distributed Stochastic Neighbor Embedding (Krijthe and Van der Maaten, 2015) (perplexity = 5, max.iter = 4,000).
Biogeography
Geographical and Depth Distribution of Haploniscidae Species Distributed Around Iceland
To analyze the geographical species distribution, one map for each haploniscid species distributed around Iceland was created as well as one projection encompassing all species together. Data were visualized using QGIS 3.4.7-Madeira (QGIS Development Team, 2020) with the WGS 84 (ESPG: 32631) coordinate reference system. Individuals of Halploniscus bicuspis were assigned to the three species found within the species complex in Paulus et al. (2021) based on their distribution. To analyze the species’ depth distribution, a box and whisker plots was created with Excel 16.53 (Microsoft Corporation, 2021). The whiskers boxplot is based on the same data as utilized in the geographical distribution maps although each station finding was only included once per species.
Species Distribution Models
Species distribution models (SDM) were calculated using the random forest approach (Breiman, 2001). Random Forest is a non-parametric and non-linear modeling approach based on decision trees (Hastie et al., 2009), which has been successfully applied to the modeling of species distributions around Iceland in both classification (Meißner et al., 2014; Paulus et al., 2021) and regression problems (Ostmann and Arbizu, 2018).
Predictive variables include particulate organic carbon (POC) flux, bottom water temperature, salinity, oxygen, and depth. The georeferenced predictive layers with a pixel resolution of 5-arc minute were retrieved from Global Marine Environment Dataset (Basher et al., 2014). The training dataset consists of 1,511 sampling events with information on presence or absence of the isopod species under consideration. A separate model was calculated for each of the 14 taxa. Haploniscidae was found in 189 samples, while 1,322 samples had no Haploniscidae. Because of the great unbalanced distribution of classes presence and absences, for training the models, the sample size argument was adjusted, so that the number of absence samples in each of the 5,000 random trees was set to half of the number of presences. The probability of occurrence of the haploniscid species was predicted on 88,785 locations around Iceland. Computations were carried out in the statistical environment of R using the package randomForest (Liaw and Wiener, 2002). The spatial distribution was visualized in QGIS (QGIS Development Team, 2020).
Results
Interactive Determination Keys
Generic Level – Haploniscidae
To distinguish between the three haploniscid genera that are distributed around Iceland, two determination characters were utilized in the Interactive key (Figure 2) the articles five and six of the second antenna show a visible suture only in the genus Antennuloniscus. The remaining two genera are distinguishable from each other as at least one of the anterior angles of the pereonites two to four, which are prolonged in Chauliodoniscus but not in Haploniscus. For the interactive key, each character as well as habitus are illustrated (Figures 2, 3). The key was published online: https://doi.org/10.5281/zenodo.5682763.
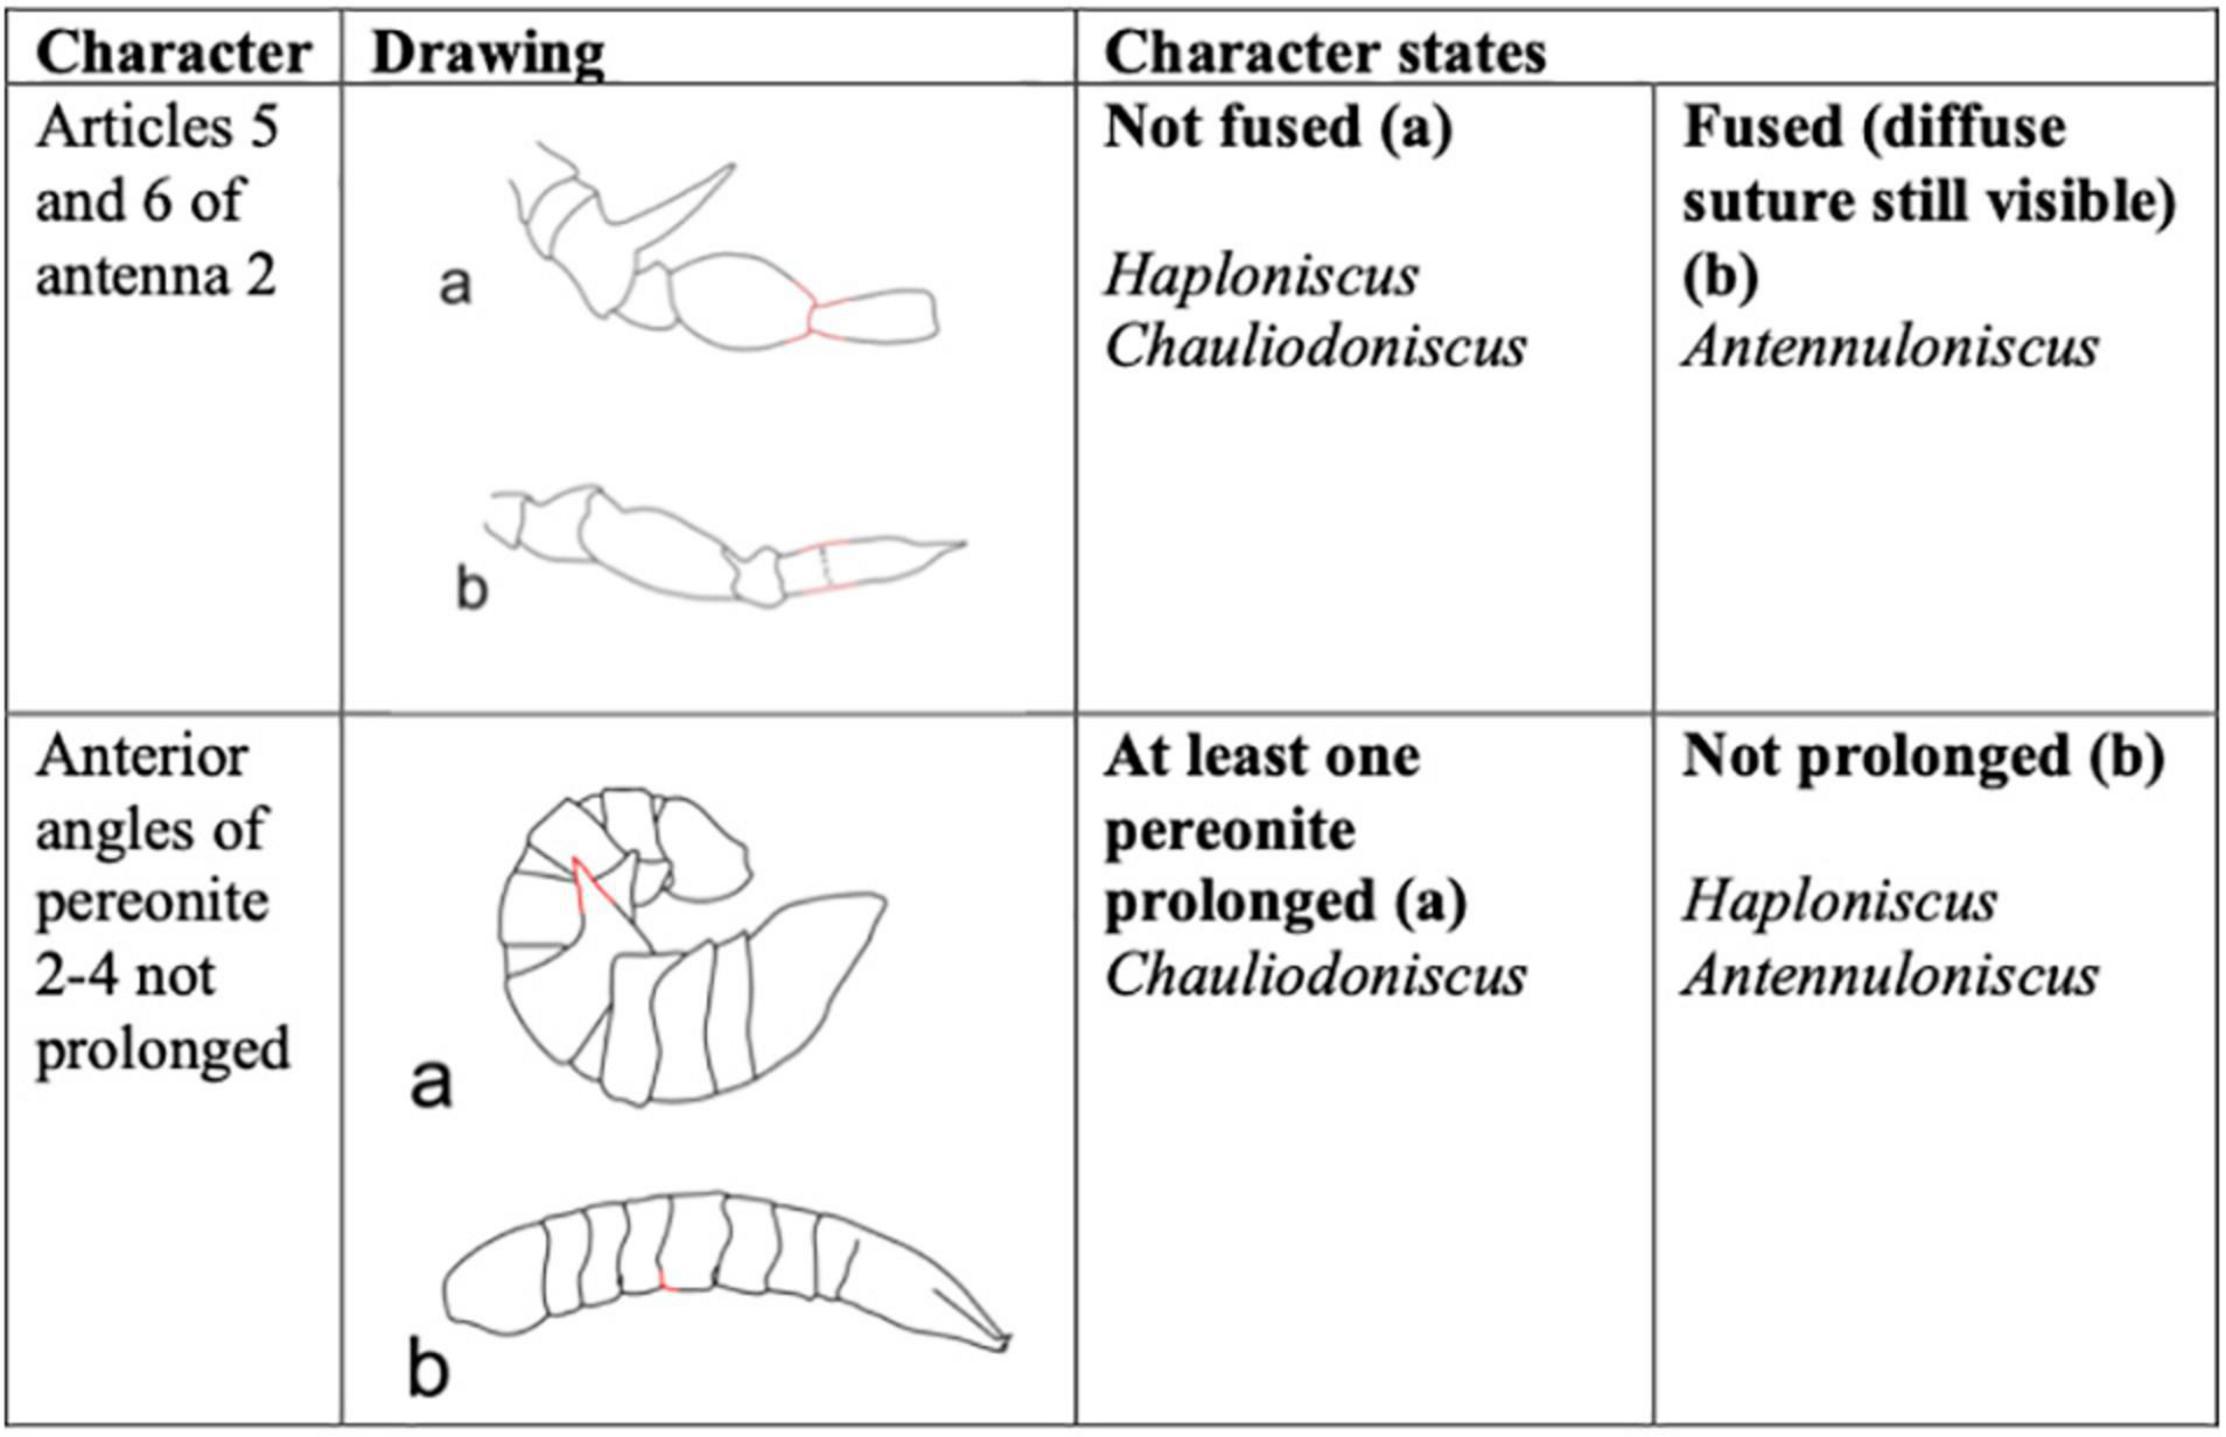
Figure 2. Summary of morphological characters and character states used to create the interactive identification key for genera within Haploniscidae.
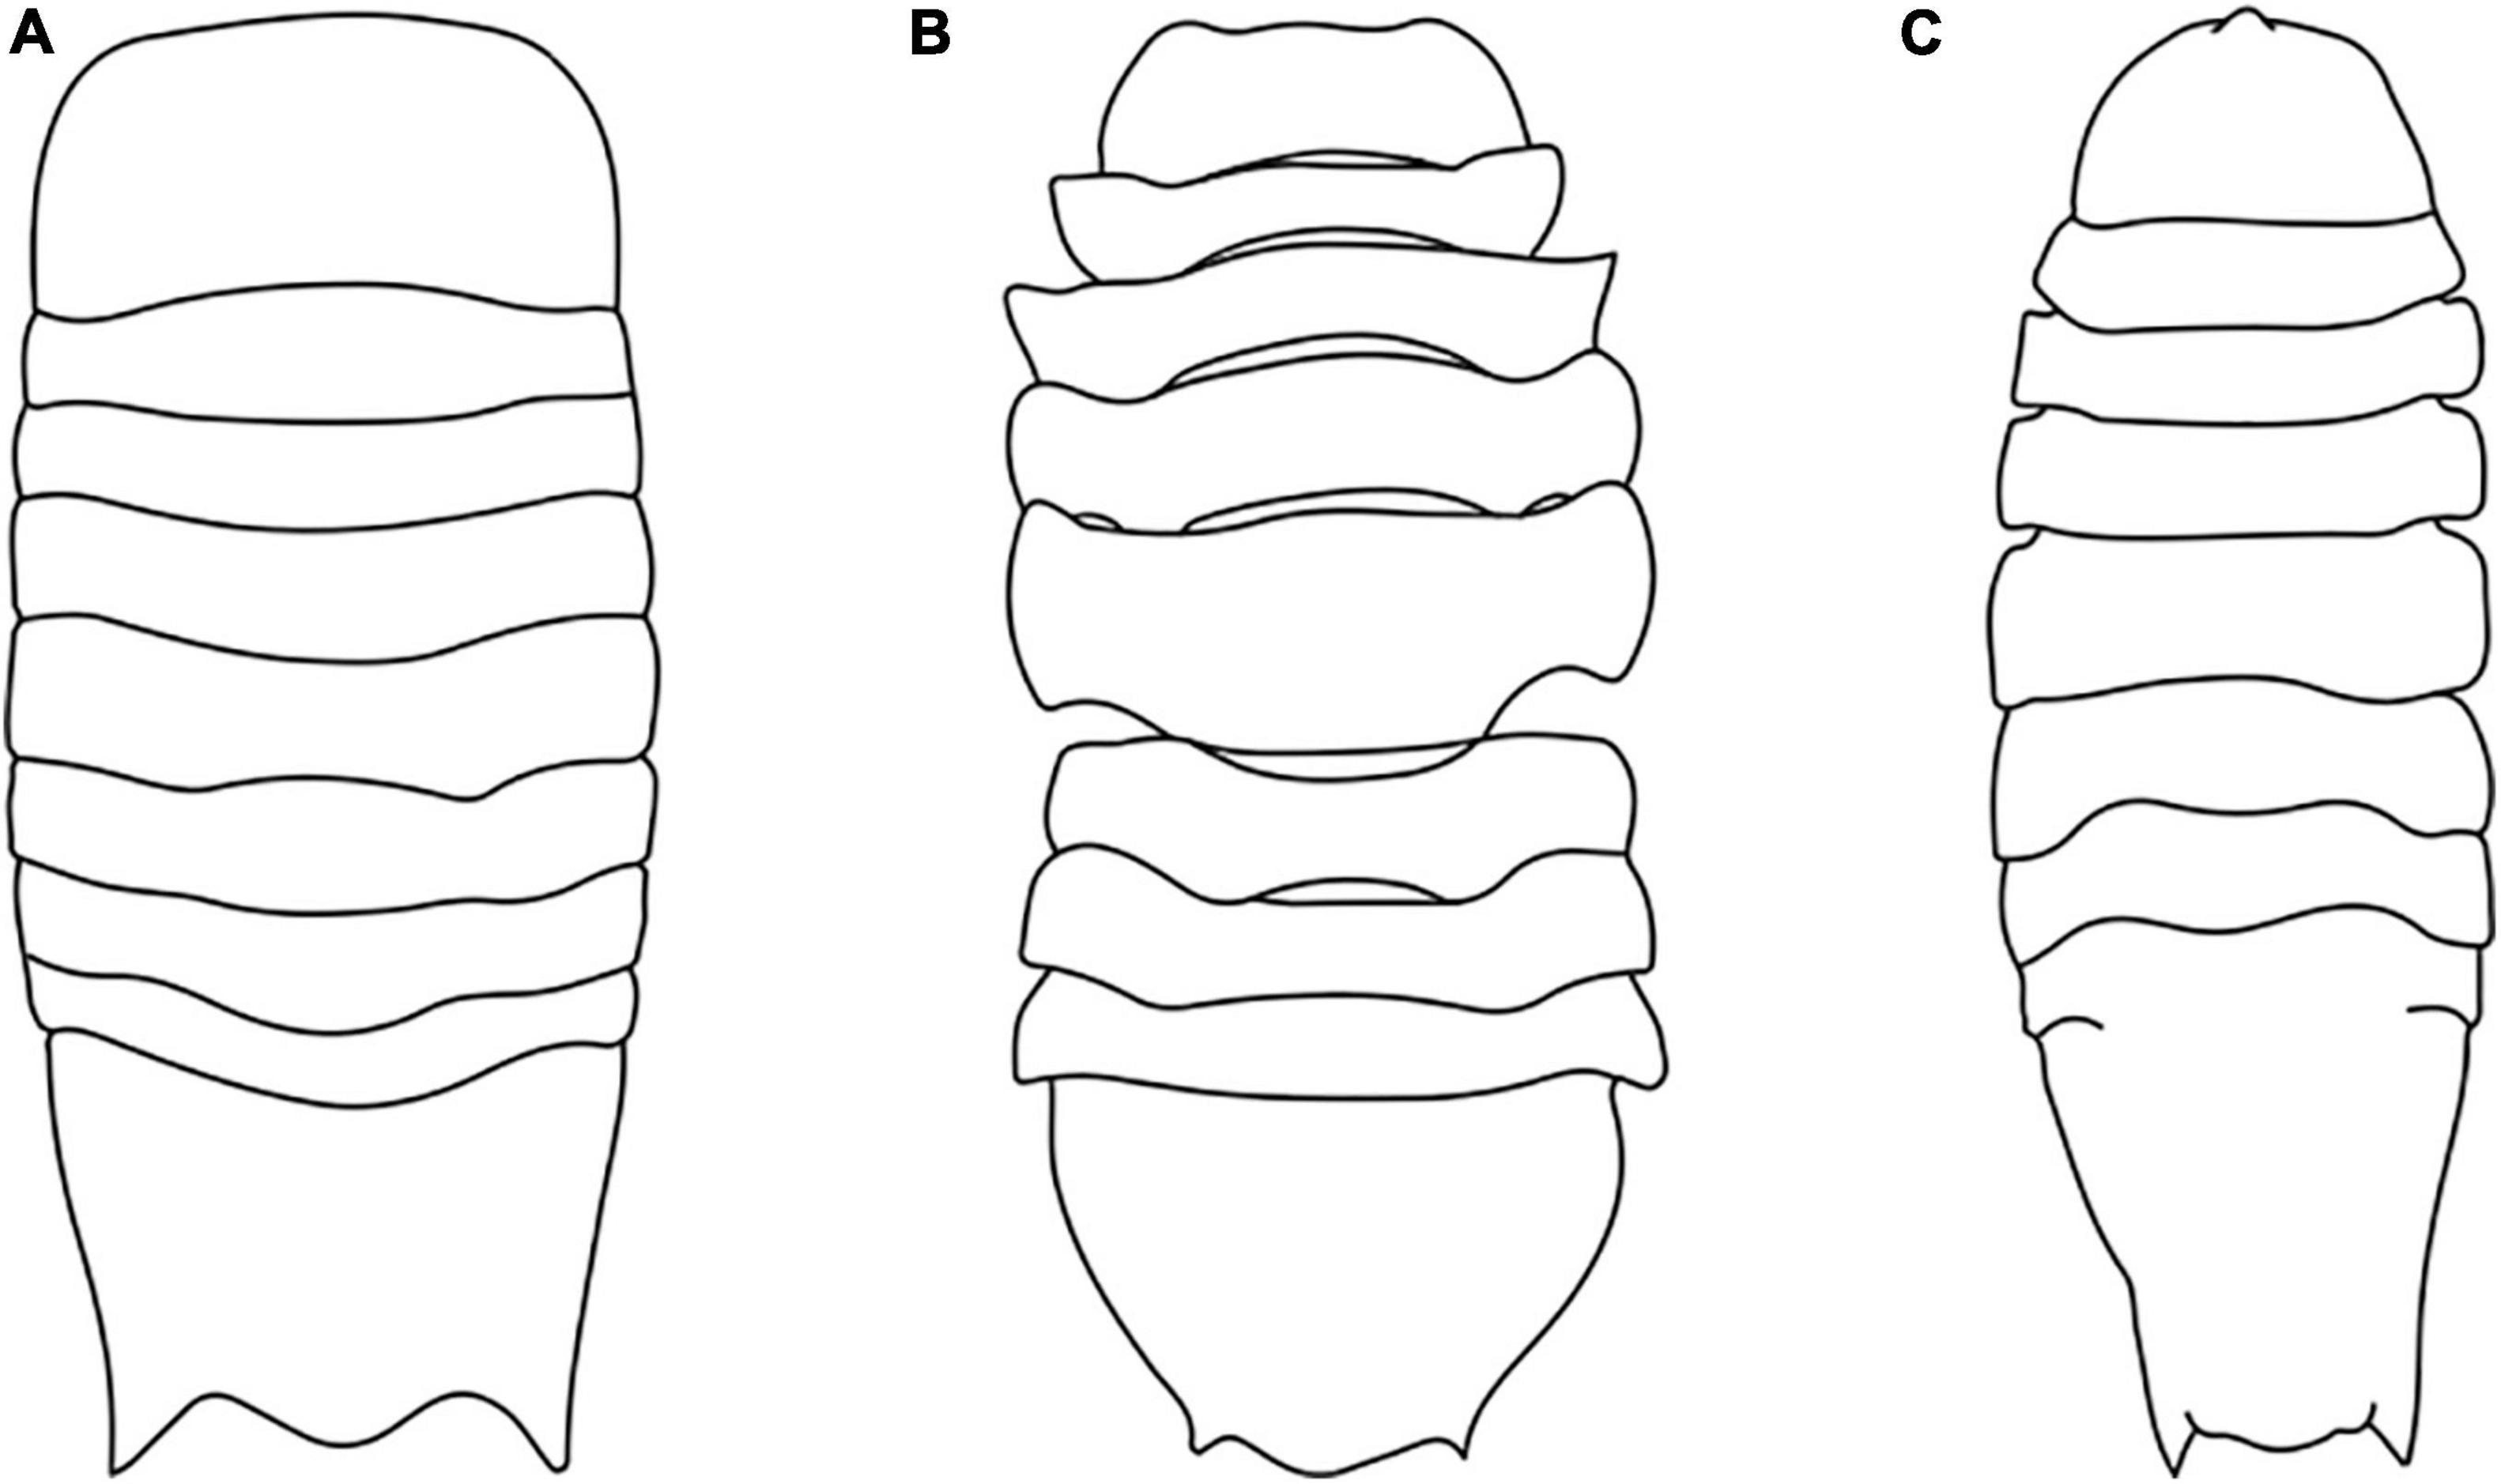
Figure 3. Habitus drawing of Antennuloniscus (A), Chauliodoniscus (B), and Haploniscus (C) (Modified after Lincoln, 1985a,b; Brökeland and Wägele, 2004).
Species Level – Haploniscus
To distinguish between the nine described Haploniscus species that are distributed around Iceland, six identification characters were utilized. Each distinguishing character as well as habitus are illustrated in the interactive key (Figures 4, 5). The species can be categorized into four different body shapes: (1) a slightly convex body shape (H. aduncus, H. bicuspis, H. borealis, H. hamatus and H. spinifer); (2) a rather straight body shape (H. angustus and H. astraphes B); (3) a plate-shaped body (H. ampliatus); and lastly (4) a fish-like body shape (H. foresti).
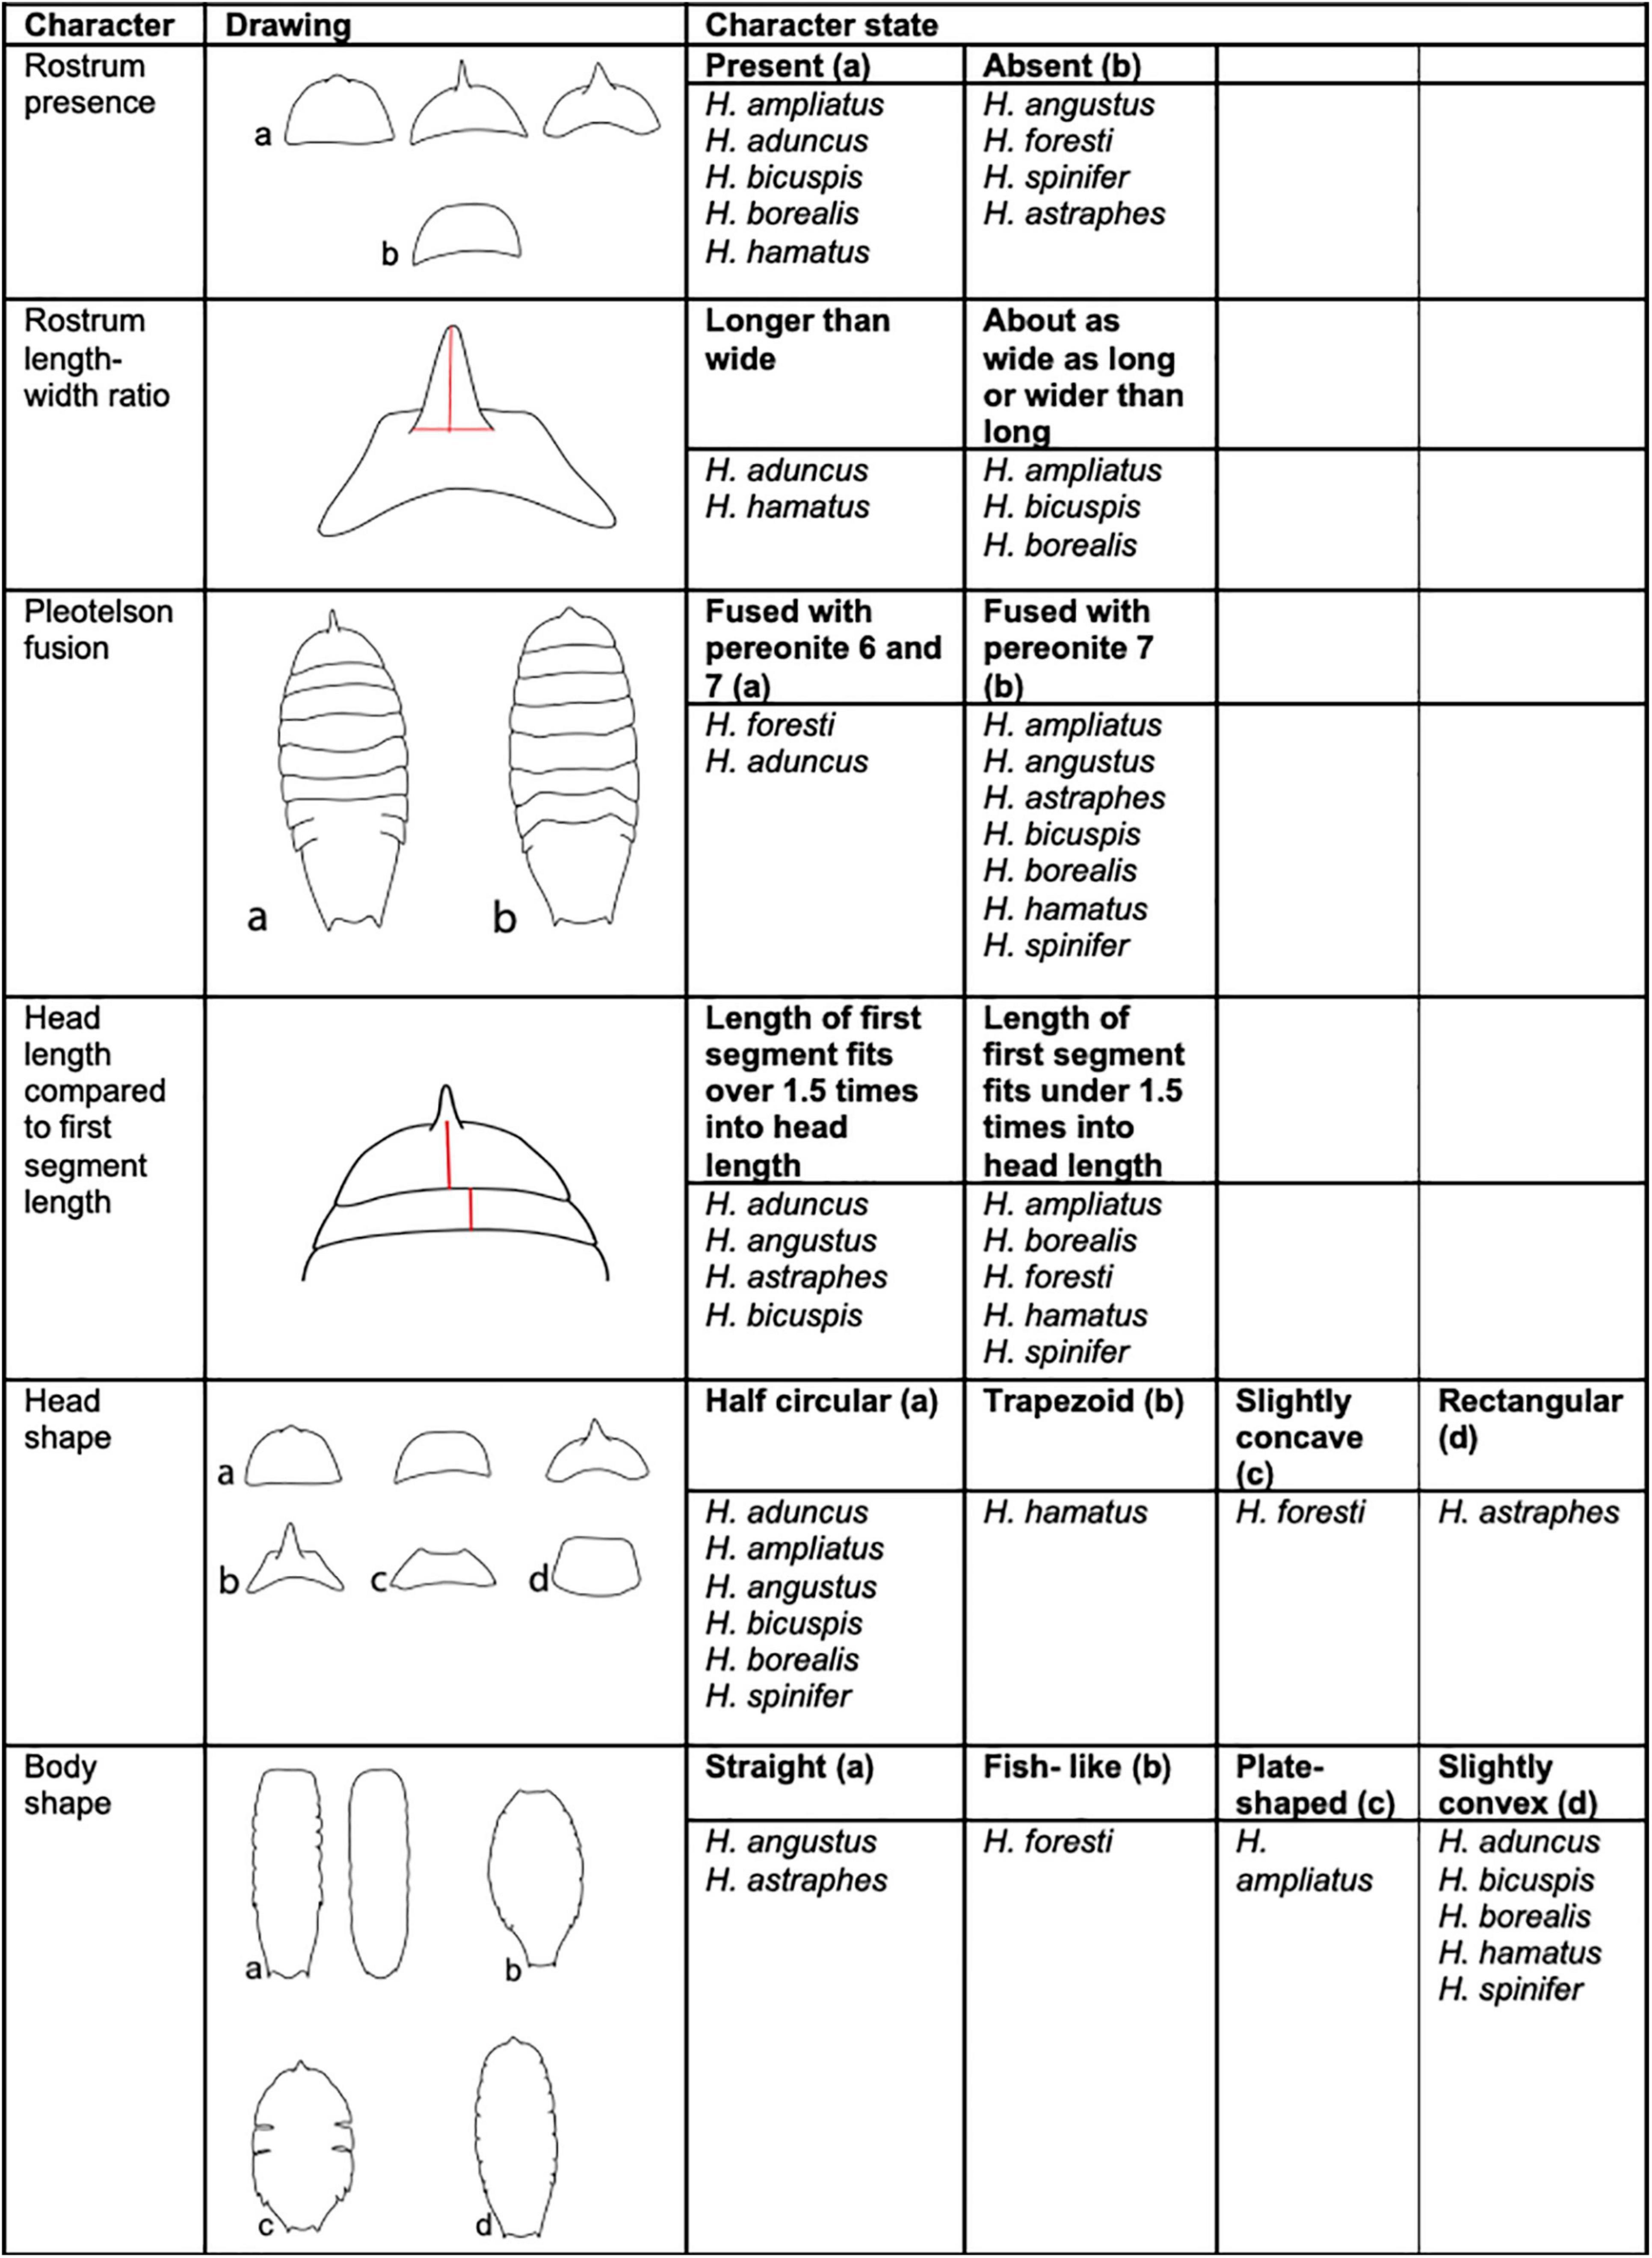
Figure 4. Summary of characters and character states used to create the interactive identification key for species within Haploniscus occurring around Iceland (Modified after Lincoln, 1985a; Brökeland and Wägele, 2004; Brökeland and Svavarsson, 2017).
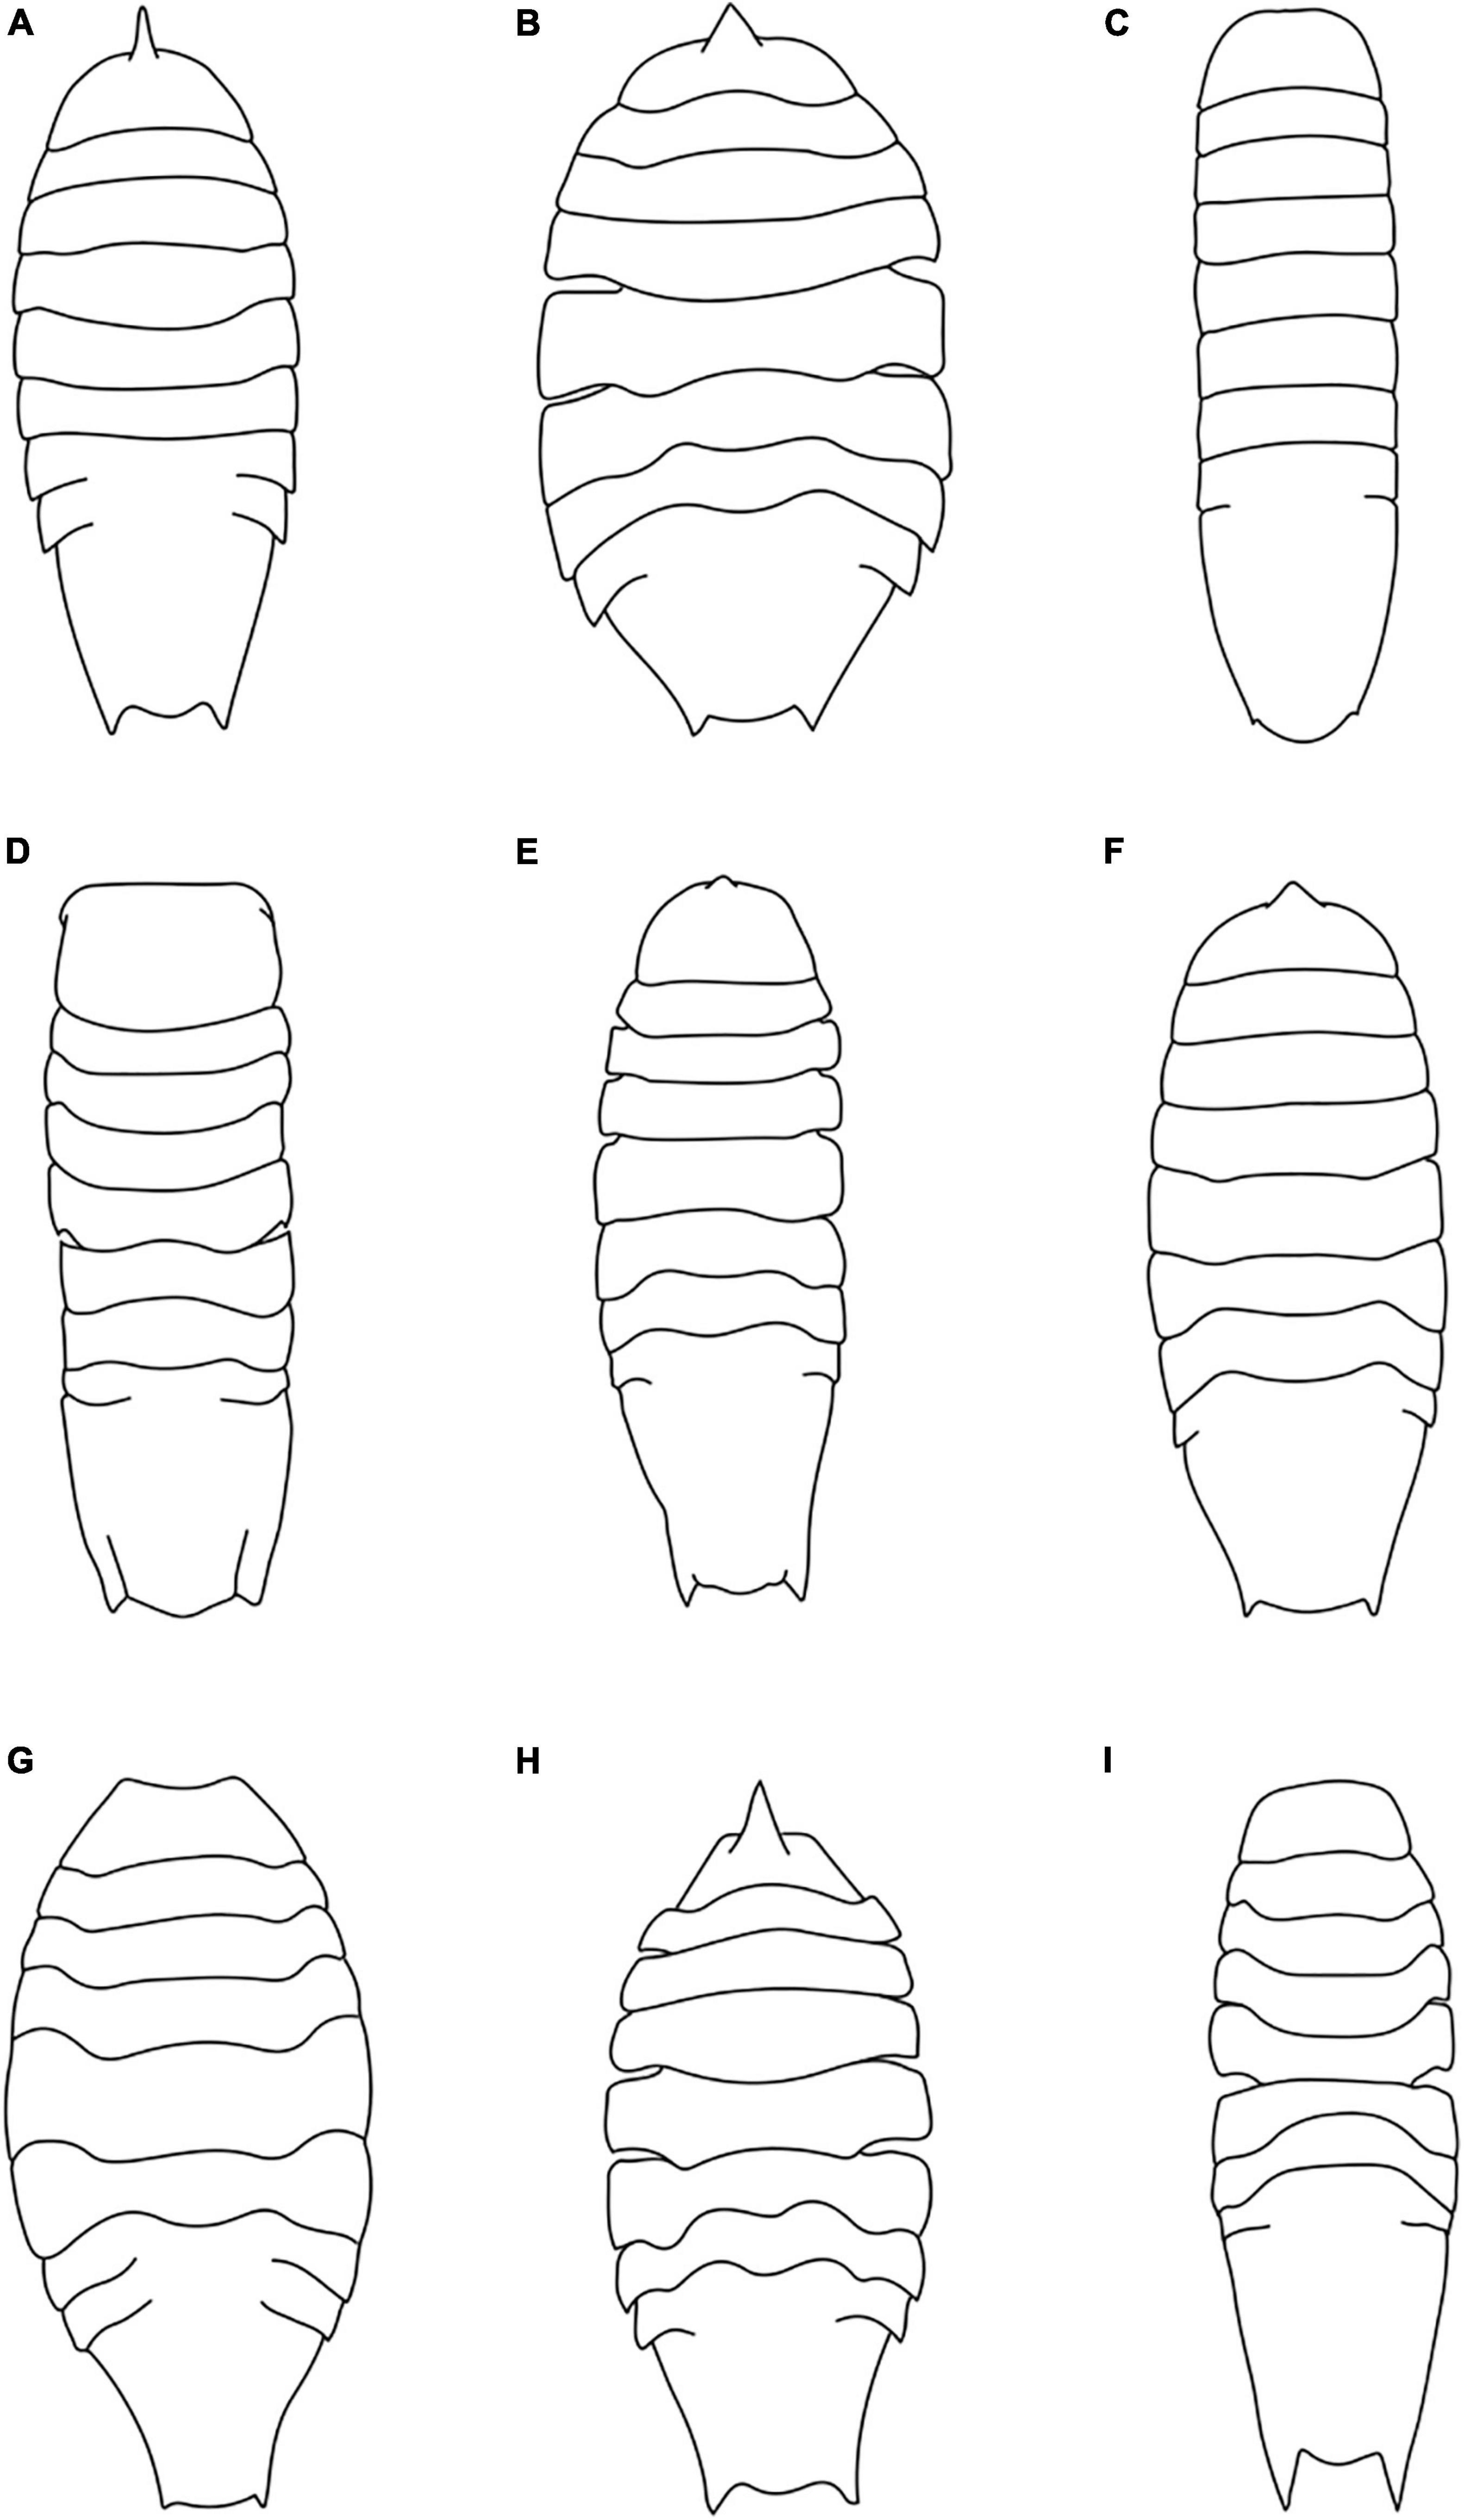
Figure 5. Habitus drawings of Haploniscus aduncus (A) H. ampliatus (B) H. angustus (C) H. astraphes (D) H. bicuspis (E) H. borealis (F) H. foresti (G) H. hamatus (H) H. spinifer (I) (Modified after Brökeland and Wägele, 2004; Brökeland and Svavarsson, 2017).
Furthermore, four head shapes are found in the species: (1) half circular (H. aduncus, H. ampliatus, H. bicuspis and H. borealis) (2) trapezoid (H. hamatus) (3) slightly concave (H. foresti) and (4) rectangular (H. astraphes). Furthermore, the absence (H. angustus, H. foresti, H. spinifer and H. astraphes) or presence (H. ampliatus, H. aduncus, H. bicuspis, H. borealis, H. hamatus) of the rostrum was used as another distinguishing character. In addition, of the species with a rostrum, its length- and width ratio differs between species. In some species (H. aduncus and H. hamatus), the rostrum is longer than wide, while in others (H. ampliatus, H. bicuspis, H. borealis), the rostrum is at least as wide as long or even wider than long. The species can also be categorized into two different types of pleotelson fusion: (1) the pleotelson is fused with sixth and seventh pereonite (H. aduncus, H. foresti); or (2) the pleotelson is only fused with the seventh pereonite (H. ampliatus, H. angustus, H. astraphes, H. aduncus, H. borealis, H. bicuspis, H. hamatus, H. spinifer). Finally, comparing the ratio of the head length (without rostrum if present) relative to the first segment length can be used to differentiate between the nine different Haploniscus species. The length of the first segment either fits over 1.5 times (H. aduncus H. angustus, H. astraphes, H. bicuspis) or under 1.5 times into the head length (H. ampliatus H. borealis, H. foresti, H. hamatus and H. spinifer). The key was published online: https://doi.org/10.5281/zenodo.5701346.
During the testing of the interactive key for Haploniscus, a new species has been discovered, which was not identifiable with the produced key. In addition, we consulted species descriptions of all other described species in the genus, which confirmed that it is new to science. This species is most similar to Haploniscus aduncus, Haploniscus astraphes and Haploniscus hamatus. It differs from the other Haploniscus species around Iceland in possessing the unique character combination of: The pleotelson is only fused with pereonite 7, no rostrum is present, and the species has a different head shape. In the following, we provisionally name this undescribed species “Haploniscus sp. A” and include it into all molecular, proteomic and biogeographical analyses, while it does not occur in the interactive key.
Molecular Analyses
Cytochrome Oxidase I
The COI alignment included sequences of 37 Haploniscus specimens with a length of 652 bp. No indels or stop codons were present. ASAP (Threshold 11%, p-value 1.22e–02) and the single threshold analysis of GMYC suggested the presence of seven putative species: H. angustus, H. hamatus, H. bicuspis (all three cryptic species identified by Paulus et al. (2021) grouped together), H. sp. A and three putative species identified as H. foresti (H. foresti A–C) (Figure 6). These putative species are all separated by > 17% interspecific p-distances (Table 1). Two of the putative H. foresti species are potential sister species (H. foresti A and B, ∼17% genetic distance), while H. foresti C is more divergent from the other two with ∼24% genetic distance. The GMYC multiple threshold resulted in ten putative species by additionally delimiting the three cryptic species of H. bicuspis (following Paulus et al., 2021) and by further splitting H. sp. A into two putative species (Figure 6). While the three cryptic species of H. bicuspis are separated by ∼ 4–6% genetic distance from each other (Table 1), the two putative species are separated by only 2.4%. The 2nd and 3rd highest scoring ASAP partitions resulted in either six (grouping H. foresti A and B together; threshold 18.2%, p-value 2.97e–01) or 12 (splitting H. angustus and H. sp. A into two and H. bicuspis into four putative species; threshold 1.7%, p-value 3.67e–01) putative species.
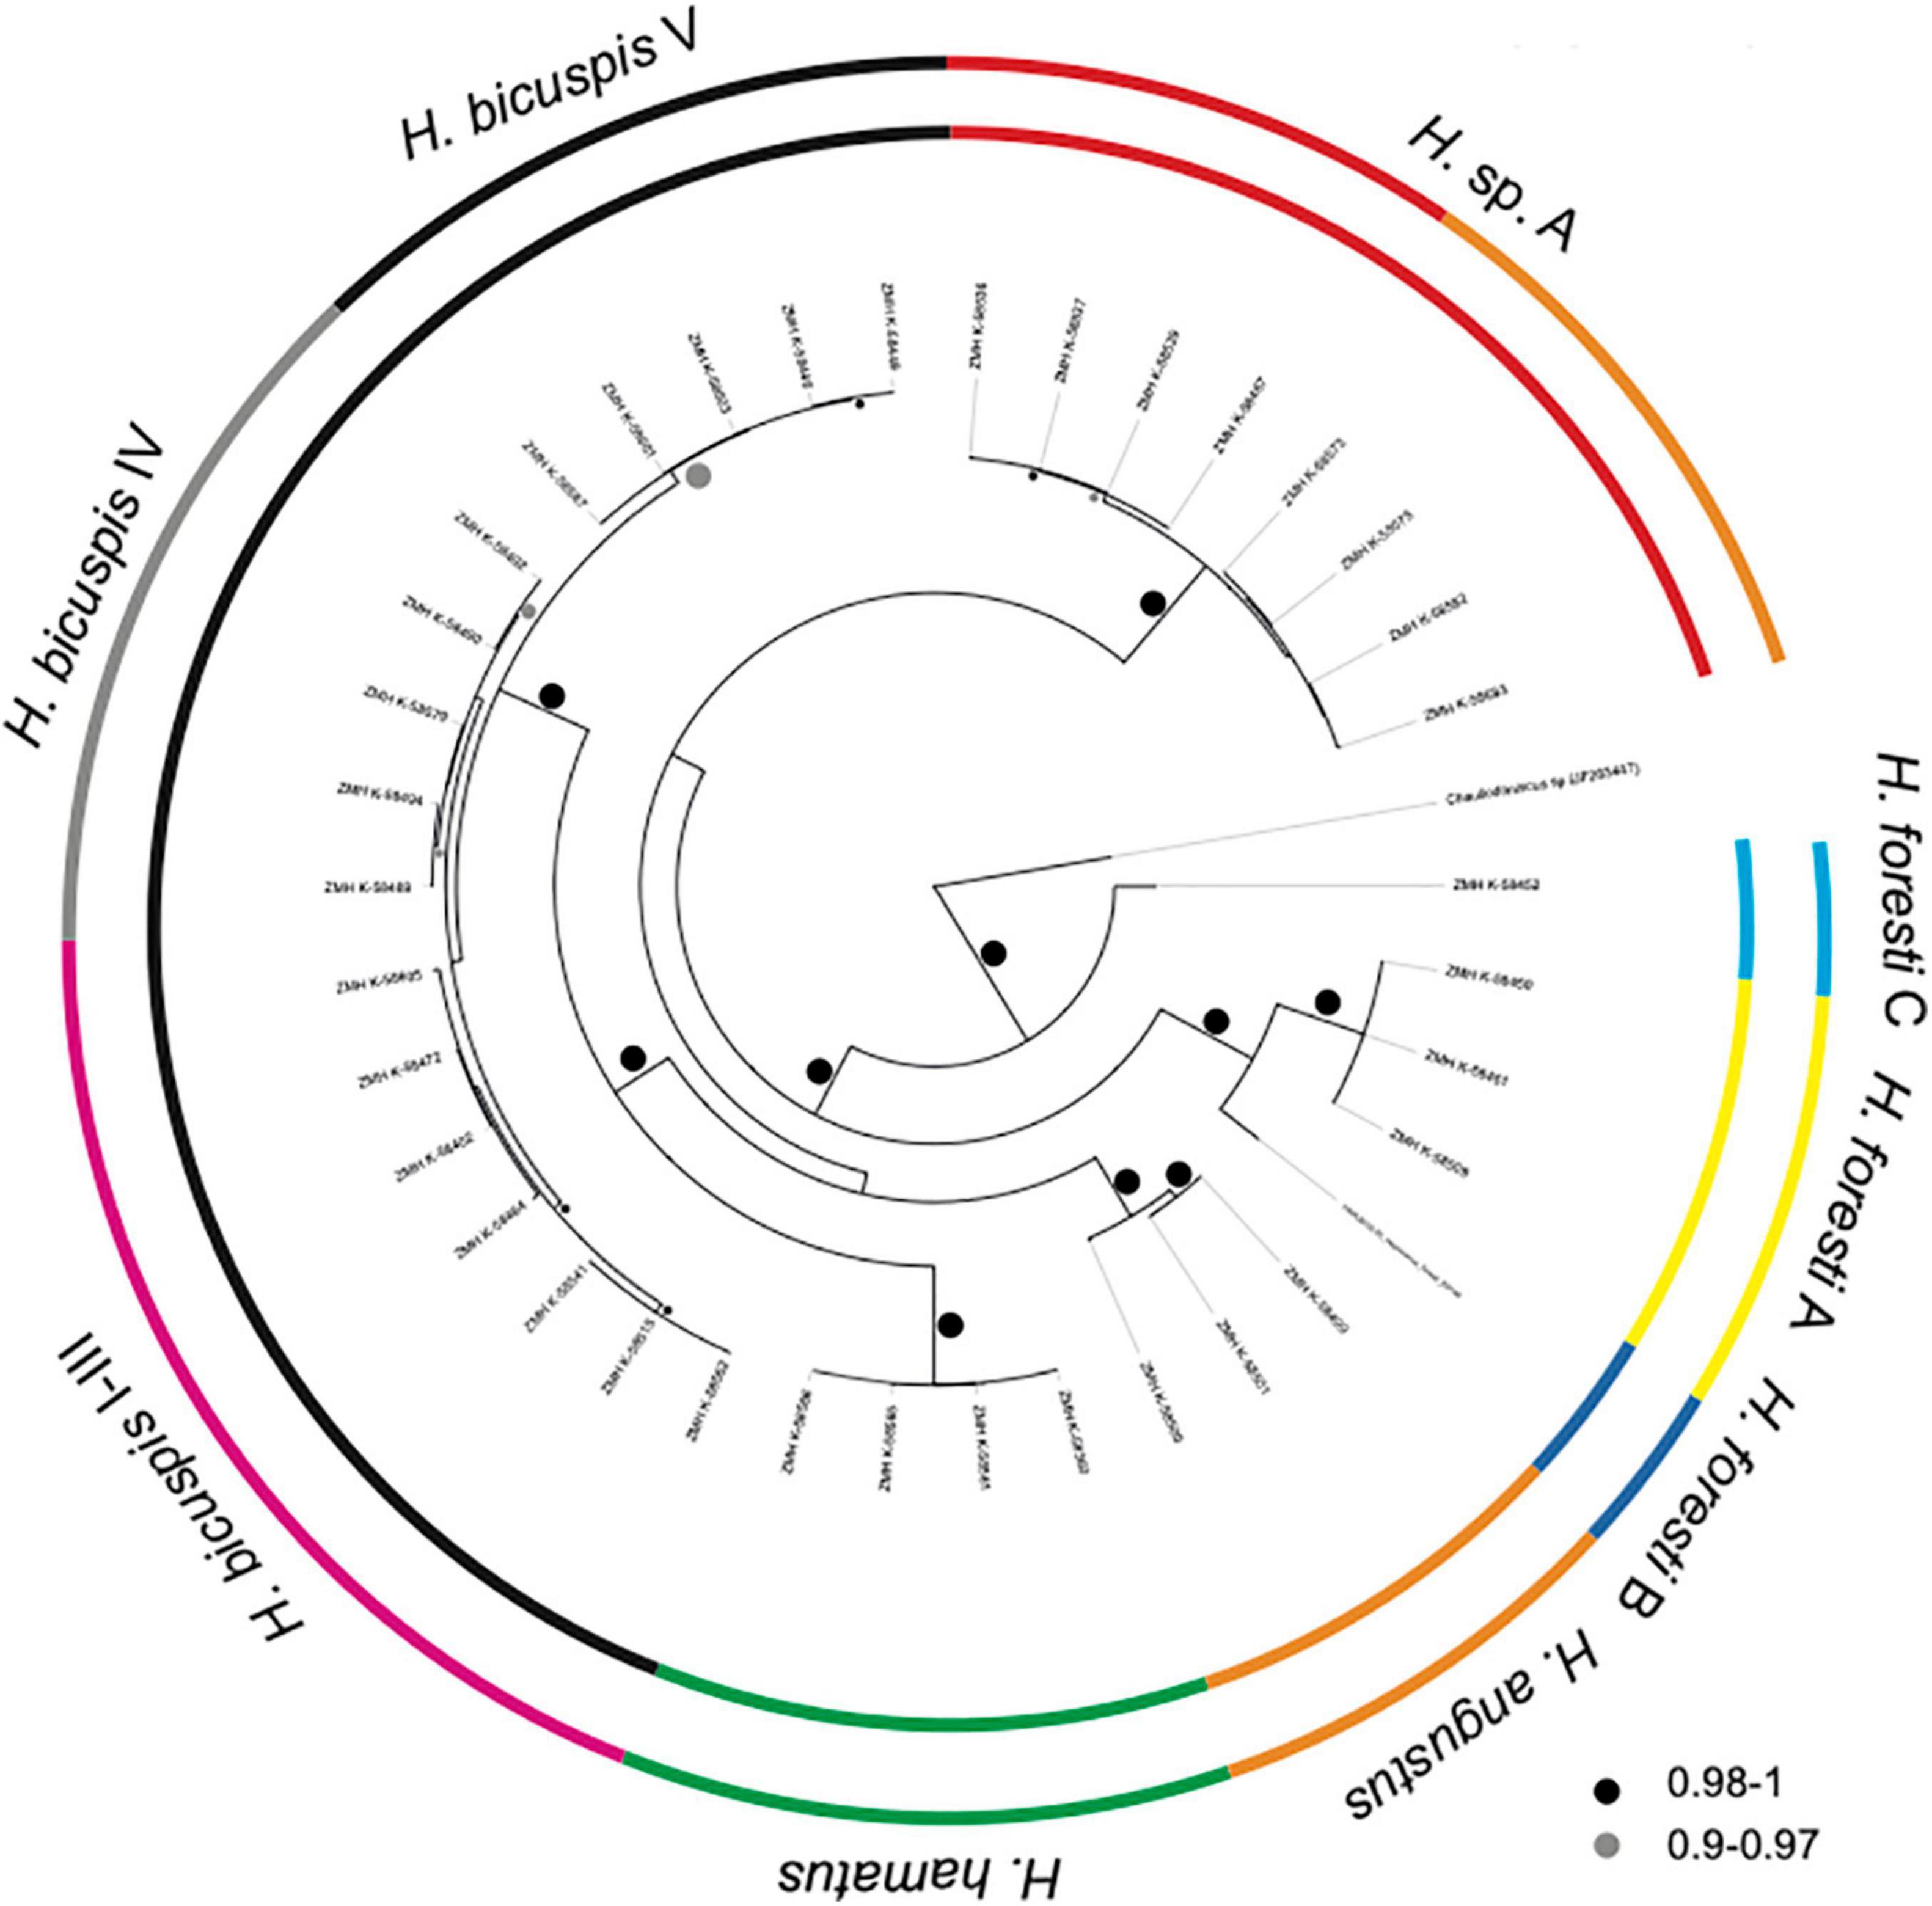
Figure 6. Bayesian phylogenetic tree of COI. Posterior probabilities are shown on branches. The colored circles show delimited putative species. The inner circle corresponds to ASAP and single threshold GMYC, the outer to multiple threshold GMYC.
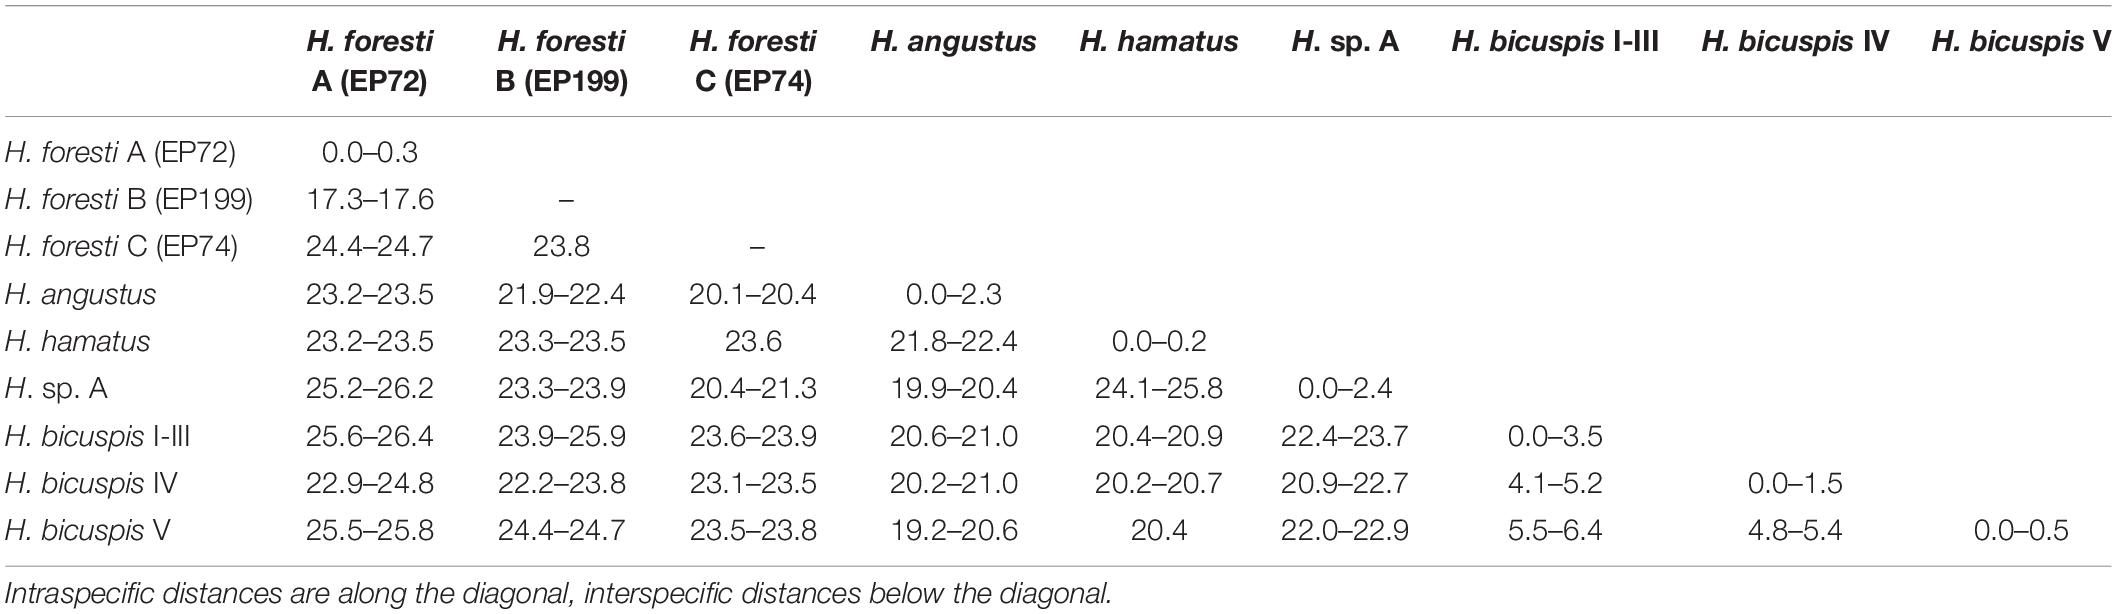
Table 1. Uncorrected COI p-distances among putative Haploniscus species.
Haploniscus foresti A and C occurred sympatrically at station 983 (South of Iceland), H. foresti B was recorded from station 106 (Reykjanes Ridge). The relatively large intraspecific distances of up to 2.3% within H. angustus were observed among specimens collected at the same station (Station 1148). The two most divergent putative species within H. sp. A did not occur sympatrically, but one occurred along the Reykjanes Ridge (Stations 106 and 137) and the other from the Irminger Sea (Station 1054; Close to the Reykjanes Ridge) to eastern Iceland (Station 1219).
Matrix-Assisted Laser Desorption/Ionization Time-of-Flight Mass Spectrometry
In total, mass spectra from 31 specimens of eight species were assessed (Figure 7A). The PCA of the raw data (Figure 7B) depicts clear differences between the different species, except for the highly similar H. bicuspis complex. Significant differences were found between all groups using a pairwise Wilcoxon test. Constraining the data toward the respective species in a RF model (OOB error = 0.03), results in a clear distinction of the different species, even for the specimens belonging to the H. bicuspis complex of which only a single specimen was misclassified within the RF model (Figure 7C). Creating RF models, leaving out one specimen for each species respectively and subsequently using this model to classify the left-out specimen resulted in 100% identification success supported by the post hoc test in all cases. None of the specimens were misclassified and no classification was recognized as a false positive by the post hoc test.
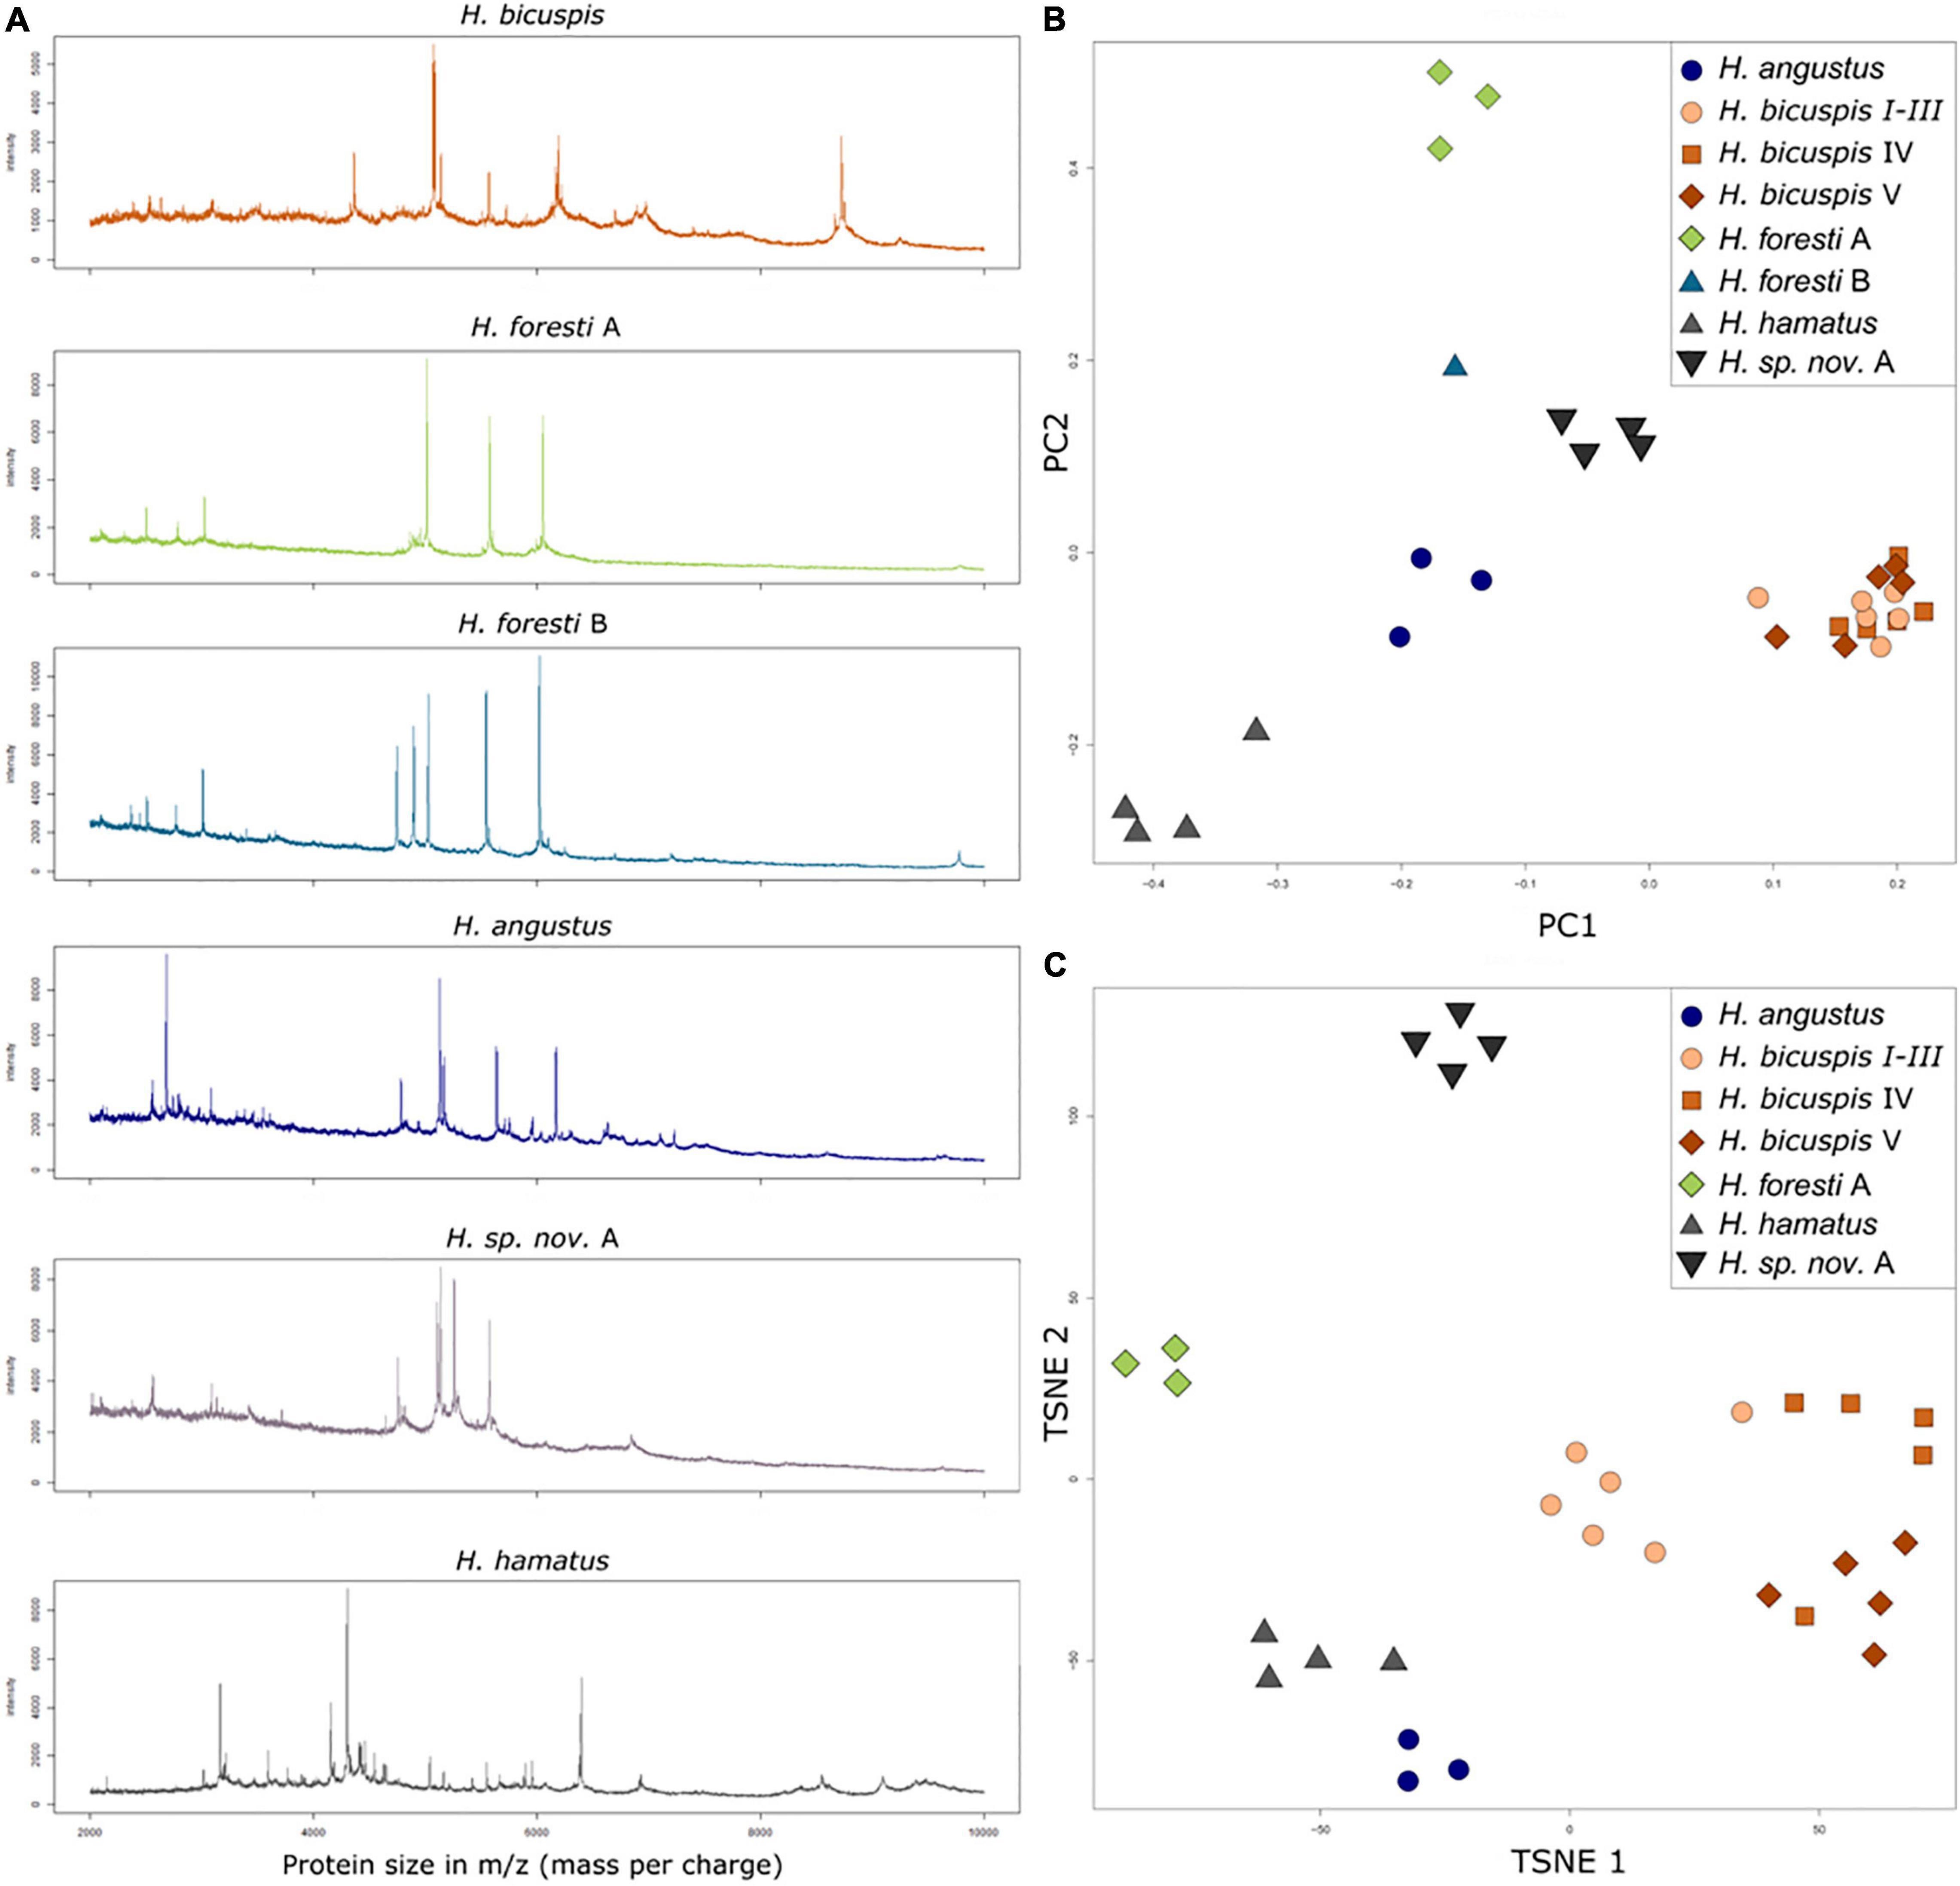
Figure 7. Results of the MALDI-TOF MS measurements. (A) Mass spectra of different species colored according to the species colors in the TSNE plots. Because of the high similarity between the three H. bicuspis lineages, only a single spectrum is shown for this morphotype. (B) PCA of the hellinger transformed raw data. (C) Rf model.
Biogeography
Geographical Distribution
Distribution maps for thirteen haploniscid species identified from the BIOICE and IceAGE samples were created in QGIS (Figure 8). Except for Haploniscus borealis Lincoln, 1985a, our data included all species previously recorded from Icelandic waters as well as Haploniscus sp. A. Where possible records of Haploniscus bicuspis were assigned to the respective cryptic species (Paulus et al., 2021), whose distribution was shown separately (Figure 9). The distribution of the three potentially cryptic species suggested for H. foresti by the genetic data was not analyzed separately as we cannot assign the various distribution records accordingly.
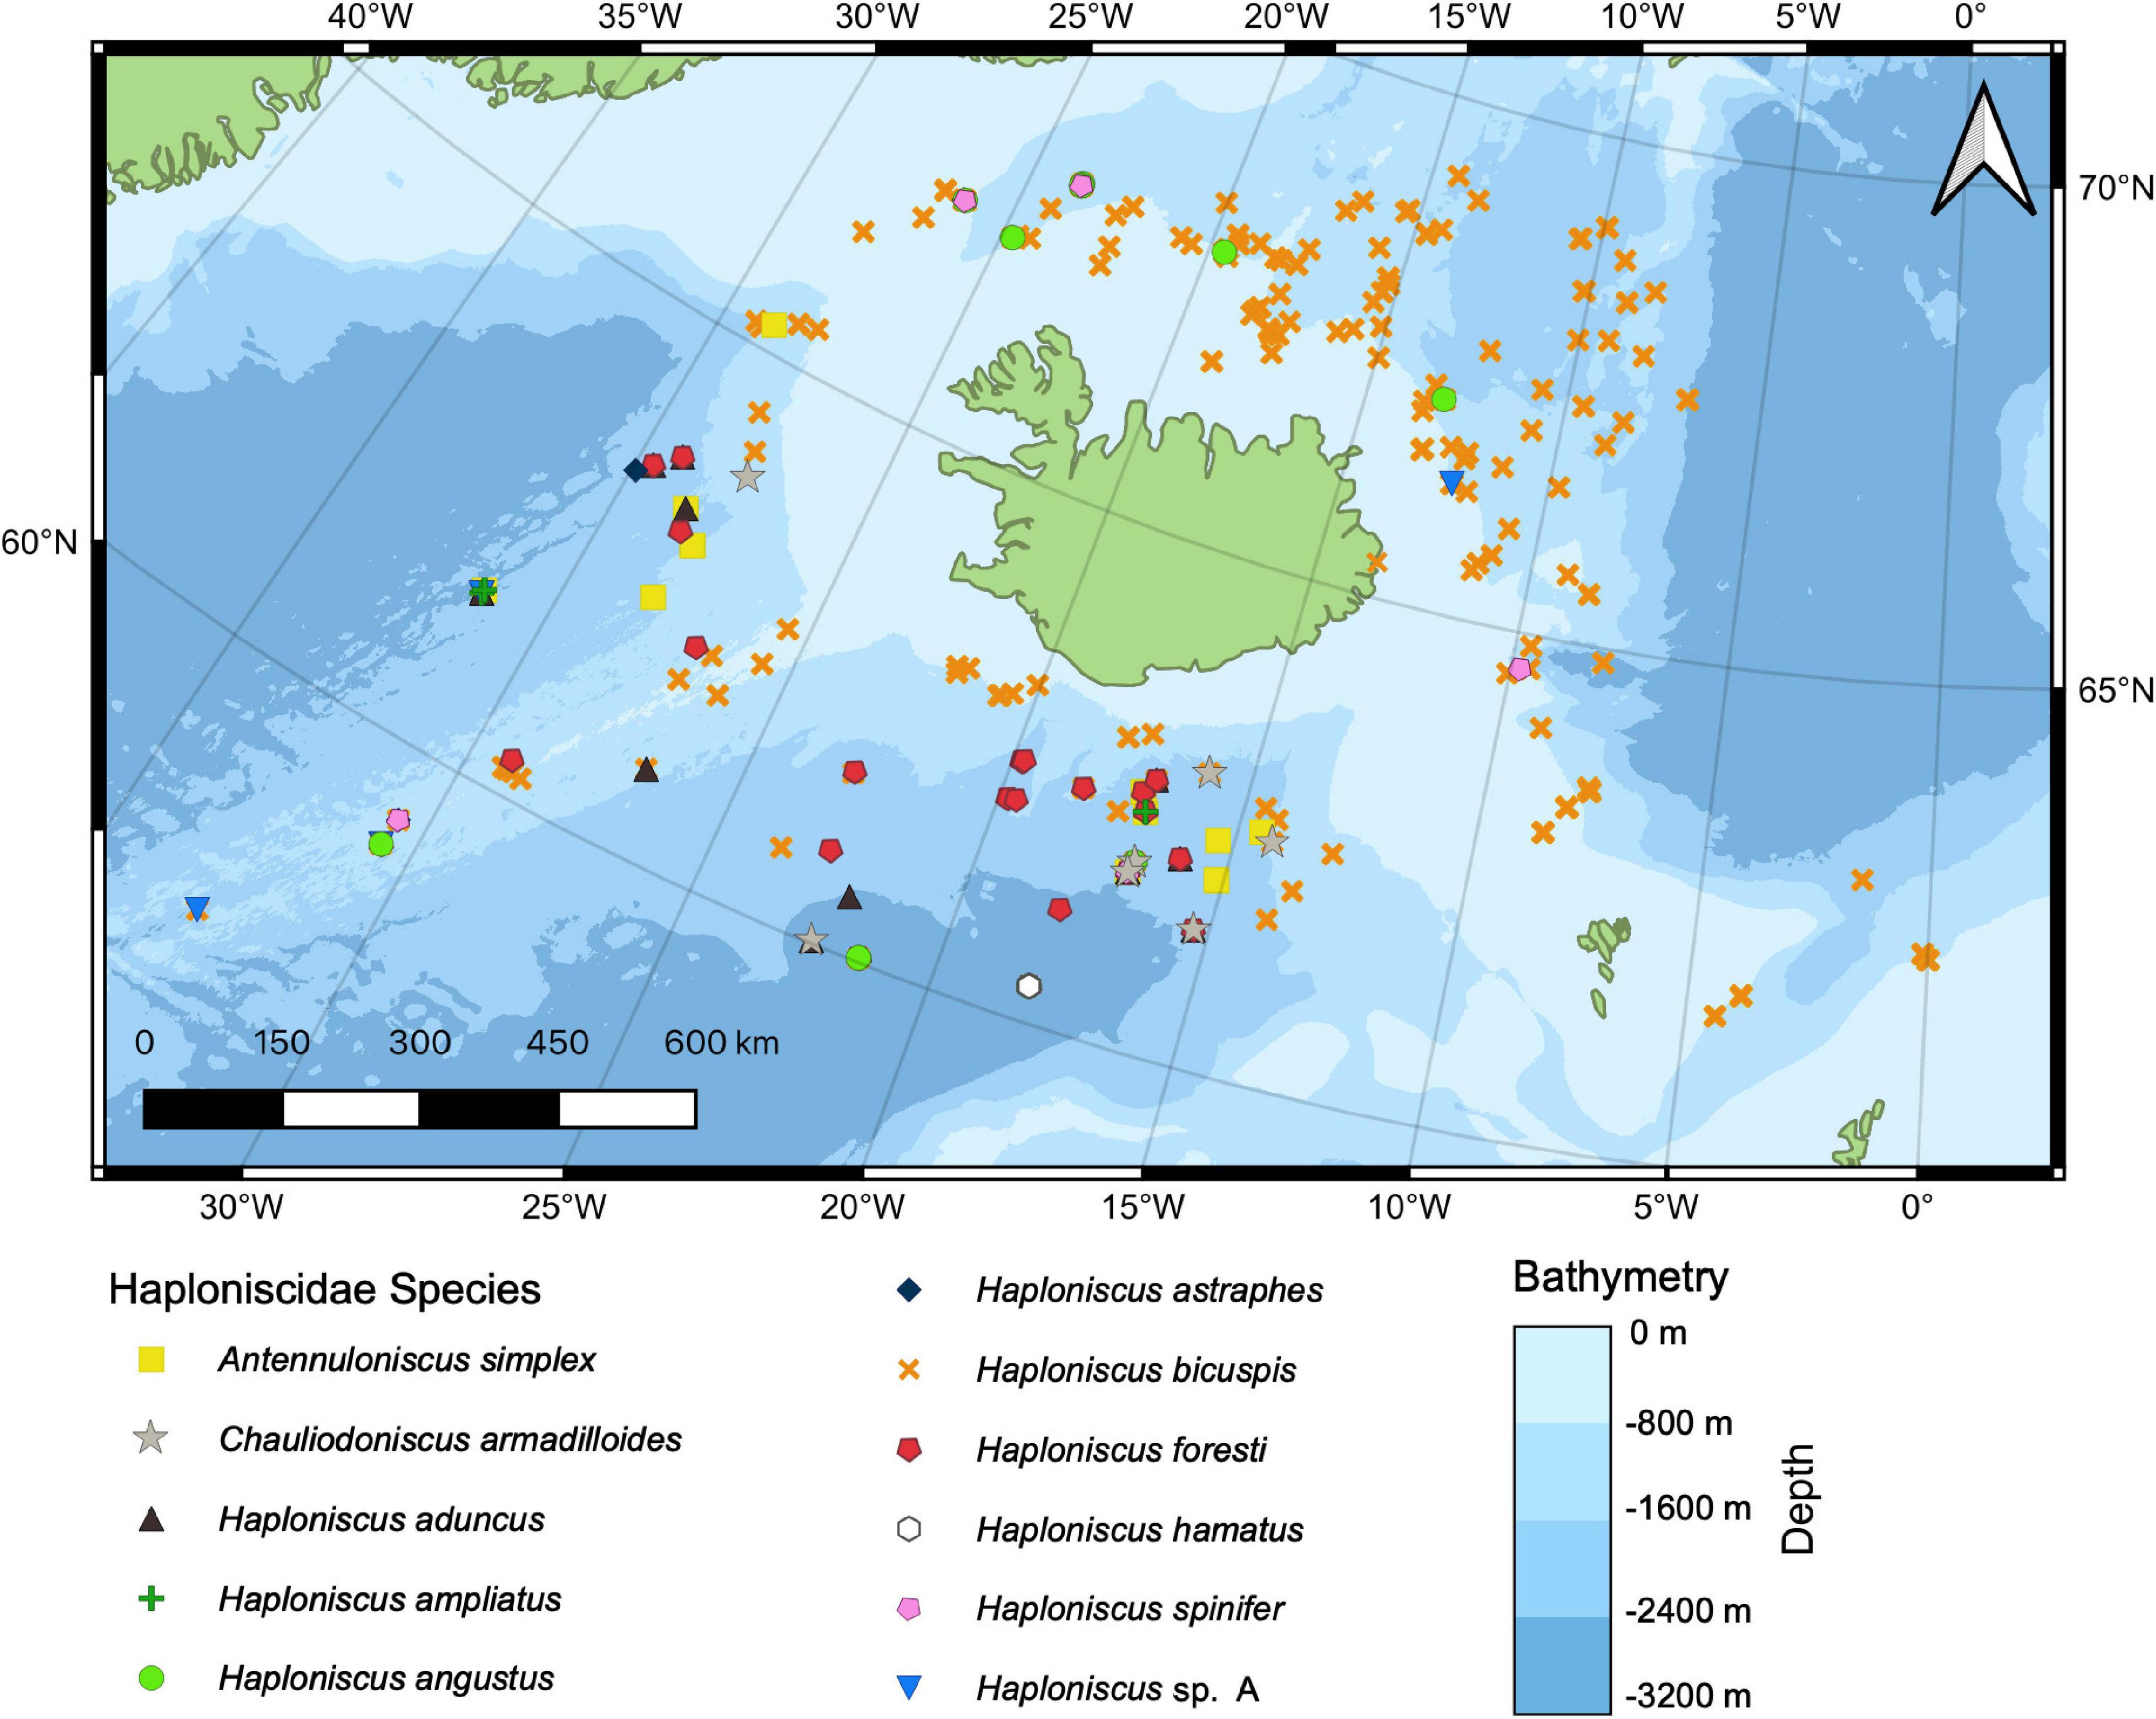
Figure 8. Distribution of all Haploniscidae species found around Iceland collected during the BIOICE and IceAGE projects (Source for bathymetry: GEBCO Bathymetric Compilation Group, 2020).
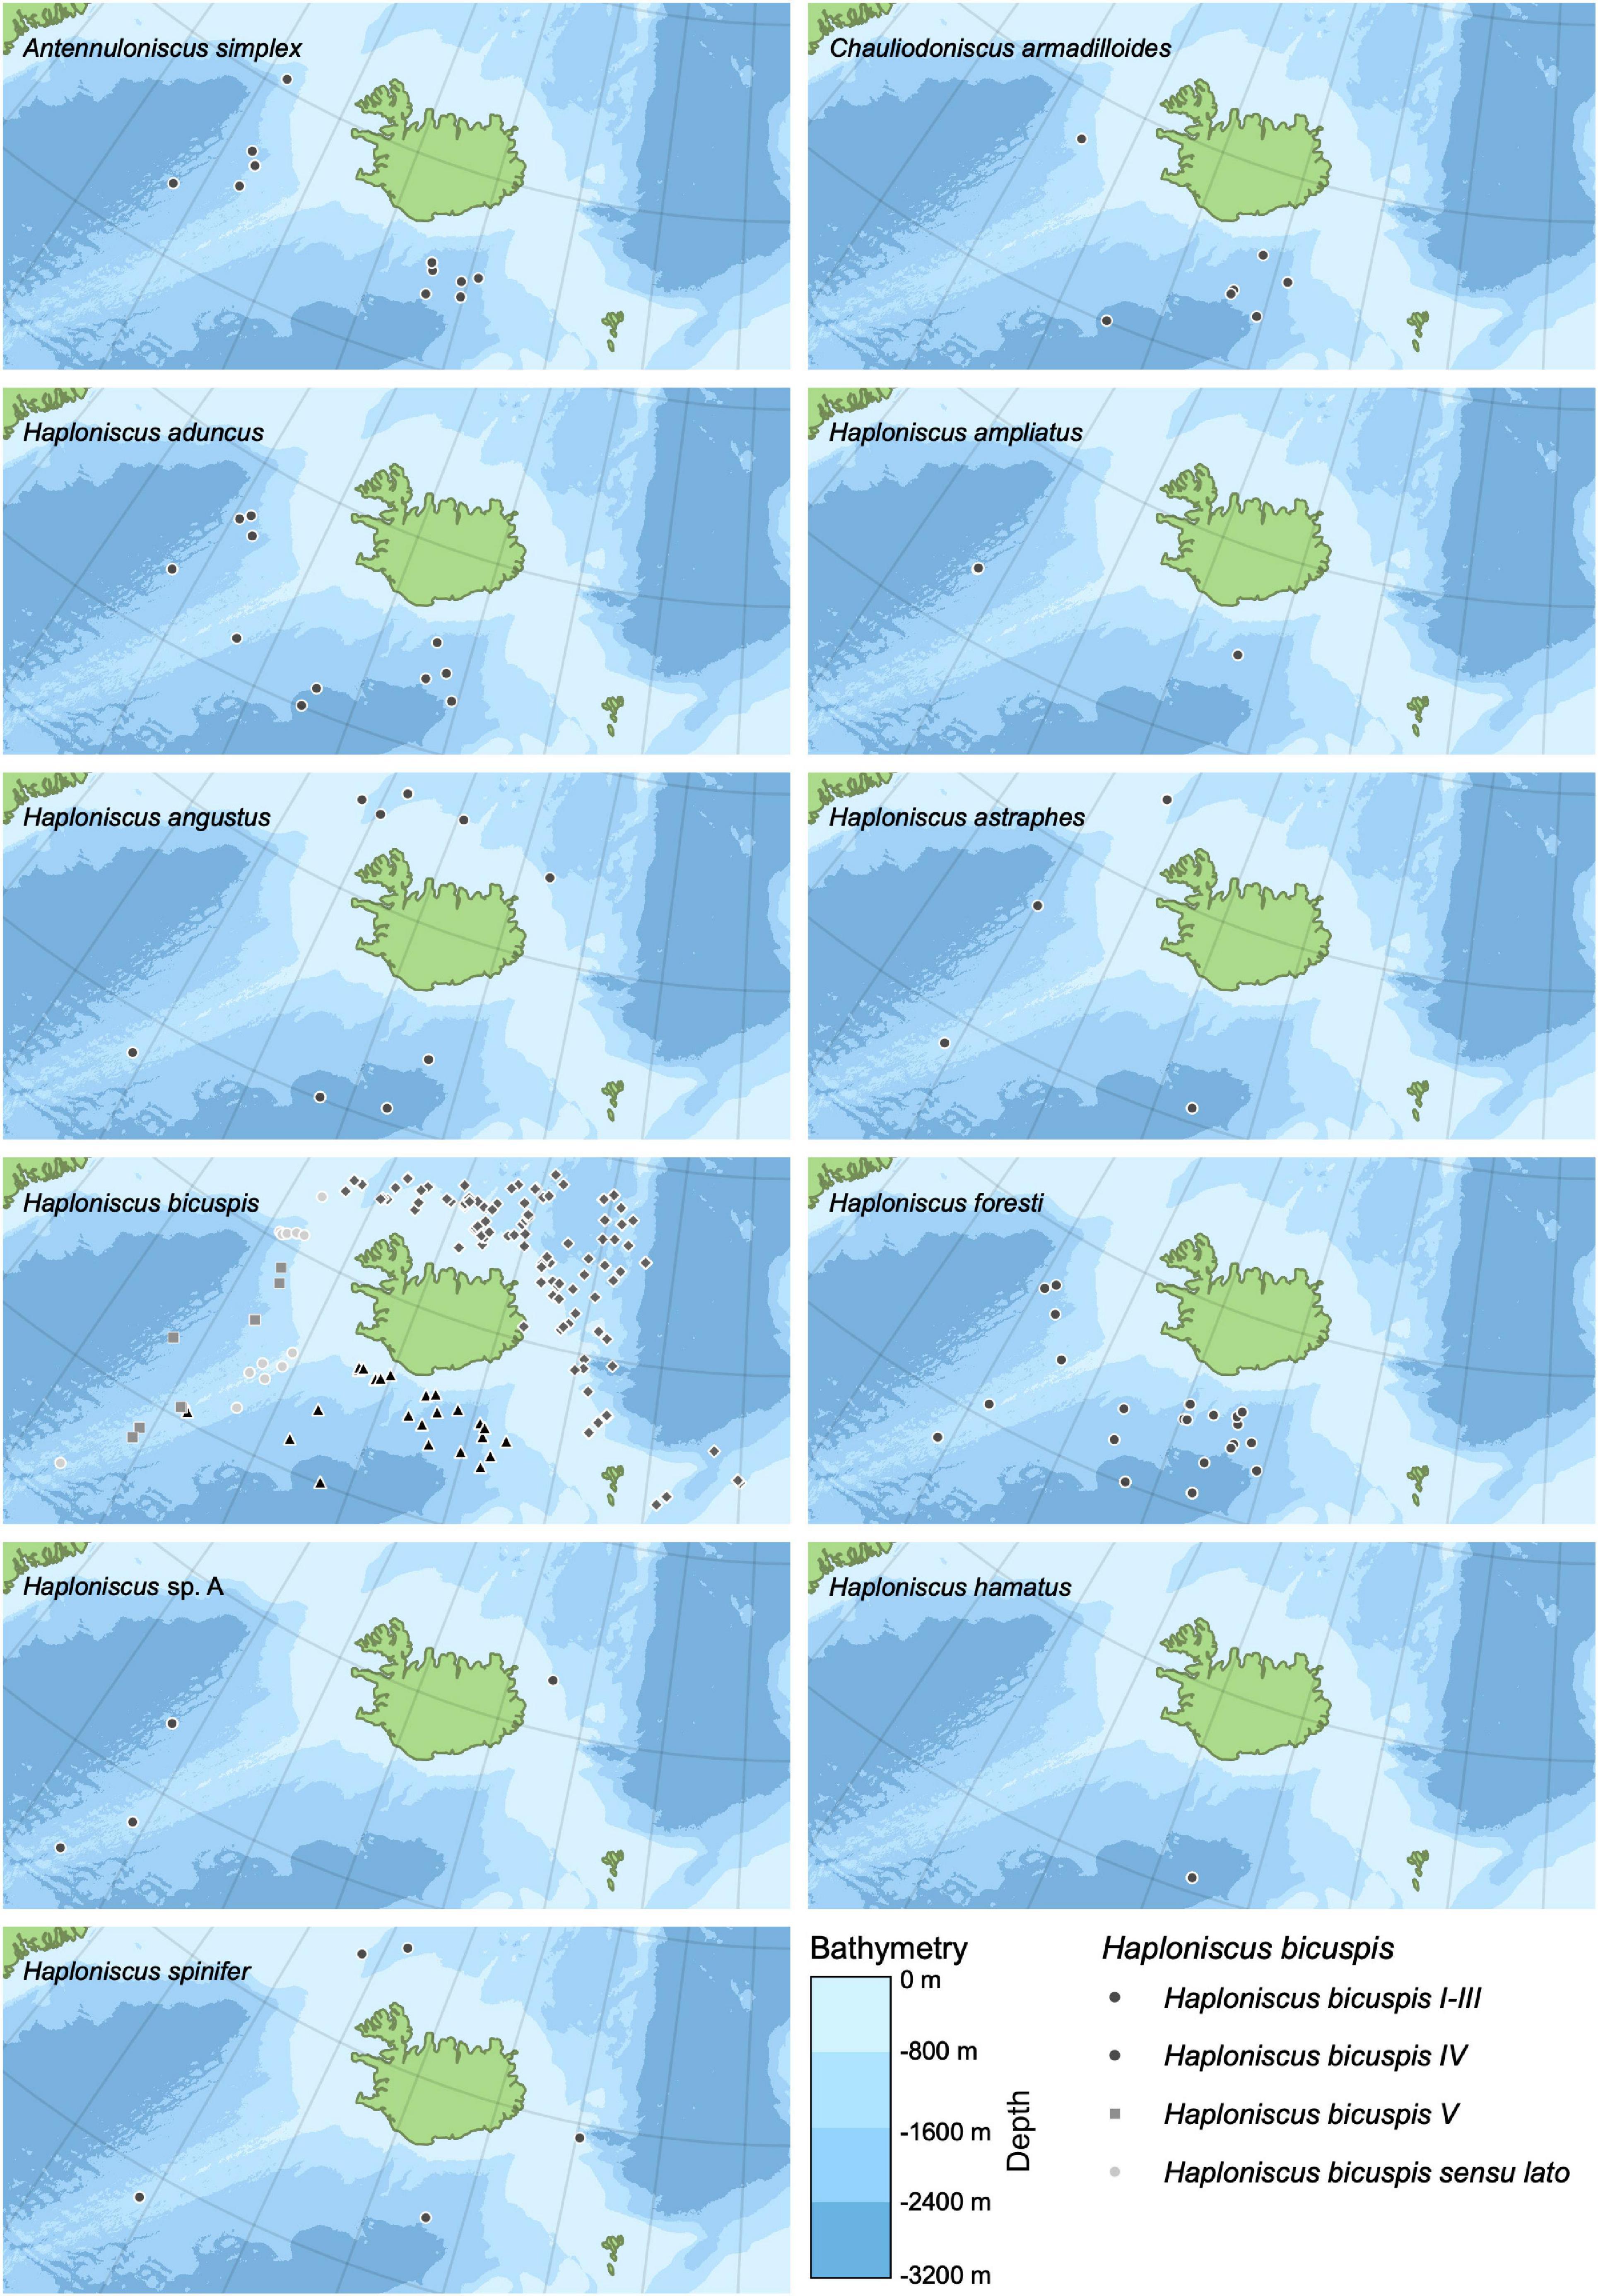
Figure 9. Distribution maps of individual Haploniscidae species found around Iceland (Source for bathymetry: GEBCO Bathymetric Compilation Group, 2020).
Only one species each of the genera Antennuloniscus and Chauliodoniscus were present, both species occurring only to the south of the GIF ridge. Within the genus Haploniscus, the distribution of seven species was restricted to either the north or south of the GIF ridge. H. aduncus, H. ampliatus, H. bicuspis IV (compare Paulus et al., 2021), H. bicuspis V (compare Paulus et al., 2021), H. foresti and H. hamatus occurred solely south of the ridge, while H. bicuspis I–III (compare Paulus et al., 2021) was restricted to the north of the ridge.
Four species showed a near-circum-Iceland distribution. Haploniscus angustus Lincoln, 1985a was present at four stations in the south as well as at five stations north of the GIF ridge and Haploniscus spinifer occurred at two stations south as well as at three stations north of the ridge. Haploniscus astraphes and H. sp. A were both found at three stations south and only at one station north of the ridge.
Bathymetric Distribution
Haploniscid species are primarily distributed at bathyal depths (Figure 10), with only one species, Haploniscus bicuspis I–III (compare Paulus et al., 2021), recorded at shelf depth (minimum depth: 64 m). Most species occur across a relatively large depth range (>1000 m), with Haploniscus bicuspis I-III exhibiting the widest depth range (64–2613 m [median: 1108 m]). In contrast, H. hamatus was bathymetrically the most restricted species, having been found between 2568 and 2670 m (median: 2619 m). Notably, species within the H. bicuspis species complex (compare Paulus et al., 2021) all show fairly broad, overlapping depth distributions (Figure 10).
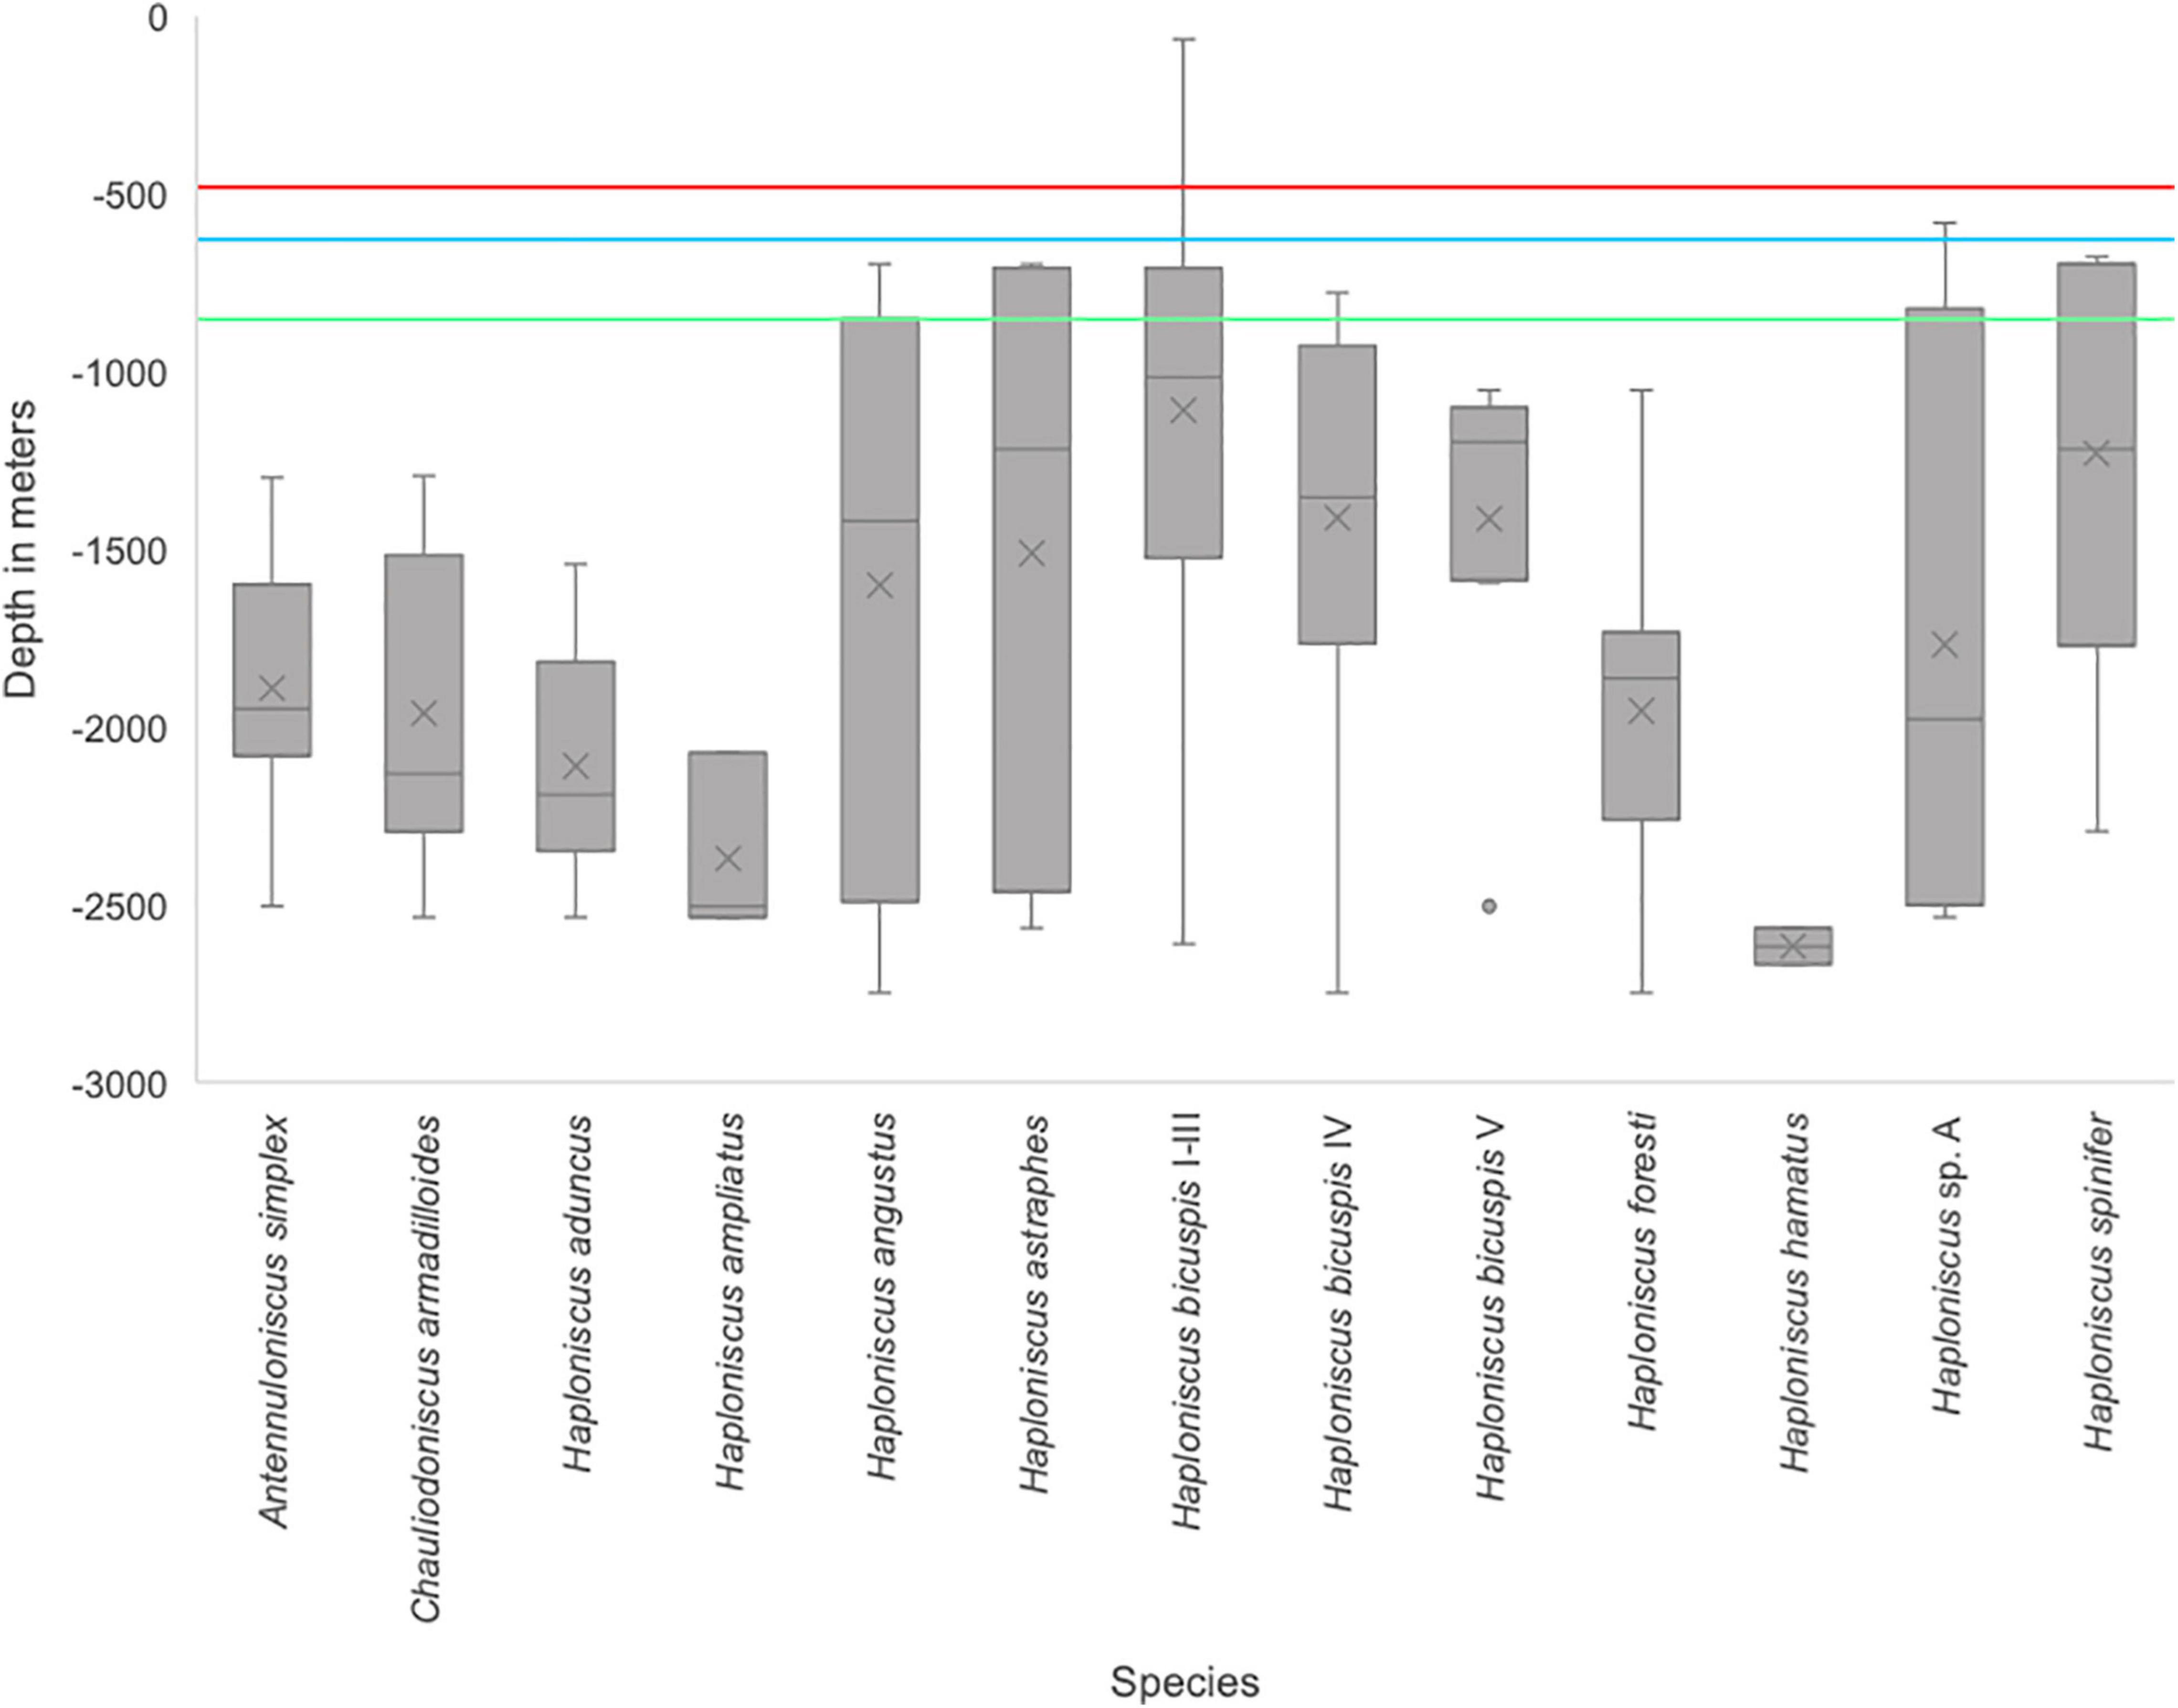
Figure 10. Depth distribution of Haploniscidae species around Iceland. The colored lines mark the deepest saddle depths: 1) in the Faroe Channel at 840 m (green line), 2) between Greenland and Iceland at 620 m (blue line), and 3) between the Faroe Islands and Iceland (red line). Depth lines are implemented following the information Hansen and Østerhus (2000) and Brix and Svavarsson (2010).
Species found only in the south of the GIF ridge and those found north of the ridge showed some differences in bathymetric distribution; most southern species (A. simplex, C. armadilloides, H. aduncus, H. ampliatus, H. bicuspis V, H. foresti and H. hamatus) were only found in a depth deeper than 800 m, except H. bicuspis IV which is present between 778 and 2850 m (median: 1412 m). In contrast, H. angustus, H. astraphes, H. bicuspis V, H. spinifer and H. sp. A, whose distribution is either limited to the north or that occur on both sides of the ridge, can also be found above 800 m.
Species Distribution Models
The prediction of the probability of occurrence of the species in geographic space is shown in Figure 11. Probabilities below 0.5 are considered “absence” and are not shown. The models show that four of the species, viz. A. simplex, H. aduncus, H. foresti (here the three potential cryptic species were not treated separately) and H. bicuspis IV, are sympatric having their main distribution in deep waters in the Icelandic basin, but they slightly differ in the probability of occurrence in the Irminger Sea. Only H. bicuspis I-III shows a clear preference for areas influenced by the colder deep-waters in the Iceland and Norwegian Seas.
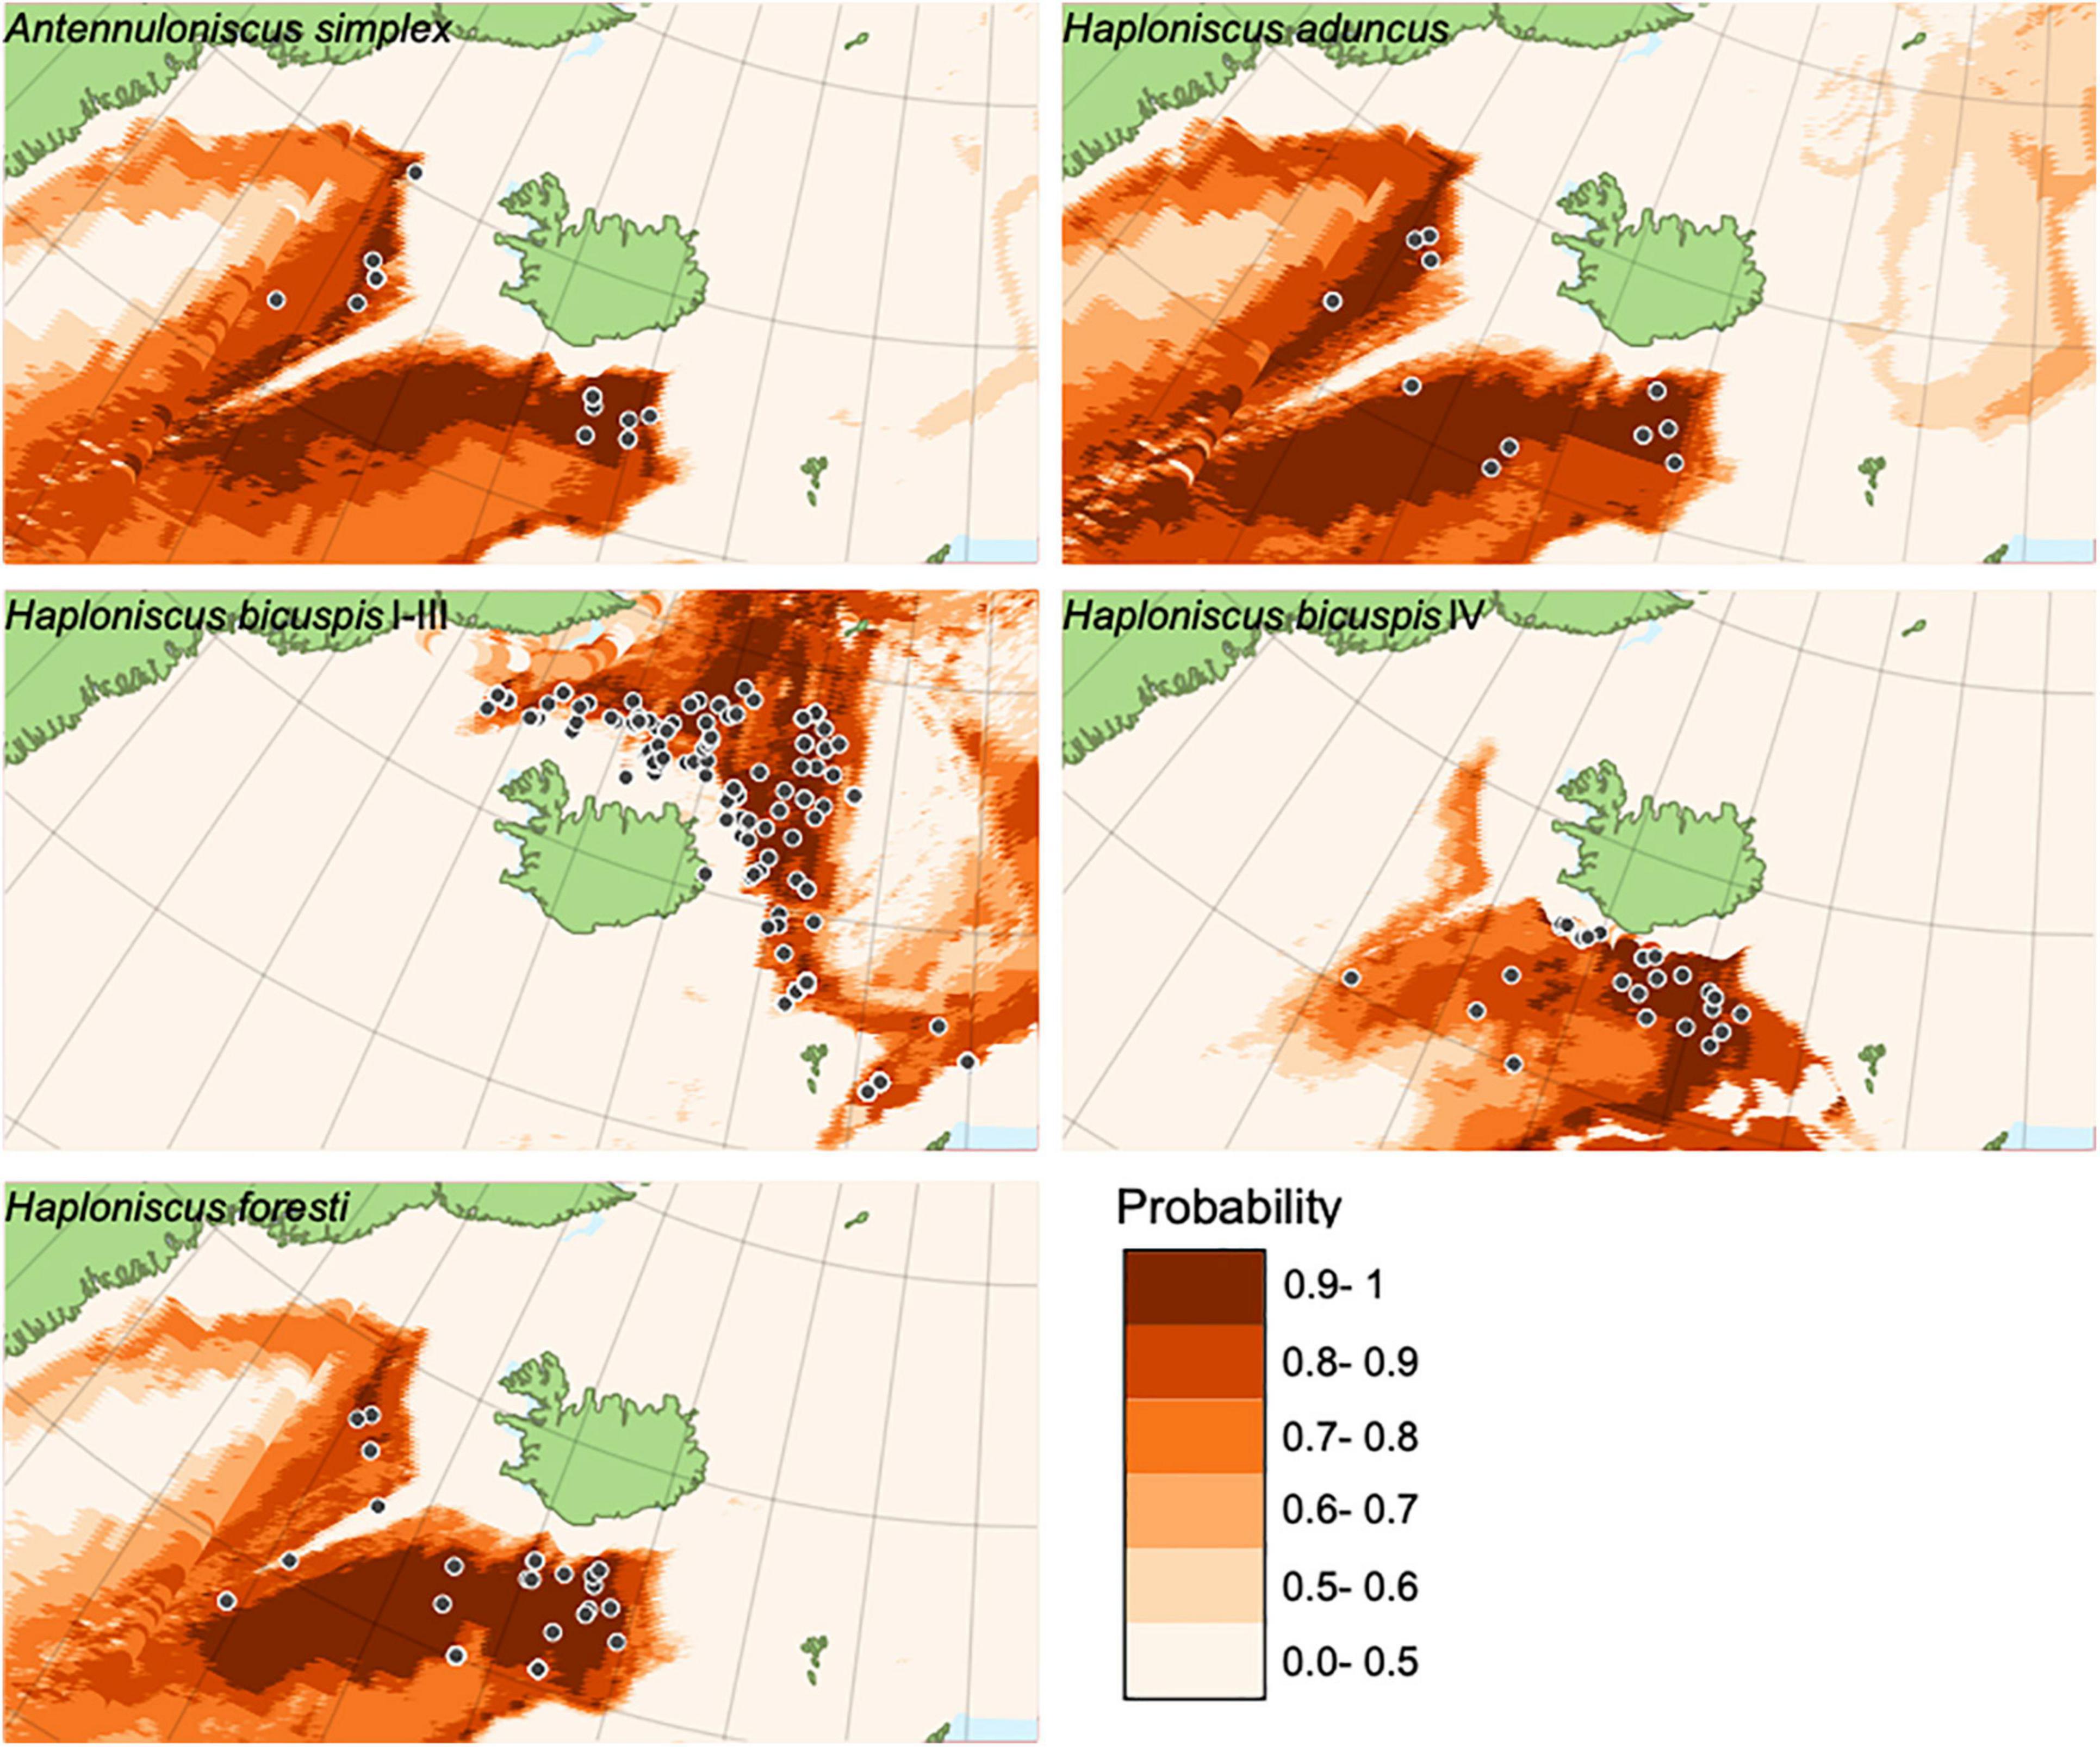
Figure 11. Statistically significant species distribution models of Haploniscidae species around Iceland.
Model accuracy is shown in Table 2. The prediction error is larger for the class “n” (absent) and is relatively low for class “y” (presence). This results in a relatively high combined error for the model, which is however, not compromising accuracy for presence. In other words, the models are failing to predict where the species is truly absent.
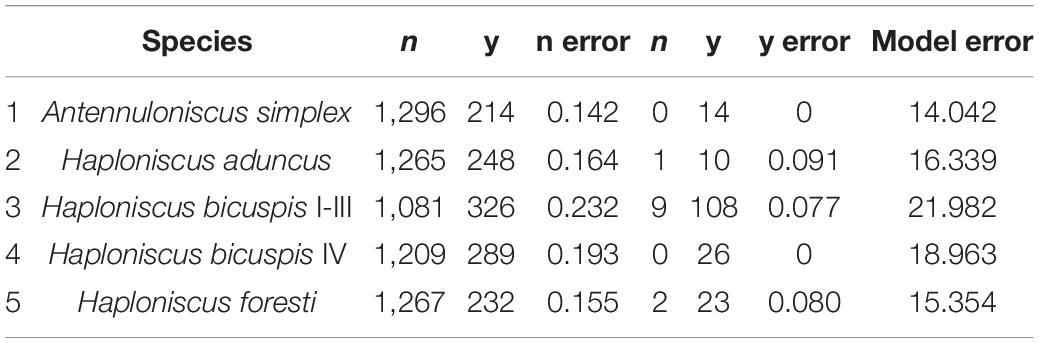
Table 2. Model accuracy.
Discussion
Progressive destruction and/or transformation of deep-sea ecosystems and associated loss of biological diversity has raised concerns about the consequences for overall ecosystem functioning (Danovaro et al., 2008). Concomitantly a call for sustainable use of the services provided by the deep sea (Armstrong et al., 2012; Thurber et al., 2014; Glover et al., 2018). Deep-sea ecosystems and fauna found around Iceland could be significantly impaired primarily by climate-related changes (Arnason, 2007; Astthorsson et al., 2007). Mitigating and managing the impacts of such changes on the marine environment, however, requires broadening of taxonomic knowledge in order to identify patterns and drivers of diversity, forecast potential alterations of the deep-sea environment, and ultimately inform marine spatial planning (Howell et al., 2020). Correct identification of the species is central to achieving this, but often poses a challenge when dealing with deep-sea samples.
Interactive keys have proven to be a valuable tool to aid species identification of Icelandic haploniscids. Originating in the 1970s, interactive keys using Descriptive Language for Taxonomy (DELTA) methodologies as an instrument for identifying species are not new (Dallwitz, 1974), but their use in deep-sea taxonomy has thus far been rudimentary (Saucède et al., 2021). Overall, there is a paucity of any type (paper or digital) of identification key and guide in general3 and for deep-sea taxa in particular (Miljutin et al., 2010; Gollner et al., 2014; Bergmeier et al., 2017); instead, identifications are mostly based on descriptive works that are distributed throughout the literature (cf. Glover et al., 2021). This makes the identification process on the one hand arduous and lengthy, and on the other hand exclusive, since non-experts are not familiar with or have no access to often historical monographs. In addition, these historical monographs are often inadequately illustrated, further hindering easy species identification. Yet, given the increasing human pressures on the deep sea, the need to generate important biodiversity information is currently enormous. At the same time, the number of professional taxonomists performing this vital task is declining. As an antidote, non-experts could increasingly be called upon to identify species (Langenkämper et al., 2019; Saucède et al., 2021). To this end, it is also critical that increased efforts are made to develop keys, particularly those that are easy to use and access, such as interactive keys deposited in open repositories. Accompanying this, taxonomic efforts to describe species from the deep sea should be intensified by trained taxonomists, since only what we know can be preserved (Glover et al., 2018).
Both traditional and interactive keys, including those created in this paper, are based on formal species descriptions (e.g., Drinkwater, 2009). The applicability of these keys therefore strongly depends on the level of known and described biodiversity in the area for which they were created. Around Iceland, the deep-sea isopod fauna is considered to be relatively well known (Brix et al., 2018) and the assumption was that most species should therefore be easily identifiable with the generated key. When creating keys for taxa in other deep-sea areas, the situation is different. In these areas, typically a high percentage of undescribed crustacean species is expected (e.g., Poore, 2008; Poore et al., 2015). Here, created keys would be less applicable, as these undescribed species would not be contained in the key and thus naturally not be identifiable. However, this would also be the case with conventional dichotomous keys. In fact, where a major advantage of interactive keys over conventional keys comes into effect as these keys have been proven to be highly customizable. This is particularly important for deep-sea crustaceans, where much of the fauna is unknown (Appeltans et al., 2012). Indeed, interactive keys can keep pace with the dynamics of continuous new species discoveries (and descriptions) as well as a changing taxonomy (through revisions), as these can be expanded and added to rather swiftly (Coleman et al., 2010). However, this presupposes that the keys are publicly accessible (e.g., on a website provided for this purpose), easy to find (e.g., advertised on commonly used taxonomic websites) and that the necessary capacities are available to maintain them over the long term (Coleman and Radulovici, 2020).
Lately there have been numerous initiatives to bring taxonomy to the web and thus make it accessible to a wider public. Among these efforts, EDIT (European Distributed Institute of Taxonomy4), CATE (Creating a taxonomic e-science, Godfray et al., 2007) and Scratchpad5 deserve special mention. The advantage of these services is that they are backed by institutes that guarantee that the infrastructure remains in place for the long term and can be brought up to date. Web-based services that are provided by individuals often lack the manpower to consistently renew their content and make it sustainable (Coleman and Radulovici, 2020). An example of this is crustacea-net6 of the Australian Museum, Sydney, which has provided interactive keys for numerous crustacean taxa, yet its owner is now retired and the project is currently not being continued (Coleman and Radulovici, 2020). For deep-sea taxa, the World Register of Deep-Sea Species (WoRDSS) collects (traditional and interactive) keys and relevant literature that help in species identification, which now contains records from more than 600 publications – yet with a notably very low representation of sources for isopods (Glover et al., 2021). There are also individual researchers behind WoRDSS, but it is linked to the World Register of Marine Species (WoRMS, WoRMS Editorial Board, 2021), providing a catalog of all marine species names. As it is supported by the mass of deep-sea taxonomists, it is likely to be carried forward. Through this type of web-based taxonomic projects, a variety of other meta information could be added to complement species identification, including biogeographical, ecological, and collection data, as well as images and sketches (Farr, 2006). The latter would facilitate the exchange of data between researchers on undescribed species, as this is the case in many deep-sea regions, and thus facilitating taxonomic intercalibration (International Seabed Authority [ISA], 2020; Lins et al., 2021). In practice, one could imagine integrating undescribed species based on preliminary identifications into interactive keys (cf. Yamasaki et al., 2020), whereby the identifications are certainly not robust, but would help immensely in solving problems of species identification in highly diverse deep-sea areas. Since many interactive keys not only offer a web-based user interface, but also an offline version for download (such as Intkey), they are flexible enough to be used in the field or on a research vessel, regardless of internet access.
Interactive keys have a number of further assets compared to conventional dichotomous keys, which can also be advantageous in a deep-sea context. For example, the identification process does not require a strict order of the identification features. Instead, the user can freely choose the sequence of the determination characters and avoid those which are either unclear to the identifier or that are simply not present because specimens are damaged (Dallwitz, 2018). This is especially important when recruiting non-experts for species identification as they tend to have difficulties in recognizing described identification features. In addition, the use of interactive keys can be more efficient compared to dichotomous keys, as programs, such as DELTA, can autonomously specify the most suitable identification features (Dallwitz, 2018), and thus the user is able to choose the identification character that will identify individuals most quickly. In some cases, this can be tied to just one diagnostic character, for example in Haploniscus hamatus the unique, trapezoid head shape.
In general, a sensible selection of the identification features influences the applicability of interactive and binary keys equally. It is desirable to utilize conspicuous determination features that are retained even after rough sampling of the animals; fragile crustacean specimens in particular can lose appendages when retrieving samples from greater depth and subsequent sample processing. Therefore, determination features that can break off easily, such as antennae or legs, are often unsuitable, since damaged or missing determination features can lead to the identification in traditional keys being aborted. On the other hand, some flashy characters harbor the risk that crucial but less conspicuous features for species identification could be overlooked. Within Desmosomatidae, Eugerdella serrata Brix, 2006, for example, a pronounced jagged rostrum is present, with this feature enabling identification from several oceans (Brix, 2006; Lörz et al., 2013; Kaiser et al., 2021). But it is now clear that it represents a complex of species, containing at least two (Brix et al., 2018), but probably even more species. The Haploniscidae family is morphologically very conservative, and often only subtle differences are decisive in distinguishing between species and genera (Park, 2000; Brökeland, 2005). Here, in particular, the overall body form and the shape of the rostrum were emphasized as valuable diagnostic features for intraspecific delimitation and identification (Brökeland and Raupach, 2008). Further characters, such as setation patterns of pereopods or uropods have been also studied to deduce intraspecific differences, but these are often not useful as segregating characters in identification keys, as they are not visible at first glance and setae are often broken off (Brökeland, 2005). We have therefore tried to strike a balance between the practicality of the keys in the sense of easily recognizable features and those that are robust and constant within a species. Therefore, for haploniscid taxa in this study, preferably habitus characteristics and the shape of the rostrum were used to distinguish genera and species within Haploniscidae.
Interactive keys reach their limits in similar places as conventional keys but can partially counteract them. For example, many traditional keys only focus on female characters, which is largely due to the fact that female isopods are more prevalent in the deep sea, and male descriptions are often lacking (Riehl et al., 2012; Kaiser, 2015). In addition, there is a strong sexual dimorphism encountered in many isopod families (incl. Haploniscidae), with males and females differing greatly in certain features (Riehl et al., 2012); in Haploniscidae this is, for example, expressed in the form that in males the second antenna is more robust and setose, and pleotelson processes are more distinct (Park, 2000; Brökeland, 2010; Paulus et al., 2021). As a result, many of the original species’ descriptions only describe the female, since the male, if any, was difficult to assign and, therefore many identification keys are ultimately better suited to identify female individuals.
The identification keys produced here were based on gender-neutral characters, where a description for both sexes was available. With the help of this, however, it was not possible to identify males and females in the same way if they exhibit strong sexual dimorphism or even different male stages (such as within Haploniscus bicuspis, cf. Paulus et al., 2021). So, it becomes clear that using interactive keys, despite its flexible nature, would not solve the problem of identifying highly sexually dimorphic species. The same applies to ontogenetic dimorphism and the identification and differentiation of potentially cryptic species or severely damaged specimens. Many interactive keys for Crustacea, including the ones presented in this paper, are only able to identify adult individuals (e.g., Dallwitz, 2021). This is because of differing determination features depending on the developmental stage of the animals (e.g., Hessler, 1970; Wilson et al., 2011). The result could be misidentification or termination of the identification process. While there have been few studies on selected species on how the various ontogenetic stages differ (e.g., Hessler, 1970; Brökeland, 2010; Riehl and Kühn, 2020), and these characteristics could easily be fitted into an interactive key, ultimately there is often not enough material from deep-sea samples to investigate this in greater detail.
Molecular approaches, such as DNA barcoding, are a great tool to identify individuals which cannot be easily determined with morphological characters, for example in juveniles, species with strong sexual dimorphism or damaged individuals. The identification of known species requires that DNA sequences of the respective species are available. DNA barcoding can further assist in the delimitation of hitherto unknown species by revealing genetically highly divergent lineages, which might correspond to (cryptic) species new to science.
Our molecular-genetic analysis of the haploniscids consistently separated all of the morphologically identified species from each other, and further uncovered a number of cryptic species, notably within H. foresti and H. bicuspis (see also Paulus et al., 2021), as well as to delimit the newly discovered species within Haploniscus (sp. A).
Similar to COI barcoding, MALDI-TOF MS can help in the identification of those animals which are difficult to determine with interactive keys alone. In our data proteomic fingerprinting further supported the distinctiveness of H. bicuspis (see also Paulus et al., 2021). Nearly all of the genetically suggested species, including the cryptic species of H. foresti, differed distinctly in their proteomic spectrum as well. However, differences between the putative species of H. bicuspis were very small and referred to a recent speciation process of this complex (Paulus et al., 2021). In a classification test, all specimens were classified correctly, showing the use of mass spectra for specimen identification. These results are in concordance with previous studies showing the high success of proteome fingerprinting in metazoan specimen identification on taxa such as fish (Mazzeo and Siciliano, 2016; Rossel et al., 2021), insects (Dieme et al., 2014; Raharimalala et al., 2017) or other crustaceans (Bode et al., 2017; Rossel et al., 2019; Renz et al., 2021). Overall, MALDI-TOF MS seems to be a promising fast and low-cost tool for the identification of deep-sea isopods. However, reference spectra need to be available to facilitate good identification success especially for highly similar groups such as the different H. bicuspis lineages. It can be worthwhile to create internal databases with mass spectra for species from a defined area, especially for ongoing projects such as IceAGE.
In addition to the morphological and molecular approaches, analyzing geographical and depth distribution may provide further indications for correct species identification. This is because the distribution of benthic species around Iceland is strongly influenced by water mass properties, depth and topography, and here in particular by the GIF ridge. The latter is a major obstacle for marine invertebrates due to topographic constraints and confluence of different water masses (e.g., Svavarsson et al., 1993; Weisshappel and Svavarsson, 1998; Jöst et al., 2017; Lörz et al., 2021). This probably applies in particular to brooding taxa such as isopods, which do not have a swimming larval stage and are therefore likely to have limited dispersal capacity (Pearse et al., 2009; Brix et al., 2020). Although we recognize that this could be a circular argument, since the true geographic distribution of many deep-sea species is unknown, we have derived the assumption from the foregoing that the isopod species would be confined to a certain depth or geographic area. Hence, we could, for example, deduce a possible identification error from an unusually large geographic or depth distribution, which will need to be further assessed using an integrative taxonomy. Overall, distribution patterns helped to predict species entities to some extent, including the example of H. bicuspis I–III occurring north of the GIF ridge from the remaining putative species occurring only south of the ridge. However, there were many overlapping distributions both geographically and bathymetrically (Figures 8–10), which therefore did not aid species identification. Furthermore, distribution patterns of some species raise the question of whether they are not actually two species; for example, Haploniscus angustus and H. spinifer both have records north and south of the GIF ridge. Unfortunately, no species records of any of these two species from the north and south of the ridge are included in our molecular data to refute or confirm this hypothesis. In view of their depth distribution, there would be at least the possibility for both species to cross the GIF ridge at its deepest point (i.e., the Faroe channel at 840 m, Figure 10).
Finally, it was investigated whether species can be better differentiated from one another and thus identified using species distribution models. The underlying assumption here was that each species occupies its own niche space, which is defined by a certain set of environmental variables. The models presented here suffer from the fact that the number of sampling events with presence of the species is remarkably low compared to the number of sampling events where the species were not found. Yet, not finding a species in a sample does not mean that the species is not living in this location, it just means that the species was eventually not found at this sampling event. Because of the “pseudoabsence” nature of our class “n”, it is not dramatic that the prediction accuracy in the training dataset for class “n” is relatively high (14–23% error). In contrast the prediction accuracy for presence (class “y”) was low 0–9%, indicating that the models provide a good estimate of the potential distribution of the species. Using the distribution of Haploniscus bicuspis species as an example where an adequate number of data points were available, it was, however, possible to demonstrate the potential of this method; it could be shown that the predicted occurrences diverge in at least two species or groups of species (H. bicuspis sp. I–III restricted to the north of the GIF and H. bicuspis IV to the south). The addition of more environmental layers and biogeographic data will likely contribute to a better prediction of species distributions.
In summary, biogeographic and ecological species demarcation and identification is only helpful in areas in which biodiversity and distribution have been well studied and sampled. But even in one of the better-known areas like Iceland, our results have shown that knowledge gaps still exist, as demonstrated by a number of cryptic and supposedly new species. This can only be remedied through ongoing morphological examination, together with molecular methods and additional sampling. Certainly, the creation of interactive keys when combined with molecular, bathymetric and environmental datasets can increase their effectiveness as a tool for robust species identification (Figure 12).
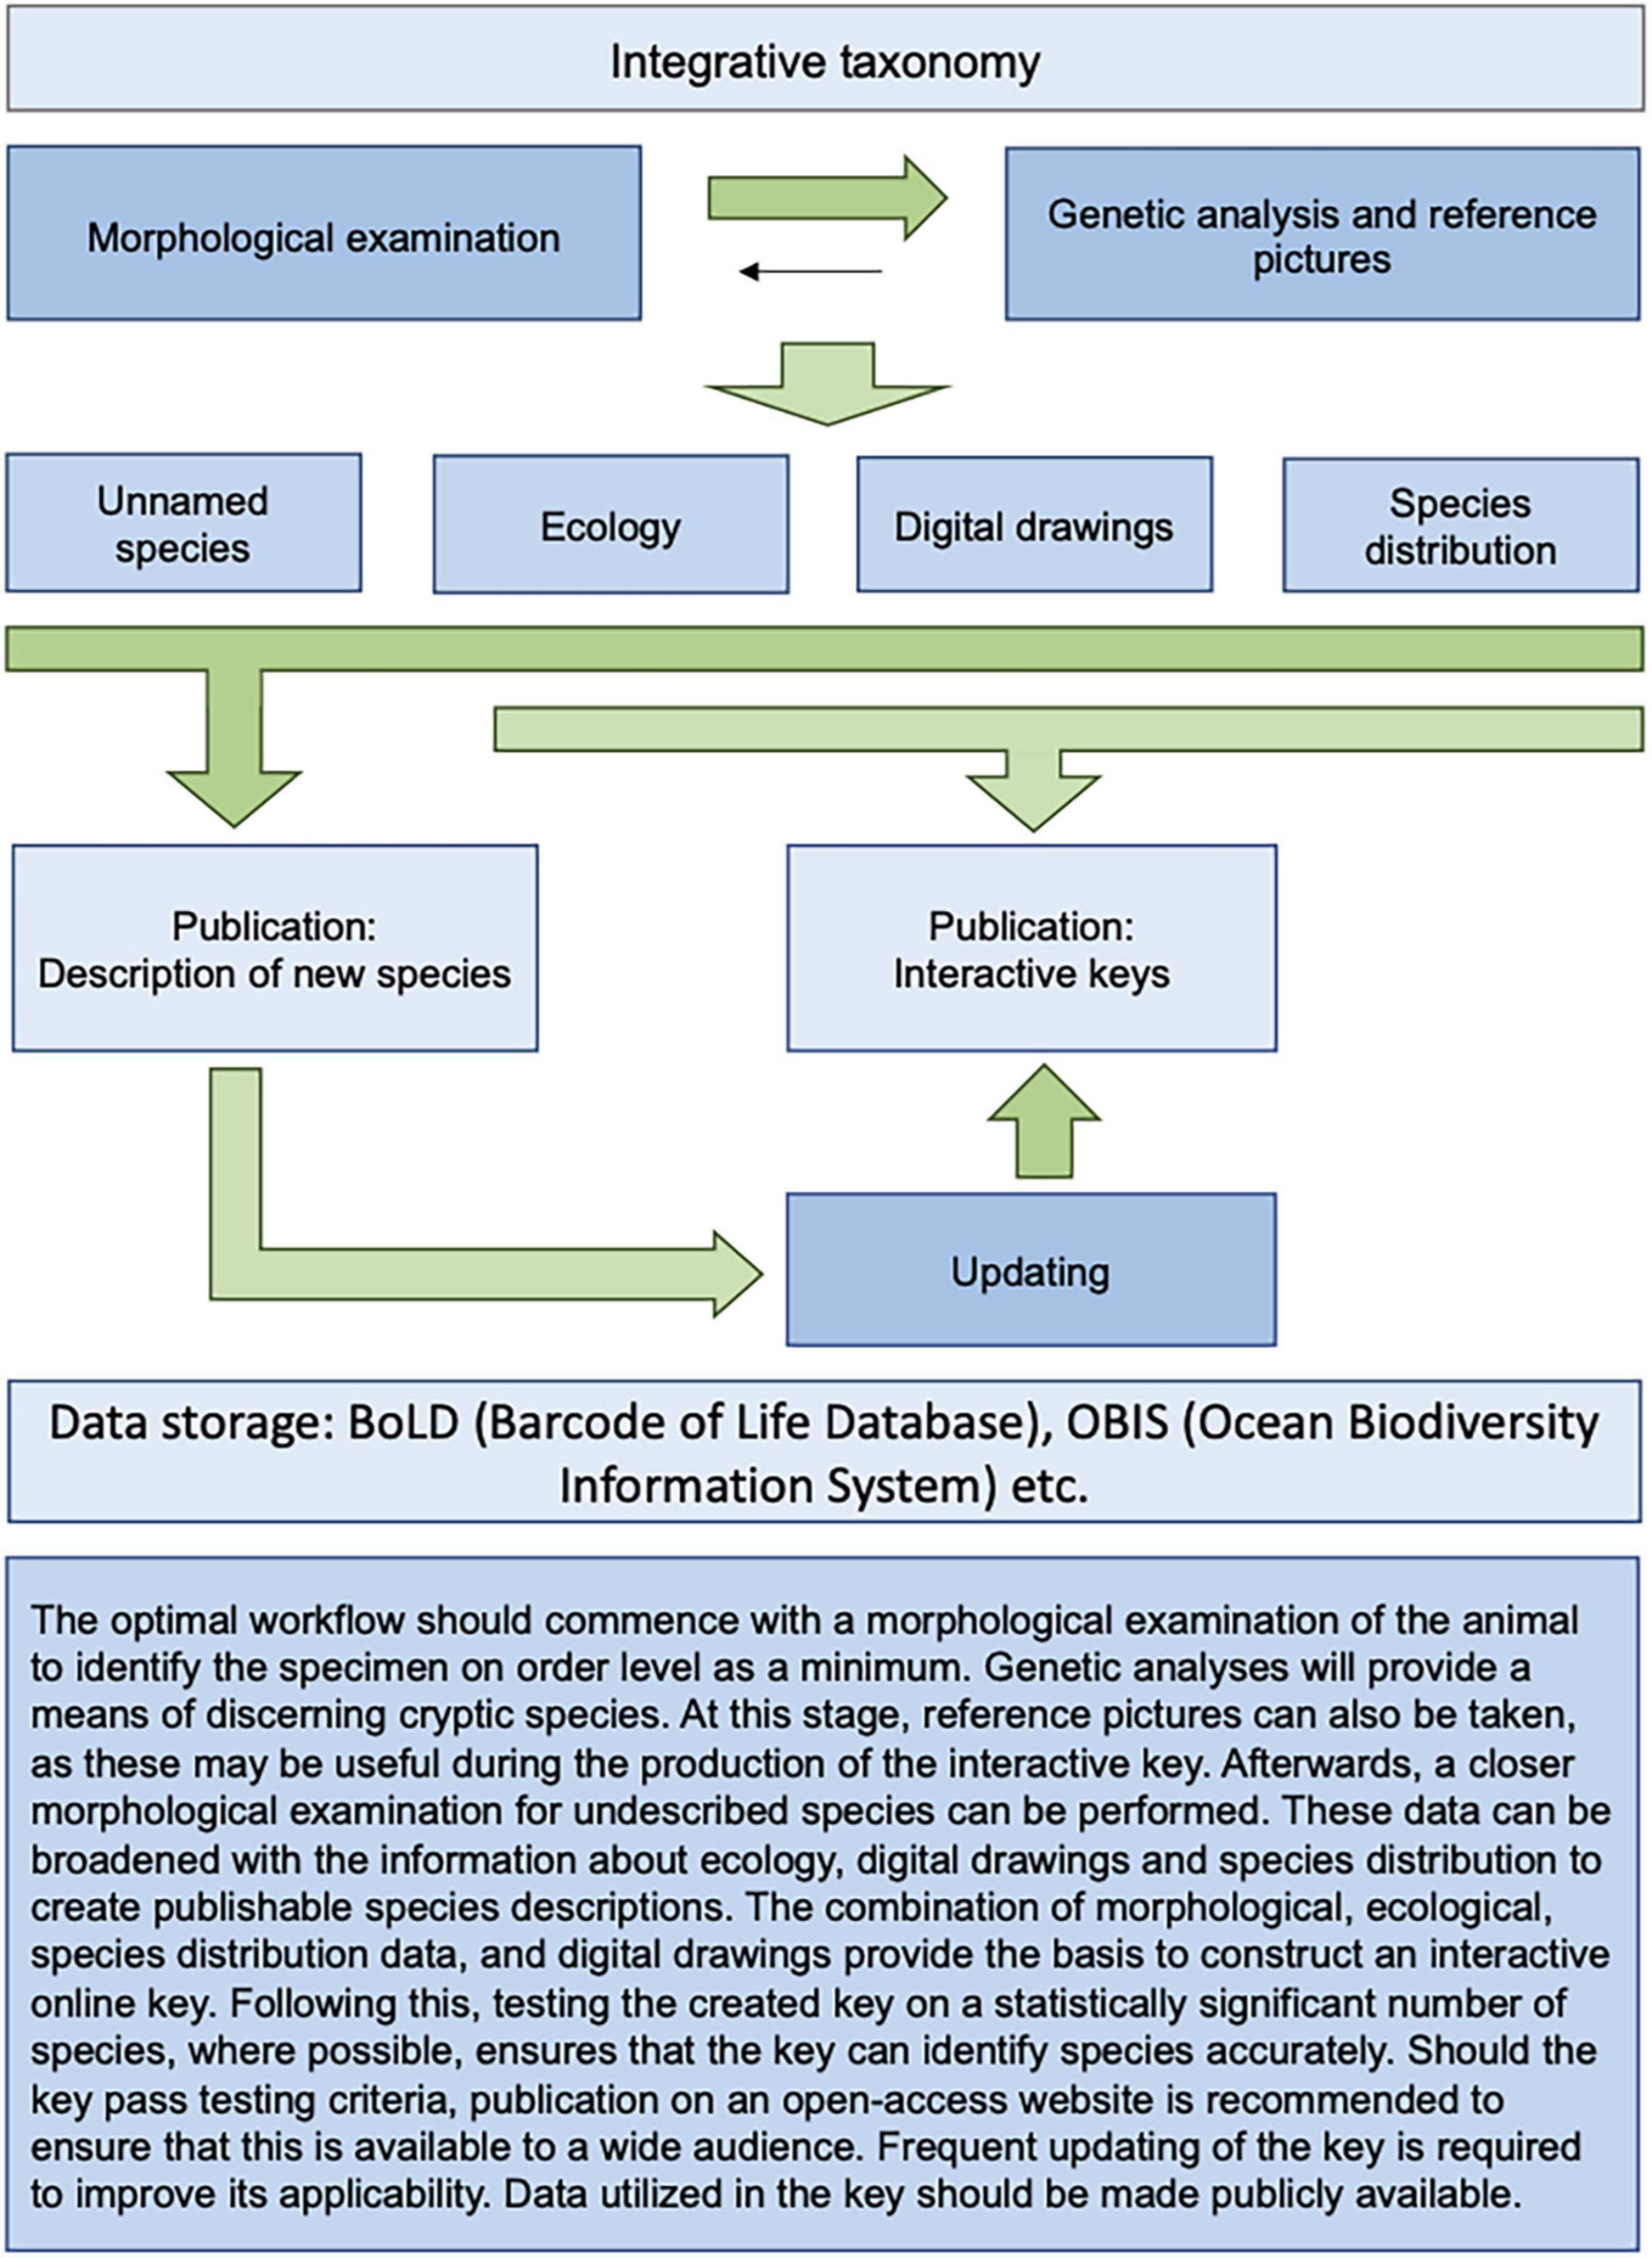
Figure 12. Ideal workflow for interactive keys and integrated taxonomy.
Conclusion
In our analysis of Haploniscidae around Iceland, the use of interactive keys was proven to be a powerful tool to identify described, but also to recognize potentially new species. In particular, the easier involvement of non-experts in the identification process is highlighted, especially when additional information, such as images or biogeographical data, is included. Since interactive keys are based solely on morphology, they are subject to some restrictions due to “phenomena” such as cryptic species, sexual and ontogenetic dimorphism, or when species are severely damaged. Therefore, genetic or -omic techniques such as COI barcoding, metabarcoding, and proteomics amongst others, are essential to complement the morphological assessment.
We deliberately examined specimens from a comparatively well-known group from a comparatively well-known area, but nonetheless discovered some supposedly new isopod species. Our intention was not to evaluate various morphological and genetic methods for species identification, but to test how robustly species can be identified. Nevertheless, we found molecular tools very helpful to support the morphological identification of species, in particular proteomics as a novel tool for identifying isopod species. Despite some limitations (e.g., issues of intercalibration of mass spectra between different data sets), the latter could become a valuable alternative to the more expensive and time-consuming DNA barcoding approach.
In the longer term, all newly discovered species in this study – be it part of a species complex (H. bicuspis) or entirely new (H. sp. A) – should be included in the key. Ultimately, interactive keys for other Icelandic crustacean taxa are to be developed and made publicly available in order to build a framework of taxonomic information that will help professionals and non-experts to identify the marine fauna of Iceland and thus to gain a more complete picture of the local biodiversity. The interactive key presented in this paper is the first for isopods, and the first step toward completing an atlas of the Icelandic marine isopod fauna. At present, even dichotomous keys on paper do not exist although the BIOICE inventory of the Icelandic fauna is used as baseline knowledge for species distributions. As mentioned in the beginning, we rely on original species descriptions and their comparison for most taxa. These missing keys highlight the need for taxonomic expertise in times of the “taxonomic impediment” (Coleman, 2015). While part of this is due to the lack of skilled taxonomists, there is an argument that taxonomists could improve accessibility of species descriptions through online databases and syntheses of taxonomic information to create identification keys. Through summarizing published species description and allowing easy adaptation, interactive online keys can help achieve this goal.
This study shows that interactive keys are an important, but hitherto underutilized tool, for obtaining an understanding of species within a given ecosystem. Within the context of the UN’s Ocean Decade (2021 to 2030), interactive keys may provide the solution toward the objective of re-establishing taxonomic knowledge in the young generation of scientists, which is imperative for assessing ecosystem function and future change within the Anthropocene.
Data Availability Statement
The datasets presented in this study can be found in online repositories. The names of the repository/repositories and accession number(s) can be found below: http://www.boldsystems.org/index.php/Public_SearchTerms?query=DS-HAPLB, accession number(s) can be found in the additional information for this paper: https://doi.org/10.5061/dryad.r2280gbcd; https://zenodo.org/record/5710070#.YZqyzC2l2u4; https://zenodo.org/record/5701346#.YZqy873P3eo; https://zenodo.org/record/5682763#.YZqzAi2l2u4.
Author Contributions
JS was one of the organizers of the BIOICE expeditions and sampling. SB organized the IceAGE expeditions and sampling. JS and SB conducted the species identification. A-NL supervised the theses of KK. EP sequenced the COI data. MS performed the genetic distance and phylogenetic analyses. SR, JP, EP, and SB created the MALDI-TOF MS data and discussed with PM. PM created the species distribution models and KK visualized them. KK, CC, A-NL, and SB constructed the interactive keys. KK performed geological mapping and species bathymetry distribution analyses. KK, SK, MS, SR, JP, PM, CC, and SB drafted the first version of the manuscript. All authors contributed to the final version of the manuscript.
Funding
The expeditions in the frame of the IceAGE project were supported by the German Science Foundation (DFG) under contract nos BR3843/3-1,4-1, MerMet17-15 and MerMet17-06 to SB and the German Ministry for Education (BMBF). SK acknowledges a grant by the Narodowa Agencja Wymiany Akademickiej (NAWA, Poland) under the ULAM program. This work was also supported by the DFG initiative 1991 “Taxon-omics” (Grant number RE2808/3-1 and RE2808/3-2).
Conflict of Interest
The authors declare that the research was conducted in the absence of any commercial or financial relationships that could be construed as a potential conflict of interest.
Publisher’s Note
All claims expressed in this article are solely those of the authors and do not necessarily represent those of their affiliated organizations, or those of the publisher, the editors and the reviewers. Any product that may be evaluated in this article, or claim that may be made by its manufacturer, is not guaranteed or endorsed by the publisher.
Acknowledgments
We are thankful for the sampling efforts of the scientific and ship’s crew of the BIOICE (Håkon Mosby, Bjarni Saemundsson, and Magnus Heinason) and IceAGE expeditions on board of all vessels (RVs Meteor, Poseidon, Maria S. Merian, and Sonne). We are grateful for Karen Jeskulke and Nicole Gatzemeier for the technical support during sampling, data management, and laboratory assistance. We highly appreciate Jenny Neuhaus’ help testing the interactive keys. Many thanks to Craig Hammock for proof-reading before submission. This is publication 15 of the Senckenberg am Meer Proteomics Laboratory.
Supplementary Material
The Supplementary Material for this article can be found online at: https://www.frontiersin.org/articles/10.3389/fmars.2021.795196/full#supplementary-material
Footnotes
- ^ https://www.researchgate.net/project/Use-of-computers-for-taxonomy/update/5d78f8333843b0b98263acf3
- ^ https://github.com/pmartinezarbizu/RFtools
- ^ https://www.cbd.int/gti/problem.shtml
- ^ https://cybertaxonomy.eu/
- ^ http://scratchpads.org/about/concept
- ^ https://australian.museum/learn/collections/natural-science/marine-invertebrates/crustacea/
References
Adobe Inc (2019). Adobe Illustrator CC (Version 23.0.2). Available online at: https://adobe.com/products/illustrator (accessed February 01, 2021).
Appeltans, W., Ahyong, S. T., Anderson, G., Angel, M. V., Artois, T., Bailly, N., et al. (2012). The magnitude of global marine species diversity. Curr. Biol. 22, 2189–2202. doi: 10.1016/j.cub.2012.09.036
Armstrong, C. W., Foley, N. S., Tinch, R., and van den Hove, S. (2012). Services from the deep: steps towards valuation of deep sea goods and services. Ecosyst. Servic. 2, 2–13. doi: 10.1016/j.ecoser.2012.07.001
Arnason, R. (2007). Climate change and fisheries: assessing the economic impact in Iceland and Greenland. Nat. Resour. Model. 20, 163–197. doi: 10.1111/j.1939-7445.2007.tb00205.x
Astrin, J. J., and Stüben, P. E. (2008). Phylogeny in cryptic weevils: molecules, morphology and new genera of western Palaearctic Cryptorhynchinae (Coleoptera: Curculionidae). Inverteb. Syst. 22, 503–522. doi: 10.1071/IS07057
Astthorsson, O. S., Gislason, A., and Jonsson, S. (2007). Climate variability and the Icelandic marine ecosystem. Deep Sea Res. Part II Top. Stud. Oceanogr. 54, 2456–2477. doi: 10.1016/j.dsr2.2007.07.030
Balke, M., Schmidt, S., Hausmann, A., Toussaint, E. F., Bergsten, J., Buffington, M., et al. (2013). Biodiversity into your hands–a call for a virtual global natural history ‘metacollection’. Front. Zool. 10:55. doi: 10.1186/1742-9994-10-55
Basher, Z., Bowden, D., and Costello, M. (2014). Global Marine Environment Dataset (GMED). Version 1.0 (Rev.01.2014). Available online at: http://gmed.auckland.ac.nz (accessed August 01, 2021)
Bergmeier, F. S., Brandt, A., Schwabe, E., and Jörger, K. M. (2017). Abyssal Solenogastres (Mollusca, Aplacophora) from the Northwest Pacific: scratching the surface of deep-sea diversity using integrative taxonomy. Front. Mar. Sci. 4:410. doi: 10.3389/fmars.2017.00410
Bode, M., Laakmann, S., Kaiser, P., Hagen, W., Auel, H., and Cornils, A. (2017). Unravelling diversity of deep-sea copepods using integrated morphological and molecular techniques. J. Plankton Res. 39, 600–617. doi: 10.1093/plankt/fbx031
Boistel, R., Swoger, J., Kržič, U., Fernandez, V., Gillet, B., and Reynaud, E. G. (2011). The future of three-dimensional microscopic imaging in marine biology. Mar. Ecol. 32, 438–452. doi: 10.1111/j.1439-0485.2011.00442.x
Bouckaert, R., Vaughan, T. G., Barido-Sottani, J., Duchêne, S., Fourment, M., Gavryushkina, A., et al. (2019). BEAST 2.5: an advanced software platform for Bayesian evolutionary analysis. PLoS Comput. Biol. 15:e1006650. doi: 10.1371/journal.pcbi.1006650
Brandt, A., De Broyer, C., De Mesel, I., Ellingsen, K., Gooday, A., Hilbig, B., et al. (2007). The biodiversity of the deep Southern Ocean benthos. Philos. Trans. R. Soc. B Biol. Sci. 362, 39–66. doi: 10.1098/rstb.2006.1952
Brasier, M. J., Wiklund, H., Neal, L., Jeffreys, R., Linse, K., Ruhl, H., et al. (2016). DNA barcoding uncovers cryptic diversity in 50% of deep-sea Antarctic polychaetes. R. Soc. Open Sci. 3:160432. doi: 10.1098/rsos.160432
Brenke, N. (2005). An epibenthic sledge for operations on marine soft bottom and bedrock. Mar. Technol. Soc. J. 39, 10–21. doi: 10.4031/002533205787444015
Brix, S. (2006). A New Species of Desmosomatidae (Isopoda: Crustacea) From the Deep Southern Ocean: Eugerdella Serrata sp. nov. Including Remarks to the Morphological Variability Within Eugerdella Hessler, 1970. Hamburg: Mitteilungen aus dem hamburger zoologischen Museum und Institut, 69–84.
Brix, S., and Devey, C. (2019). Stationlist of the IceAGE project (Icelandic marine Animals: genetics and ecology) expeditions. Mar. Data Arch.. doi: 10.14284/349
Brix, S., Meissner, K., Stansky, B., Halanych, K. M., Jennings, R. M., Kocot, K. M., et al. (2014). The IceAGE project–a follow up of BIOICE. Polish Polar Res. 35, 141–150. doi: 10.2478/popore-2014-0010
Brix, S., Osborn, K. J., Kaiser, S., Truskey, S. B., Schnurr, S. M., Brenke, N., et al. (2020). Adult life strategy affects distribution patterns in abyssal isopods–implications for conservation in Pacific nodule areas. Biogeosciences 17, 6163–6184. doi: 10.5194/bg-17-6163-2020
Brix, S., Stransky, B., Malyutina, M., Pabis, K., Svavarsson, J., and Riehl, T. (2018). Distributional patterns of isopods (Crustacea) in Icelandic and adjacent waters. Mar. Biodivers. 48, 783–811. doi: 10.1007/s12526-018-0871-z
Brix, S., and Svavarsson, J. (2010). Distribution and diversity of desmosomatid and nannoniscid isopods (Crustacea) on the Greenland–Iceland–Faeroe Ridge. Polar Biol. 33, 515–530. doi: 10.1007/s12526-018-0871-z
Brökeland, W. (2005). Systematics, Zoogeography, Evolution and Biodiversity of Antarctic Deep-Sea Isopoda (Crustacea: Malacostraca). Hamburg: Staats-und Universitätsbibliothek Hamburg Carl von Ossietzky.
Brökeland, W. (2010). Redescription of Haploniscus rostratus (Menzies, 1962) (Crustacea: Peracarida: Isopoda) with observations on the postmarsupial development, size ranges and distribution. Zootaxa 2521, 1–25. doi: 10.11646/zootaxa.2521.1.1
Brökeland, W., and Raupach, M. J. (2008). A species complex within the isopod genus Haploniscus (Crustacea: Malacostraca: Peracarida) from the Southern Ocean deep sea: a morphological and molecular approach. Zool. J. Linn. Soc. 152, 655–706. doi: 10.1111/j.1096-3642.2008.00362.x
Brökeland, W., and Svavarsson, J. (2017). Distribution of haploniscids (Isopoda, Asellota, Haploniscidae) in Icelandic waters, with description of Haploniscus astraphes n. sp. from the Iceland basin and the Southeast Atlantic Ocean. Zootaxa 4231, 301–326. doi: 10.11646/zootaxa.4231.3.1
Brökeland, W., and Wägele, J.-W. (2004). Redescription of three species of Haploniscus Richardson, 1908 (Isopoda, Asellota, Haploniscidae) from the Angola Basin. Organ. Divers. Evol. 4:237. doi: 10.1016/j.ode.2004.02.004
Chardy, P. (1974). Les Haploniscidae (Crustacés Isopodes Asellotes) de l’Atlantique. Description de huit espèces nouvelles. Bull. Mus. Natl. Hist. Nat. 3, 1137–1166.
Coleman, C. O. (2003). “Digital inking”: how to make perfect line drawings on computers. Organ. Divers. Evol. 3:303. doi: 10.1078/1439-6092-00081
Coleman, C. O. (2009). Drawing setae the digital way. Zoosyst. Evol. 85, 305–310. doi: 10.1002/zoos.200900008
Coleman, C. O. (2015). Taxonomy in times of the taxonomic impediment–examples from the community of experts on amphipod crustaceans. J. Crustac. Biol. 35, 729–740. doi: 10.1163/1937240X-00002381
Coleman, C. O., Lowry, J. K., and Macfarlane, T. (2010). DELTA for Beginners: An Introduction Into the Taxonomy Software Package DELTA, Vol. 45. Sofia: PenSoft Publishers LTD.
Coleman, C. O., and Radulovici, A. E. (2020). Challenges for the future of taxonomy: talents, databases and knowledge growth. Megataxa 1, 28–34. doi: 10.11646/megataxa.1.1.5
D’alba, l, Monaghan, P., and Nager, R. G. (2010). Advances in laying date and increasing population size suggest positive responses to climate change in common eiders Somateria mollissima in Iceland. Ibis 152, 19–28.
Dallwitz, M., Paine, T., and Zurcher, E. (2006). User’s Guide to the DELTA System: A General System for Processing Taxonomic Descriptions. Canberra, ACT: CSIRO Division of Entomology.
Dallwitz, M. J. (1974). A flexible computer program for generating identification keys. Syst. Biol. 23, 50–57. doi: 10.1093/sysbio/23.1.50
Dallwitz, M. J. (1980). A general system for coding taxonomic descriptions. Taxon 29, 41–46. doi: 10.2307/1219595
Dallwitz, M. J. (2018). Overview of the DELTA System. Available online at: https://www.delta-intkey.com/www/overview.htm (accessed August 6, 2021)
Dallwitz, M. J. (2021). Descriptions, Illustrations, Interactive Identification, And Information Retrieval From DELTA Databases. Available online at: https://www.delta-intkey.com/www/data.htm (accessed October 6, 2021)
Danovaro, R., Gambi, C., Lampadariou, N., and Tselepides, A. (2008). Deep-sea nematode biodiversity in the Mediterranean basin: testing for longitudinal, bathymetric and energetic gradients. Ecography 31, 231–244. doi: 10.1111/j.2007.0906-7590.05484.x
Dayrat, B. (2005). Towards integrative taxonomy. Biol. J. Linn. Soc. 85, 407–417. doi: 10.1111/j.1095-8312.2005.00503.x
Dieme, C., Yssouf, A., Vega-Rúa, A., Berenger, J.-M., Failloux, A.-B., Raoult, D., et al. (2014). Accurate identification of Culicidae at aquatic developmental stages by MALDI-TOF MS profiling. Parasit. Vectors 7, 1–14. doi: 10.1186/s13071-014-0544-0
Drinkwater, R. E. (2009). Insights into the development of online plant identification keys based on literature review: an exemplar electronic key to Australian Drosera. Biosci. Horiz. 2, 90–96. doi: 10.1093/biohorizons/hzp007
Edgar, R. C. (2004). MUSCLE: multiple sequence alignment with high accuracy and high throughput. Nucleic Acids Res. 32, 1792–1797. doi: 10.1093/nar/gkh340
Farr, D. F. (2006). On-line keys: more than just paper on the web. Taxon 55, 589–596. doi: 10.2307/25065636
Gage, J. D., and Tyler, P. A. (1991). Deep-Sea Biology: A Natural History of Organisms at the Deep-Sea Floor. Cambridge: Cambridge University Press.
GEBCO Bathymetric Compilation Group (2020). The GEBCO_2020 Grid - A Continuous Terrain Model of the Global Oceans and Land. Liverpool: British Oceanographic Data Centre, National Oceanography Centre, NERC.
Gibb, S. (2015). MALDIquantForeign: Import/Export Routines for MALDIquant. A package for R. Available online at: https://cran.r-project.org/package=MALDIquantForeign (accessed July 5, 2021).
Gibb, S., and Strimmer, K. (2012). MALDIquant: a versatile R package for the analysis of mass spectrometry data. Bioinformatics 28, 2270–2271. doi: 10.1093/bioinformatics/bts447
Glover, A. G., Higgs, N., and Horton, T. (2021). World Register of Deep-Sea species (WoRDSS). Available online at: http://www.marinespecies.org/deepsea (accessed October 6, 2021)
Glover, A. G., Wiklund, H., Chen, C., and Dahlgren, T. G. (2018). Point of view: managing a sustainable deep-sea ‘blue economy’requires knowledge of what actually lives there. Elife 7:e41319. doi: 10.7554/eLife.41319
Godfray, H. C. J., Clark, B., Kitching, I., Mayo, S., and Scoble, M. (2007). The web and the structure of taxonomy. Syst. Biol. 56, 943–955. doi: 10.1080/10635150701777521
Gollner, S., Ivanenko, V. N., Arbizu, P. M., and Bright, M. (2014). Correction: advances in taxonomy, ecology, and biogeography of dirivultidae (Copepoda) associated with chemosynthetic environments in the deep sea. PLoS One 9:e9801. doi: 10.1371/journal.pone.0009801
Hanna, E., Jónsson, T., and Box, J. E. (2006). Recent changes in Icelandic climate. Weather 61, 3–9. doi: 10.1256/wea.80.04
Hansen, B., and Østerhus, S. (2000). North Atlantic–Nordic Seas exchanges. Prog. Oceanogr. 45, 109–208. doi: 10.1016/S0079-6611(99)00052-X
Hastie, T., Tibshirani, R., and Friedman, J. (2009). The Elements of Statistical Learning; Data Mining, Inference and Prediction, Vol. 2nd. New York, NY: Springer Science & Business Media.
Hessler, R. R. (1970). The Desmosomatidae (Isopoda, Asellota) of the Gay Head-Bermuda Transect. London: University of California press.
Howell, K. L., Hilário, A., Allcock, A. L., Bailey, D. M., Baker, M., Clark, M. R., et al. (2020). A Blueprint for an inclusive, global deep-sea ocean decade field program. Front. Mar. Sci. 7:999. doi: 10.3389/fmars.2020.584861
International Seabed Authority [ISA] (2020). Workshop On the Deep-Sea Taxonomic Standardization: Strategic Approaches For Collaboration. Available online at: https://isa.org.jm/files/files/documents/AnnAgd-Taxonomic.pdf (accessed February 2, 2021).
Johannsen, N., Lins, L., Riehl, T., and Brandt, A. (2020). Changes in species composition of Haploniscidae (Crustacea: Isopoda) across potential barriers to dispersal in the Northwest Pacific. Prog. Oceanogr. 180:102233. doi: 10.1016/j.pocean.2019.102233
Jöst, A. B., Yasuhara, M., Okahashi, H., Ostmann, A., Arbizu, P. M., and Brix, S. (2017). Vertical distribution of living ostracods in deep-sea sediments, North Atlantic Ocean. Deep Sea Res. Part I Oceanogr. Res. Pap. 122, 113–121. doi: 10.1016/j.dsr.2017.01.012
Kaiser, S. (2015). A new species of Regabellator Siebenaller & Hessler, 1981 (Isopoda, Asellota, Nannoniscidae) from the Amundsen sea shelf (Southern Ocean). Crustaceana 88, 405–421. doi: 10.1163/15685403-00003417
Kaiser, S., Kihara, T. C., Brix, S., Mohrbeck, I., Janssen, A., and Jennings, R. M. (2021). Species boundaries and phylogeographic patterns in new species of Nannoniscus (Janiroidea: Nannoniscidae) from the equatorial Pacific nodule province inferred from mtDNA and morphology. Zool. J. Linn. Soc. 193, 1020–1071. doi: 10.1093/zoolinnean/zlaa174
Krijthe, J. H., and Van der Maaten, L. (2015). Rtsne: T-Distributed Stochastic Neighbor Embedding Using Barnes-Hut Implementation. R package version 0.13. Available online at: https://github.com/jkrijthe/Rtsne (accessed July 5, 2021).
Kumar, S., Stecher, G., Li, M., Knyaz, C., and Tamura, K. (2018). MEGA X: molecular evolutionary genetics analysis across computing platforms. Mol. Biol. Evol. 35:1547. doi: 10.1093/molbev/msy096
Langenkämper, D., Simon-Lledó, E., Hosking, B., Jones, D. O., and Nattkemper, T. W. (2019). On the impact of citizen science-derived data quality on deep learning based classification in marine images. PLoS One 14:e0218086. doi: 10.1371/journal.pone.0218086
Legendre, P., and Gallagher, E. D. (2001). Ecologically meaningful transformations for ordination of species data. Oecologia 129, 271–280. doi: 10.1007/s004420100716
Lim, G. S., Balke, M., and Meier, R. (2012). Determining species boundaries in a world full of rarity: singletons, species delimitation methods. Syst. Biol. 61, 165–169. doi: 10.1093/sysbio/syr030
Lincoln, R. (1985b). The Marine Fauna of New Zealand: Deep-Sea Isopoda Asellota, Family Haploniscidae, Vol. 94. Wellington: New Zealand Oceanographic Institute.
Lincoln, R. (1985a). Deep-sea asellote isopods of the north-east Atlantic: the family Haploniscidae. J. Nat. Hist. 19, 655–695. doi: 10.1080/00222938500770411
Lins, L., Zeppilli, D., Menot, L., Michel, L. N., Bonifácio, P., Brandt, M., et al. (2021). Toward a reliable assessment of potential ecological impacts of deep-sea polymetallic nodule mining on abyssal infauna. Limnol. Oceanogr. Methods 19, 626–650. doi: 10.1002/lom3.10448
Lörz, A.-N., Kaiser, S., and Bowden, D. (2013). Macrofaunal crustaceans in the benthic boundary layer from the shelf break to abyssal depths in the Ross Sea (Antarctica). Polar Biol. 36, 445–451. doi: 10.1007/s00300-012-1269-1
Lörz, A.-N., Kaiser, S., Oldeland, J., Stolter, C., Kürzel, K., and Brix, S. (2021). Biogeography, diversity and environmental relationships of shelf and deep-sea benthic Amphipoda around Iceland. PeerJ 9:e11898. doi: 10.7717/peerj.11898
Mazzeo, M. F., and Siciliano, R. A. (2016). Proteomics for the authentication of fish species. J. Proteomics 147, 119–124. doi: 10.1016/j.jprot.2016.03.007
Meißner, K., Brix, S., Halanych, K. M., and Jażdżewska, A. M. (2018). Preface—biodiversity of Icelandic waters. Mar. Biodivers. 48, 715–718. doi: 10.1007/s12526-018-0884-7
Meißner, K., Fiorentino, D., Schnurr, S., Arbizu, P. M., Huettmann, F., Holst, S., et al. (2014). Distribution of benthic marine invertebrates at northern latitudes—an evaluation applying multi-algorithm species distribution models. J. Sea Res. 85, 241–254. doi: 10.1016/j.seares.2013.05.007
Menzies, R. J. (1962). The Isopods of Abyssal Depths in the Atlantic Ocean. New York, NY: Columbia University Press.
Meyer, C. P. (2003). Molecular systematics of cowries (Gastropoda: Cypraeidae) and diversification patterns in the tropics. Biol. J. Linn. Soc. 79, 401–459. doi: 10.1046/j.1095-8312.2003.00197.x
Microsoft Corporation (2021). Microsoft Excel. Available online at: https://office.microsoft.com/excel (accessed August 3, 2021).
Miljutin, D. M., Gad, G., Miljutina, M. M., Mokievsky, V. O., Fonseca-Genevois, V., and Esteves, A. M. (2010). The state of knowledge on deep-sea nematode taxonomy: how many valid species are known down there? Mar. Biodivers. 40, 143–159. doi: 10.1007/s12526-010-0041-4
Miller, M. A., Pfeiffer, W., and Schwartz, T. (2010). “Creating the CIPRES science gateway for inference of large phylogenetic trees,” in Proceedings of the 2010 Gateway Computing Environments Workshop (GCE), (New Orleans, LA: IEEE), 1–8. doi: 10.1109/GCE.2010.5676129
Oracle, V. M. (2021). VirtualBox (Version 6.1). Available online at: https://www.virtualbox.org (accessed May 3, 2021).
Ostmann, A., and Arbizu, P. M. (2018). Predictive models using randomForest regression for distribution patterns of meiofauna in Icelandic waters. Mar. Biodivers. 48, 719–735. doi: 10.1007/s12526-018-0882-9
Park, J. Y. (2000). A revision of the isopod genus Mastigoniscus (Asellota, Haploniscidae) with descriptions of three new species. Zoosyst. Evol. 76, 195–229. doi: 10.1002/mmnz.20000760204
Paulus, E., Brix, S., Siebert, A., Arbizu, P. M., Rossel, S., Peters, J., et al. (2021). Recent speciation and hybridization in Icelandic deep-sea isopods: an integrative approach using genomics and proteomics. Mol. Ecol. 1–18. doi: 10.1111/mec.16234
Pearse, J. S., Mooi, R., Lockhart, S. J., and Brandt, A. (2009). “Brooding and species diversity in the Southern Ocean: selection for brooders or speciation within brooding clades?,” in Smithsonian at the Poles: Contributions to International Polar Year Science, eds I. Krupnik, M. A. Lang, and S. E. Miller (Washington, DC: IPY), doi: 10.5479/si.097884601X.13
Pecl, G. T., Araújo, M. B., Bell, J. D., Blanchard, J., Bonebrake, T. C., Chen, I.-C., et al. (2017). Biodiversity redistribution under climate change: impacts on ecosystems and human well-being. Science 355:eaai9214. doi: 10.1126/science.aai921
Pons, J., Barraclough, T. G., Gomez-Zurita, J., Cardoso, A., Duran, D. P., Hazell, S., et al. (2006). Sequence-based species delimitation for the DNA taxonomy of undescribed insects. Syst.Biol. 55, 595–609. doi: 10.1080/10635150600852011
Poore, G. (2008). Decapod Crustacea of the continental margin of southwestern and central Western Australia: preliminary identifications of 524 species from FRV Southern Surveyor voyage SS10-2005. Mus. Vict. Sci. Rep. 11, 1–106.
Poore, G. C., Avery, L., Błażewicz-Paszkowycz, M., Browne, J., Bruce, N. L., Gerken, S., et al. (2015). Invertebrate diversity of the unexplored marine western margin of Australia: taxonomy and implications for global biodiversity. Mar. Biodivers. 45, 271–286.
Puillandre, N., Brouillet, S., and Achaz, G. (2021). ASAP: assemble species by automatic partitioning. Mol. Ecol. Resour. 21, 609–620. doi: 10.1111/1755-0998.13281
QGIS Development Team (2020). QGIS Geographic Information System (Version 3.4.7-Madeira): Open Source Geospatial Foundation Project. Available online at: http://qgis.osgeo.org
R Core Team (2020). R: A Language and Environment for Statistical Computing. Vienna: R Foundation for Statistical Computing.
Raharimalala, F., Andrianinarivomanana, T., Rakotondrasoa, A., Collard, J., and Boyer, S. (2017). Usefulness and accuracy of MALDI-TOF mass spectrometry as a supplementary tool to identify mosquito vector species and to invest in development of international database. Med. Vet. Entomol. 31, 289–298. doi: 10.1111/mve.12230
Raupach, M. J., Amann, R., Wheeler, Q. D., and Roos, C. (2016). The application of “-omics” technologies for the classification and identification of animals. Organ. Divers. Evol. 16, 1–12. doi: 10.1007/s13127-015-0234-6
Raupach, M. J., and Wägele, J.-W. (2006). Distinguishing cryptic species in Antarctic Asellota (Crustacea: Isopoda)-a preliminary study of mitochondrial DNA in Acanthaspidia drygalskii. Antarct. Sci. 18, 191–198. doi: 10.1017/S0954102006000228
Renz, J., Markhaseva, E. L., Laakmann, S., Rossel, S., Martinez Arbizu, P., and Peters, J. (2021). Proteomic fingerprinting facilitates biodiversity assessments in understudied ecosystems: a case study on integrated taxonomy of deep sea copepods. Mol. Ecol. Resour. 21, 1936–1951. doi: 10.1111/1755-0998.13405
Richardson, H. (1908). Some new Isopoda of the superfamily Aselloidea from the Atlantic coast of North America. Proc. U.S. Natl. Mus. 35, 71–86. doi: 10.5479/si.00963801.35-1633.71
Riehl, T., Brenke, N., Brix, S., Driskell, A., Kaiser, S., and Brandt, A. (2014). Field and laboratory methods for DNA studies on deep-sea isopod crustaceans. Polish Polar Res. 35, 203–224. doi: 10.2478/popore-2014-0018
Riehl, T., and Kühn, M. A. (2020). Uniting what belongs together—reevaluation of the isopod species Macrostylis grandis and M. ovata using ontogenetic, morphological and genetic evidence. Prog. Oceanogr. 181:102238.
Riehl, T., Wilson, G. D., and Hessler, R. R. (2012). New Macrostylidae Hansen, 1916 (Crustacea: Isopoda) from the Gay Head-Bermuda transect with special consideration of sexual dimorphism. Zootaxa 3277, 1–26. doi: 10.11646/zootaxa.3277.1.1
Ronquist, F., Teslenko, M., Van Der Mark, P., Ayres, D. L., Darling, A., Höhna, S., et al. (2012). MrBayes 3.2: efficient Bayesian phylogenetic inference and model choice across a large model space. Syst. Biol. 61, 539–542. doi: 10.1093/sysbio/sys029
Rossel, S., Barco, A., Kloppmann, M., Arbizu, P. M., Huwer, B., and Knebelsberger, T. (2021). Rapid species level identification of fish eggs by proteome fingerprinting using MALDI-TOF MS. J. Proteomics 231, 103993. doi: 10.1016/j.jprot.2020.103993
Rossel, S., Khodami, S., and Martínez Arbizu, P. (2019). Comparison of rapid biodiversity assessment of meiobenthos using MALDI-TOF MS and metabarcoding. Front. Mar. Sci. 6:659. doi: 10.3389/fmars.2019.00659
Rossel, S., and Martínez Arbizu, P. (2018). Automatic specimen identification of Harpacticoids (Crustacea: Copepoda) using random forest and MALDI-TOF mass spectra, including a post hoc test for false positive discovery. Methods Ecol. Evol. 9, 1421–1434. doi: 10.1111/2041-210X.13000
Rothlisberg, P., and Pearcy, W. G. (1976). An epibenthic sampler used to study the ontogeny of vertical migration of Pandalus dordani (Decapoda caridea). Fish. Bull. 74, 994–997.
Ryan, C., Clayton, E., Griffin, W., Sie, S., and Cousens, D. (1988). SNIP, a statistics-sensitive background treatment for the quantitative analysis of PIXE spectra in geoscience applications. Nucl. Instrum. Methods Phys. Res. B 34, 396–402. doi: 10.1016/0168-583X(88)90063-8
Sars, G. (1877). Prodromus descriptionis Crustaceorum et Pycnogonidarum, quae in expeditione norvegica anno 1876 observavit. Archiv. Math. Naturvid. Krist. 2, 237–271.
Sars, G. O. (1896–1899). An Account of the Crustacea of Norway with Short Descriptions and Figures of All the Species. Isopoda, Vol. II. Bergen: Bergen Museum.
Saucède, T., Eléaume, M., Jossart, Q., Moreau, C., Downey, R., Bax, N., et al. (2021). Taxonomy 2.0: computer-aided identification tools to assist Antarctic biologists in the field and in the laboratory. Antarct. Sci. 33, 39–51. doi: 10.1017/S0954102020000462
Savitzky, A., and Golay, M. J. (1964). Smoothing and differentiation of data by simplified least squares procedures. Anal. Chem. 36, 1627–1639. doi: 10.1021/ac60214a047
Schnurr, S., Osborn, K. J., Malyutina, M., Jennings, R., Brix, S., Driskell, A., et al. (2018). Hidden diversity in two species complexes of munnopsid isopods (Crustacea) at the transition between the northernmost North Atlantic and the Nordic Seas. Mar. Biodivers. 48, 813–843. doi: 10.1007/s12526-018-0877-6
Sneli, J.-A. (1998). A simple benthic sledge for shallow and deep-sea sampling. Sarsia 83, 69–72. doi: 10.1080/00364827.1998.10413670
Svavarsson, J., Stromberg, J.-O., and Brattegard, T. (1993). The deep-sea asellote (Isopoda, Crustacea) fauna of the Northern Seas: species composition, distributional patterns and origin. J. Biogeogr. 20, 537–555. doi: 10.2307/2845725
Thurber, A. R., Sweetman, A. K., Narayanaswamy, B. E., Jones, D. O., Ingels, J., and Hansman, R. (2014). Ecosystem function and services provided by the deep sea. Biogeosciences 11, 3941–3963. doi: 10.5194/bg-11-3941-2014
Vrijenhoek, R. C. (2009). Cryptic species, phenotypic plasticity, and complex life histories: assessing deep-sea faunal diversity with molecular markers. Deep Sea Res. II Top. Stud. Oceanogr. 56, 1713–1723. doi: 10.1016/j.dsr2.2009.05.016
Weisshappel, J., and Svavarsson, J. (1998). Benthic amphipods (Crustacea: Malacostraca) in Icelandic waters: diversity in relation to faunal patterns from shallow to intermediate deep Arctic and North Atlantic Oceans. Mar. Biol. 131, 133–143. doi: 10.1007/s002270050304
Wiens, J., Parra-Olea, G., García-París, M., and Wake, D. (2007). Phylogenetic history explains elevational biodiversity patterns in tropical salamanders. Proc. R. Soc. Lond. B 274, 919–928. doi: 10.1098/rspb.2006.0301
Wilson, G. D., Sims, C. A., and Grutter, A. S. (2011). Toward a taxonomy of the Gnathiidae (Isopoda) using juveniles: the external anatomy of Gnathia aureamaculosa zuphea stages using scanning electron microscopy. J. Crustac. Biol. 31, 509–522. doi: 10.1651/10-3432.1
Wolff, T. (1962). The Systematics and Biology of Bathyal and Abyssal Isopoda Asellota (Galathea Report). Copenhagen: Danish Science Press.
WoRMS Editorial Board (2021). World Register of Marine Species. Available online at: https://www.marinespecies.org (accessed October 6, 2021)
Yamasaki, H., Herranz, M., and Sørensen, M. V. (2020). An interactive identification key to species of Echinoderidae (Kinorhyncha). Zool. Anz. 287, 14–16. doi: 10.1016/j.jcz.2020.05.002
Keywords: Peracarida, deep-sea, taxonomy, interactive keys, COI barcoding, MALDI-TOF MS, depth distribution, geographical distribution
Citation: Kürzel K, Kaiser S, Lörz A-N, Rossel S, Paulus E, Peters J, Schwentner M, Martinez Arbizu P, Coleman CO, Svavarsson J and Brix S (2022) Correct Species Identification and Its Implications for Conservation Using Haploniscidae (Crustacea, Isopoda) in Icelandic Waters as a Proxy. Front. Mar. Sci. 8:795196. doi: 10.3389/fmars.2021.795196
Received: 14 October 2021; Accepted: 29 November 2021;
Published: 27 January 2022.
Edited by:
Elva G. Escobar-Briones, National Autonomous University of Mexico, MexicoReviewed by:
Gary C. B. Poore, Museum Victoria, AustraliaHiroshi Yamasaki, Kyushu University, Japan
Copyright © 2022 Kürzel, Kaiser, Lörz, Rossel, Paulus, Peters, Schwentner, Martinez Arbizu, Coleman, Svavarsson and Brix. This is an open-access article distributed under the terms of the Creative Commons Attribution License (CC BY). The use, distribution or reproduction in other forums is permitted, provided the original author(s) and the copyright owner(s) are credited and that the original publication in this journal is cited, in accordance with accepted academic practice. No use, distribution or reproduction is permitted which does not comply with these terms.
*Correspondence: Karlotta Kürzel, Lotta.kuerzel@gmx.de