Production of Sustainable Aviation Fuels in Petroleum Refineries: Evaluation of New Bio-Refinery Concepts
 Abid H Tanzil1
  Kristin Brandt2
  Xiao Zhang3
  Michael Wolcott2
  Claudio Stockle1
  Manuel Garcia-Perez1,4*
- 1Department of Biological Systems Engineering, Washington State University, Pullman, WA, United States
- 2Institute for Sustainable Design, Civil and Environmental Engineering Department, Washington State University, Pullman, WA, United States
- 3The Voiland School of Chemical Engineering and Bioengineering, Washington State University, Richland, WA, United States
- 4Bioproducts Sciences and Engineering Laboratory, Richland, WA, United States
The potential for petroleum refineries (PRs) to integrate sustainable aviation fuel (SAF) technologies is manifold, unlike with other existing industrial infrastructures that lack such technical similarities. A midsize PR with a crude oil capacity of 120,000 barrels per day was analyzed in this study to determine the feasibility of integrating five well-known lignocellulosic SAF technologies, namely, Virent’s BioForming (VB), alcohol to jet (ATJ), direct sugar to hydrocarbon (DSHC), fast pyrolysis (FP), and gasification and Fischer–Tropsch (GFT) methods, as well as one novel concept referred to as integrated carbonization-gasification-Fischer–Tropsch (ICGFT). The following three integrated scenarios were studied to derive the costs and environmental impact reductions: sharing of infrastructures from outside battery limits (OSBL), co-processing of SAF technology-derived intermediates with PR-derived gas oil inside battery limits (ISBL) and repurposing of an idle or shutdown PR. Sharing OSBL infrastructures resulted in reductions of the minimum fuel selling price (MFSP) by 3–14% relative to the corresponding standalone cases. Co-processing of intermediate products such as VB-derived long chain hydrocarbons, ATJ-derived ethanol, DSHC-derived farnesene, pyrolysis-derived bio-oil, and GFT-derived FT products reduced the MFSP by 10–19% from corresponding standalone cases. Moreover, repurposing scenarios reduced the costs by 16–34%. Greenhouse gas (GHG) estimations showed that 17 of 21 integrated scenarios resulted in GHG savings (7–92%). Lignocellulosic SAF technologies are limited by low fuel yields, which are governed by the high oxygen content of the feedstock. However, ICGFT was found to be advantageous in terms of fuel production at a maximized fuel yield.
Introduction
The contributions of fossil fuel-based energy throughout the world have been high over the past century (US Energy Information Administration, 2021). However, in the last 30 years, gradual increases in the use of renewable energy forms such as wind, solar, biomass, and hydroelectric power have occurred [US Energy Information Administration, 2021; British Petroleum (2021)., 2021]. In recent years, United States.-based petroleum refineries (PRs) have become a focal point of biomass-based renewable energy expansion strategies (Freeman et al., 2013; Gas Technology Institute, 2015; van Dyk et al., 2019; Giorgi, 2021). Declines in quality reservoirs, increases in environmental awareness, and advancement of biomass-based renewable energy technologies are some of the major drivers that have led PRs to seek out technical opportunities to incorporate renewable energy technologies (Keyrilainen and Koskinen, 2011; Ericson et al., 2019). Large corporations such as Phillips 66, Exxon Mobil, and World Energy are evaluating plans to repurpose their respective existing refineries to produce renewable fuels [Lane, 2019; City of Paramount (2020)., 2020; Elliott, 2020; Sanicola, 2021; Global Clean Energy Holdi, 2020]. Additionally, the United States Federal Aviation Administration (FAA) is collaborating with academic researchers and private organizations to develop biomass-based sustainable aviation fuel (SAF) supply chains to reduce carbon dioxide emissions (Hileman et al., 2013; Gas Technology Institute, 2015; Brown, 2016). However, even with recent advancements in biorefinery concepts, the majority of lignocellulosic biorefineries are still in either the demonstration or pilot phase (Mawhood et al., 2016) due to the high capital costs and low product yields (Swanson et al., 2010; Jones et al., 2013; Davis et al., 2015).
The downstream processing for most SAF concepts, according to current studies (Huber et al., 2006; Swanson et al., 2010; Jones et al., 2013; Pearlson et al., 2013; Davis et al., 2015), has technical similarities to conventional PR manufacturing operations such as hydrotreatment, hydrocracking, isomerization, steam methane reforming, and the final product distribution (Gary et al., 2010). Importantly, each of these manufacturing operations has the potential to be leveraged to improve the economics of SAFs. Depending on the initial feedstock type, several SAF technologies can be integrated at various stages of an existing refinery operation. For example, triglyceride feed can be readily fed into the hydrotreatment or fluid catalytic cracking (FCC) unit with heavy vacuum gas oil (HVGO) or light vacuum gas oil (LVGO) (Lappas et al., 2009; Sági et al., 2016; Bezergianni et al., 2018; De Paz Carmona et al., 2018; van Dyk et al., 2019), but it cannot be added into an atmospheric distillation unit (van Dyk et al., 2019). Lignocellulosic sugar streams, consisting of five- and 6-carbon components, require preprocessing (West et al., 2008; Olcay et al., 2013; Davis et al., 2015), before these materials can be co-processed with HVGO or LVGO. Another promising lignocellulosic intermediate, pyrolysis oil or bio-oil, can be co-processed with LVGO or HVGO (Zacher et al., 2014; Pinho et al., 2015; Pinho et al., 2017; Bezergianni et al., 2018; Stefanidis et al., 2018; Pinheiro Pires et al., 2019). However, the high oxygen content of bio-oil makes this intermediate unstable (Elliott, 2007; Bridgwater, 2012), and thus, it requires stabilization (Jones et al., 2013; Zacher et al., 2014) before co-processing. Co-processing-based integration scenarios have been conceptualized throughout the literature; however, detailed technoeconomic analyses of such scenarios are limited (Ali et al., 2018; Wu et al., 2019).
In this study, a framework developed by Martinkus et al. (Martinkus and Wolcott, 2017) was adopted to study the integration of lignocellulosic SAF technologies within existing PRs under various scenarios with the aim of achieving improvements in the cost structure as well as reductions in the environmental impacts. This framework of utilizing existing infrastructures was used to derive the following three types of integrated scenarios: 1) scenarios that use outside battery limits (OSBL) infrastructures, which are non-conversion units; 2) scenarios that co-process SAF-derived intermediates with PR-derived intermediates using both OSBL and inside battery limits assets (ISBL), and 3) scenarios that use an idle or shutdown PR infrastructure. Three sugar-based SAF technologies—Virent’s BioForming (VB) (Davis et al., 2015), alcohol to jet (ATJ) (Geleynse et al., 2018), direct sugar to hydrocarbon (DSHC) (Klein-Marcuschamer et al., 2013; Tanzil et al., 2021a) and two thermochemical SAF technologies—fast pyrolysis (Jones et al., 2013) and gasification and Fischer–Tropsch (GFT) (Swanson et al., 2010)—were studied in this work. In addition to these technologies, a new conceptual pathway (Tanzil et al., 2021a) referred to as integrated carbonization-gasification-Fischer–Tropsch (ICGFT) technology was also studied.
Materials and Methods
Methodology for the Evaluation of Biorefinery Concepts
To evaluate biorefinery concepts, Excel based standalone process models that include mass and energy balances, technoeconomic analyses (TEA) and greenhouse gas (GHG) emission analyses are built by following the methodology described in previous work (Garcia-Nunez et al., 2016). Data needed to build standalone process models of a PR and six SAF technologies are described in detail in Petroleum Refineries and Sustainable Aviation Fuel Scenario. Integration concepts of co-location and repurposing were applied to generate alternative scenarios for the evaluations of costs and environmental impact reductions.
Petroleum Refineries
Unlike a corn ethanol mill or sugarcane mill, the existing PRs are not concentrated in a specific region in the United States (US Energy Information Administration, 2016). For this work, it was assumed that the existing PRs were located within the Midwest (PADD 2) (US Energy Information Administration, 2016), which allowed us to take advantage of corn stover-based SAF technologies that have been developed in previous work (Tanzil et al., 2021b). A PR with an atmospheric distillation capacity of 120,000 BPD (barrels per day) was used as the existing baseline capacity (Sun et al., 2018). This refinery accommodates an atmospheric distillation column that produces gas, light naphtha, heavy naphtha, gas oil, and heavy bottoms (Gary et al., 2010; Sun et al., 2018). Light naphtha, heavy naphtha, and gas oil are further processed (hydrotreatment, hydrocracking, isomerization, and catalytic reforming) in the refinery to produce jet/kerosene, diesel, and gasoline (Gary et al., 2010; Sun et al., 2018). The historic significance of heavy bottoms or residuals as direct fuel for other industries has dwindled over the past few decades in response to new environmental regulations (Gary et al., 2010). Therefore, further sequential processing of bottoms via vacuum distillation, fluid catalytic cracking (FCC), coking, and hydrotreatment must be completed (Sun et al., 2018). A schematic of this complicated process is included in the Supplemental Information. Table 1 shows the capacity of the major processing units for the PR scale used in this study, as well as utility consumption (Sun et al., 2018).
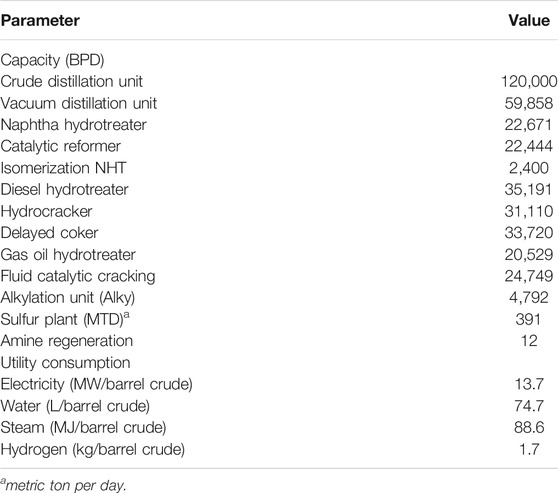
TABLE 1. Processing capacities of major equipment in the PR scenario and utility consumption; all values were taken from (Sun et al., 2018).
Sustainable Aviation Fuel Scenario
The PR facility was assumed to be located in the Midwest, so the most abundant lignocellulosic feedstock (corn stover) in that region (National Corn Growers Ass, 2016) was chosen as the feedstock for the SAF technologies. The standalone SAF technologies were termed VB_A, ATJ_A, DSHC_A, FP_A, and GFT_A, where A denotes the respective standalone technology. The conceptualized novel process, ICGFT, which has been described in detail in previous work (Tanzil et al., 2021a) was also modeled as a standalone scenario (ICGFT_A). This work investigated the integration opportunities offered for lignocellulosic processes. Although triglyceride-based HEFA (hydroprocessed esters and fatty acids) processes are readily available for integration as intermediates because of the low oxygen content (Starck et al., 2016), HEFA-based integration is only under construction by World Energy on a commercial scale (Lane, 2019) at a California site [City of Paramount (2020)., 2020]. This study focused on lignocellulosic SAF processes, which pose challenges as a result of their high oxygen content in both the feedstock and intermediates. These challenges are addressed on a case-by-case basis.
In two previous studies (Tanzil et al., 2021b; Tanzil et al., 2021c) integration scenarios were formulated based on the existing facilities capital structure. However, an existing PR facility has both a larger capacity and higher capital costs (Gary et al., 2010) than an existing corn ethanol mill (Wallace et al., 2005; Kwiatkowski et al., 2006) or sugarcane mill (Tanzil et al., 2021c). The capacity of standalone SAF scenarios was determined by the co-processing capacity of a PR, which typically ranges between 5 wt% to 15 wt% of the co-processing material (Gary et al., 2010; Pinho et al., 2015). In this work, this range was used to calculate the SAF capacity of each technology so that the corresponding feedstock capacity (corn stover) was maintained at under 2,000 metric tons per day (MTD). This can be regarded as a viable commercial-scale feedstock capacity (Swanson et al., 2010; Humbird et al., 2011; Jones et al., 2013; Quinn and Davis, 2015). Therefore, the co-processing ratio differed from 6 to 15%. For example, GFT_A-derived Fischer–Tropsch (FT) products were co-processed at a co-processing ratio of 7% to maintain the initial feedstock capacity under 2000 MTD. DSHC_A-derived farnesene was co-processed at a ratio of 6% in the hydrocracker. Farnesene is a C-15 unsaturated hydrocarbon molecule that is hydrogenated and cracked in the hydrocracker. Both VB_A and ATJ_A had a 10% co-processing ratio. For FP_A, a 15% co-processing ratio was used to limit the feedstock capacity to 1274 MTD. Because of the proposed high fuel yield (Tanzil et al., 2021a), ICGFT_A had a significantly lower feedstock capacity.
Table 2 shows the calculated SAF capacities [million liters per year (MLY)], corn stover capacity, and fixed capital investment (FCI). Capacities and FCIs of these standalone facilities were scaled from process models built in previous studies (Tanzil et al., 2021a; Tanzil et al., 2021b).
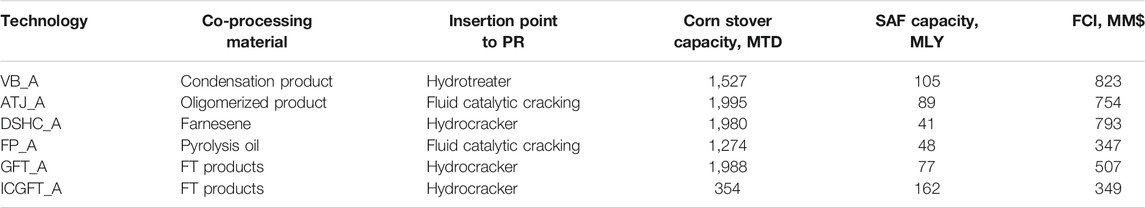
TABLE 2. SAF capacities, feedstock capacities, and scaled FCI; corn stover was the feedstock.
Depending on the SAF process pathway, the biomass-derived intermediates were co-processed with heavy gas oil (HGO) in the following upgrading units: hydrotreater, hydrocracker, and FCC.
Integrated SAF Concepts
Two types of integration strategies were included in the analysis (de Jong et al., 2015; Tanzil et al., 2019; Tanzil et al., 2021b), namely, co-location and repurposing. Co-location strategies explored the infrastructure of an existing PR without interruption of the production of petroleum products (de Jong et al., 2015). In this work, co-located scenarios were divided into two categories. In the first category, scenarios that utilized only OSBL infrastructures were defined (Table 3).
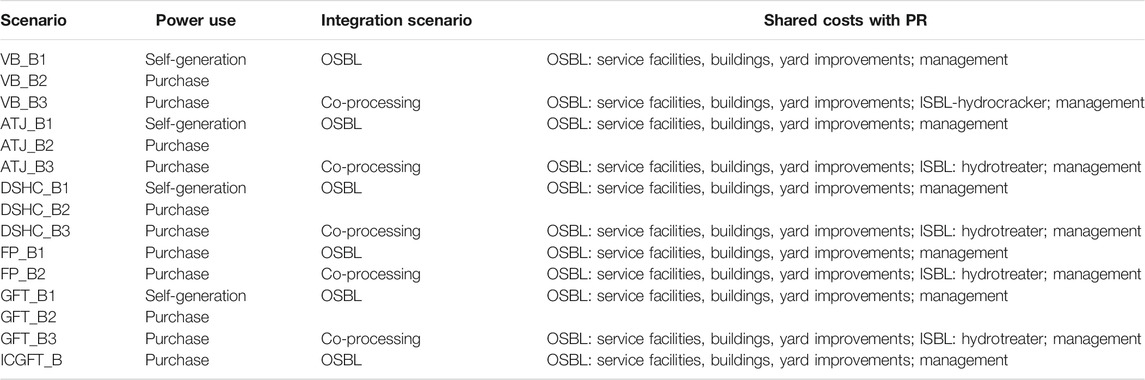
TABLE 3. Defined features of integrated scenarios–co-located; corn stover was the feedstock.
These were not directly involved in the conversion process of crude oil to various fuel products, e.g., buildings, yard improvements, and some of the service facilities. The capacities of the five components of service facilities—steam generation, power substation, power distribution, water distribution, and product storage capacity—were subject to co-located integration strategies. Due to the high capacity of PR infrastructure and well-established technological identities, a 20% cutoff margin was assumed for these service facilities to share with any of the SAF technologies. The core management group of plant managers and engineers was also considered to be shared.
In the second category of co-located scenarios, the co-processing capabilities of a PR were utilized, and these are detailed in Sustainable Aviation Fuel Scenario. Therefore, scenarios involving co-processing of compatible intermediates were generated (Figure 1). In addition to the OSBL component of the first category, these scenarios represent the conversion process equipment located ISBL.
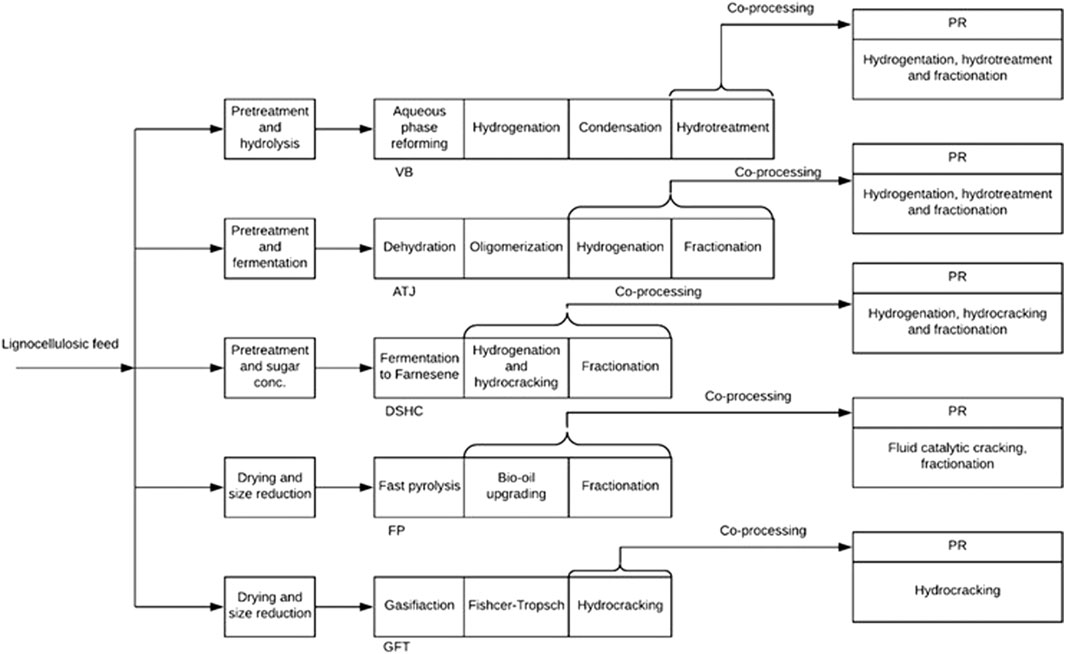
FIGURE 1. Schematic of the proposed co-processing scenarios between an existing PR and emerging SAF processes.
Table 3 lists the integrated scenarios, which utilize existing infrastructure for either co-location or co-processing as well as defining each scenario as either purchasing or self-generating electricity.
Because of the feedstock limitations, the crude oil capacity of 120,000 BPD chosen for co-location was too large for the repurposing scenarios. Therefore, the SAF capacity for the repurposed scenarios (Table 4) remained the same as that in the co-located scenarios. Lignocellulosic SAF technology requires additional equipment not included in a PR. However, two large advantages for repurposing a PR are the avoidance of power generation module costs and not having to purchase hydrogen from an external source; note that these are required for co-located scenarios. However, a repurposed PR needs to be valued and added as an FCI component in the repurposed scenarios. In this work, this component was calculated to be $72 MM$ from the literature (Lane, 2019) assuming the six-tenth rule of scaling.
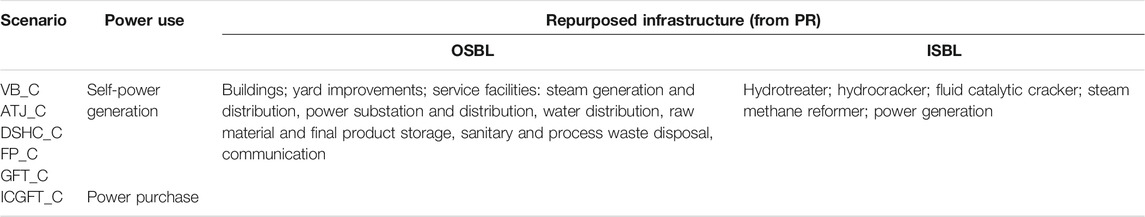
TABLE 4. Defined features of integrated scenarios–repurposed; corn stover was the feedstock.
Mass and Energy Flow
The technical data that were required to build the material and energy flows of the studied processes are given in the Supplemental Information (Supplementary Tables S1A–S1E; Supplementary Tables S2A–S2F); these data were used to build the material and energy flows of both the standalone and integrated scenarios.
Technoeconomic Analysis
TEA included capital and operational cost estimations, followed by a financial analysis to determine the minimum fuel selling price (MFSP) of each scenario. In this work, the MFSP was estimated for the SAF. Other fuel prices were determined based on the correlation between historic price data for the SAF and other fuels, which was carried out in previous work (Tanzil et al., 2021b). The methodology to conduct the TEA has been well documented in two previous studies (Tanzil et al., 2021a; Tanzil et al., 2021b). The set of assumptions for the financial analysis are given in Supplementary Tables S4 and S5. Reference equipment costs were taken from various sources (Davis et al., 2015; Jones et al., 2013; Swanson et al., 2010; Klein-Marcuschamer et al., 2013; Humbird et al., 2011) and were used to calculate fixed capital costs using ratio factors (Peters et al., 2004). The modified cost ratio factors for this work are given in Supplementary Table S3 in the Supplemental Information. A corn stover price of $70/dry metric ton (20% initial moisture) was taken from the literature (Edwards, 2014). Electricity sales price ($0.038/kWh) and purchase price ($0.069/kWh) were taken as 5 year averages (2013–2017) from the Energy Information Administration (EIA) (EIA. US, 2018; US EIA, 2020a). The 5 year average (2013–2017) of natural gas ($4.20/MMBtu) was also taken from the EIA (US EIA, 2018). Other raw material prices are given in the Supplemental Information (Supplementary Table S6). A levelized hydrogen price of $1.77/kg was taken from a United States Department of Energy (DOE) estimation that included capital and operational costs to produce hydrogen (Dillich et al., 2012). The reference salary structure was taken from the literature (Jones et al., 2013) (Supplementary Table S9). The methodology to determine the adjusted salary structure has been outlined in previous work (Tanzil et al., 2021b). All of the analyses were carried out for the cost year of 2017.
Greenhouse Gas Emissions
GHG emission profiles were developed for the integrated scenarios between the PR and SAF processes following an attributional life cycle assessment (ALCA) approach. A cradle-to-gate system boundary was established as in previous work (Tanzil et al., 2021b). The material and energy flow data are given in Supplementary Tables S7A–S7F. A list of emission factors is also given in the Supplemental Information (Supplementary Table S8). The functional unit selected was 1 MJ of the total fuel product.
Results and Discussion
Overall Mass and Energy Flowrate
For this study, a medium-sized PR with a heavy coking configuration that processes 120,000 BPD was analyzed (Sun et al., 2018). Figure 2 shows a flow diagram of the overall material and energy flow. The hydrogen flow represents a steam methane reforming facility inside the refinery that produces 8.5 MT H2/hr as required. This configuration processes heavy fuel oil via further hydrotreatment and cracking (FCC) to produce gasoline and diesel.
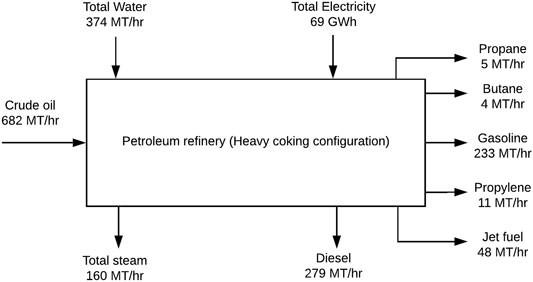
FIGURE 2. Process flow diagram for a 120,000 BPD or 682 MT/hr petroleum refinery; The entities that were essential to determine the extent of integration strategies were reported in this flow diagram.
Fig. shows the overall material and energy flow for the Midwest-based SAF standalone scenarios. The high co-processing capacity of the PR enabled the studied SAF technologies to increase the fuel capacity beyond that in previous work (Tanzil et al., 2021a; Tanzil et al., 2021b). The high H2 consumption by ICGFT_A was caused by the steam methane reforming (SMR) facility that provided CO2 for gasification to increase the fuel yield (Tanzil et al., 2021a). The material and energy flows in Figure 2 and Figure 3 were used to determine whether the OSBL-based co-located scenarios matched the 20% cutoff sharing infrastructures.
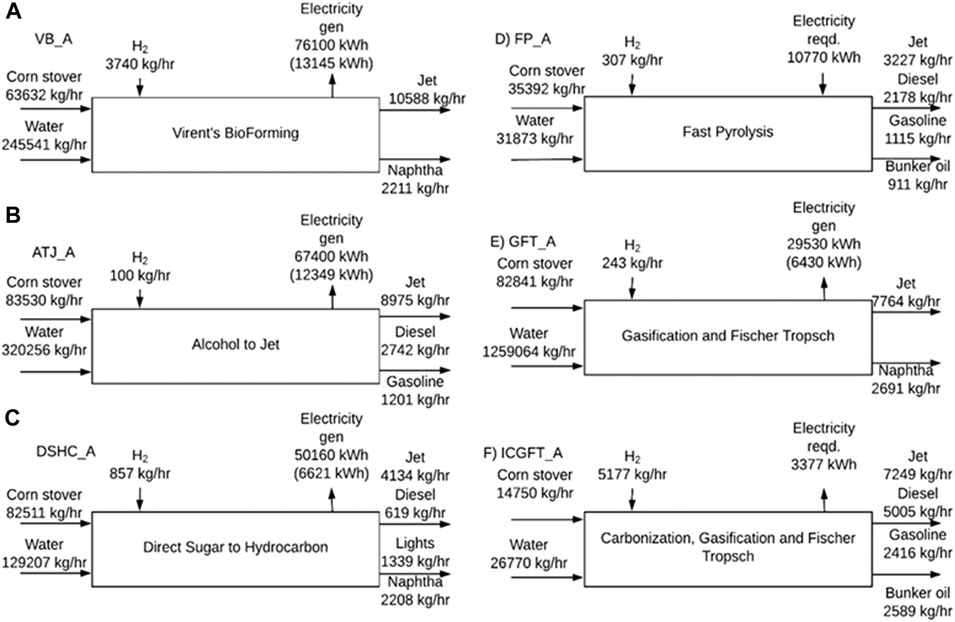
FIGURE 3. Mass and energy flow in the corn stover-based SAF standalone scenarios.
The large capacity of the PR (Figure 2) allowed the integrated SAF processes to utilize service facilities without surpassing the 20% cutoff requirement for the steam generation, power substation, distribution, and product storage. The water distribution facility was only utilized by two co-located scenarios, namely, FP_B1 and FP_B2, because of the lower water consumption in these two scenarios. Thus, the portion of the ratio factor that covered the service facilities was modified to be in the range of 27–29.5% for all co-located scenarios (Supplementary Table S3). The ratio factor was also reduced for buildings to 29% (Peters et al., 2004). However, for repurposed scenarios, this decreased to 7% for buildings (Peters et al., 2004). In addition, the yard improvement cost was assumed to be zero for all scenarios. More service facilities would be available for a repurposed scenario, and hence, a much lower ratio factor of 8.5% was needed. Details are given in Supplementary Table S3.
CAPEX, OPEX, and MFSPs
Unlike corn ethanol mills (Tanzil et al., 2021b) and sugarcane mill-based integration (Tanzil et al., 2021c), PR-based integration scenarios have higher capital and operational costs as a result of the higher production capacities (Table 2). Figure 4 demonstrates the FCI reduction opportunities for each integrated scenario from their respective standalone scenario. Sharing the cost of the OSBL infrastructure (VB_B1, ATJ_B1, DSHC_B1, FP_B1, GFT_B1, and ICGFT_B) reduced the costs by 6–10%. In addition to OSBL cost sharing, replacement of the power generation module with power purchases (VB_B2, ATJ_B2, DSHC_B2, and GFT_B2) reduced the costs by 26–33% compared with the standalone scenarios. The capital costs were reduced by 28–39% if co-processing was adopted (VB_B3, ATJ_B3, DSHC_B3, FP_B2, and GFT_B3). Repurposing strategies reduced the capital costs by 12–44% in comparison with the standalone scenarios (VB_C, ATJ_C, DSHC_C, FP_C, and GFT_C). In all repurposed scenarios, the cost of the PR (72 MM$) was added as the FCI component.
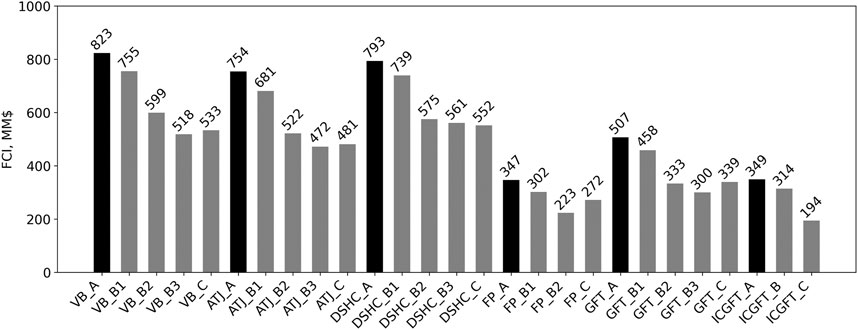
FIGURE 4. FCI reductions of integrated scenarios (grey), in comparison with their respective standalone scenarios (black).
Although CAPEX reductions were realized, OPEX did not always decrease as shown in Figure 5. Four scenarios, namely, VB_B2, VB_B3, ATJ_B2, and DSHC_B2, had OPEXs that increased by 3–9% because of the purchase of electricity. Six scenarios that only utilized OSBL infrastructures from the PR (VB_B1, ATJ_B1, DSHC_B1, FP_B1, GFT_B1, and ICGFT_B) reduced OPEX slightly by 1–2% from the respective standalone scenarios due to salary reductions of 10%. For these scenarios, the maintenance cost (Supplementary Table S5) did not change from the corresponding standalone scenarios because these integrated scenarios did not have cost reductions from ISBL.
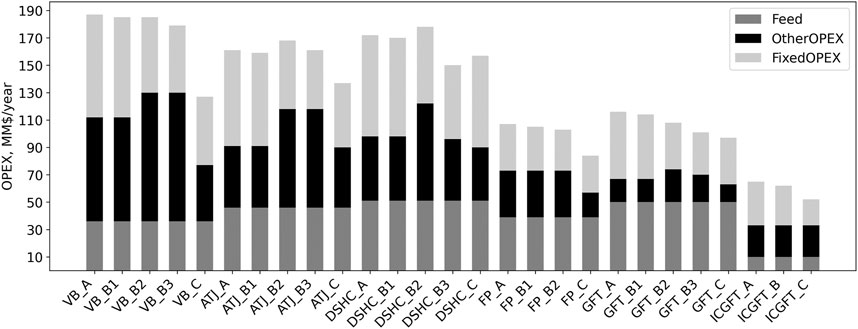
FIGURE 5. Comparison of OPEX components of integrated scenarios with their respective standalone scenarios (VB_A/ATJ_A/DSHC_A/FP_A/GFT_A/ICGFT_A).
For the other scenarios, fixed OPEX was reduced by 3–41% from the corresponding standalone scenarios because of cost reductions from ISBL. Therefore, three co-processing scenarios (DSHC_B3, FP_B2, and GFT_B3) reduced the total OPEX by 10–13% from the respective standalone scenarios, and repurposed scenarios reduced OPEX by 8–32% from the respective standalone scenarios. It is noteworthy that the other OPEX (OPEX of raw materials and energy) of the two repurposed scenarios (VB_C and FP_C) were reduced by 47% because the levelized cost of H2 was replaced by using already existing steam methane reforming inside the repurposed PR facility. In such a case, the purchase of natural gas (assuming a stoichiometric SMR reaction) nearly halved the other OPEXs.
The cost profiles of FCI and OPEX were reflected in their respective MFSP estimations (Table 5). Sharing only OSBL infrastructures (VB_B1, ATJ_B1, DSHC_B1, FP_B1, GFT_B1, and ICGFT_B) reduced MFSP by 3–6% in comparison with the respective standalone scenarios, while the non-power generating scenarios (VB_B2, ATJ_B2, DSHC_B2, and GFT_B2) reduced the costs by 2–14%. Co-processing scenarios reduced the MFSP by 10–19% compared with the respective standalone scenarios. Repurposed scenarios reduced the MFSP by 16–34%, following contributions from the reduced OPEX and FCI, as discussed above.
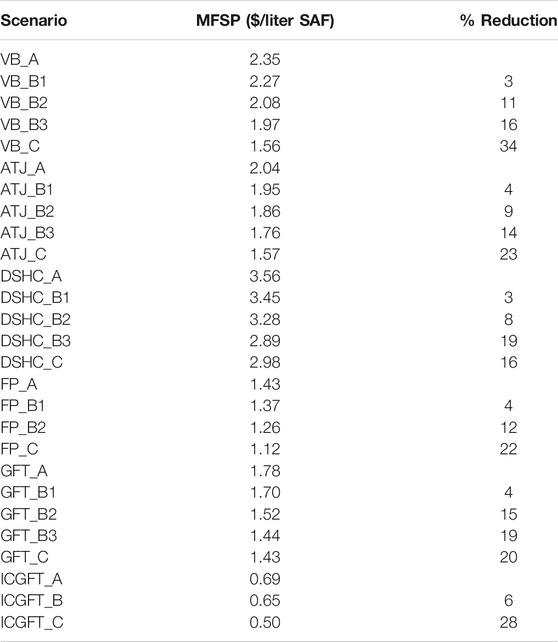
TABLE 5. MFSPs of all studied scenarios.
Sensitivity Analyses
Single point sensitivity analyses of five parameters—co-processing ratio, feedstock cost, real discount rate, FCI, and equity (Davis et al., 2015)—were carried out in this work. The base values of the equity and real discount rate are taken as 30% of FCI and 10%, respectively (Davis et al., 2015). The rest of the base values are given in Sustainable Aviation Fuel Scenario. For favorable and unfavorable values of the equity and discount rate, ±50% of the base value was assigned, as taken from the literature (Humbird et al., 2011; Davis et al., 2015). A favorable value of $60/dry MT and an unfavorable value of $100/dry MT of corn stover was also taken from the literature (Thompson and Tyner, 2014; US Department of Energy, 2011). For the FCI sensitivity calculation, ±30% was used as the percent delivered method considering a ±30% estimation error in estimating the FCI (Peters et al., 2004). Sensitivity analyses for the new concepts ICGFT_B and ICGFT_C were not carried out because their MFSP values were close to conventional jet fuel prices (US EIA, 2020b).
Figure 6 shows the sensitivity plot of five integrated scenarios that utilized only the shared infrastructure from an existing PR. The favorable values of these parameters analyzed individually only reduced the MFSP values by 2–16%. In terms of the sensitivity ranking, the impact of the co-processing ratio was consistently among the two bottom parameters except for FP_B1.
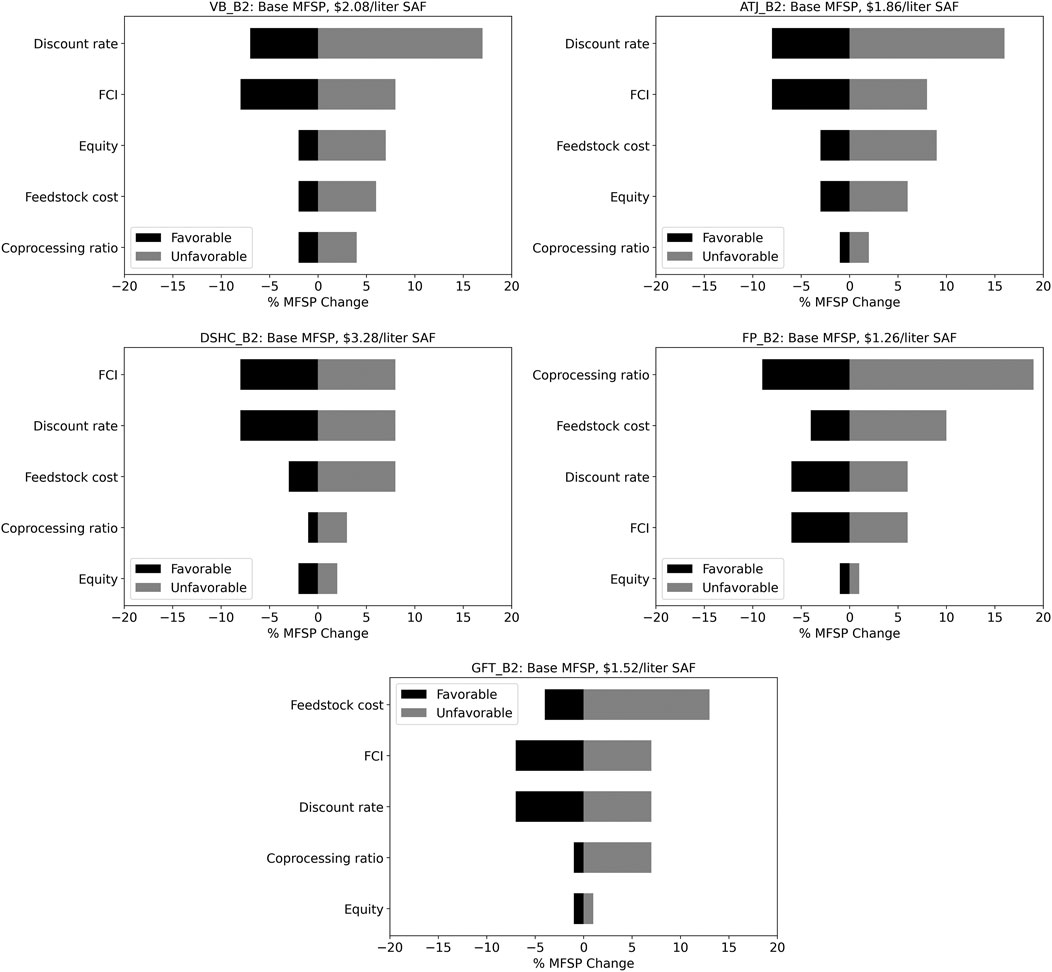
FIGURE 6. Examples of the sensitivity analyses of integrated scenarios for OSBL sharing.
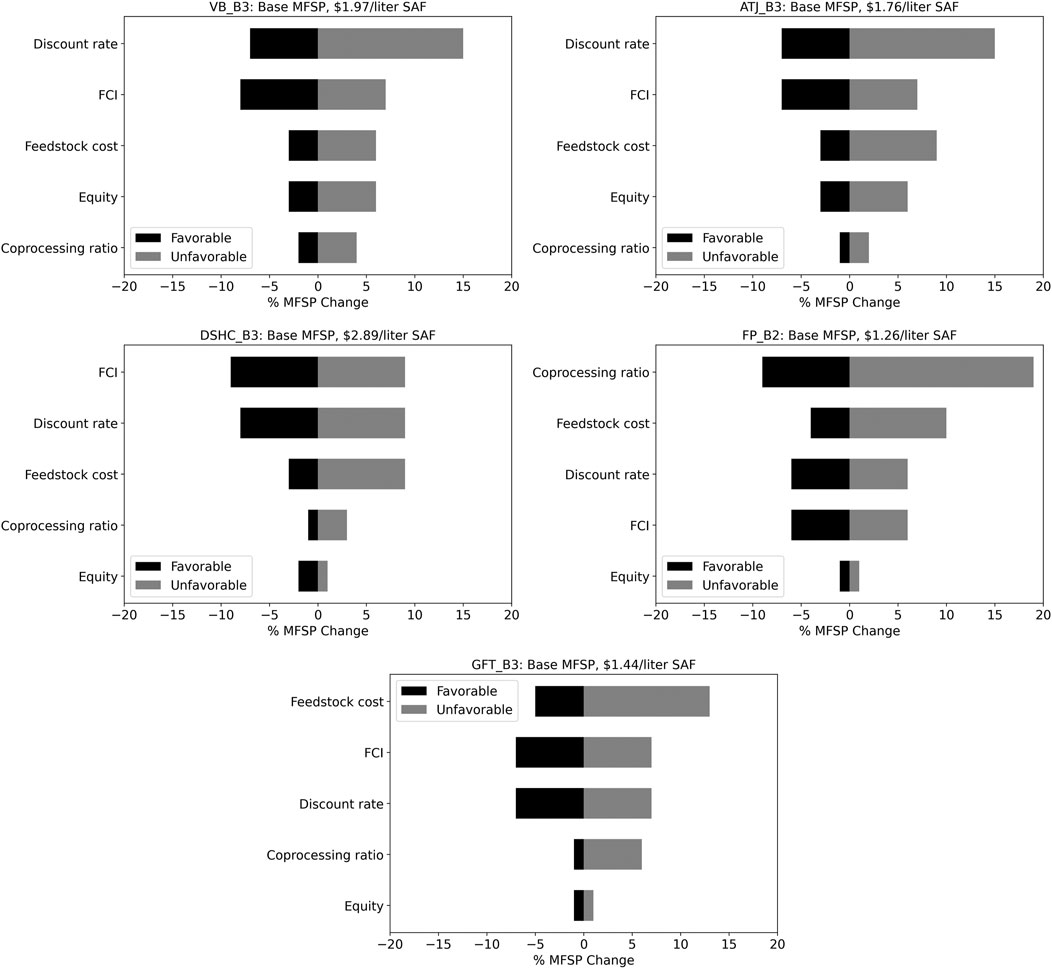
FIGURE 7. Sensitivity analyses of the co-processing scenarios studied in this work.
The co-processing ratio can be directly correlated to both the fuel capacity and feedstock capacity. As described in Sensitivity Analyses, the choice of the base value of the co-processing ratio was dictated by the feedstock processing capacity, which was close to 2,000 MTD, except for FP_B1. Therefore, a ±50% variation indicated a feedstock range between 1,000 and 3,000 MTD (approximately). Previous work suggests (Tanzil et al., 2021a) that MFSP values do not change significantly after 1,000 MTD of feedstock capacity, and values tend to flatten after 2,000 MTD. Similar suggestions also have been made in the case of MFSP vs fuel capacity (Tanzil et al., 2021a). However, it also has been suggested that a high feedstock capacity or fuel capacity can increase the MFSP value (Tanzil et al., 2021a). Because in case of a low fuel yield scenario, high feedstock capacity can significantly increase the capital and operational cost. This explanation can be linked to the fact that DSHC_C (Figure 8) had a 30% increase in MFSP for a 50% increase in the co-processing ratio or fuel capacity.
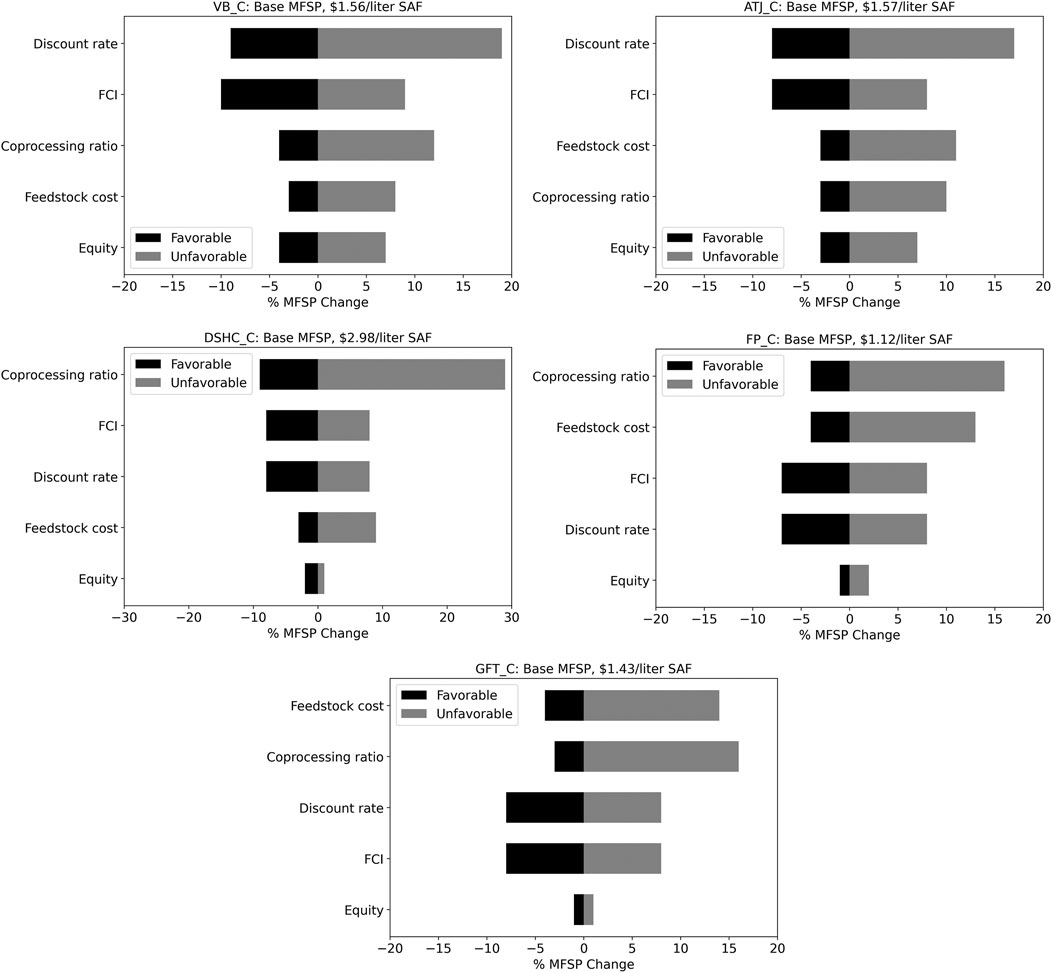
FIGURE 8. Sensitivity analyses of repurposed scenarios.
The sensitivity of feedstock cost appears to be among the two top parameters for the majority of the repurposed scenarios (Figure 8).
Greenhouse Gas Emission Profiles
Table 6 shows the GHG emission profiles of the integrated scenarios, which were categorized into the following three segments: feedstock usage, conversion site, and co-product credits. Greenhouse gas (GHG) estimations showed that 17 of 21 integrated scenarios resulted in GHG savings (7–92%).
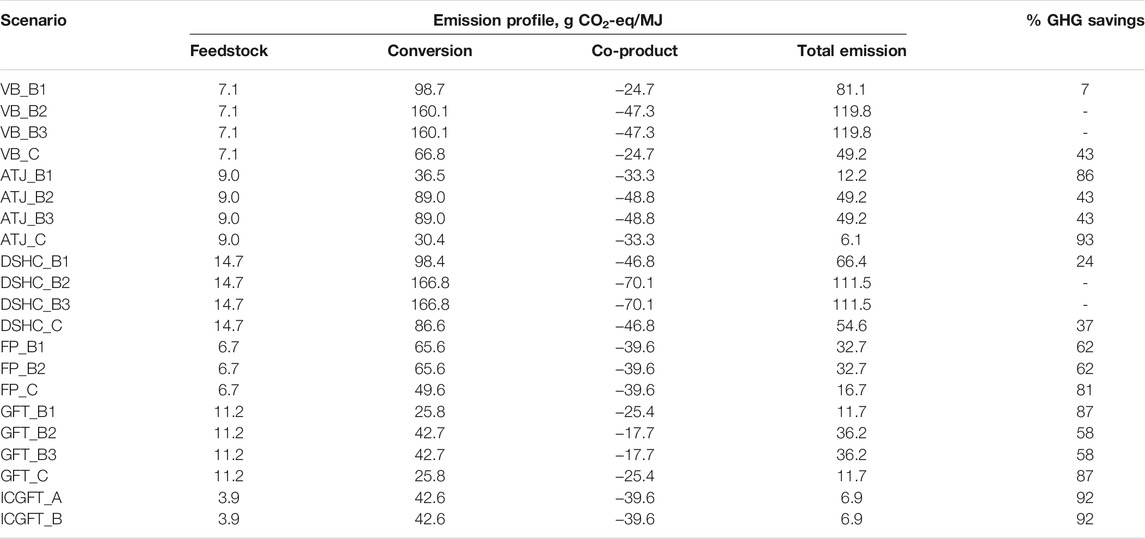
TABLE 6. GHG emission profiles of the studied scenarios.
Corn stover usage resulted in GHG emissions in the range of 4–15 g CO2-eq/MJ of total fuel. The emissions from the conversion site were dominated by the energy consumption as well as hydrogen consumption. VB_B2, VB_B3, DSHC_B2, and DSHC_B3 showed higher emissions as a result of the high hydrogen consumption and fossil fuel-based electricity. The repurposed scenarios yielded lower emissions than co-located scenarios because the former took advantage of the onsite SMR plant to produce hydrogen, thus avoiding the high emission factor of purchased hydrogen. The co-product credit includes lignin sales, the electricity credit, and the displaced emission profile by hydrocarbon fuels other than SAF. Dry lignin fuel was assumed to replace the emissions caused by coal.
A displacement factor of 10 kg coal/kg lignin (Pourhashem et al., 2013) was used to calculate the emission credit by lignin fuel sales. Seventeen integrated scenarios resulted in GHG savings (Table 6) compared with the GHG emission value of 87.3 gCO2-eq/MJ of conventional fossil fuel (GREET, 2018).
Selection Matrix
The estimated MFSPs (Table 5) and GHG emissions (Table 6) are two performance criteria used to evaluate the integrated scenarios. Economic performance largely relies on the cost structure (lower MFSP is desired), while environmental performance relies on process improvements in terms of less energy consumption and on the method of emission estimation (lower GHG emission is desired). Scores from 0% (highest MFSP/GHG emission) to 100% (lowest MFSP/GFG emission) were assigned to each of the estimated MFSP and GHG emission values.
The detailed methodology for depicting both types of performance (Figure 9) is adopted from elsewhere (Garcia-Nunez et al., 2016; Tanzil et al., 2021b) and outlined in the Supplemental Information (Supplementary Tables S10, S11). The spider plot in Figure 9 shows that the repurposed scenario (ICGFT_C) of the proposed novel technology ICGFT had the best performance in terms of both economic and environmental impacts. Although each of the integrated scenarios reduced the MFSP, only one scenario (ICGFT_C) from the proposed novel concept had an MFSP lower than that of conventional jet fuel ($0.54/L) (US EIA, 2020b).
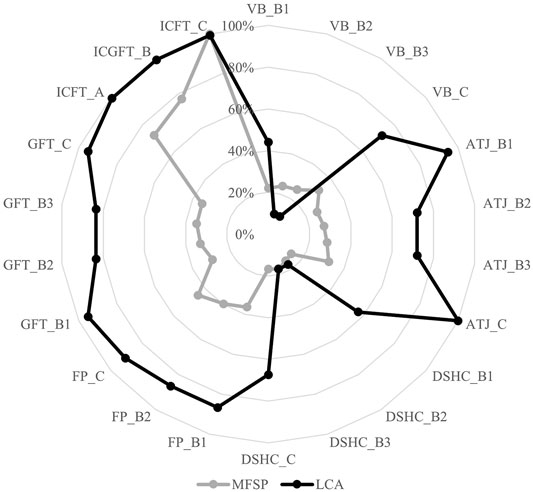
FIGURE 9. Spider plot of economic and environmental performances for all integrated scenarios.
Conclusion
The technical compatibility and higher capacities of petroleum refineries allow for larger SAF capacities compared with existing corn ethanol (Tanzil et al., 2021b) and sugarcane mills (Tanzil et al., 2021c). The high processing capacity of petroleum refineries offers significant cost reduction opportunities. Co-processing offers ISBL cost savings downstream, particularly during hydroprocessing. On the other hand, repurposing enables cost savings by not only the hydroprocessing unit, but also by the SMR unit. Although the cost of using a shutdown PR facility is added, repurposed scenarios also offer significant OPEX reduction opportunities because of the cheaper natural gas consumption compared with the direct consumption of expensive hydrogen. The overall capital cost reduction ranged from 7 to 44% in this study. The overall MFSP reduction ranged from 3 to 28%. Only the repurposed scenarios reduced the GHG emissions from the corresponding base cases. However, 14 out of the 21 scenarios resulted in GHG savings of 16–92% from the known emission of 87 gCO2-eq/MJ for fossil fuel (GREET, 2018). The results from this research indicated that the high yielding novel concept of ICGFT could have both economic and environmental advantages by providing a pathway to maximize the fuel yield, which needs to be further investigated. In the case of sensitivity analyses, almost every scenario showed a distinguishable trend (ranking) in terms of the sensitivity of the MFSP according to the five parameters mentioned above. This finding indicated that all five parameters may play an important role in further reductions of the MFSP.
Data Availability Statement
The original contributions presented in the study are included in the article/Supplementary Material, further inquiries can be directed to the corresponding author.
Author Contributions
All authors contributed to the concept design and development. AT collected the data and completed the model analysis with intellectual input from KB, MW, and MG-P. The first draft was written by AT and all other authors provided their suggestions on previous versions. The final version of the manuscript was read and approved by all authors.
Funding
We will use funds from our FAA project to pay for this paper (13C-AJFE-WaSu-013). Dr. Garcia-Perez is very thankful to the USDA/NIFA for financial support through Hatch Project #WNP00701.
Conflict of Interest
The authors declare that the research was conducted in the absence of any commercial or financial relationships that could be construed as a potential conflict of interest.
Publisher’s Note
All claims expressed in this article are solely those of the authors and do not necessarily represent those of their affiliated organizations, or those of the publisher, the editors and the reviewers. Any product that may be evaluated in this article, or claim that may be made by its manufacturer, is not guaranteed or endorsed by the publisher.
Supplementary Material
The Supplementary Material for this article can be found online at: https://www.frontiersin.org/articles/10.3389/fenrg.2021.735661/full#supplementary-material
References
Ali, A. A. M., Mustafa, M. A., and Yassin, K. E. (2018). A Techno-Economic Evaluation of Bio-Oil Co-processing within a Petroleum Refinery. Biofuels 12, 645–653. doi:10.1080/17597269.2018.1519758
Bezergianni, S., Dimitriadis, A., Kikhtyanin, O., and Kubička, D. (2018). Refinery Co-processing of Renewable Feeds. Prog. Energ. Combustion Sci. 68, 29–64. doi:10.1016/j.pecs.2018.04.002
Bridgwater, A. V. (2012). Review of Fast Pyrolysis of Biomass and Product Upgrading. Biomass and Bioenergy 38, 68–94. doi:10.1016/j.biombioe.2011.01.048
British Petroleum (2021). Statistical Review of World Energy 2021. Available at: https://www.bp.com/en/global/corporate/energy-economics/statistical-review-of-world-energy.html.
Brown, N. (2016). Alternative Jet Fuels Research & Development. Available at: https://www.energy.gov/sites/prod/files/2016/11/f34/brown_bioenergy_2016.pdf.
City of Paramount (2020). AltAir/World Energy Refinery Conversion Project under Review. Available at: http://www.paramountcity.com/Home/Components/News/News/1349/16.
Davis, R., Tao, L., Scarlata, C., Tan, E. C. D., Ross, J., Lukas, J., et al. (2015). Process Design and Economics for the Conversion of Lignocellulosic Biomass to Hydrocarbons:Dilute-Acid and Enzymatic Deconstruction of Biomass to Sugars and Catalytic Conversion of Sugars to Hydrocarbons. Golden, CO: National Renewable Energy Laboratory.
de Jong, S., Hoefnagels, R., Faaij, A., Slade, R., Mawhood, R., and Junginger, M. (2015). The Feasibility of Short-Term Production Strategies for Renewable Jet Fuels - a Comprehensive Techno-Economic Comparison. Biofuels, Bioprod. Bioref. 9 (6), 778–800. doi:10.1002/bbb.1613
De Paz Carmona, H., Horáček, J., Brito Alayón, A., and Macías Hernández, J. J. (2018). Suitability of Used Frying Oil for Co-processing with Atmospheric Gas Oil. Fuel 214, 165–173. doi:10.1016/j.fuel.2017.10.133
Dillich, S., Ramsden, T., and Melina, M. (2012). “Hydrogen Cost Using Low Cost Natural Gas,”. DOE Hydrogen and Fuel Cells Program Record # 12024 (Washington, DC: Office of Energy Efficiency and Renewable Energy).
Edwards, W. (2014). Estimating a Value for Corn Stover. Ames, IA: Iowa State University Extension and Outreach. Available at: https://store.extension.iastate.edu/product/14061.
EIA. US (2018). Average Annual Industrial Electricity Price. Washington, DC: Energy Information Administration. Available at: https://www.eia.gov/electricity/.
Elliott, D. C. (2007). Historical Developments in Hydroprocessing Bio-Oils. Energy Fuels 21 (3), 1792–1815. doi:10.1021/ef070044u
Elliott, R. (2020). US Oil Refiners Accelerate Shift to Renewables in Downturn. Available at: https://www.wsj.com/.
Ericson, S., Engel-Cox, J., and Arent, D. (2019). “Approaches for Integrating Renewable Energy Technologies in Oil and Gas Operations,”. NREL/TP-6A50-72842 (Golden, CO: Joint Institute for Strategic Energy Analysis (JISEA) at the National Renewable Energy Laboratory (NREL)).
Freeman, C. J., Jones, S. B., Padmaperuma, A. B., Valkenburg, C., and Shinn, J. (2013). Initial Assessment of U.S. Refineries for Purposes of Potential Bio-Based Oil Insertions, PNNL-22432. Richland, WA: Pacific Northwest National Laboratory.
Garcia-Nunez, J. A., Rodriguez, D. T., Fontanilla, C. A., Ramirez, N. E., Silva Lora, E. E., Frear, C. S., et al. (2016). Evaluation of Alternatives for the Evolution of palm Oil Mills into Biorefineries. Biomass and Bioenergy 95, 310–329. doi:10.1016/j.biombioe.2016.05.020
Gary, J. H., Handwerck, G. E., and Kaiser, M. J. (2010). Petroleum Refining: Technology and Economics. 5th ed. NYC, NY: CRC Press, Taylor & Francis Group.
Gas Technology Institute (2015). Refinery Upgrading of Hydropyrolysis Oil from Biomass. Available at: https://www.osti.gov/servlets/purl/1221922.
Geleynse, S., Brandt, K., Garcia-Perez, M., Wolcott, M., and Zhang, X. (2018). The Alcohol-To-Jet Conversion Pathway for Drop-In Biofuels: Techno-Economic Evaluation. ChemSusChem 11 (21), 3728–3741. doi:10.1002/cssc.201801690
Giorgi, P. (2021). Reinventing the Refinery through the Energy Transition and Refining Petrochemical Integration. Available at: https://ihsmarkit.com/research-analysis/energy-transition-and-petchem-integration.html.
Global Clean Energy Holdings Inc (2020). California Refinery to Be Converted to Produce Renewable Diesel. Available at: http://biomassmagazine.com/articles/17036/california-refinery-to-be-converted-to-produce-renewable-diesel.
GREET (2018). Greenhouse Gases, Regulated Emissions, and Energy Use in Transportation (GREET) Model Argonne. Lemont, IL: National Laboratory.
Hileman, J. I., De la Rosa Blanco, E., Bonnefoy, P. A., and Carter, N. A. (2013). The Carbon Dioxide challenge Facing Aviation. Prog. Aerospace Sci. 63, 84–95. doi:10.1016/j.paerosci.2013.07.003
Huber, G. W., Iborra, S., and Corma, A. (2006). Synthesis of Transportation Fuels from Biomass: Chemistry, Catalysts, and Engineering. Chem. Rev. 106 (9), 4044–4098. doi:10.1021/cr068360d
Humbird, D., Davis, R., Tao, L., Kinchin, C., Hsu, D., Aden, D., et al. (2011). “Process Design and Economics for Biochemical Conversion of Lignocellulosic Biomass to Ethanol: Dilute-Acid Pretreatment and Enzymatic Hydrolysis of Corn Stover,”. NREL/TP-5100-47764 (Golden, CO: National Renewable Energy Laboratory).
Jones, S., Meyer, P., Snowden-Swan, L., Padmaperuma, A., Tan, E., Dutta, A., et al. (2013). “Process Design and Economics for the Conversion of Lignocellulosic Biomass to Hydrocarbon Fuels: Fast Pyrolysis and Hydrotreating Bio-Oil Pathway,”. PNNL-23053, NREL/TP-5100-61178 (Golden, CO: Pacific Northwest National Laboratory, Richland, WA and National Renewable Energy Laboratory).
Keyrilainen, J., and Koskinen, M. (2011). Renewable Fuels and Biofuels in Petroleum Refinery. Available at: https://www.digitalrefining.com/article/1000424/renewable-fuels-and-biofuels-in-a-petroleum-refinery#.YUIwFJ1KhPY.
Klein-Marcuschamer, D., Turner, C., Allen, M., Gray, P., Dietzgen, R. G., Gresshoff, P. M., et al. (2013). Technoeconomic Analysis of Renewable Aviation Fuel from microalgae,Pongamia Pinnata, and Sugarcane. Biofuels, Bioprod. Bioref. 7 (4), 416–428. doi:10.1002/bbb.1404
Kwiatkowski, J. R., McAloon, A. J., Taylor, F., and Johnston, D. B. (2006). Modeling the Process and Costs of Fuel Ethanol Production by the Corn Dry-Grind Process. Ind. Crops Prod. 23 (3), 288–296. doi:10.1016/j.indcrop.2005.08.004
Lane, J. (2019). The Paramount Deal: World Energy Takes off with Audacious $72M Acquisition of Alt Air and the Paramount Oil Refinery November 12. Available at: http://www.biofuelsdigest.com/.
Lappas, A. A., Bezergianni, S., and Vasalos, I. A. (2009). Production of Biofuels via Co-processing in Conventional Refining Processes. Catal. Today 145 (1-2), 55–62. doi:10.1016/j.cattod.2008.07.001
Martinkus, N., and Wolcott, M. (2017). A Framework for Quantitatively Assessing the Repurpose Potential of Existing Industrial Facilities as a Biorefinery. Biofuels, Bioprod. Bioref. 11 (2), 295–306. doi:10.1002/bbb.1742
Mawhood, R., Gazis, E., de Jong, S., Hoefnagels, R., and Slade, R. (2016). Production Pathways for Renewable Jet Fuel: a Review of Commercialization Status and Future Prospects. Biofuels, Bioprod. Bioref. 10 (4), 462–484. doi:10.1002/bbb.1644
National Corn Growers Association (2016). World of Corn. Available at: https://www.ncga.com/file/1325/WOC-2016.pdf.
Olcay, H., Subrahmanyam, A. V., Xing, R., Lajoie, J., Dumesic, J. A., and Huber, G. W. (2013). Production of Renewable Petroleum Refinery Diesel and Jet Fuel Feedstocks from Hemicellulose Sugar Streams. Energy Environ. Sci. 6 (1), 205–216. doi:10.1039/c2ee23316a
Pearlson, M., Wollersheim, C., and Hileman, J. (2013). A Techno-Economic Review of Hydroprocessed Renewable Esters and Fatty Acids for Jet Fuel Production. Biofuels, Bioprod. Bioref. 7 (1), 89–96. doi:10.1002/bbb.1378
Peters, M. S., Timmerhaus, K. D., and West, R. E. (2004). Plant Design and Economics for Chemical Engineers. 5th ed. 1221 Avenue of the Americas, New York, NY 10020: McGraw-Hill.
Pinheiro Pires, A. P., Arauzo, J., Fonts, I., Domine, M. E., Fernández Arroyo, A., Garcia-Perez, M. E., et al. (2019). Challenges and Opportunities for Bio-Oil Refining: A Review. Energy Fuels 33 (6), 4683–4720. doi:10.1021/acs.energyfuels.9b00039
Pinho, A. d. R., de Almeida, M. B. B., Mendes, F. L., Casavechia, L. C., Talmadge, M. S., Kinchin, C. M., et al. (2017). Fast Pyrolysis Oil from Pinewood Chips Co-processing with Vacuum Gas Oil in an FCC Unit for Second Generation Fuel Production. Fuel 188, 462–473. doi:10.1016/j.fuel.2016.10.032
Pinho, A. d. R., de Almeida, M. B. B., Mendes, F. L., Ximenes, V. L., and Casavechia, L. C. (2015). Co-processing Raw Bio-Oil and Gasoil in an FCC Unit. Fuel Process. Tech. 131, 159–166. doi:10.1016/j.fuproc.2014.11.008
Pourhashem, G., Adler, P. R., McAloon, A. J., and Spatari, S. (2013). Cost and Greenhouse Gas Emission Tradeoffs of Alternative Uses of Lignin for Second Generation Ethanol. Environ. Res. Lett. 8 (2). doi:10.1088/1748-9326/8/2/025021
Quinn, J. C., and Davis, R. (2015). The Potentials and Challenges of Algae Based Biofuels: A Review of the Techno-Economic, Life Cycle, and Resource Assessment Modeling. Bioresour. Tech. 184, 444–452. doi:10.1016/j.biortech.2014.10.075
Sági, D., Baladincz, P., Varga, Z., and Hancsók, J. (2016). Co-processing of FCC Light Cycle Oil and Waste Animal Fats with Straight Run Gas Oil Fraction. J. Clean. Prod. 111, 34–41. doi:10.1016/j.jclepro.2015.06.059
Sanicola, Laura. (2021). Exxon, Chevron Look to Make Renewable Fuels without Costly Refinery Upgrades. Available at: https://www.reuters.com/world/middle-east/exclusive-exxon-chevron-look-make-renewable-fuels-without-costly-refinery-2021-08-12/.
Starck, L., Pidol, L., Jeuland, N., Chapus, T., Bogers, P., and Bauldreay, J. (2016). Production of Hydroprocessed Esters and Fatty Acids (HEFA) - Optimisation of Process Yield. Oil Gas Sci. Technology-Revue D Ifp Energies Nouvelles. 71 (1). doi:10.2516/ogst/2014007
Stefanidis, S. D., Kalogiannis, K. G., and Lappas, A. A. (2018). Co-processing Bio-Oil in the Refinery for Drop-In Biofuels via Fluid Catalytic Cracking. Wiley Interdiscip. Reviews-Energy Environ. 7 (3), e281. doi:10.1002/wene.281
Sun, P., Elgowainy, A., Wang, M., Han, J., and Henderson, R. J. (2018). Estimation of U.S. Refinery Water Consumption and Allocation to Refinery Products. Fuel 221, 542–557. doi:10.1016/j.fuel.2017.07.089
Swanson, R. M., Satrio, J. A., Brown, R. C., Platon, A., and Hsu, D. D. (2010). “Techno-Economic Analysis of Biofuels Production Based on Gasification,”. NREL/TP-6A20-46587 (Golden, CO: National Renewable Energy Laboratory).
Tanzil, A., Brandt, K., Zhang, X., Wolcott, M., and Garcia-Perez, M. (2021). Evaluation of Bio-Refinery Alternatives to Produce Sustainable Aviation Fuels in Sugarcane Mill. Submitted to Fuel
Tanzil, A. H., Brandt, K., Zhang, X., Stockle, C., Wolcott, M., Murthy, G., et al. (2019). Evaluation of Dry Grind Corn Ethanol Bio-Refinery Concepts for the Production of Alternative Jet Fuels. Submitted to Biomass and Bioenergy.
Tanzil, A. H., Brandt, K., Wolcott, M., Zhang, X., and Garcia-Perez, M. (2021). Strategic Assessment of Sustainable Aviation Fuel Production Technologies: Yield Improvement and Cost Reduction Opportunities. Biomass and Bioenergy 145, 105942. doi:10.1016/j.biombioe.2020.105942
Tanzil, A. H., Zhang, X., Wolcott, M., Brandt, K., Stöckle, C., Murthy, G., et al. (2021). Evaluation of Dry Corn Ethanol Bio-Refinery Concepts for the Production of Sustainable Aviation Fuel. Biomass and Bioenergy 146, 105937. doi:10.1016/j.biombioe.2020.105937
Thompson, J. L., and Tyner, W. E. (2014). Corn stover for Bioenergy Production: Cost Estimates and Farmer Supply Response. Biomass and Bioenergy 62, 166–173. doi:10.1016/j.biombioe.2013.12.020
US Department of Energy (2011). “U.S. Billion-Ton Update: Biomass Supply for a Bioenergy and Bioproducts Industry. R.D. Perlack and B.J. Stokes (Leads),”. ORNL/TM-2011/224 (Oak Ridge, TN: Oak Ridge National Laboratory), 227. Available at: http://www1.eere.energy.gov/bioenergy/pdfs/billion_ton_update.pdf.
US EIA (2020a). Petroleum & Other Liquids: US Kerosene-type Jet Fuel Wholesale/Resale Price by Refiners. Available at: https://www.eia.gov/dnav/pet/hist/LeafHandler.ashx?n=pet&s=ema_epjk_pwg_nus_dpg&f=a.
US EIA (2020b). Wholesale Electricity and Natural Gas Market Data. Available at: https://www.eia.gov/electricity/wholesale/.
US Energy Information Administration (2021). Monthly Energy Review. Available at: https://www.eia.gov/totalenergy/data/monthly/pdf/mer.pdf.
US Energy Information Administration (2016). Today in Energy: Much of the Country's Refineries Are Concentrated along the Gulf Coast. Available at: https://www.eia.gov/todayinenergy/detail.php?id=7170.
van Dyk, S., Su, J., McMillan, J. D., and Saddler, J. (2019). Potential Synergies of Drop‐in Biofuel Production with Further Co‐processing at Oil Refineries. Biofuels, Bioprod. Bioref. 13 (3), 760–775. doi:10.1002/bbb.1974
Wallace, R., Ibsen, K., McAloon, A., and Yee, W. (2005). Co-located Corn Stover to Ethanol with Corn Dry Mill; Excel Spreadsheet. Springfield, VA: National Renewable Energy Laboratory. Available at: https://www.nrel.gov/extranet/biorefinery/aspen-models/.
West, R. M., Liu, Z. Y., Peter, M., Gartner, C. A., and Dumesic, J. A. (2008). Carbon-carbon Bond Formation for Biomass-Derived Furfurals and Ketones by Aldol Condensation in a Biphasic System. J. Mol. Catal. a-Chemical 296 (1-2), 18–27. doi:10.1016/j.molcata.2008.09.001
Wu, L., Wang, Y. Q., Zheng, L., Wang, P. Y., and Han, X. L. (2019). Techno-economic Analysis of Bio-Oil Co-processing with Vacuum Gas Oil to Transportation Fuels in an Existing Fluid Catalytic Cracker. Energ. Convers. Manag. 197, 111901. doi:10.1016/j.enconman.2019.111901
Keywords: sustainable aviation fuel, MFSP, co-location, repurposing, co-processing, sustainable aviation fuel (SAF), GHG (green house gas) emission, co-processing
Citation: Tanzil AH, Brandt K, Zhang X, Wolcott M, Stockle C and Garcia-Perez M (2021) Production of Sustainable Aviation Fuels in Petroleum Refineries: Evaluation of New Bio-Refinery Concepts. Front. Energy Res. 9:735661. doi: 10.3389/fenrg.2021.735661
Received: 03 July 2021; Accepted: 30 September 2021;
Published: 20 October 2021.
Edited by:
Peer Schenk, The University of Queensland, AustraliaReviewed by:
Bheru Lal Salvi, Maharana Pratap University of Agriculture and Technology, IndiaHalil Durak, Yüzüncü Yıl University, Turkey
Copyright © 2021 Tanzil, Brandt, Zhang, Wolcott, Stockle and Garcia-Perez. This is an open-access article distributed under the terms of the Creative Commons Attribution License (CC BY). The use, distribution or reproduction in other forums is permitted, provided the original author(s) and the copyright owner(s) are credited and that the original publication in this journal is cited, in accordance with accepted academic practice. No use, distribution or reproduction is permitted which does not comply with these terms.
*Correspondence: Manuel Garcia-Perez, mgarcia-perez@wsu.edu